
I Choose You: Selecting Accurate Reference Genes for qPCR Expression Analysis in Reproductive Tissues in Arabidopsis thaliana

Abstract
:1. Introduction
2. Materials and Methods
2.1. Plant Material and Growth Conditions
2.2. Selection of Candidate Reference Genes and Primer Design
2.3. Sample Collection, RNA Isolation and cDNA Synthesis
2.4. qPCR Analysis
2.5. Expression Stability Analysis of Candidate Reference Genes
2.6. Validation of Reference Genes by Expression Analysis of AGP Genes
3. Results
3.1. Selection of Reference Genes
3.2. PCR Amplification Efficiency and Specificity
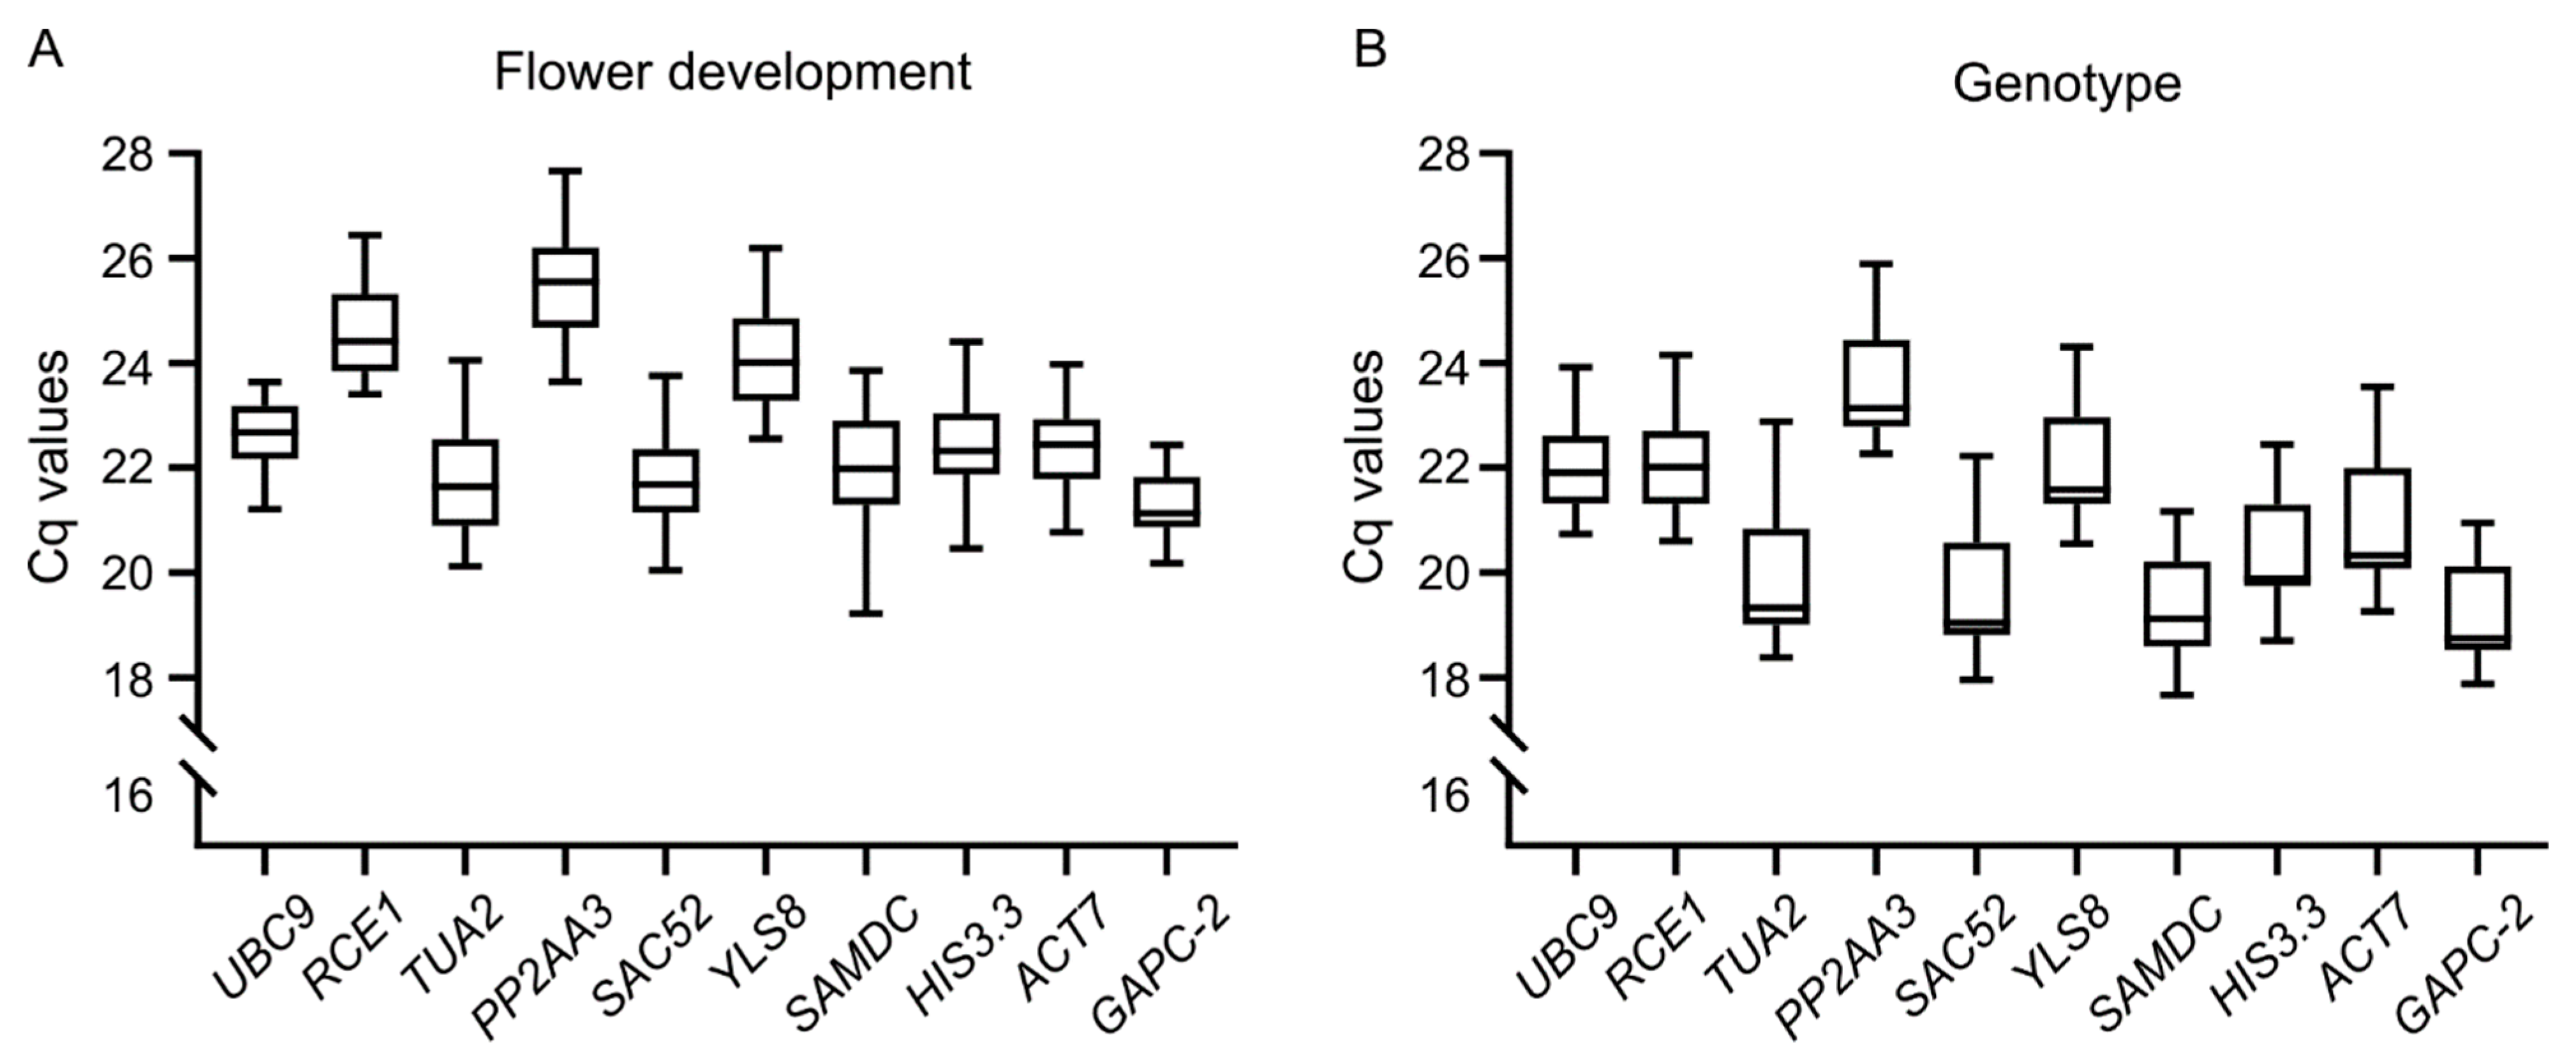
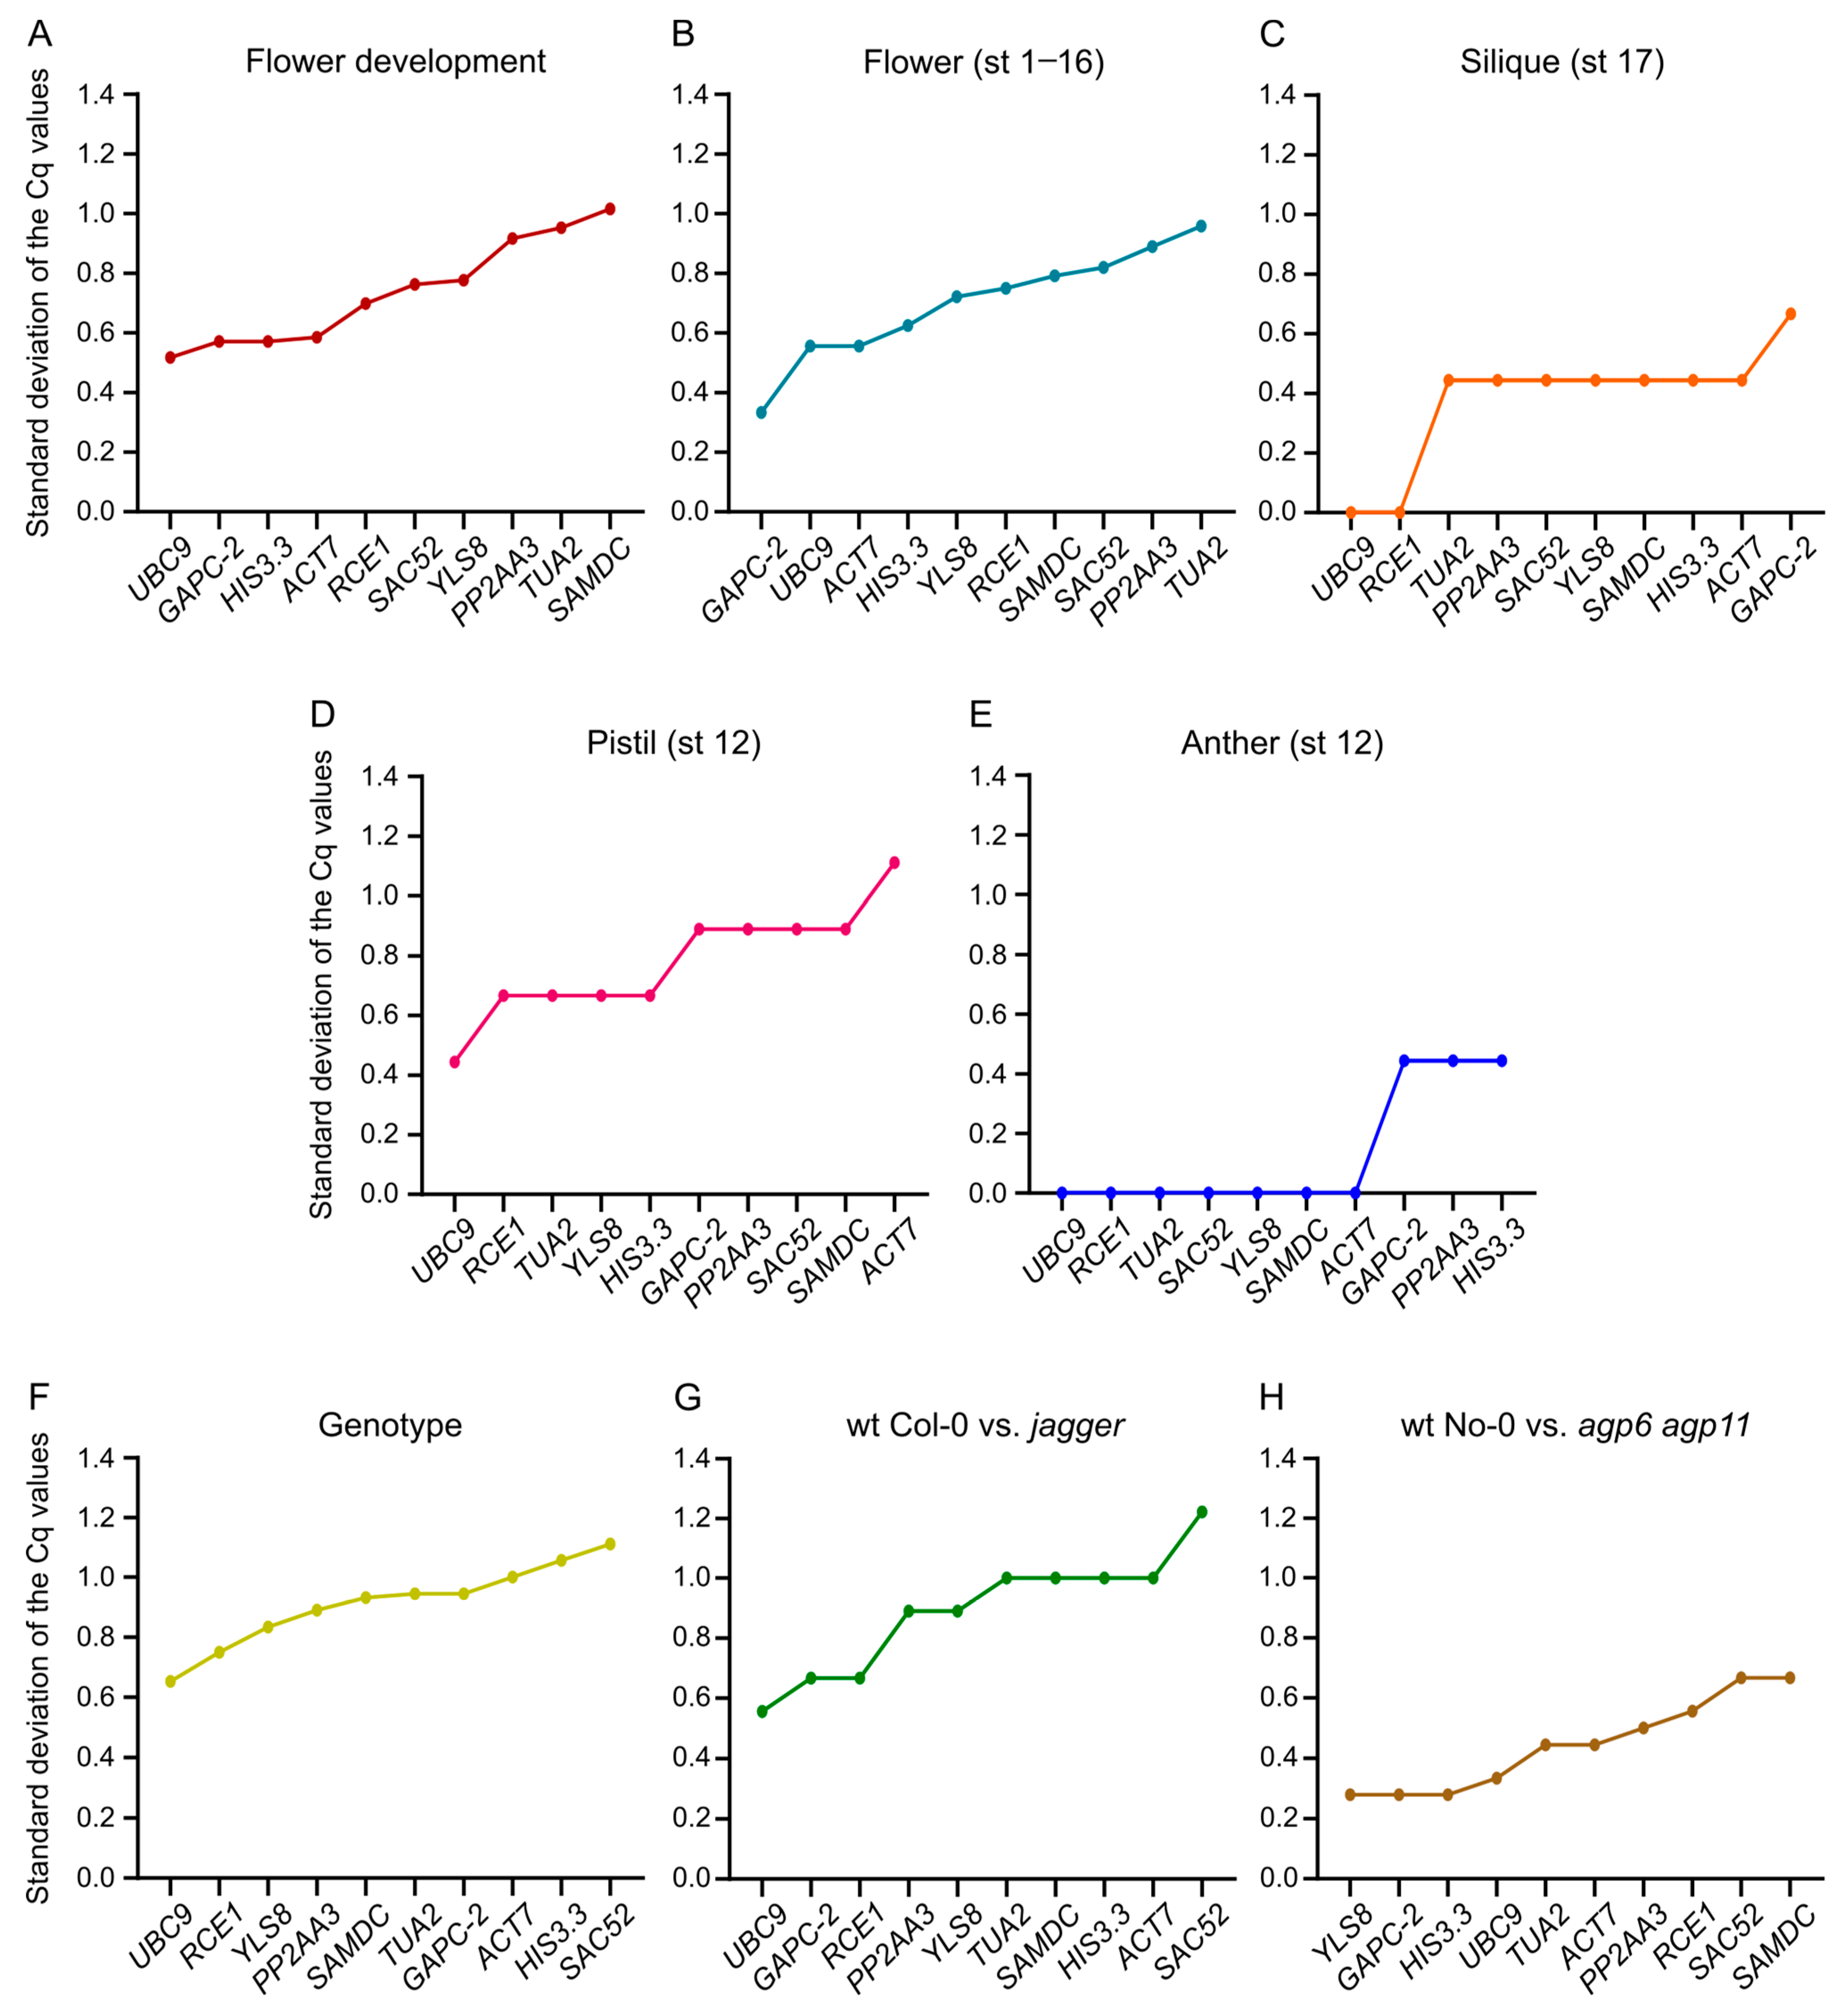
3.3. Cq Value Distribution of the Candidate Reference Genes
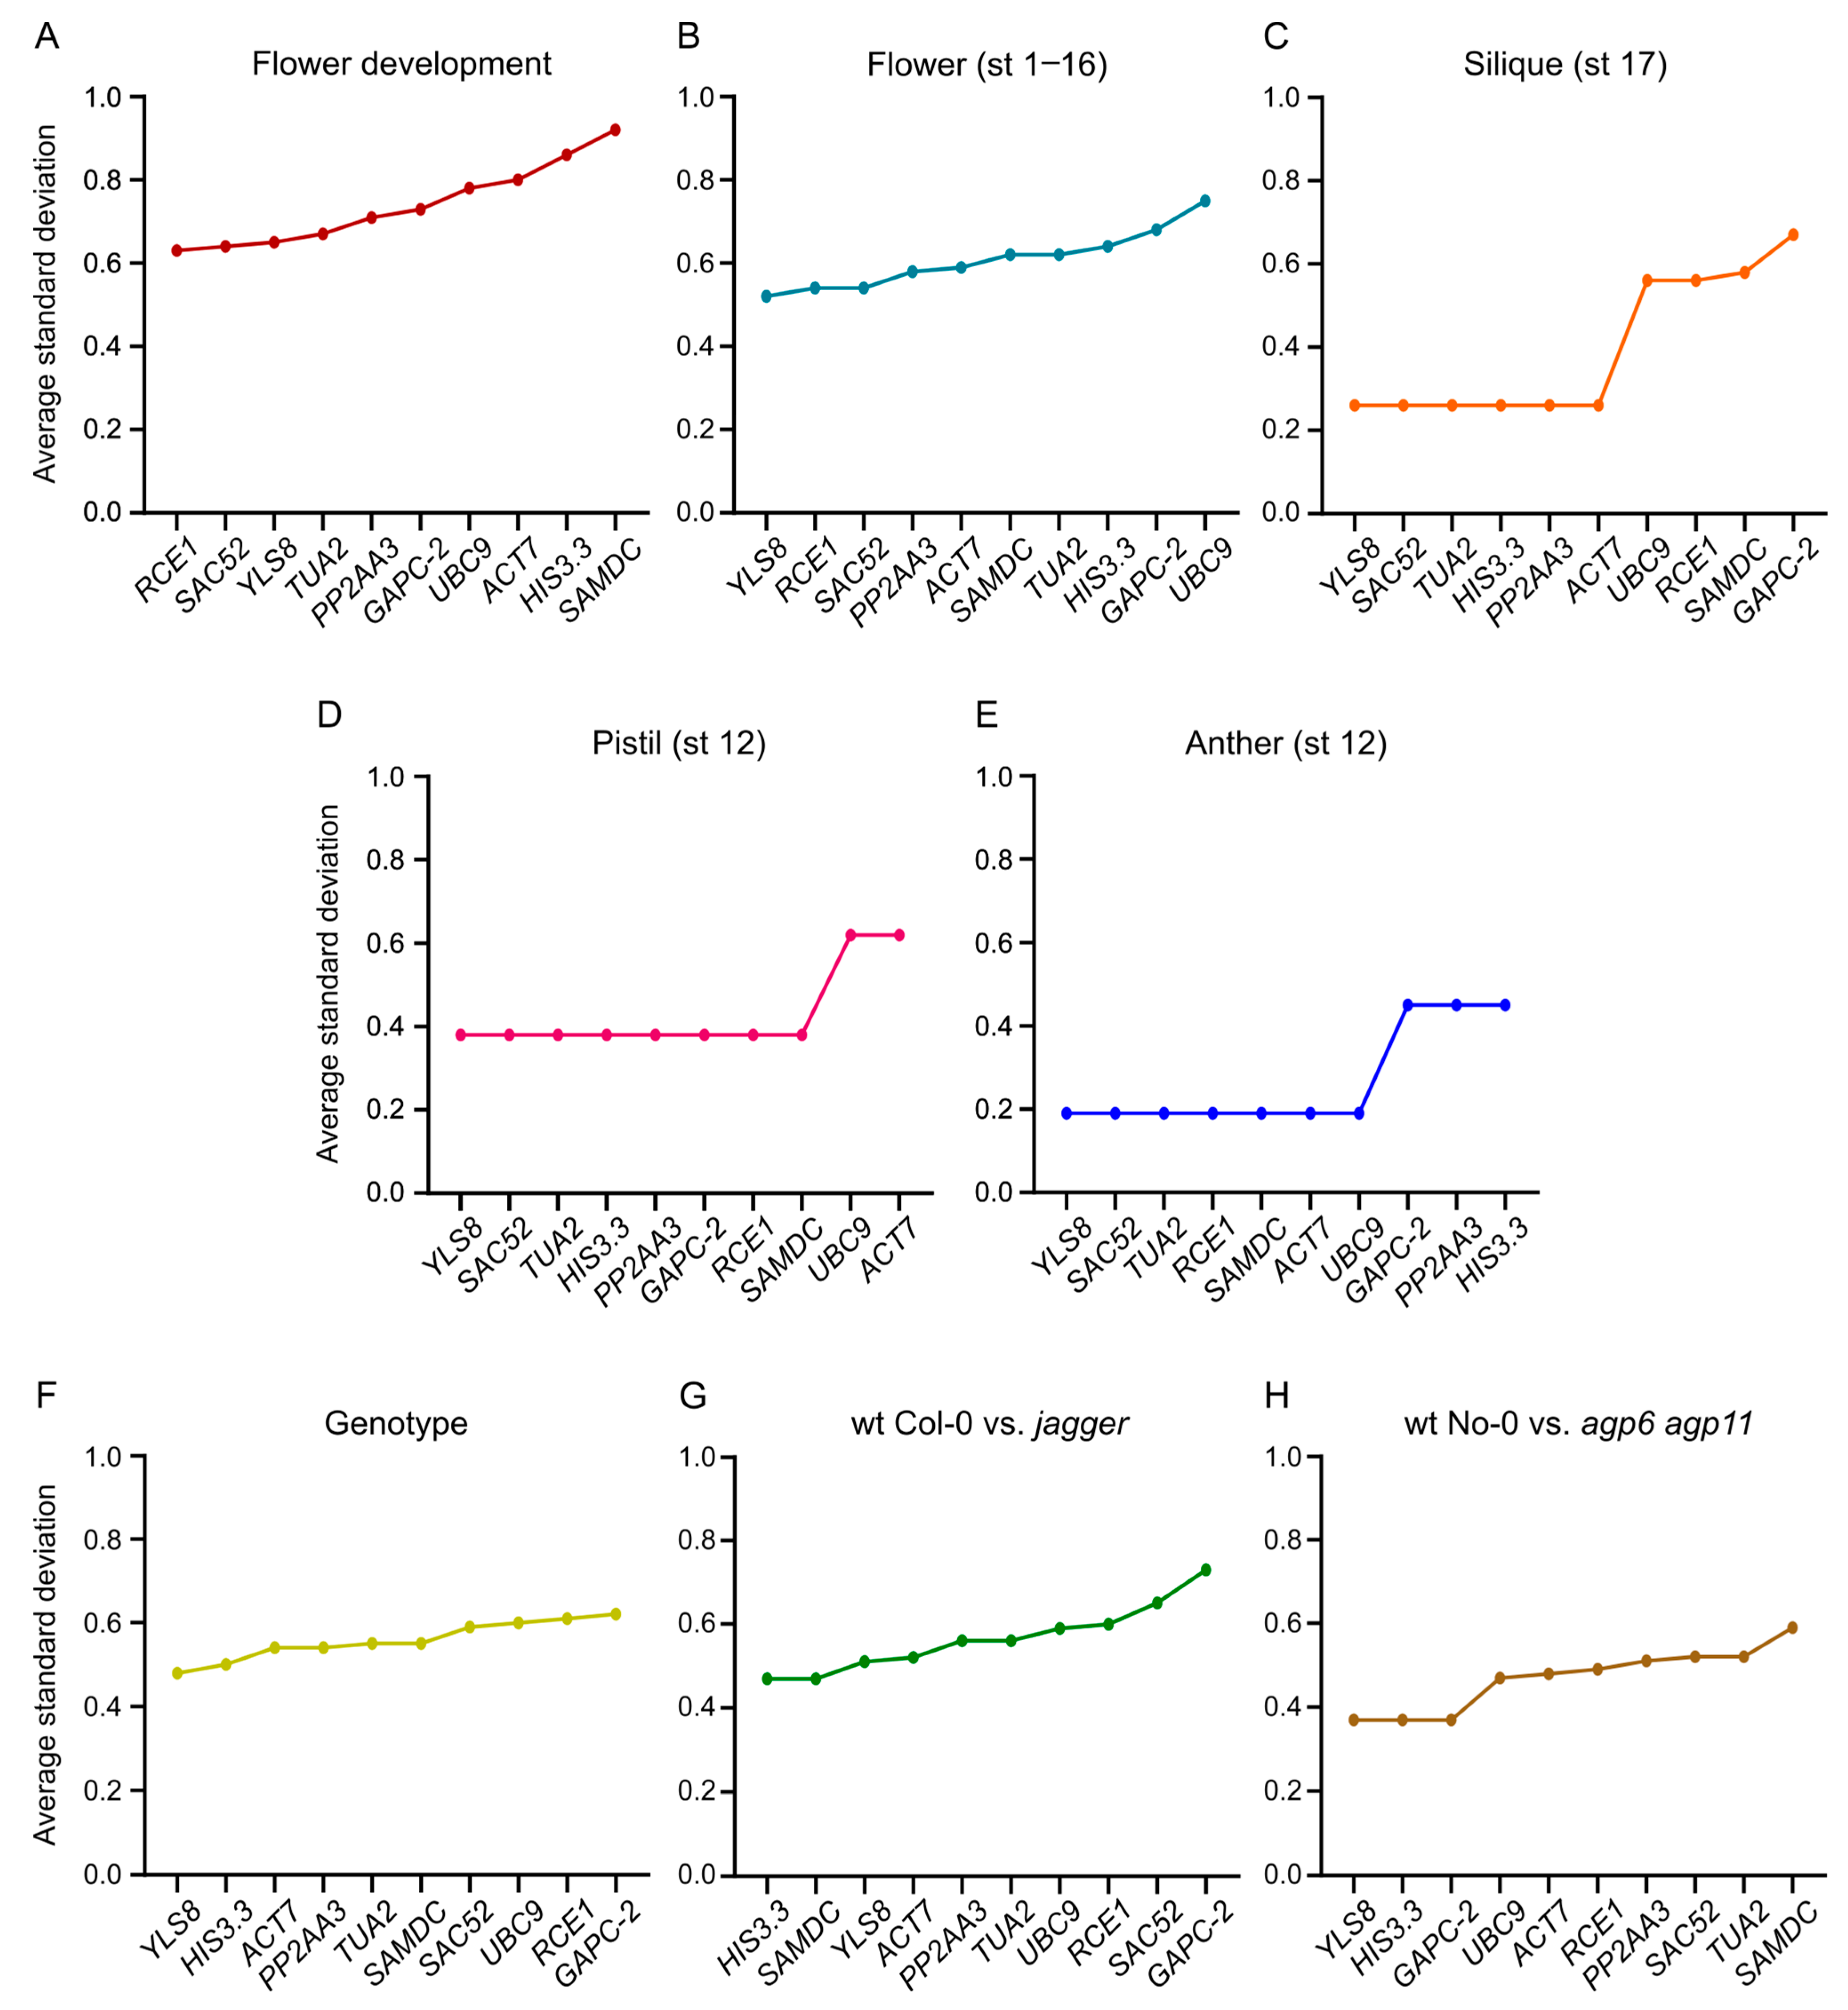
3.4. Expression Stability Ranking of the Candidate Reference Genes
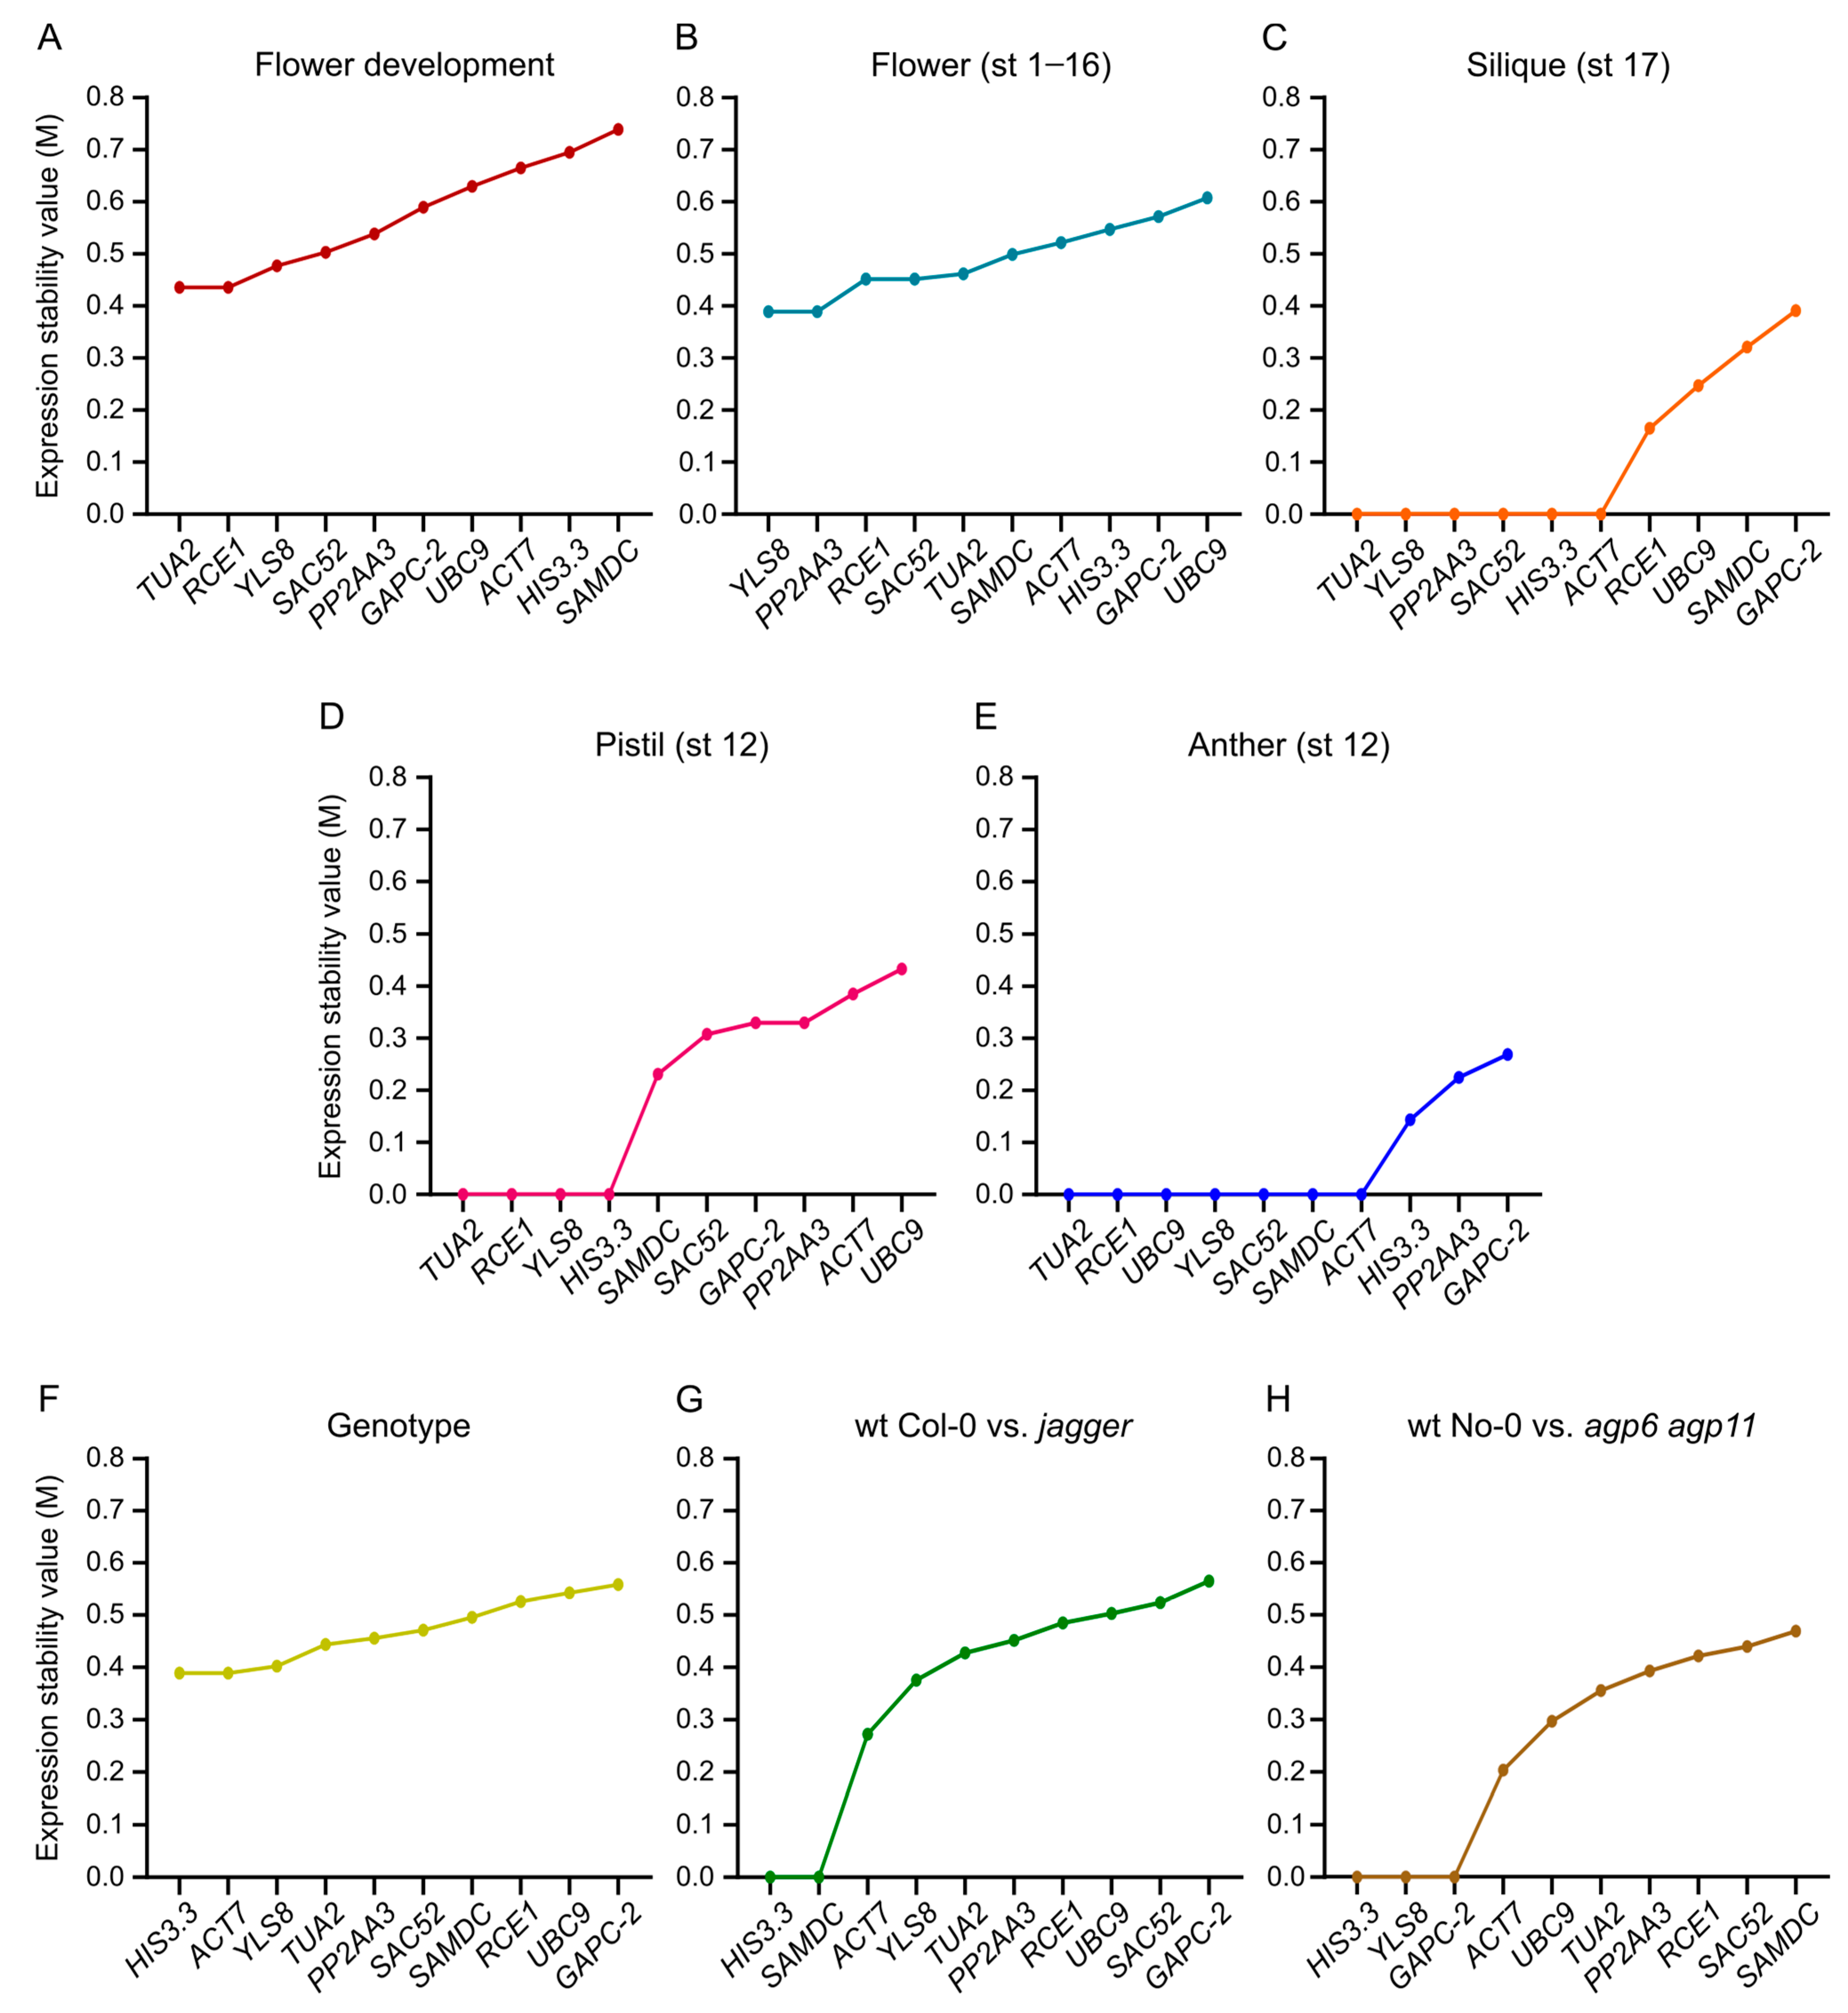
3.5. NormFinder
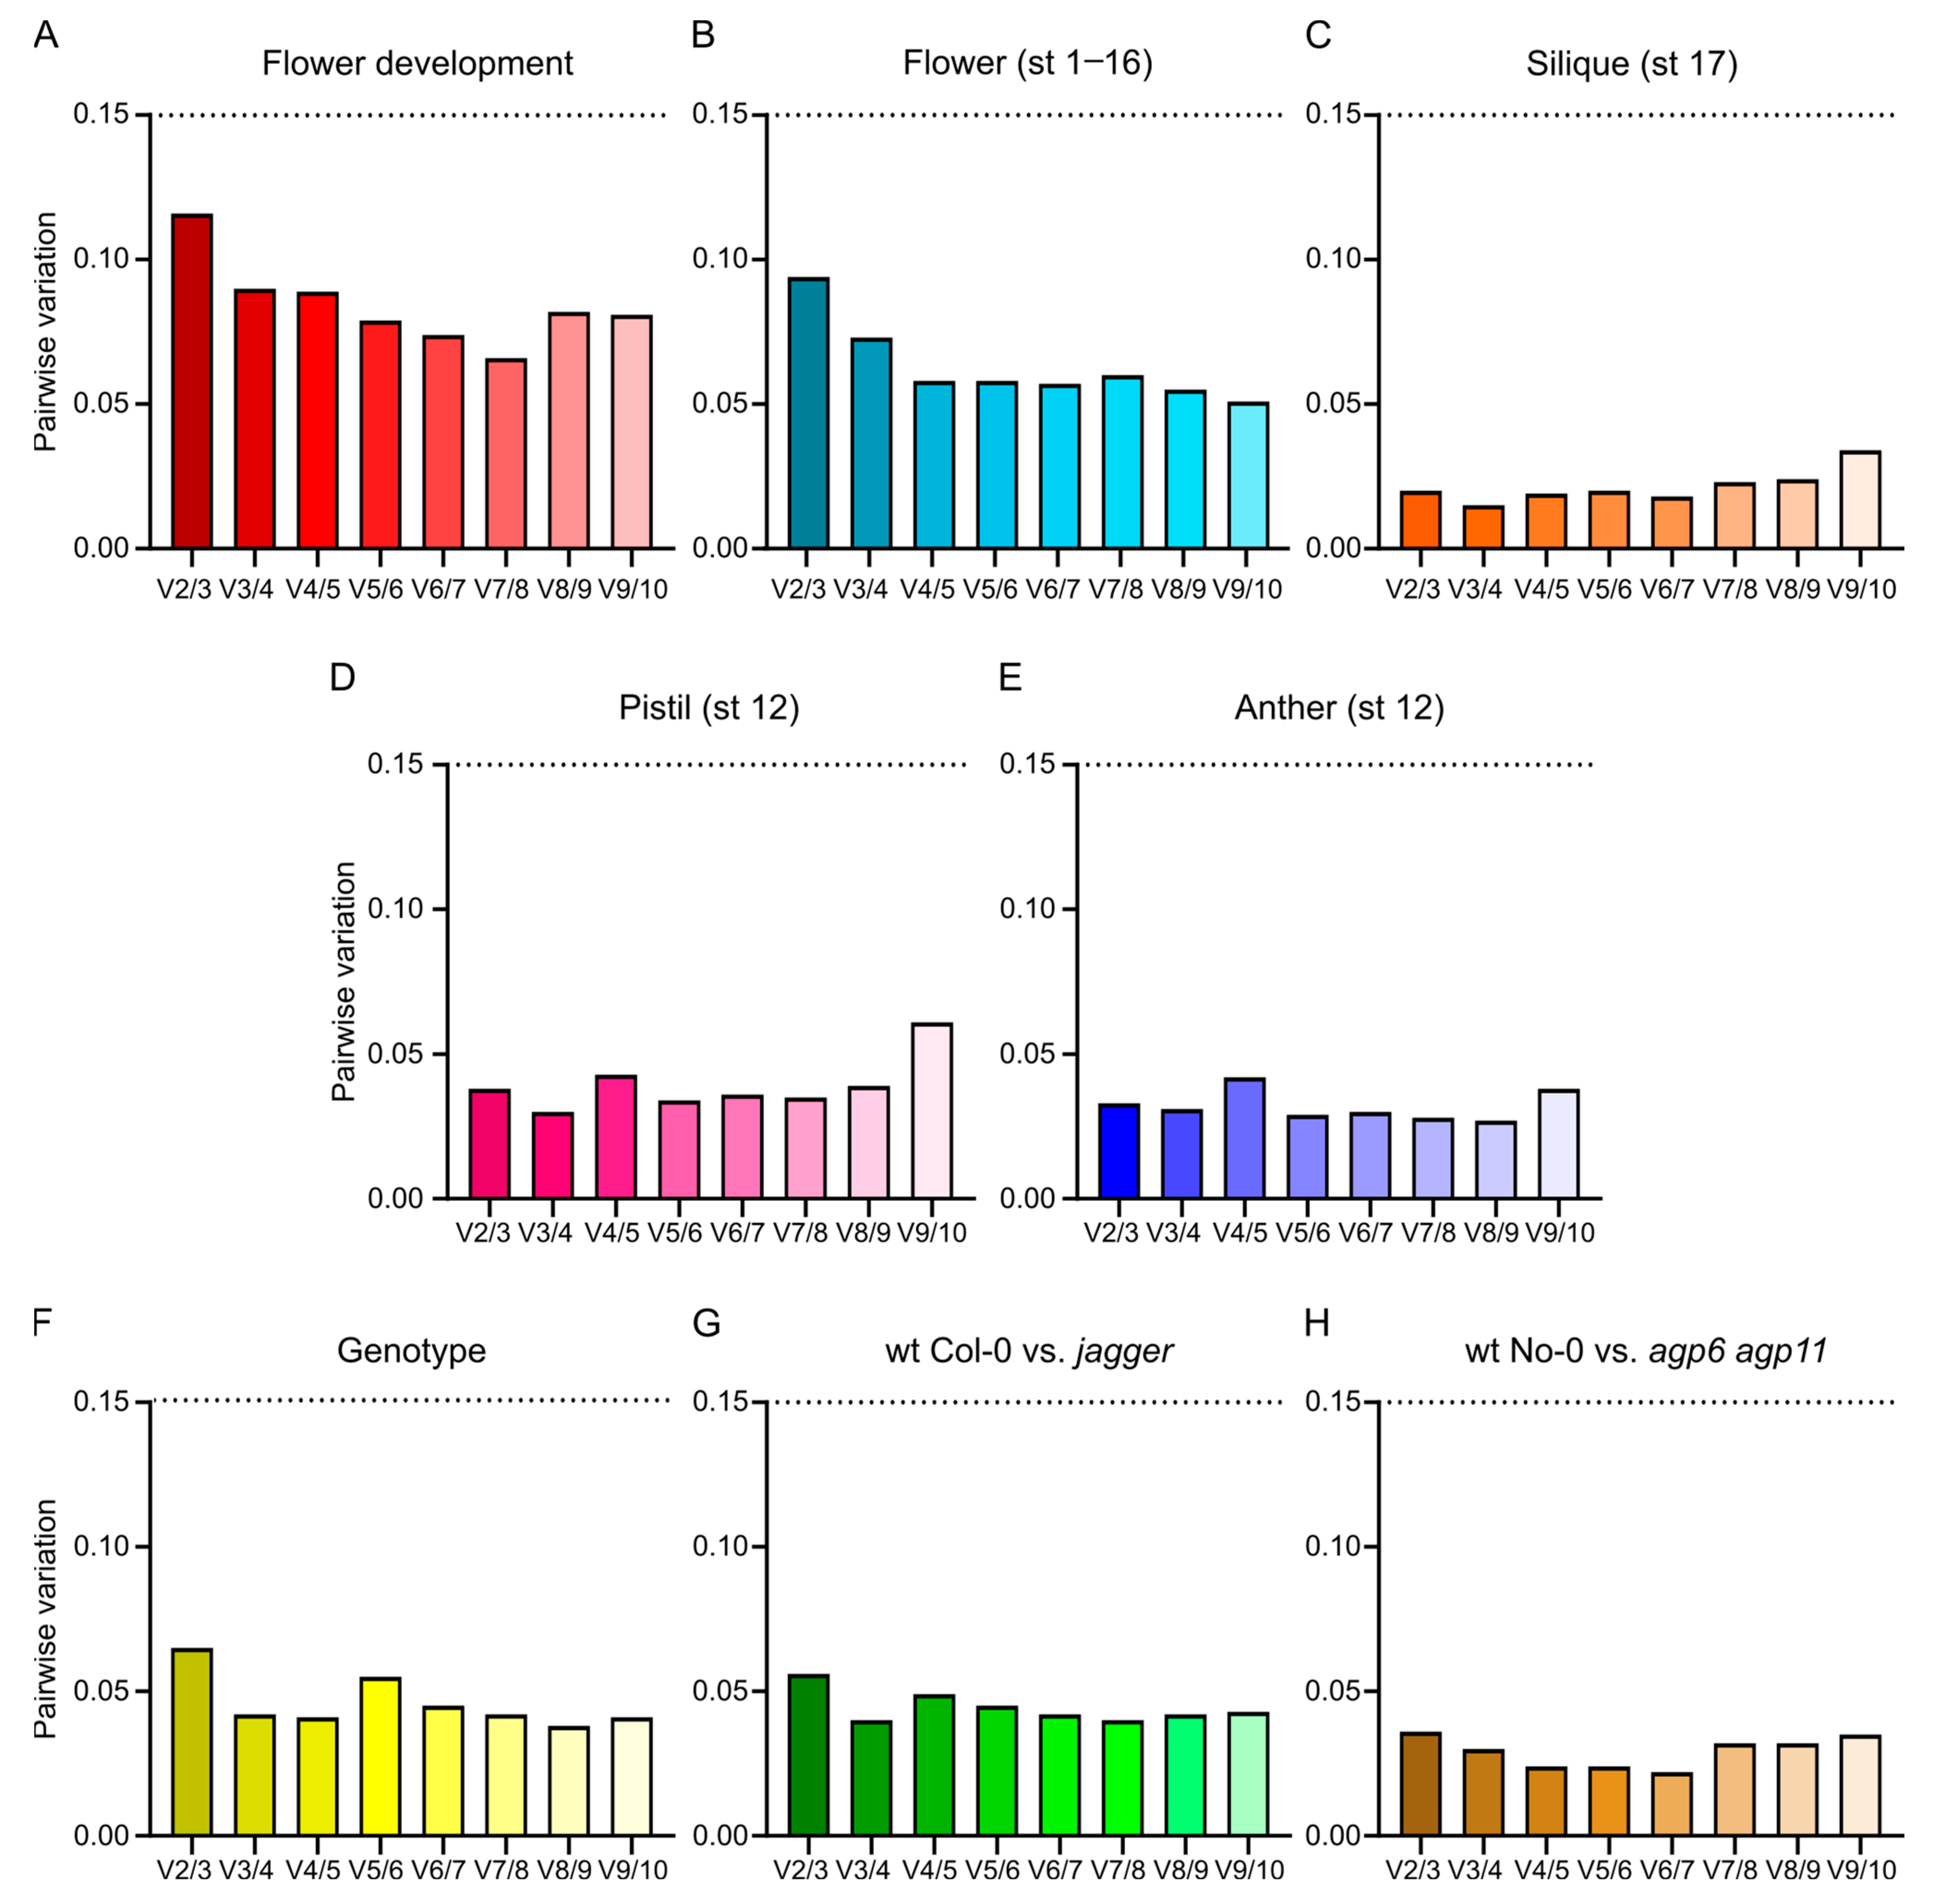
3.6. BestKeeper
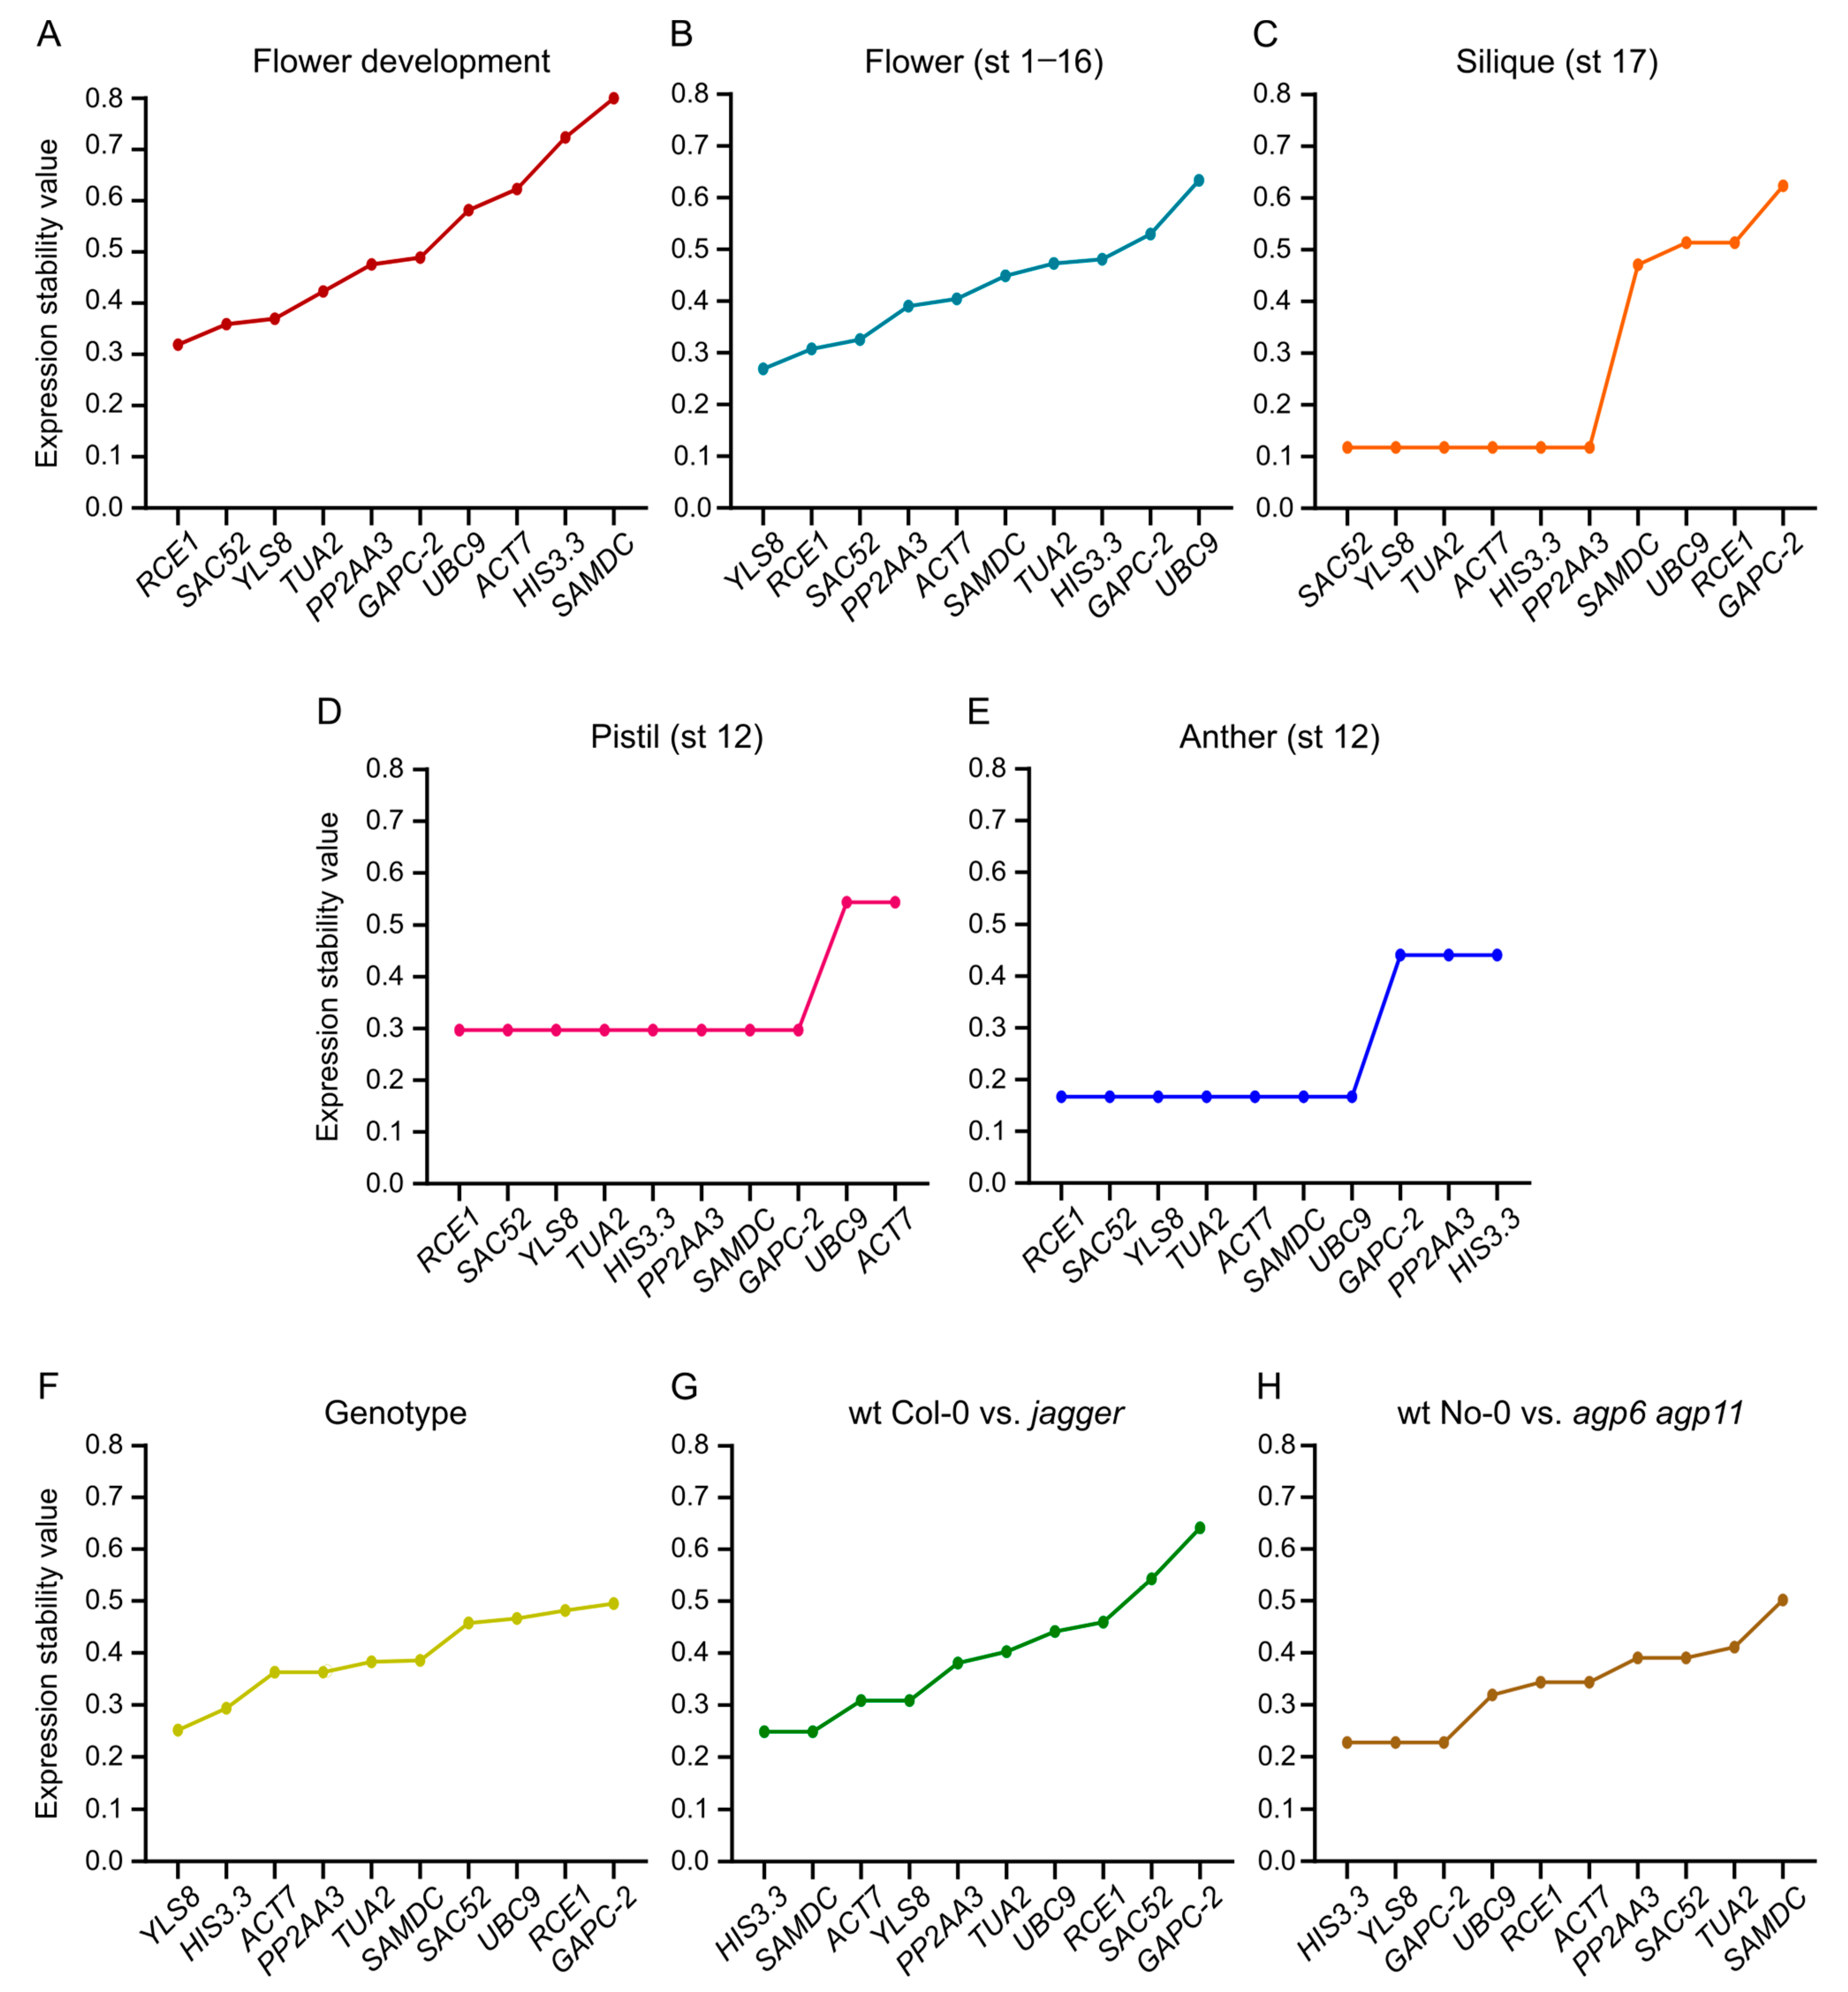
3.7. ΔCt Method
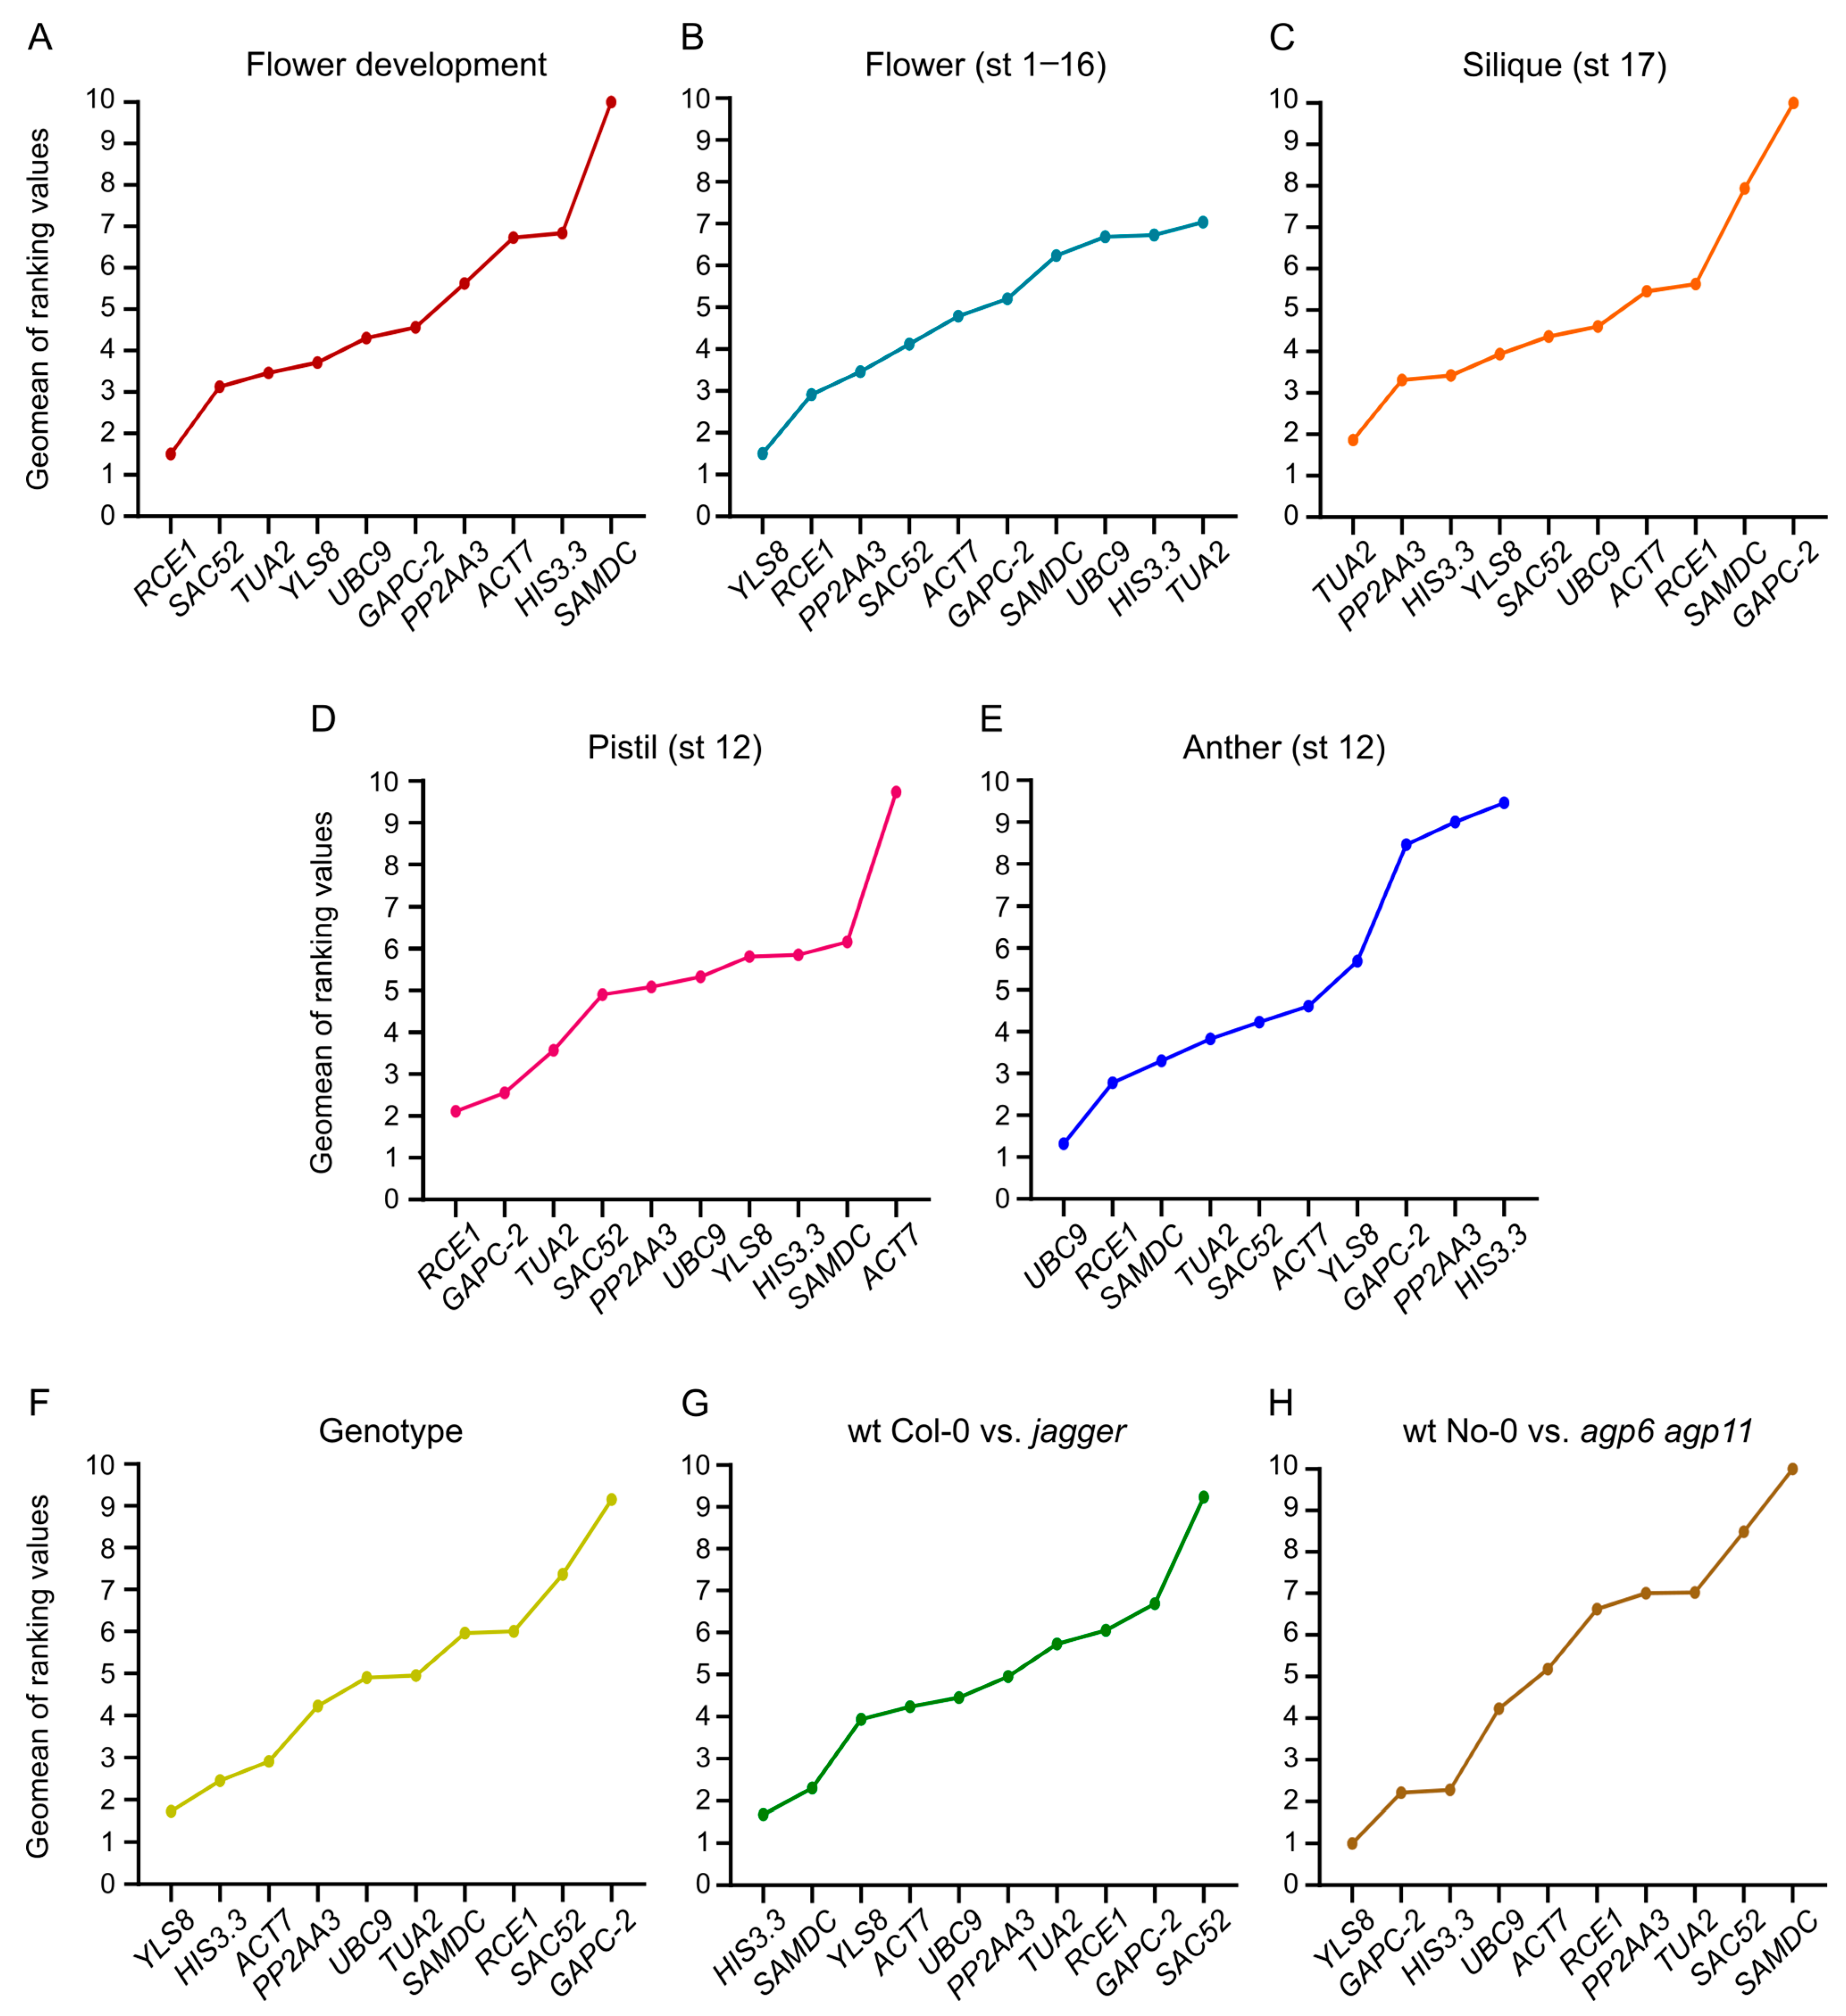
3.8. Comprehensive Ranking of the Candidate Reference Genes
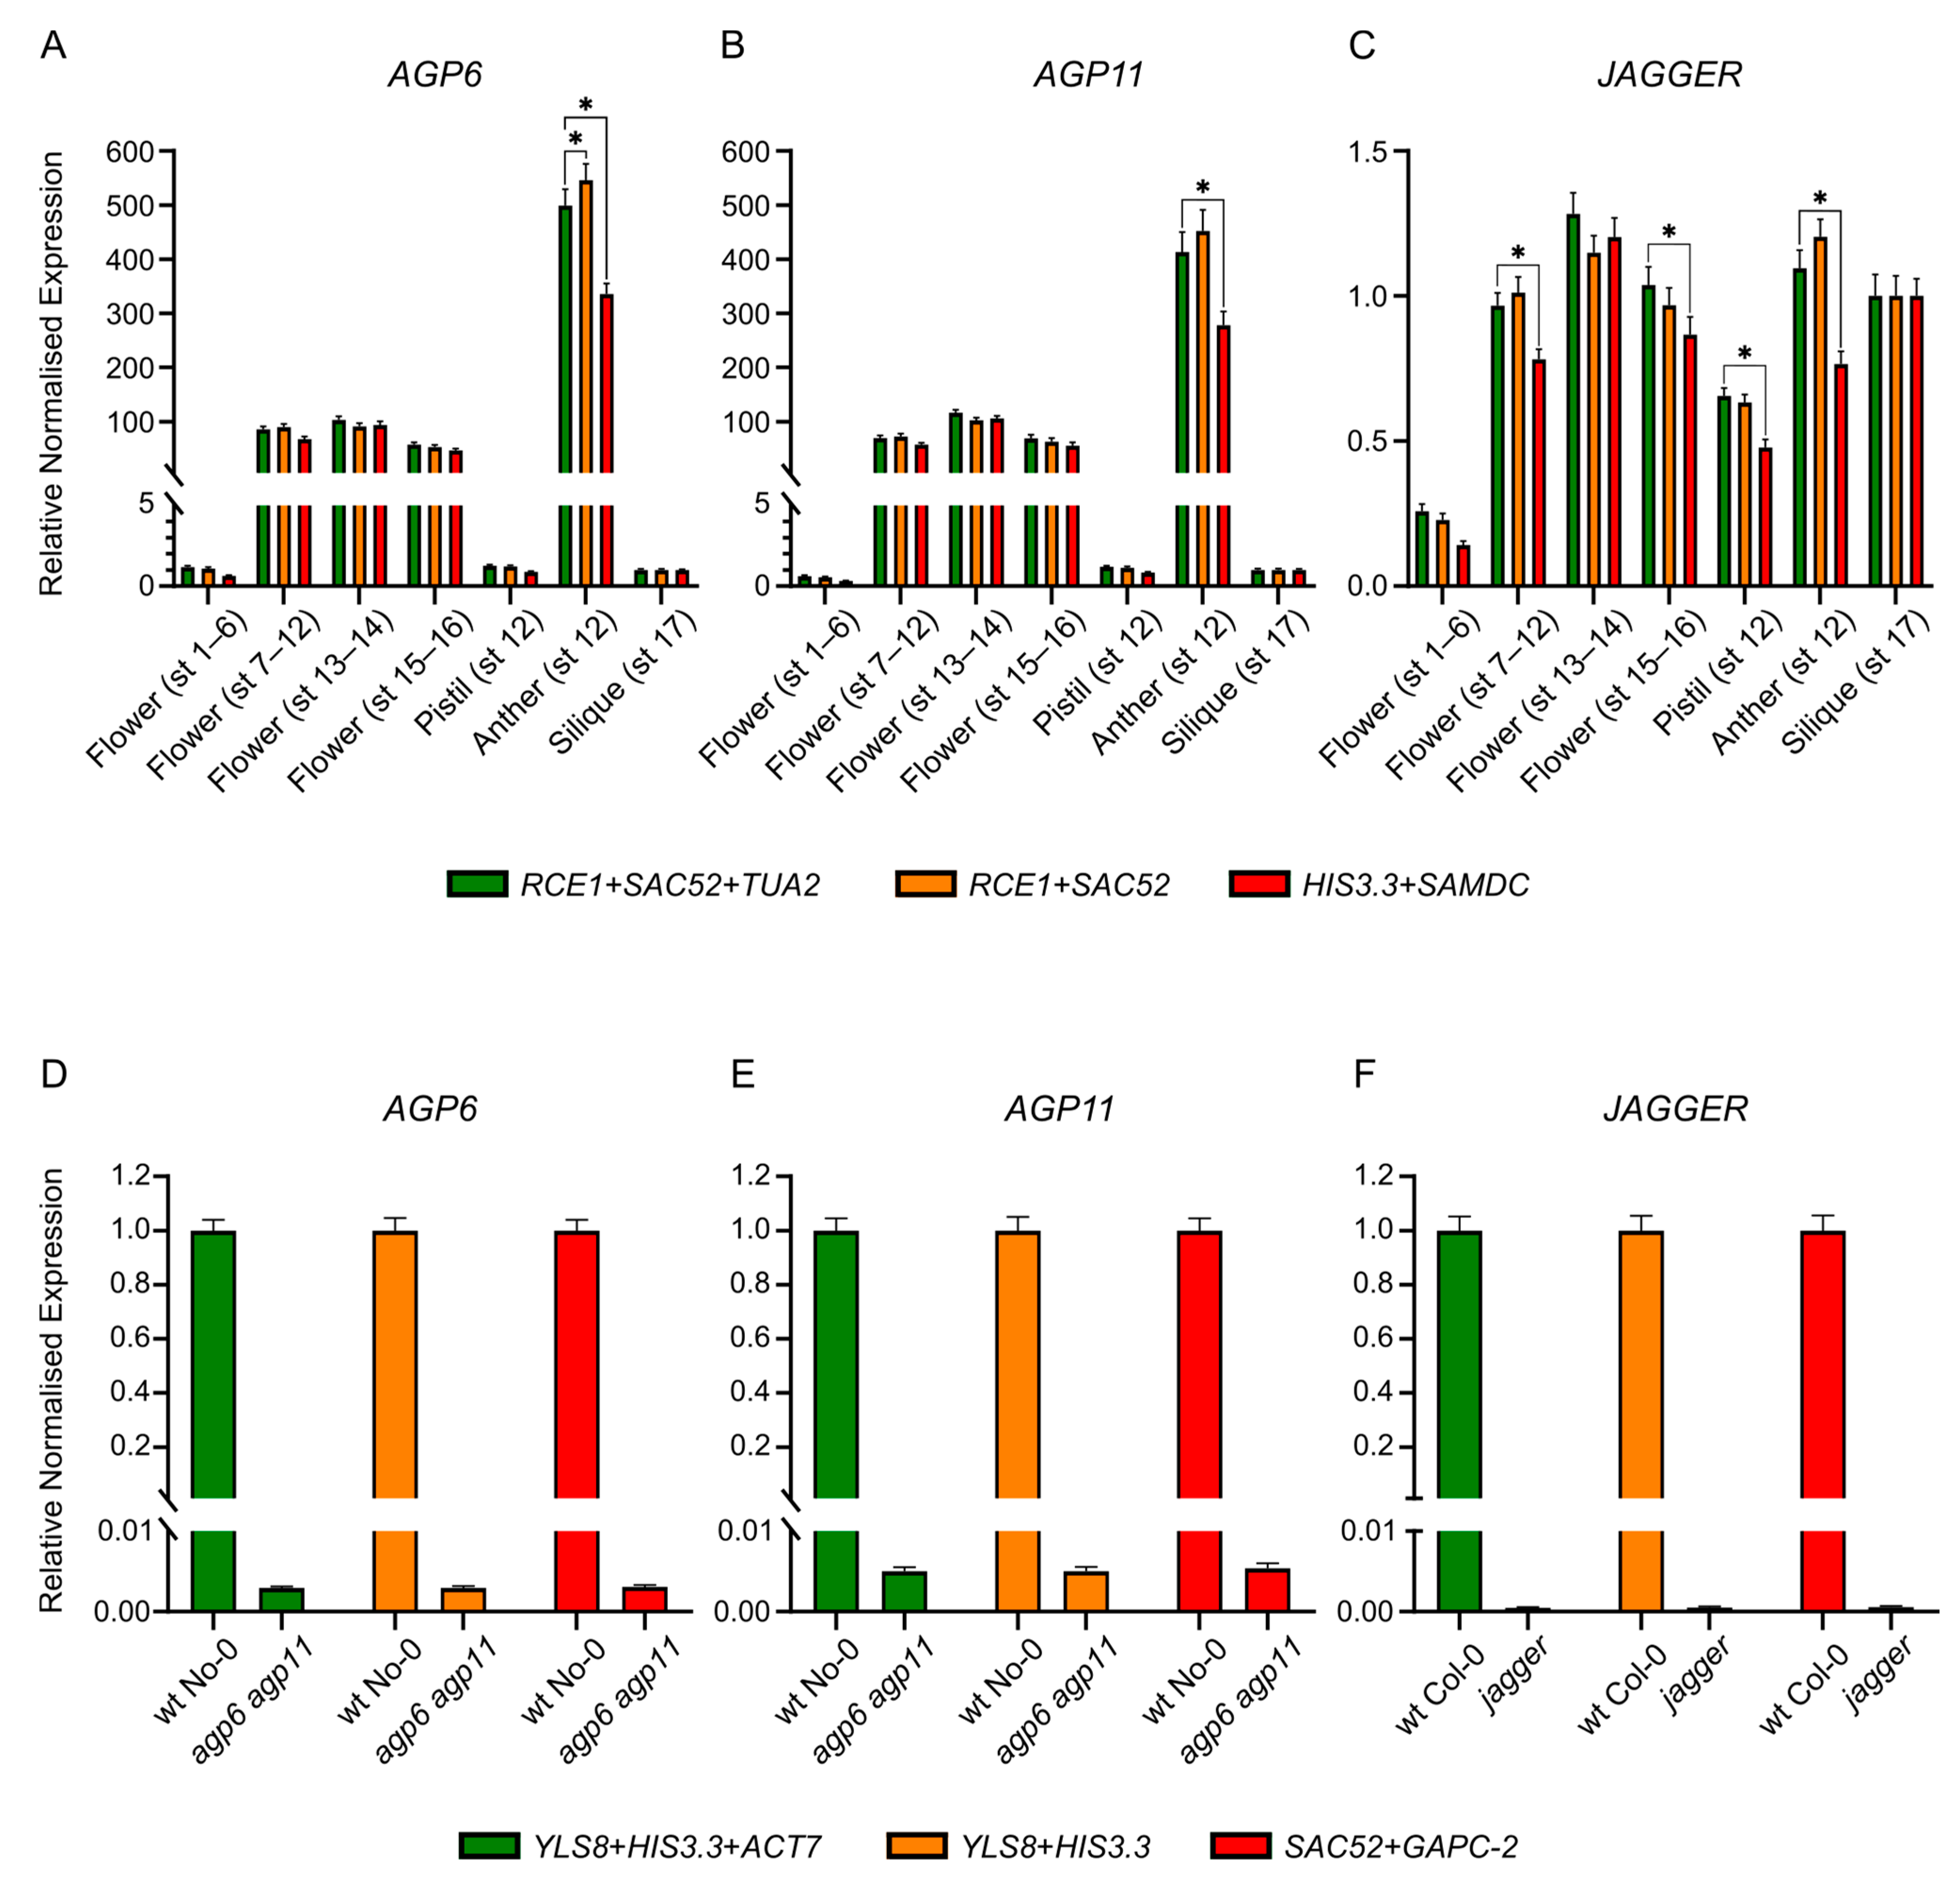
3.9. Validation of the Selected Reference Genes
4. Discussion
5. Conclusions
Supplementary Materials
Author Contributions
Funding
Institutional Review Board Statement
Informed Consent Statement
Data Availability Statement
Conflicts of Interest
References
- Lora, J.; Herrero, M.; Tucker, M.R.; Hormaza, J.I. The Transition from Somatic to Germline Identity Shows Conserved and Specialized Features during Angiosperm Evolution. New Phytol. 2017, 216, 495–509. [Google Scholar] [CrossRef] [Green Version]
- Ma, H.; Sundaresan, V. Development of Flowering Plant Gametophytes. In Current Topics in Developmental Biology; Academic Press Inc.: Cambridge, MA, USA, 2010; Volume 91, pp. 379–412. [Google Scholar]
- Yadegari, R.; Drews, G.N. Female Gametophyte Development. Plant Cell 2004, 16, S133–S141. [Google Scholar] [CrossRef]
- Hafidh, S.; Honys, D. Reproduction Multitasking: The Male Gametophyte. Annu. Rev. Plant Biol. 2021, 72, 581–614. [Google Scholar] [CrossRef] [PubMed]
- Maheshwari, P. An Introduction to the Embryology of Angiosperms, 1st ed.; McGraw-Hill: New York, NY, USA, 1950. [Google Scholar]
- Schneitz, K.; Hulskamp, M.; Pruitt, R.E. Wild-Type Ovule Development in Arabidopsis Thaliana: A Light Microscope Study of Cleared Whole-Mount Tissue. Plant J. 1995, 7, 731–749. [Google Scholar] [CrossRef]
- Hater, F.; Nakel, T.; Groß-Hardt, R. Reproductive Multitasking: The Female Gametophyte. Annu. Rev. Plant Biol. 2020, 71, 517–546. [Google Scholar] [CrossRef]
- Hamamura, Y.; Saito, C.; Awai, C.; Kurihara, D.; Miyawaki, A.; Nakagawa, T.; Kanaoka, M.M.; Sasaki, N.; Nakano, A.; Berger, F.; et al. Live-Cell Imaging Reveals the Dynamics of Two Sperm Cells during Double Fertilization in Arabidopsis Thaliana. Curr. Biol. 2011, 21, 497–502. [Google Scholar] [CrossRef] [PubMed] [Green Version]
- Lopes, A.L.; Moreira, D.; Ferreira, M.J.; Pereira, A.M.; Coimbra, S. Insights into Secrets along the Pollen Tube Pathway in Need to Be Discovered. J. Exp. Bot. 2019, 70, 2979–2992. [Google Scholar] [CrossRef]
- Silva, J.; Ferraz, R.; Dupree, P.; Showalter, A.M.; Coimbra, S. Three Decades of Advances in Arabinogalactan-Protein Biosynthesis. Front. Plant Sci. 2020, 11, 2014. [Google Scholar] [CrossRef]
- Levitin, B.; Richter, D.; Markovich, I.; Zik, M. Arabinogalactan Proteins 6 and 11 Are Required for Stamen and Pollen Function in Arabidopsis. Plant J. 2008, 56, 351–363. [Google Scholar] [CrossRef] [PubMed]
- Coimbra, S.; Costa, M.; Jones, B.; Mendes, M.A.; Pereira, L.G. Pollen Grain Development Is Compromised in Arabidopsis Agp6 Agp11 Null Mutants. J. Exp. Bot. 2009, 60, 3133–3142. [Google Scholar] [CrossRef] [PubMed] [Green Version]
- Costa, M.; Nobre, M.S.; Becker, J.D.; Masiero, S.; Amorim, M.I.; Pereira, L.G.; Coimbra, S. Expression-Based and Co-Localization Detection of Arabinogalactan Protein 6 and Arabinogalactan Protein 11 Interactors in Arabidopsis Pollen and Pollen Tubes. BMC Plant Biol. 2013, 13, 1–19. [Google Scholar] [CrossRef] [PubMed] [Green Version]
- Pereira, A.M.; Nobre, M.S.; Pinto, S.C.; Lopes, A.L.; Costa, M.L.; Masiero, S.; Coimbra, S. “Love Is Strong, and You’re so Sweet”: JAGGER Is Essential for Persistent Synergid Degeneration and Polytubey Block in Arabidopsis Thaliana. Mol. Plant 2016, 9, 601–614. [Google Scholar] [CrossRef] [PubMed]
- VanGuilder, H.D.; Vrana, K.E.; Freeman, W.M. Twenty-Five Years of Quantitative PCR for Gene Expression Analysis. Biotechniques 2008, 44, 619–626. [Google Scholar] [CrossRef] [Green Version]
- Bustin, S.A.; Benes, V.; Garson, J.A.; Hellemans, J.; Huggett, J.; Kubista, M.; Mueller, R.; Nolan, T.; Pfaffl, M.W.; Shipley, G.L.; et al. The MIQE Guidelines: Minimum Information for Publication of Quantitative Real-Time PCR Experiments. Clin. Chem. 2009, 55, 611–622. [Google Scholar] [CrossRef] [PubMed] [Green Version]
- Taylor, S.C.; Nadeau, K.; Abbasi, M.; Lachance, C.; Nguyen, M.; Fenrich, J. The Ultimate QPCR Experiment: Producing Publication Quality, Reproducible Data the First Time. Trends Biotechnol. 2019, 37, 761–774. [Google Scholar] [CrossRef] [Green Version]
- Pfaffl, M.W. A New Mathematical Model for Relative Quantification in Real-Time RT-PCR. Nucleic Acids Res. 2001, 29, e45. [Google Scholar] [CrossRef]
- Vandesompele, J.; De Preter, K.; Pattyn, F.; Poppe, B.; Van Roy, N.; De Paepe, A.; Speleman, F. Accurate Normalization of Real-Time Quantitative RT-PCR Data by Geometric Averaging of Multiple Internal Control Genes. Genome Biol. 2002, 3, 1–12. [Google Scholar] [CrossRef] [Green Version]
- Hellemans, J.; Mortier, G.; De Paepe, A.; Speleman, F.; Vandesompele, J. QBase Relative Quantification Framework and Software for Management and Automated Analysis of Real-Time Quantitative PCR Data. Genome Biol. 2007, 8, 1–14. [Google Scholar] [CrossRef] [Green Version]
- Czechowski, T.; Bari, R.P.; Stitt, M.; Scheible, W.R.; Udvardi, M.K. Real-Time RT-PCR Profiling of over 1400 Arabidopsis Transcription Factors: Unprecedented Sensitivity Reveals Novel Root- and Shoot-Specific Genes. Plant J. 2004, 38, 366–379. [Google Scholar] [CrossRef]
- Dheda, K.; Huggett, J.F.; Bustin, S.A.; Johnson, M.A.; Rook, G.; Zumla, A. Validation of Housekeeping Genes for Normalizing RNA Expression in Real-Time PCR. Biotechniques 2004, 37, 112–119. [Google Scholar] [CrossRef] [Green Version]
- Kim, B.R.; Nam, H.Y.; Kim, S.U.; Kim, S.I.; Chang, Y.J. Normalization of Reverse Transcription Quantitative-PCR with Housekeeping Genes in Rice. Biotechnol. Lett. 2003, 25, 1869–1872. [Google Scholar] [CrossRef] [PubMed]
- Knopkiewicz, M.; Wojtaszek, P. Validation of Reference Genes for Gene Expression Analysis Using Quantitative Polymerase Chain Reaction in Pea Lines (Pisum sativum) with Different Lodging Susceptibility. Ann. Appl. Biol. 2019, 174, 86–91. [Google Scholar] [CrossRef] [Green Version]
- Lü, J.; Chen, S.; Guo, M.; Ye, C.; Qiu, B.; Wu, J.; Yang, C.; Pan, H. Selection and Validation of Reference Genes for RT-QPCR Analysis of the Ladybird Beetle Henosepilachna Vigintioctomaculata. Front. Physiol. 2018, 9, 1614. [Google Scholar] [CrossRef] [Green Version]
- Sandercock, D.A.; Coe, J.E.; Di Giminiani, P.; Edwards, S.A. Determination of Stable Reference Genes for RT-QPCR Expression Data in Mechanistic Pain Studies on Pig Dorsal Root Ganglia and Spinal Cord. Res. Vet. Sci. 2017, 114, 493–501. [Google Scholar] [CrossRef] [PubMed]
- Czechowski, T.; Stitt, M.; Altmann, T.; Udvardi, M.K.; Scheible, W.R. Genome-Wide Identification and Testing of Superior Reference Genes for Transcript Normalization in Arabidopsis. Plant Physiol. 2005, 139, 5–17. [Google Scholar] [CrossRef] [Green Version]
- Mizzotti, C.; Rotasperti, L.; Moretto, M.; Tadini, L.; Resentini, F.; Galliani, B.M.; Galbiati, M.; Engelen, K.; Pesaresi, P.; Masiero, S. Time-Course Transcriptome Analysis of Arabidopsis Siliques Discloses Genes Essential for Fruit Development and Maturation. Plant Physiol. 2018, 178, 1249–1268. [Google Scholar] [CrossRef] [Green Version]
- Xie, F.; Xiao, P.; Chen, D.; Xu, L.; Zhang, B. MiRDeepFinder: A MiRNA Analysis Tool for Deep Sequencing of Plant Small RNAs. Plant Mol. Biol. 2012, 80, 75–84. [Google Scholar] [CrossRef]
- Andersen, C.L.; Jensen, J.L.; Ørntoft, T.F. Normalization of Real-Time Quantitative Reverse Transcription-PCR Data: A Model-Based Variance Estimation Approach to Identify Genes Suited for Normalization, Applied to Bladder and Colon Cancer Data Sets. Cancer Res. 2004, 64, 5245–5250. [Google Scholar] [CrossRef] [Green Version]
- Pfaffl, M.W.; Tichopad, A.; Prgomet, C.; Neuvians, T.P. Determination of Stable Housekeeping Genes, Differentially Regulated Target Genes and Sample Integrity: BestKeeper-Excel-Based Tool Using Pair-Wise Correlations. Biotechnol. Lett. 2004, 26, 509–515. [Google Scholar] [CrossRef]
- Silver, N.; Best, S.; Jiang, J.; Thein, S.L. Selection of Housekeeping Genes for Gene Expression Studies in Human Reticulocytes Using Real-Time PCR. BMC Mol. Biol. 2006, 7, 33. [Google Scholar] [CrossRef] [Green Version]
- Julca, I.; Ferrari, C.; Flores-Tornero, M.; Proost, S.; Lindner, A.C.; Hackenberg, D.; Steinbachová, L.; Michaelidis, C.; Gomes Pereira, S.; Misra, C.S.; et al. Comparative Transcriptomic Analysis Reveals Conserved Programmes Underpinning Organogenesis and Reproduction in Land Plants. Nat. Plants 2021, 7, 1143–1159. [Google Scholar] [CrossRef] [PubMed]
- Kõressaar, T.; Lepamets, M.; Kaplinski, L.; Raime, K.; Andreson, R.; Remm, M. Primer3-Masker: Integrating Masking of Template Sequence with Primer Design Software. Bioinformatics 2018, 34, 1937–1938. [Google Scholar] [CrossRef] [PubMed] [Green Version]
- Untergasser, A.; Cutcutache, I.; Koressaar, T.; Ye, J.; Faircloth, B.C.; Remm, M.; Rozen, S.G. Primer3-New Capabilities and Interfaces. Nucleic Acids Res. 2012, 40, e115. [Google Scholar] [CrossRef] [PubMed] [Green Version]
- Koressaar, T.; Remm, M. Enhancements and Modifications of Primer Design Program Primer3. Bioinformatics 2007, 23, 1289–1291. [Google Scholar] [CrossRef] [PubMed] [Green Version]
- Costa, M.; Silva, J.; Coimbra, S. Arabidopsis Thaliana Pollen Tube Culture for Multi-Omics Studies. In The Pollen Tube: Methods and Protocols; Geitmann, A., Ed.; Springer: New York, NY, USA, 2019. [Google Scholar]
- Smyth, D.R.; Bowman, J.L.; Meyerowitz, E.M. Early Flower Development in Arabidopsis. Plant Cell 1990, 2, 755–767. [Google Scholar] [CrossRef] [Green Version]
- Alvarez-Buylla, E.R.; Benítez, M.; Corvera-Poiré, A.; Cador, C.; de Folter, S.; de Buen, A.G.; Garay-Arroyo, A.; García-Ponce, B.; Jaimes-Miranda, F.; Pérez-Ruiz, R.V.; et al. Flower Development. Arab. Book/Am. Soc. Plant Biol. 2010, 8, e0127. [Google Scholar] [CrossRef] [Green Version]
- Livak, K.J.; Schmittgen, T.D. Analysis of Relative Gene Expression Data Using Real-Time Quantitative PCR and the 2-ΔΔCT Method. Methods 2001, 25, 402–408. [Google Scholar] [CrossRef]
- Mafra, V.; Kubo, K.S.; Alves-Ferreira, M.; Ribeiro-Alves, M.; Stuart, R.M.; Boava, L.P.; Rodrigues, C.M.; Machado, M.A. Reference Genes for Accurate Transcript Normalization in Citrus Genotypes under Different Experimental Conditions. PLoS ONE 2012, 7, e31263. [Google Scholar] [CrossRef]
- Sgamma, T.; Pape, J.; Massiah, A.; Jackson, S. Selection of Reference Genes for Diurnal and Developmental Time-Course Real-Time PCR Expression Analyses in Lettuce. Plant Methods 2016, 12, 1–9. [Google Scholar] [CrossRef] [Green Version]
- Chen, X.; Mao, Y.; Huang, S.; Ni, J.; Lu, W.; Hou, J.; Wang, Y.; Zhao, W.; Li, M.; Wang, Q.; et al. Selection of Suitable Reference Genes for Quantitative Real-Time PCR in Sapium Sebiferum. Front. Plant Sci. 2017, 8, 637. [Google Scholar] [CrossRef] [Green Version]
- Wang, J.J.; Han, S.; Yin, W.; Xia, X.; Liu, C. Comparison of Reliable Reference Genes Following Different Hormone Treatments by Various Algorithms for QRT-PCR Analysis of Metasequoia. Int. J. Mol. Sci. 2018, 20, 34. [Google Scholar] [CrossRef] [PubMed] [Green Version]
- Pu, Q.; Li, Z.; Nie, G.; Zhou, J.; Liu, L.; Peng, Y. Selection and Validation of Reference Genes for Quantitative Real-Time PCR in White Clover (Trifolium repens L.) Involved in Five Abiotic Stresses. Plants 2020, 9, 996. [Google Scholar] [CrossRef] [PubMed]
- Zhang, J.; Xie, W.; Yu, X.; Zhang, Z.; Zhao, Y.; Wang, N.; Wang, Y. Selection of Suitable Reference Genes for RT-QPCR Gene Expression Analysis in Siberian Wild Rye (Elymus sibiricus) under Different Experimental Conditions. Genes 2019, 10, 451. [Google Scholar] [CrossRef] [PubMed] [Green Version]
- Kindgren, P.; Kremnev, D.; Blanco, N.E.; de Dios Barajas López, J.; Fernández, A.P.; Tellgren-Roth, C.; Small, I.; Strand, Å. The Plastid Redox Insensitive 2 Mutant of Arabidopsis Is Impaired in PEP Activity and High Light-Dependent Plastid Redox Signalling to the Nucleus. Plant J. 2012, 70, 279–291. [Google Scholar] [CrossRef] [PubMed]
- Park, H.J.; Kim, W.Y.; Park, H.C.; Lee, S.Y.; Bohnert, H.J.; Yun, D.J. SUMO and SUMOylation in Plants. Mol. Cells 2011, 32, 305–316. [Google Scholar] [CrossRef] [Green Version]
- Zhou, H.W.; Nussbaumer, C.; Chao, Y.; DeLong, A. Disparate Roles for the Regulatory A Subunit Isoforms in Arabidopsis Protein Phosphatase 2A. Plant Cell 2004, 16, 709–722. [Google Scholar] [CrossRef] [Green Version]
- Dharmasiri, S.; Dharmasiri, N.; Hellmann, H.; Estelle, M. The RUB/Nedd8 Conjugation Pathway Is Required for Early Development in Arabidopsis. EMBO J. 2003, 22, 1762–1770. [Google Scholar] [CrossRef] [Green Version]
- Gilliland, L.U.; Pawloski, L.C.; Kandasamy, M.K.; Meagher, R.B. Arabidopsis Actin Gene ACT7 Plays an Essential Role in Germination and Root Growth. Plant J. 2003, 33, 319–328. [Google Scholar] [CrossRef]
- Kopczak, S.D.; Haas, N.A.; Hussey, P.J.; Silflow, C.D.; Snustad, D.P. The Small Genome of Arabidopsis Contains at Least Six Expressed Alpha-Tubulin Genes. Plant Cell 1992, 4, 539–547. [Google Scholar] [CrossRef] [Green Version]
- Rius, S.P.; Casati, P.; Iglesias, A.A.; Gomez-Casati, D.F. Characterization of Arabidopsis Lines Deficient in GAPC-1, a Cytosolic NAD-Dependent Glyceraldehyde-3-Phosphate Dehydrogenase. Plant Physiol. 2008, 148, 1655. [Google Scholar] [CrossRef] [Green Version]
- Majumdar, R.; Shao, L.; Turlapati, S.A.; Minocha, S.C. Polyamines in the Life of Arabidopsis: Profiling the Expression of S-Adenosylmethionine Decarboxylase (SAMDC) Gene Family during Its Life Cycle. BMC Plant Biol. 2017, 17, 1–20. [Google Scholar] [CrossRef] [PubMed] [Green Version]
- Yoshida, S.; Ito, M.; Nishida, I.; Watanabe, A. Isolation and RNA Gel Blot Analysis of Genes That Could Serve as Potential Molecular Markers for Leaf Senescence in Arabidopsis Thaliana. Plant Cell Physiol. 2001, 42, 170–178. [Google Scholar] [CrossRef] [PubMed]
- Wollmann, H.; Stroud, H.; Yelagandula, R.; Tarutani, Y.; Jiang, D.; Jing, L.; Jamge, B.; Takeuchi, H.; Holec, S.; Nie, X.; et al. The Histone H3 Variant H3.3 Regulates Gene Body DNA Methylation in Arabidopsis Thaliana. Genome Biol. 2017, 18, 1–10. [Google Scholar] [CrossRef] [PubMed] [Green Version]
- Imai, A.; Komura, M.; Kawano, E.; Kuwashiro, Y.; Takahashi, T. A Semi-Dominant Mutation in the Ribosomal Protein L10 Gene Suppresses the Dwarf Phenotype of the Acl5 Mutant in Arabidopsis Thaliana. Plant J. 2008, 56, 881–890. [Google Scholar] [CrossRef] [PubMed]
- Kozera, B.; Rapacz, M. Reference Genes in Real-Time PCR. J. Appl. Genet. 2013, 54, 391. [Google Scholar] [CrossRef] [PubMed] [Green Version]
- Gutierrez, L.; Mauriat, M.; Guénin, S.; Pelloux, J.; Lefebvre, J.; Louvet, R.; Rusterucci, C.; Moritz, T.; Guerineau, F.; Bellini, C.; et al. The Lack of a Systematic Validation of Reference Genes: A Serious Pitfall Undervalued in Reverse Transcription-Polymerase Chain Reaction (RT-PCR) Analysis in Plants. Plant Biotechnol. J. 2008, 6, 609–618. [Google Scholar] [CrossRef] [Green Version]
- Volkov, R.A.; Panchuk, I.I.; Schöffl, F. Heat-stress-dependency and Developmental Modulation of Gene Expression: The Potential of House-keeping Genes as Internal Standards in MRNA Expression Profiling Using Real-time RT-PCR. J. Exp. Bot. 2003, 54, 2343–2349. [Google Scholar] [CrossRef] [Green Version]
- Nicot, N.; Hausman, J.-F.; Hoffmann, L.; Evers, D. Housekeeping Gene Selection for Real-Time RT-PCR Normalization in Potato during Biotic and Abiotic Stress. J. Exp. Bot. 2005, 56, 2907–2914. [Google Scholar] [CrossRef]
- Waxman, S.; Wurmbach, E. De-Regulation of Common Housekeeping Genes in Hepatocellular Carcinoma. BMC Genom. 2007, 8, 1–9. [Google Scholar] [CrossRef] [Green Version]
- Remans, T.; Smeets, K.; Opdenakker, K.; Mathijsen, D.; Vangronsveld, J.; Cuypers, A. Normalisation of Real-Time RT-PCR Gene Expression Measurements in Arabidopsis Thaliana Exposed to Increased Metal Concentrations. Planta 2008, 227, 1343–1349. [Google Scholar] [CrossRef] [Green Version]
- Wan, Q.; Chen, S.; Shan, Z.; Yang, Z.; Chen, L.; Zhang, C.; Yuan, S.; Hao, Q.; Zhang, X.; Qiu, D.; et al. Stability Evaluation of Reference Genes for Gene Expression Analysis by RT-QPCR in Soybean under Different Conditions. PLoS ONE 2017, 12, e0189405. [Google Scholar] [CrossRef] [PubMed] [Green Version]
- Derveaux, S.; Vandesompele, J.; Hellemans, J. How to Do Successful Gene Expression Analysis Using Real-Time PCR. Methods 2010, 50, 227–230. [Google Scholar] [CrossRef] [PubMed]
- Guénin, S.; Mauriat, M.; Pelloux, J.; Van Wuytswinkel, O.; Bellini, C.; Gutierrez, L. Normalization of QRT-PCR Data: The Necessity of Adopting a Systematic, Experimental Conditions-Specific, Validation of References. J. Exp. Bot. 2009, 60, 487–493. [Google Scholar] [CrossRef] [PubMed] [Green Version]
- Bustin, S.A.; Beaulieu, J.-F.; Huggett, J.; Jaggi, R.; Kibenge, F.S.; Olsvik, P.A.; Penning, L.C.; Toegel, S. MIQE Précis: Practical Implementation of Minimum Standard Guidelines for Fluorescence-Based Quantitative Real-Time PCR Experiments. BMC Mol. Biol. 2010, 11, 1–5. [Google Scholar] [CrossRef] [PubMed] [Green Version]
- Bustin, S.A.; Benes, V.; Garson, J.; Hellemans, J.; Huggett, J.; Kubista, M.; Mueller, R.; Nolan, T.; Pfaffl, M.W.; Shipley, G.; et al. The Need for Transparency and Good Practices in the QPCR Literature. Nat. Methods 2013, 10, 1063–1067. [Google Scholar] [CrossRef]
- Ma, L.; Sun, N.; Liu, X.; Jiao, Y.; Zhao, H.; Deng, X.W. Organ-Specific Expression of Arabidopsis Genome during Development. Plant Physiol. 2005, 138, 80–91. [Google Scholar] [CrossRef] [Green Version]
- Mergner, J.; Frejno, M.; Messerer, M.; Lang, D.; Samaras, P.; Wilhelm, M.; Mayer, K.F.X.; Schwechheimer, C.; Kuster, B. Proteomic and Transcriptomic Profiling of Aerial Organ Development in Arabidopsis. Sci. Data 2020, 7, 1–11. [Google Scholar] [CrossRef]
- Becker, J.D.; Boavida, L.C.; Carneiro, J.; Haury, M.; Feijó, J.A. Transcriptional Profiling of Arabidopsis Tissues Reveals the Unique Characteristics of the Pollen Transcriptome. Plant Physiol. 2003, 133, 713–725. [Google Scholar] [CrossRef] [Green Version]
- Dekkers, B.J.W.; Willems, L.; Bassel, G.W.; van Bolderen-Veldkamp, R.P.; Ligterink, W.; Hilhorst, H.W.M.; Bentsink, L. Identification of Reference Genes for RT–QPCR Expression Analysis in Arabidopsis and Tomato Seeds. Plant Cell Physiol. 2012, 53, 28–37. [Google Scholar] [CrossRef] [Green Version]
- De Spiegelaere, W.; Dern-Wieloch, J.; Weigel, R.; Schumacher, V.; Schorle, H.; Nettersheim, D.; Bergmann, M.; Brehm, R.; Kliesch, S.; Vandekerckhove, L.; et al. Reference Gene Validation for RT-QPCR, a Note on Different Available Software Packages. PLoS ONE 2015, 10, e0122515. [Google Scholar] [CrossRef] [Green Version]
- Kałużna, M.; Kuras, A.; Puławska, J. Validation of Reference Genes for the Normalization of the RT-QPCR Gene Expression of Virulence Genes of Erwinia Amylovora in Apple Shoots. Sci. Rep. 2017, 7, 1–9. [Google Scholar] [CrossRef] [PubMed] [Green Version]
- Petriccione, M.; Mastrobuoni, F.; Zampella, L.; Scortichini, M. Reference Gene Selection for Normalization of RT-QPCR Gene Expression Data from Actinidia Deliciosa Leaves Infected with Pseudomonas Syringae Pv. Actinidiae. Sci. Rep. 2015, 5, 1–12. [Google Scholar] [CrossRef] [PubMed] [Green Version]
- Liu, D.; Shi, L.; Han, C.; Yu, J.; Li, D.; Zhang, Y. Validation of Reference Genes for Gene Expression Studies in Virus-Infected Nicotiana Benthamiana Using Quantitative Real-Time PCR. PLoS ONE 2012, 7, e46451. [Google Scholar] [CrossRef] [PubMed]
- Köhsler, M.; Leitsch, D.; Müller, N.; Walochnik, J. Validation of Reference Genes for the Normalization of RT-QPCR Gene Expression in Acanthamoeba Spp. Sci. Rep. 2020, 10, 1–12. [Google Scholar] [CrossRef] [PubMed]


| Locus | Gene Symbol | Gene Name | Primer Sequences Forward and Reverse (5′–3′) | Amplicon Length (bp) |
|---|---|---|---|---|
| AT4G27960 | UBC9 | UBIQUITIN CONJUGATING ENZYME 9 | AGATGATCCTTTGGTCCCTGAG | 114 |
| CAGTATTTGTGTCAGCCCATGG | ||||
| AT5G09810 | ACT7 | ACTIN 7 | ATCAATCCTTGCATCCCTCAGC | 72 |
| GGACCTGACTCATCGTACTCAC | ||||
| AT1G13440 | GAPC-2 | GLYCERALDEHYDE-3-PHOSPHATE DEHYDROGENASE C2 | TGGGGTTACAGTTCTCGTGTC | 83 |
| ACCACACACAAACTCTCGCC | ||||
| AT4G36800 | RCE1 | RUB1 CONJUGATING ENZYME 1 | CGGTGGATATGTCGGTCAG | 135 |
| AACGAGGGTCCTTGAGAAAGAG | ||||
| AT1G50010 | TUA2 | TUBULIN ALPHA-2 CHAIN | CATTGAGAGACCCACCTACACC | 78 |
| AACCTCAGAGAAGCAGTCAAGG | ||||
| AT1G13320 | PP2AA3 | PROTEIN PHOSPHATASE 2A SUBUNIT A3 | TGTTCCAAACTCTTACCTGCGG | 136 |
| ATGGCCGTATCATGTTCTCCAC | ||||
| AT1G14320 | SAC52 | SUPPRESSOR OF ACAULIS 52 | CGTCGTGCTAAGTTCAAGTTCC | 108 |
| CTTCTCTTGCCTCAACTTGGTG | ||||
| AT5G08290 | YLS8 | YELLOW-LEAF-SPECIFIC GENE 8 | AAGATCAACTGGGCTCTCAAGG | 141 |
| TGGGAAGCTCGATTAGTAACGG | ||||
| AT3G02470 | SAMDC | S-ADENOSYLMETHIONINE DECARBOXYLASE | TTGGTAAGTACTGTGGATCGCC | 101 |
| CTGCTAGATTCCCTCGTCCTTC | ||||
| AT4G40030 | HIS3.3 | HISTONE 3.3 | ACCTTTGTGCCATTCATGCC | 78 |
| GTTCACCTCTGATACGACGAGC |
| Gene Symbol | Efficiency (%) | R2 | Slope | Melting Temperature (°C) |
|---|---|---|---|---|
| UBC9 | 91.2 | 1 | −3.553 | 82.5 |
| ACT7 | 105.6 | 0.997 | −3.194 | 79 |
| GAPC-2 | 93.7 | 0.999 | −3.483 | 81.5 |
| RCE1 | 96.6 | 0.999 | −3.406 | 81 |
| TUA2 | 104.4 | 0.999 | −3.221 | 80.5 |
| PP2AA3 | 100.3 | 0.998 | −3.314 | 81.5 |
| SAC52 | 96.8 | 0.999 | −3.402 | 81.5 |
| YLS8 | 90 | 0.996 | −3.587 | 82.5 |
| SAMDC | 107.5 | 0.989 | −3.155 | 82.5 |
| HIS3.3 | 101.2 | 0.992 | −3.293 | 81.5 |
Disclaimer/Publisher’s Note: The statements, opinions and data contained in all publications are solely those of the individual author(s) and contributor(s) and not of MDPI and/or the editor(s). MDPI and/or the editor(s) disclaim responsibility for any injury to people or property resulting from any ideas, methods, instructions or products referred to in the content. |
© 2023 by the authors. Licensee MDPI, Basel, Switzerland. This article is an open access article distributed under the terms and conditions of the Creative Commons Attribution (CC BY) license (https://creativecommons.org/licenses/by/4.0/).
Share and Cite
Ferreira, M.J.; Silva, J.; Pinto, S.C.; Coimbra, S. I Choose You: Selecting Accurate Reference Genes for qPCR Expression Analysis in Reproductive Tissues in Arabidopsis thaliana. Biomolecules 2023, 13, 463. https://doi.org/10.3390/biom13030463
Ferreira MJ, Silva J, Pinto SC, Coimbra S. I Choose You: Selecting Accurate Reference Genes for qPCR Expression Analysis in Reproductive Tissues in Arabidopsis thaliana. Biomolecules. 2023; 13(3):463. https://doi.org/10.3390/biom13030463
Chicago/Turabian StyleFerreira, Maria João, Jessy Silva, Sara Cristina Pinto, and Sílvia Coimbra. 2023. "I Choose You: Selecting Accurate Reference Genes for qPCR Expression Analysis in Reproductive Tissues in Arabidopsis thaliana" Biomolecules 13, no. 3: 463. https://doi.org/10.3390/biom13030463