

Comparative Modeling and Analysis of Extremophilic D-Ala-D-Ala Carboxypeptidases

Abstract
:1. Introduction
2. Materials and Methods
2.1. Sequence Selection, Alignment, and Clustering
2.2. Structure Prediction
2.3. Molecular Modeling and Analysis
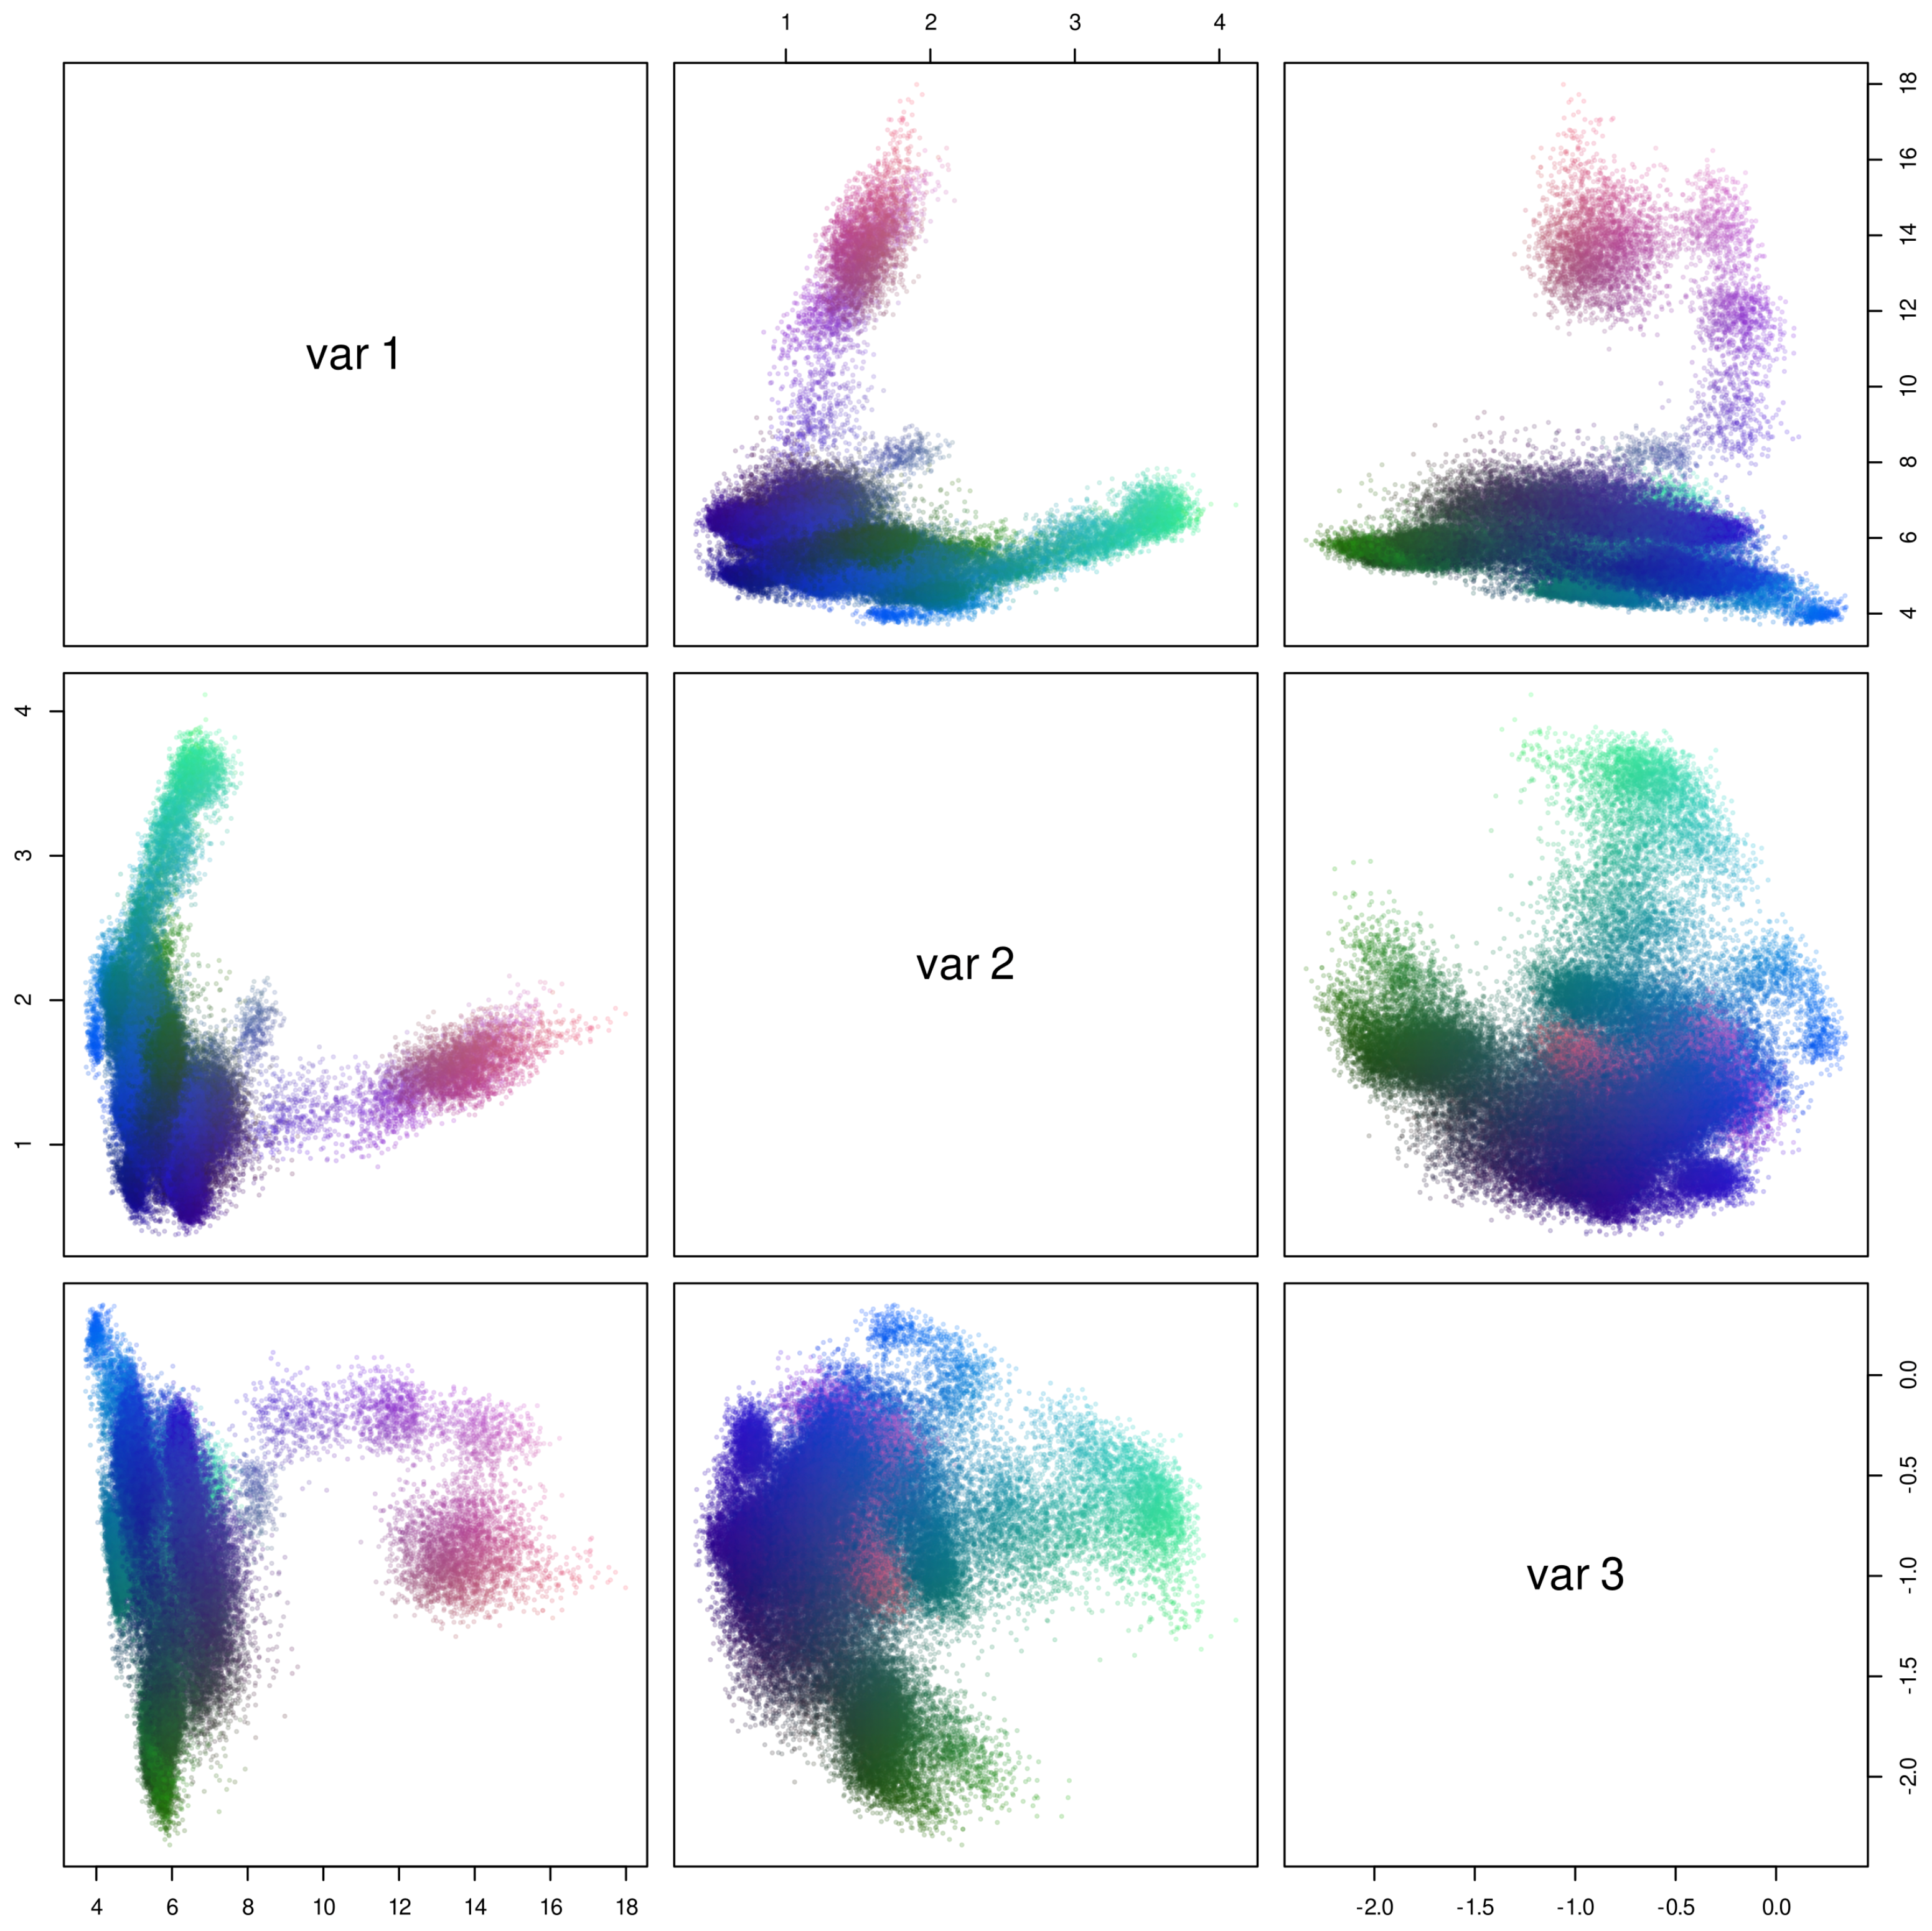
2.4. Random Feature Clustering and Markov Analysis
3. Results
3.1. Sequence Analysis Shows Three Temperature-Related S11 Protease Groups
3.2. Thermophilic Enzymes Are Enriched in Charged Amino Acids, but Not Hydrophobic Ones, and Psychrophilic Enzyme Composition Differs Markedly by Group
Composition by Exposure
3.3. Packing and Flexibility Favor Function and Interaction over Stability at Extreme Temperatures
3.3.1. Packing
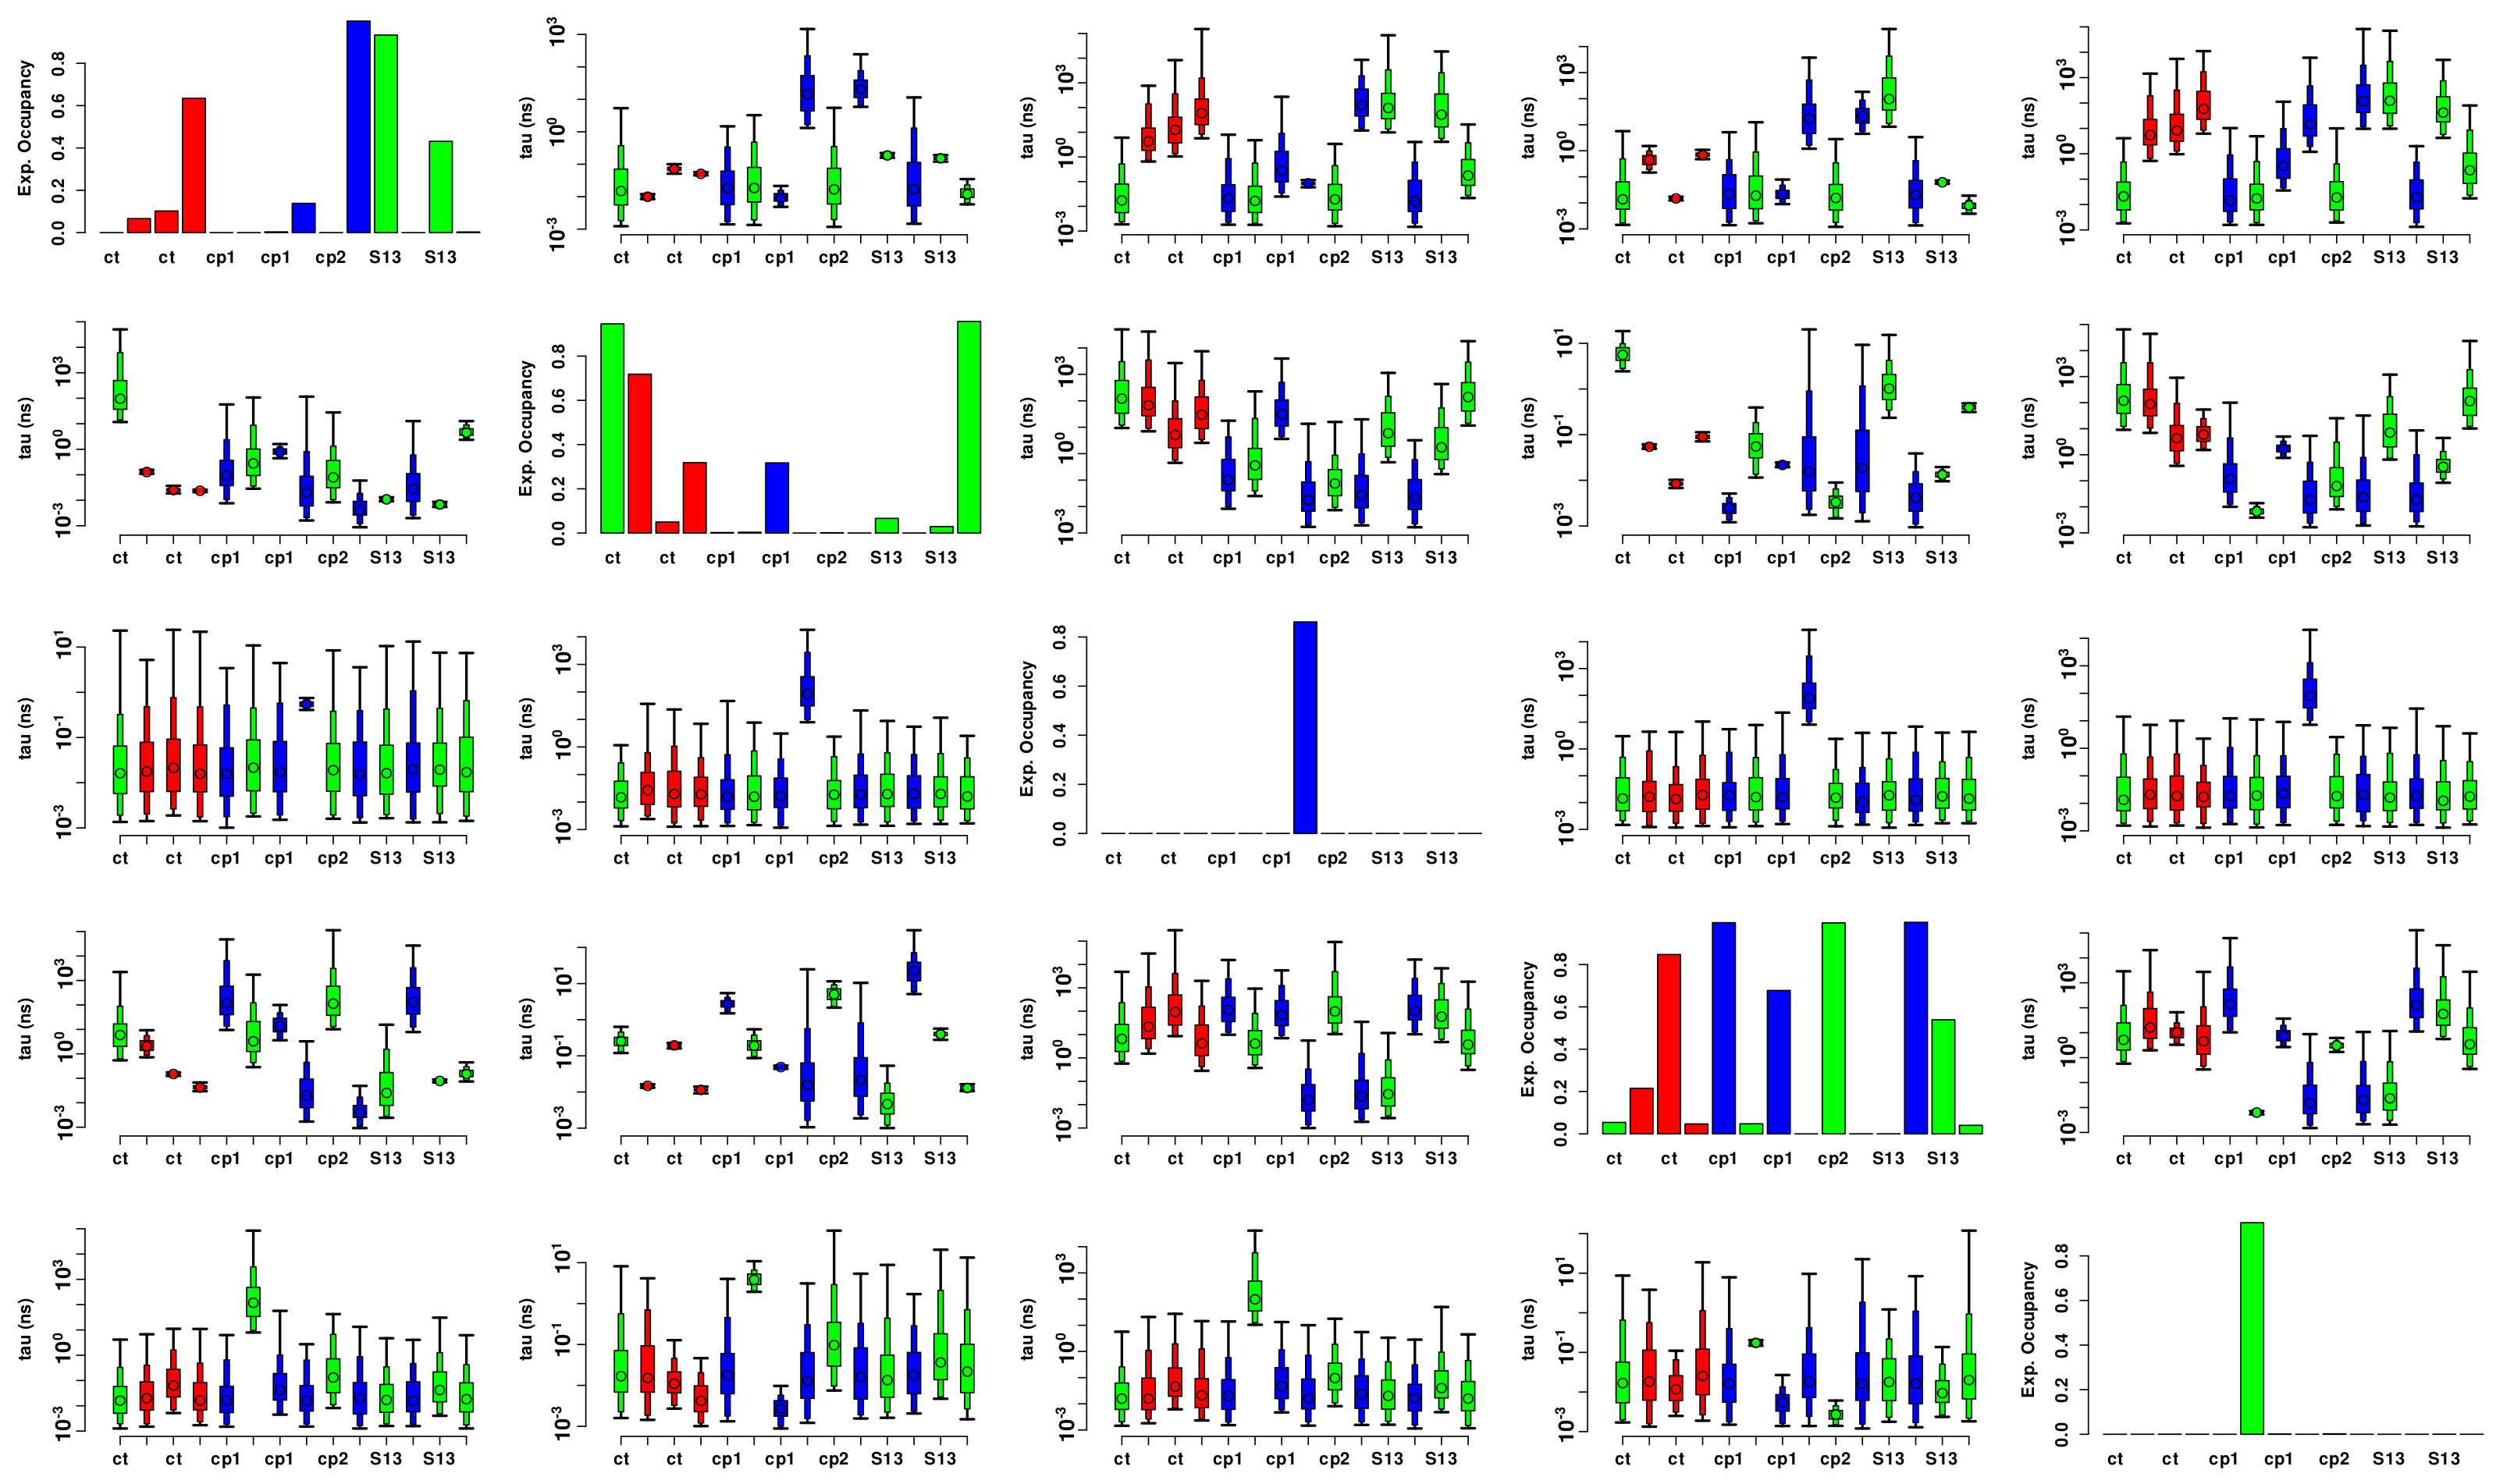
3.3.2. Flexibility
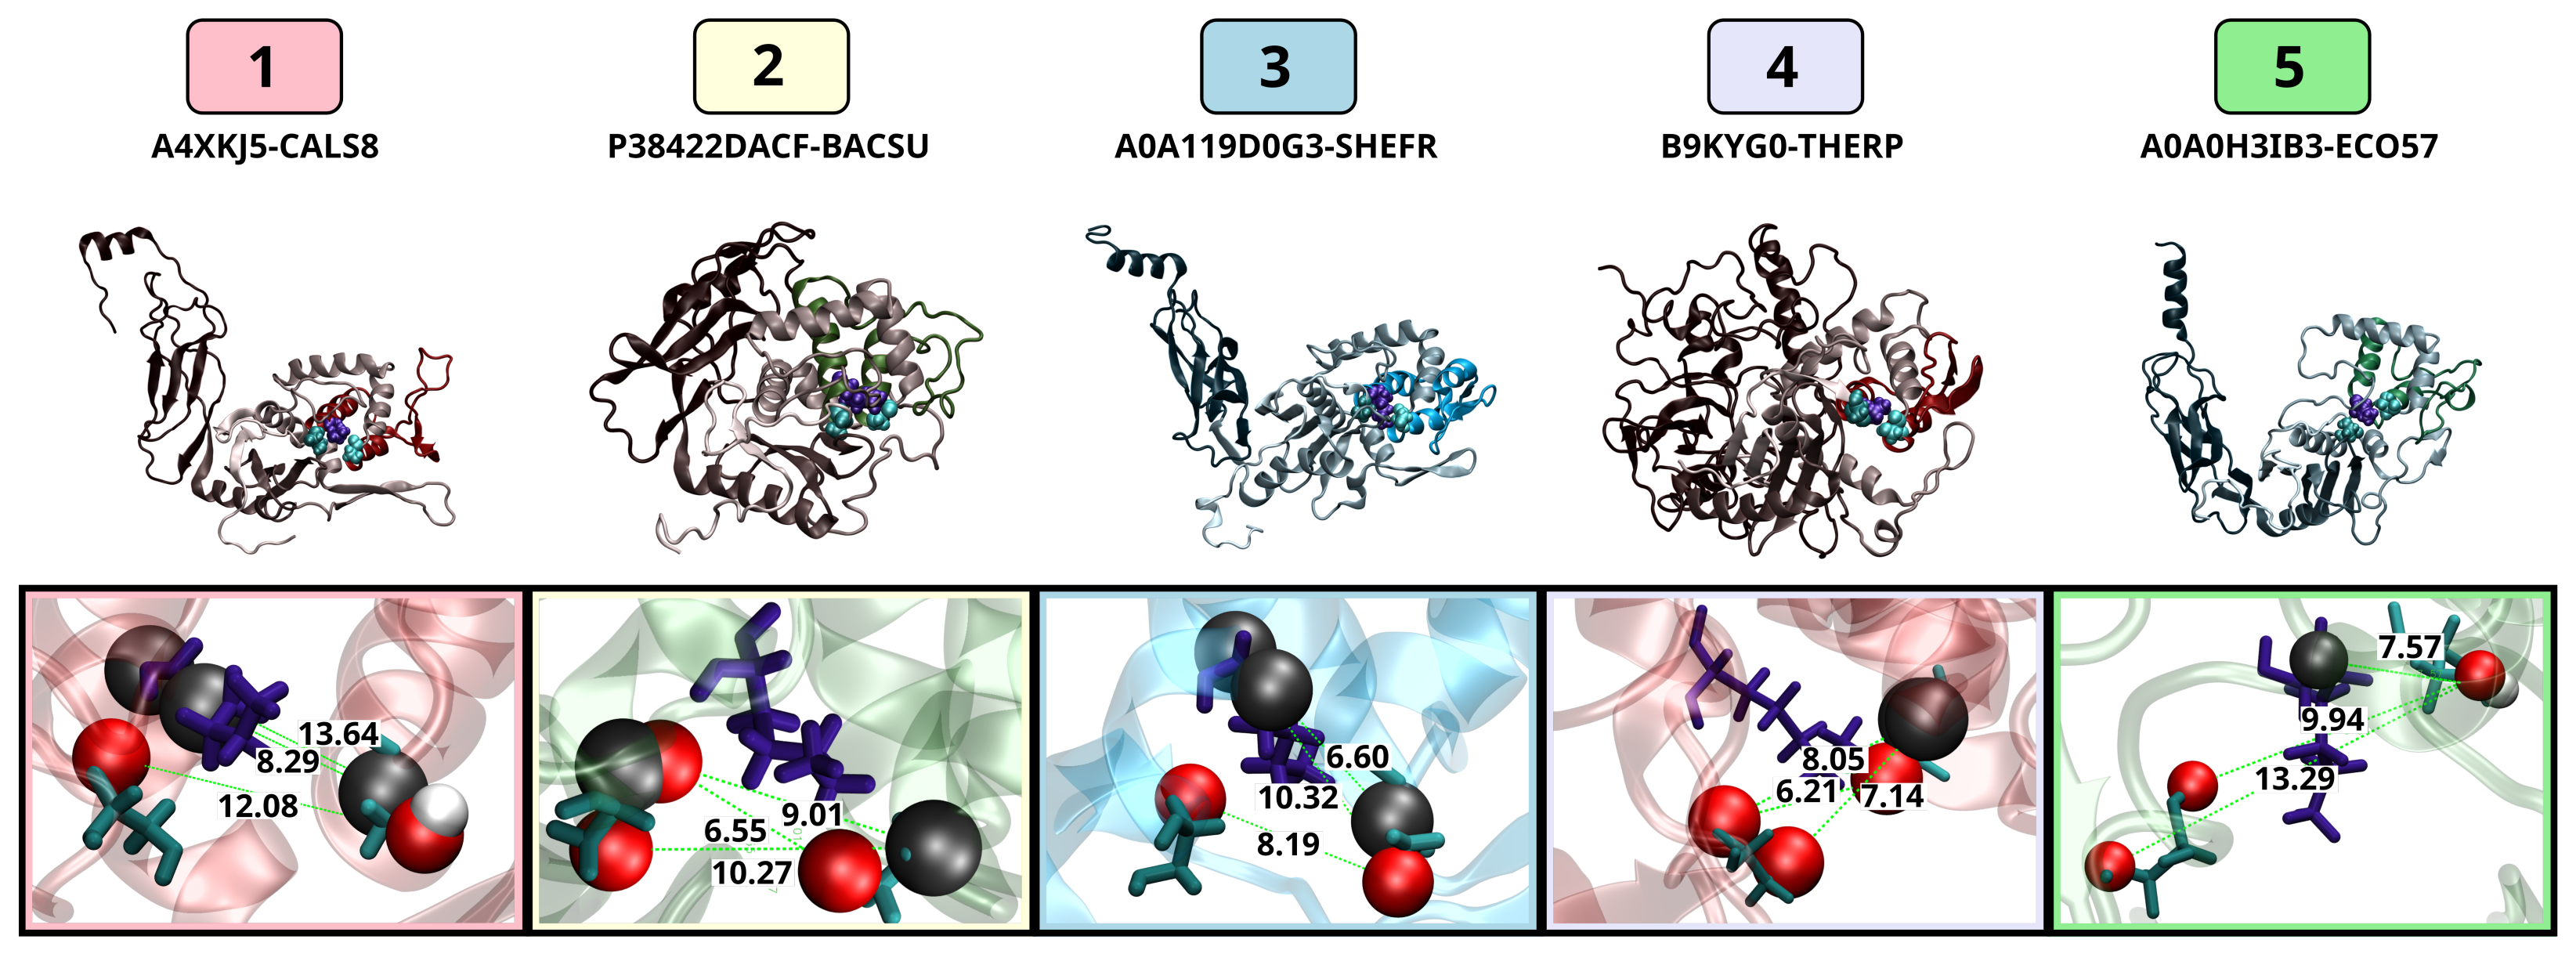
3.3.3. Active Site Structure
3.4. Salt Bridges, but Not Disulfide Bonds, Stabilize Thermophilic Proteases
4. Discussion
4.1. For Prediction of Seed Structures for Novel Proteins, Comparative Modeling Can Outperform Deep Learning
4.2. Conventional Wisdom on Protein Adaptation to Extreme Thermal Environments May Not Generalize to All Enzyme Classes

| Claim References | Examined Proteins | Results | Comparison with Current Study |
|---|---|---|---|
| Number and/or size of specific amino acid types | |||
| Kannan and Vishveshwara [84] | 24 meso and thermo. homologues | increase in aromatic networks/clusters w/ increased Temp. | disagrees (similar amounts of aromatic residues) |
| Vieille and Zeikus [70] | 8 mesophilic 7 hyperthermophilic organisms | increase E, G, I, K, P, R, V, W, Y w/ increased Temp. | disagrees (G, I, R, and W split, more P in psychro) |
| Kumar et al. [78] | 6 each psychro- meso- and thermophilic -D-galactosidases | more A, G, S, R in psychrophiles, more V, Q, E, F, T, Y in thermophiles | disagrees (A, G, and R split, more Q, F, T, in psychrophiles) |
| Density/packing and Rigidity/Flexibility | |||
| Karshikoff and Ladenstein [79] | 80 and 24 proteins from meso and thermo organisms, respectively | packing density is similar between meso and thermo | agrees |
| Radestock and Gohlke [85] | 19 homologs protein pairs from meso and thermo organisms | increased rigidity in thermophiles | disagrees (more unstructured, lower cohesion) |
| Wells et al. [86] | citrate synthase | increased rigidity in thermophiles | disagrees (more unstructured, lower cohesion) |
| Amadei et al. [81] | 57 thermophilic and mesophilic pairs | decreased density with increased temperature | agrees |
| Sen and Sarkar [80] | 17 homolog thermo-meso pairs, 18 homolog psychro-meso pairs | no difference in average packing factor | disagrees (increased packing trend for psychro) |
| Number of disulfide bonds | |||
| Appleby et al. [62] | 5-deoxy-5-methylthioadenosine phosphorylase Solfolobus solfataricus | disulfide bonds increase thermal stability | disagrees (too few Cys found for disulfide bonds to form) |
| Electrostatic interactions and/or salt bridges | |||
| Szilágyi and Závodszky [82] | 64 meso and 29 thermo homologs | increase in ion pairs w/ increased growth Temp. | agrees |
| D’Amico et al. [87] | psychrophilic -amylase | decreased weak interactions in psychrophiles | agrees |
| Chan et al. [83] | thermophilic ribosomal protein L30e | increase in salt-bridges stabilize thermophiles | agrees |
| Niu et al. [88] | 1,3-1,4--glucanase | increased stability at high Temp. with K→S substitutions | disagrees (higher K conc. at high temp.) |
5. Conclusions
Supplementary Materials
Author Contributions
Funding
Data Availability Statement
Conflicts of Interest
Abbreviations
| MD | molecular dynamics |
| PCA | principal component analysis |
| ReLU | rectified linear function |
| RSA | relative surface area |
| SA | surface area |
| SASA | solvent accessible surface area |
References
- Mueller, E.A.; Levin, P.A. Bacterial cell wall quality control duringenvironmental stress. mBio 2020, 11, e02456-20. [Google Scholar] [CrossRef] [PubMed]
- Nelson, D.E.; Young, K.D. Penicillin binding protein 5 affects cell diameter, contour, and morphology of Escherichia Coli. J. Bacteriol. 2000, 182, 1714–1721. [Google Scholar] [CrossRef] [PubMed]
- Nelson, D.E.; Young, K.D. Contributions of PBP 5 and DD-carboxypeptidase penicillin binding proteins to maintenance of cell shape in Escherichia Coli. J. Bacteriol. 2001, 183, 3055–3064. [Google Scholar] [CrossRef] [PubMed]
- Hocking, J.; Priyadarshini, R.; Takacs, C.N.; Costa, T.; Dye, N.A.; Shapiro, L.; Vollmer, W.; Jacobs-Wagner, C. Osmolality-dependent relocation of penicillin-binding protein PBP2 to the division site in Caulobacter Crescentus. J. Bacteriol. 2012, 194, 3116–3127. [Google Scholar] [CrossRef] [PubMed]
- Lonergan, Z.R.; Nairn, B.L.; Wang, J.; Hsu, Y.P.; Hesse, L.E.; Beavers, W.N.; Chazin, W.J.; Trinidad, J.C.; Nieuwenhze, M.S.V.; Giedroc, D.P.; et al. An Acinetobacter baumannii, zinc-regulated peptidase 650 maintains cell wall integrity during immune-mediated nutrient sequestration. Cell Rep. 2019, 26, 2009–2018.e6. [Google Scholar] [CrossRef]
- Peters, K.; Kannan, S.; Rao, V.A.; Biboy, J.; Vollmer, D.; Erickson, S.W.; Lewis, R.J.; Young, K.D.; Vollmer, W. The redundancy of peptidoglycan carboxypeptidases ensures robust cell shape maintenance in Escherichia Coli. MBio 2016, 7, e00819-16. [Google Scholar] [CrossRef]
- Egan, A.J.F.; Errington, J.; Vollmer, W. Regulation of peptidoglycan synthesis and remodelling. Nat. Rev. Microbiol. 2020, 18, 446–460. [Google Scholar] [CrossRef]
- Tipper, D.J.; Strominger, J.L. Mechanism of action of penicillins: A proposal based on their structural similarity to acyl-D-alanyl-D-alanine. Proc. Natl. Acad. Sci. USA 1965, 54, 1133–1141. [Google Scholar] [CrossRef]
- Boyd, D.B. Transition state structures of a dipeptide related to the mode of action of β-lactam antibiotics. Proc. Natl. Acad. Sci. USA 1977, 74, 5239–5243. [Google Scholar] [CrossRef]
- Fisher, J.F.; Mobashery, S. β-lactams against the fortress of the Gram-positive Staphylococcus Aureus Bacterium. Chem. Rev. 2021, 121, 3412–3463. [Google Scholar] [CrossRef]
- Ghuysen, J.M. Serine β-lactamases and penicillin-binding proteins. Annu. Rev. Microbiol. 1991, 45, 37–67. [Google Scholar] [CrossRef]
- Pratt, R.F.; McLeish, M.J. Structural relationship between the active sites of β-lactam-recognizing and amidase signature enzymes: Convergent evolution? Biochemistry 2010, 49, 9688–9697. [Google Scholar] [CrossRef]
- Nicola, G.; Tomberg, J.; Pratt, R.F.; Nicholas, R.A.; Davies, C. Crystal structures of covalent complexes of β-lactam antibiotics with Escherichia Coli penicillin-binding protein 5: Toward an understanding of antibiotic specificity. Biochemistry 2010, 49, 8094–8104. [Google Scholar] [CrossRef]
- Médigue, C.; Krin, E.; Pascal, G.; Barbe, V.; Bernsel, A.; Bertin, P.N.; Cheung, F.; Cruveiller, S.; D’Amico, S.; Duilio, A.; et al. Coping with Cold: The Genome of the Versatile Marine Antarctica Bacterium Pseudoalteromonas Haloplanktis TAC125. Genome Res. 2005, 15, 1325–1335. [Google Scholar] [CrossRef]
- Ayala-del-Río, H.L.; Chain, P.S.; Grzymski, J.J.; Ponder, M.A.; Ivanova, N.; Bergholz, P.W.; Di Bartolo, G.; Hauser, L.; Land, M.; Bakermans, C.; et al. The Genome Sequence of Psychrobacter Arcticus 273-4, a Psychroactive Siberian Permafrost Bacterium, Reveals Mechanisms for Adaptation to Low-Temperature Growth. Appl. Environ. Microbiol. 2010, 76, 2304–2312. [Google Scholar] [CrossRef]
- Copeland, A.; Lucas, S.; Lapidus, A.; Barry, K.; Detter, J.C.; Glavina del Rio, T.; Hammon, N.; Israni, S.; Dalin, E.; Tice, H.; et al. Complete Sequence of Psychromonas Ingrahamii 37; Technical Report; Released 09/14/2006 by the DOE Joint Genome Institute; DOE Joint Genome Institute: Berkeley, CA, USA, 2006.
- Copeland, A.; Lucas, S.; Lapidus, A.; Barry, K.; Detter, J.; Glavina del Rio, T.; Hammon, N.; Israni, S.; Dalin, E.; Tice, H.; et al. Complete Sequence of Shewanella Frigidimarina NCIMB 400. Submitted (Aug. Sept. 2006); Technical Report; Released 09/14/2006 by the DOE Joint Genome Institute; DOE Joint Genome Institute: Berkeley, CA, USA, 2006; NCBI:txid318167.
- Parmeciano Di Noto, G.; Vázquez, S.C.; MacCormack, W.P.; Iriarte, A.; Quiroga, C. Draft Genome of Shewanella Frigidimarina Ag06-30, a Marine Bacterium Isolated from Potter Peninsula, King George Island, Antarctica. Genome Announc. 2016, 4, e00289-16. [Google Scholar] [CrossRef]
- Kunst, F.; Ogasawara, N.; Moszer, I.; Albertini, A.M.; Alloni, G.; Azevedo, V.; Bertero, M.G.; Bessières, P.; Bolotin, A.; Borchert, S.; et al. The Complete Genome Sequence of the Gram-Positive Bacterium Bacillus Subtilis. Nature 1997, 390, 249–256. [Google Scholar] [CrossRef]
- Makino, K.; Ishii, K.; Yasunaga, T.; Hattori, M.; Yokoyama, K.; Yutsudo, C.H.; Kubota, Y.; Yamaichi, Y.; Iida, T.; Yamamoto, K.; et al. Complete Nucleotide Sequences of 93-Kb and 3.3-Kb Plasmids of an Enterohemorrhagic Escherichia Coli O157:H7 Derived from Sakai Outbreak. DNA Res. 1998, 5, 1–9. [Google Scholar] [CrossRef]
- Hayashi, T.; Makino, K.; Ohnishi, M.; Kurokawa, K.; Ishii, K.; Yokoyama, K.; Han, C.G.; Ohtsubo, E.; Nakayama, K.; Murata, T.; et al. Complete Genome Sequence of Enterohemorrhagic Escherichia Coli O157:H7 and Genomic Comparison with a Laboratory Strain K-12. DNA Res. 2001, 8, 11–22. [Google Scholar] [CrossRef]
- Silby, M.W.; Cerdeño-Tárraga, A.M.; Vernikos, G.S.; Giddens, S.R.; Jackson, R.W.; Preston, G.M.; Zhang, X.X.; Moon, C.D.; Gehrig, S.M.; Godfrey, S.A.C.; et al. Genomic and Genetic Analyses of Diversity and Plant Interactions of Pseudomonas Fluorescens. Genome Biol. 2009, 10, R51. [Google Scholar] [CrossRef] [Green Version]
- Van de Werken, H.J.G.; Verhaart, M.R.A.; VanFossen, A.L.; Willquist, K.; Lewis, D.L.; Nichols, J.D.; Goorissen, H.P.; Mongodin, E.F.; Nelson, K.E.; van Niel, E.W.J.; et al. Hydrogenomics of the Extremely Thermophilic Bacterium Caldicellulosiruptor Saccharolyticus. Appl. Environ. Microbiol. 2008, 74, 6720–6729. [Google Scholar] [CrossRef] [PubMed]
- Copeland, A.; Lucas, S.; Lapidus, A.; Barry, K.; Detter, J.; Glavina del Rio, T.; Hammon, N.; Israni, S.; Dalin, E.; Tice, H.; et al. Genome Sequence of the Thermophilic Hydrogen-Producing Bacterium Caldicellulosiruptor Saccharolyticus DSM 8903; Technical Report; Released 09/14/2006 by the DOE Joint Genome Institute; DOE Joint Genome Institute: Berkeley, CA, USA, 2007.
- Takami, H.; Takaki, Y.; Chee, G.J.; Nishi, S.; Shimamura, S.; Suzuki, H.; Matsui, S.; Uchiyama, I. Thermoadaptation Trait Revealed by the Genome Sequence of Thermophilic Geobacillus Kaustophilus. Nucleic Acids Res. 2004, 32, 6292–6303. [Google Scholar] [CrossRef] [PubMed]
- Wu, D.; Raymond, J.; Wu, M.; Chatterji, S.; Ren, Q.; Graham, J.E.; Bryant, D.A.; Robb, F.; Colman, A.; Tallon, L.J.; et al. Complete Genome Sequence of the Aerobic CO-oxidizing Thermophile Thermomicrobium Roseum. PLoS ONE 2009, 4, e4207. [Google Scholar] [CrossRef] [PubMed]
- The UniProt Consortium. UniProt: The Universal Protein Knowledgebase in 2021. Nucleic Acids Res. 2021, 49, D480–D489. [Google Scholar] [CrossRef]
- Peters, C.; Tsirigos, K.D.; Shu, N.; Elofsson, A. Improved Topology Prediction Using the Terminal Hydrophobic Helices Rule. Bioinformatics 2016, 32, 1158–1162. [Google Scholar] [CrossRef]
- Teufel, F.; Armenteros, J.J.A.; Johansen, A.R.; Gíslason, M.H.; Pihl, S.I.; Tsirigos, K.D.; Winther, O.; Brunak, S.; von Heijne, G.; Nielsen, H. SignalP 6.0 predicts all five types of signal peptides using protein language models. Nat. Biotechnol. 2022, 40, 1023–1025. [Google Scholar] [CrossRef]
- Quevillon, E.; Silventoinen, V.; Pillai, S.; Harte, N.; Mulder, N.; Apweiler, R.; Lopez, R. InterProScan: Protein Domains Identifier. Nucleic Acids Res. 2005, 33, W116–W120. [Google Scholar] [CrossRef]
- Székely, G.J.; Rizzo, M.L. Hierarchical clustering via joint between-within distances: Extending Ward’s minimum variance method. J. Classif. 2005, 22, 151–183. [Google Scholar] [CrossRef]
- Sievers, F.; Wilm, A.; Dineen, D.; Gibson, T.J.; Karplus, K.; Li, W.; Lopez, R.; McWilliam, H.; Remmert, M.; Söding, J.; et al. Fast, scalable generation of high-quality protein multiple sequence alignments using Clustal Omega. Mol. Syst. Biol. 2011, 7, 539. [Google Scholar] [CrossRef]
- Crooks, G.E.; Hon, G.; Chandonia, J.M.; Brenner, S.E. WebLogo: A sequence logo generator. Genome Res. 2004, 14, 1188–1190. [Google Scholar] [CrossRef] [Green Version]
- Yang, J.; Yan, R.; Roy, A.; Xu, D.; Poisson, J.; Zhang, Y. The I-TASSER Suite: Protein Structure and Function Prediction. Nat. Methods 2015, 12, 7–8. [Google Scholar] [CrossRef]
- Roy, A.; Kucukural, A.; Zhang, Y. I-TASSER: A Unified Platform for Automated Protein Structure and Function Prediction. Nat. Protoc. 2010, 5, 725–738. [Google Scholar] [CrossRef]
- Jumper, J.; Evans, R.; Pritzel, A.; Green, T.; Figurnov, M.; Ronneberger, O.; Tunyasuvunakool, K.; Bates, R.; ŽÃ-dek, A.; Potapenko, A.; et al. Highly accurate protein structure prediction with AlphaFold. Nature 2021, 596, 583–589. [Google Scholar] [CrossRef]
- Olsson, M.H.; Sondergaard, C.R.; Rostkowski, M.; Jensen, J.H. PROPKA3: Consistent treatment of internal and surface residues in empirical pKa predictions. J. Chem. Theory Comput. 2011, 7, 525–537. [Google Scholar] [CrossRef]
- Pettersen, E.F.; Goddard, T.D.; Huang, C.C.; Couch, G.S.; Greenblatt, D.M.; Meng, E.C.; Ferrin, T.E. UCSF Chimera—A visualization system for exploratory research and analysis. J. Comput. Chem. 2004, 25, 1605–1612. [Google Scholar] [CrossRef]
- Humphrey, W.; Dalke, A.; Schulten, K. VMD: Visual molecular dynamics. J. Mol. Graph. 1996, 14, 33–38. [Google Scholar] [CrossRef]
- Jorgensen, W.L.; Chandrasekhar, J.; Madura, J.D.; Impey, R.W.; Klein, M.L. Comparison of simple potential functions for simulating liquid water. J. Chem. Phys. 1983, 79, 926–935. [Google Scholar] [CrossRef]
- Phillips, J.C.; Braun, R.; Wang, W.; Gumbart, J.; Tajkhorshid, E.; Villa, E.; Chipot, C.; Skeel, R.D.; Kalé, L.; Schulten, K. Scalable molecular dynamics with NAMD. J. Comput. Chem. 2005, 26, 1781–1802. [Google Scholar] [CrossRef]
- Best, R.B.; Zhu, X.; Shim, J.; Lopes, P.E.; Mittal, J.; Feig, M.; Mackerell, A.D., Jr. Optimization of the additive CHARMM all-atom protein force field targeting improved sampling of the backbone ϕ, ψ and side-chain χ(1) and χ(2) dihedral angles. J. Chem. Theory Comput. 2012, 8, 3257–3273. [Google Scholar] [CrossRef]
- Huang, J.; Rauscher, S.; Nawrocki, G.; Ran, T.; Feig, M.; de Groot, B.L.; Grubmüller, H.; MacKerell, A.D. CHARMM36m: An improved force field for folded and intrinsically disordered proteins. Nat. Methods 2017, 14, 71–73. [Google Scholar] [CrossRef] [Green Version]
- Martyna, G.J.; Tobias, D.J.; Klein, M.L. Constant pressure molecular dynamics algorithms. J. Chem. Phys. 1994, 101, 4177–4189. [Google Scholar] [CrossRef]
- Feller, S.E.; Zhang, Y.; Pastor, R.W.; Brooks, B.R. Constant pressure molecular dynamics simulation: The Langevin piston method. J. Chem. Phys. 1995, 103, 4613–4621. [Google Scholar] [CrossRef]
- Grant, B.J.; Skjærven, L.; Yao, X.Q. The Bio3D Packages for Structural Bioinformatics. Protein Sci. 2021, 30, 20–30. [Google Scholar] [CrossRef] [PubMed]
- Pacios, L.F. Distinct Molecular Surfaces and Hydrophobicity of Amino Acid Residues in Proteins. J. Chem. Inf. Comput. Sci. 2001, 41, 1427–1435. [Google Scholar] [CrossRef] [PubMed]
- Kyte, J.; Doolittle, R.F. A Simple Method for Displaying the Hydropathic Character of a Protein. J. Mol. Biol. 1982, 157, 105–132. [Google Scholar] [CrossRef]
- Benson, N.C.; Daggett, V. A Chemical Group Graph Representation for Efficient High-Throughput Analysis of Atomistic Protein Simulations. J. Bioinform. Comput. Biol. 2012, 10, 1250008. [Google Scholar] [CrossRef]
- Butts, C.T.; Zhang, X.; Kelly, J.E.; Roskamp, K.W.; Unhelkar, M.H.; Freites, J.A.; Tahir, S.; Martin, R.W. Sequence Comparison, Molecular Modeling, and Network Analysis Predict Structural Diversity in Cysteine Proteases from the Cape Sundew, Drosera Capensis. Comput. Struct. Biotechnol. J. 2016, 14, 271–282. [Google Scholar] [CrossRef]
- Unhelkar, M.H.; Duong, V.T.; Enendu, K.N.; Kelly, J.E.; Tahir, S.; Butts, C.T.; Martin, R.W. Structure Prediction and Network Analysis of Chitinases from the Cape Sundew, Drosera Capensis. Biochim. Biophys. Acta Gen. Subj. 2017, 1861, 636–643. [Google Scholar] [CrossRef]
- Butts, C.T. Social Network Analysis with sna. J. Stat. Softw. 2008, 24, 1–51. [Google Scholar] [CrossRef]
- Butts, C.T. Network: A Package for Managing Relational Data in R. J. Stat. Softw. 2008, 24, 1–36. [Google Scholar] [CrossRef] [Green Version]
- R Core Team. R: A Language and Environment for Statistical Computing; R Foundation for Statistical Computing: Vienna, Austria, 2022. [Google Scholar]
- Grant, B.J.; Rodrigues, A.P.C.; ElSawy, K.M.; McCammon, J.A.; Caves, L.S.D. Bio3d: An R Package for the Comparative Analysis of Protein Structures. Bioinformatics 2006, 22, 2695–2696. [Google Scholar] [CrossRef]
- Cho, Y.; Saul, L.K. Analysis and Extension of Arc-Cosine Kernels for Large Margin Classification. arXiv 2011, arXiv:1112.3712. [Google Scholar]
- Eddelbuettel, D.; Francois, R. Rcpp: Seamless R and C++ Integration. J. Stat. Softw. 2011, 40, 1–18. [Google Scholar] [CrossRef]
- Grazioli, G.; Martin, R.W.; Butts, C.T. Comparative Exploratory Analysis of Intrinsically Disordered Protein Dynamics Using Machine Learning and Network Analytic Methods. Front. Mol. Biosci. 2019, 6, 42. [Google Scholar] [CrossRef]
- Therneau, T.; Atkinson, B.; Ripley, B. Rpart: Recursive Partitioning and Regression Trees. 2022. Available online: https://cran.r-project.org/web/packages/rpart/index.html (accessed on 25 October 2022).
- Haney, P.J.; Badger, J.H.; Buldak, G.L.; Reich, C.I.; Woese, C.R.; Olsen, G.J. Thermal adaptation analyzed by comparison of protein sequences from mesophilic and extremely thermophilic Methanococcus Species. Proc. Natl. Acad. Sci. USA 1999, 96, 3578–3583. [Google Scholar] [CrossRef]
- Beeby, M.; O’Connor, B.D.; Ryttersgaard, C.; Boutz, D.R.; Perry, L.J.; Yeates, T.O. The genomics of disulfide bonding and protein stabilization in thermophiles. PLoS Biol. 2005, 3, e309. [Google Scholar] [CrossRef]
- Appleby, T.C.; Mathews, I.I.; Porcelli, M.; Cacciapuoti, G.; Ealick, S.E. Three-Dimensional Structure of a Hyperthermophilic 5′-Deoxy-5′-Methylthioadenosine Phosphorylase from Sulfolobus Solfataricus*. J. Biol. Chem. 2001, 276, 39232–39242. [Google Scholar] [CrossRef]
- Kumar, S.; Nussinov, R. How do thermophilic proteins deal with heat? Cell. Mol. Life Sci. 2001, 58, 1216–1233. [Google Scholar] [CrossRef]
- Li, W.F.; Zhou, X.X.; Lu, P. Structural features of thermozymes. Biotechnol. Adv. 2005, 23, 271–281. [Google Scholar] [CrossRef]
- Goffin, C.; Ghuysen, J.M. Biochemistry and comparative genomics of SxxK superfamily acyltransferases offer a clue to the mycobacterial paradox: Presence of penicillin-susceptible target proteins versus lack of efficiency of penicillin as therapeutic agent. Microbiol. Mol. Biol. Rev. 2002, 66, 702–738. [Google Scholar] [CrossRef]
- Alexander, J.A.N.; Chatterjee, S.S.; Hamilton, S.M.; Eltis, L.D.; Chambers, H.F.; Strynadka, N.C.J. Structural and kinetic analyses of penicillin-binding protein 4 (PBP4)-mediated antibiotic resistance in Staphylococcus Aureus. J. Bacteriol. 2010, 192, 134–144. [Google Scholar] [CrossRef] [PubMed] [Green Version]
- Gordon, E.; Mouz, N.; Duee, E.; Dideberg, O. The crystal structure of the penicillin-binding protein 2× from Streptococcus Pneumoniae Its Acyl-Enzym. Form: Implication Drug Resist. J. Mol. Biol. 2000, 299, 477–485. [Google Scholar] [CrossRef] [PubMed]
- Sauvage, E.; Duez, C.; Herman, R.; Kerff, F.; Petrella, S.; Anderson, J.W.; Adediran, S.A.; Pratt, R.F.; Frère, J.M.; Charlier, P. Crystal structure of the Bacillus Subtilis Penicillin-Bind. Protein 4a, Its Complex A Pept. Mimetic Pept. J. Mol. Biol. 2007, 371, 528–539. [Google Scholar] [CrossRef] [PubMed]
- Kabsch, W.; Sander, C. Dictionary of Protein Secondary Structure: Pattern Recognition of Hydrogen-Bonded and Geometrical Features. Biopolymers 1983, 22, 2577–2637. [Google Scholar] [CrossRef] [PubMed]
- Vieille, C.; Zeikus, G.J. Hyperthermophilic Enzymes: Sources, Uses, and Molecular Mechanisms for Thermostability. Microbiol. Mol. Biol. Rev. 2001, 65, 1–43. [Google Scholar] [CrossRef]
- Cao, X.; He, Y.; Hu, Y.; Zhang, X.; Wang, Y.; Zou, Z.; Chen, Y.; Blissard, G.W.; Kanost, M.R.; Jiang, H. Sequence conservation, phylogenetic relationships, and expression profiles of nondigestive serine proteases and serine protease homologs in Manduca Sexta. Insect Biochem. Mol. Biol. 2015, 62, 51–63. [Google Scholar] [CrossRef]
- Smith, G.; Kelly, J.E.; Macias-Muñoz, A.; Butts, C.; Martin, R.W.; Briscoe, A.D. Evolutionary and Structural Analyses Uncover a Role for Solvent Interactions in the Diversification of Cocoonases in Butterflies. Proc. R. Soc. Ser. B 2018, 285, 20172037. [Google Scholar] [CrossRef]
- Duong, V.T.; Unhelkar, M.H.; Kelly, J.E.; Kim, S.H.; Butts, C.T.; Martin, R.W. Protein Structure Networks Provide Insight into Active Site Flexibility in Esterase/Lipases from the Carnivorous Plant Dros. Capensis. Integr. Biol. 2018, 10, 768–779. [Google Scholar] [CrossRef]
- Smith, J.D.; Kumarasiri, M.; Zhang, W.; Hesek, D.; Lee, M.; Toth, M.; Vakulenko, S.; Fisher, J.F.; Mobashery, S.; Chen, Y. Structural analysis of the role of Pseudomonas Aeruginosa Penicillin-Bind. Protein 5 β-Lact. Resist. Antimicrob. Agents Chemother. 2013, 57, 3137–3146. [Google Scholar] [CrossRef]
- Gierasch, L.M. Signal sequences. Biochemistry 1989, 28, 923–930. [Google Scholar] [CrossRef]
- Martoglio, B.; Dobberstein, B. Signal sequences: More than just greasy peptides. Trends Cell Biol. 1998, 8, 410–415. [Google Scholar] [CrossRef]
- Von Heijne, G. Signal sequences: The limits of variation. J. Mol. Biol. 1985, 184, 99–105. [Google Scholar] [CrossRef]
- Kumar, V.; Sharma, N.; Bhalla, T.C. In Silico Analysis of β-Galactosidases Primary and Secondary Structure in relation to Temperature Adaptation. J. Amino Acids 2014, 2014, e475839. [Google Scholar] [CrossRef]
- Karshikoff, A.; Ladenstein, R. Proteins from Thermophilic and Mesophilic Organisms Essentially Do Not Differ in Packing. Protein Eng. Des. Sel. 1998, 11, 867–872. [Google Scholar] [CrossRef]
- Sen, S.; Sarkar, M. Insights on Rigidity and Flexibility at the Global and Local Levels of Protein Structures and Their Roles in Homologous Psychrophilic, Mesophilic, and Thermophilic Proteins: A Computational Study. J. Chem. Inf. Model. 2022, 62, 1916–1932. [Google Scholar] [CrossRef]
- Amadei, A.; Del Galdo, S.; D’Abramo, M. Density Discriminates between Thermophilic and Mesophilic Proteins. J. Biomol. Struct. Dyn. 2018, 36, 3265–3273. [Google Scholar] [CrossRef]
- Szilágyi, A.; Závodszky, P. Structural Differences between Mesophilic, Moderately Thermophilic and Extremely Thermophilic Protein Subunits: Results of a Comprehensive Survey. Structure 2000, 8, 493–504. [Google Scholar] [CrossRef]
- Chan, C.H.; Yu, T.H.; Wong, K.B. Stabilizing Salt-Bridge Enhances Protein Thermostability by Reducing the Heat Capacity Change of Unfolding. PLoS ONE 2011, 6, e21624. [Google Scholar] [CrossRef]
- Kannan, N.; Vishveshwara, S. Aromatic Clusters: A Determinant of Thermal Stability of Thermophilic Proteins. Protein Eng. Des. Sel. 2000, 13, 753–761. [Google Scholar] [CrossRef]
- Radestock, S.; Gohlke, H. Protein Rigidity and Thermophilic Adaptation. Proteins Struct. Funct. Bioinform. 2011, 79, 1089–1108. [Google Scholar] [CrossRef]
- Wells, S.A.; Crennell, S.J.; Danson, M.J. Structures of Mesophilic and Extremophilic Citrate Synthases Reveal Rigidity and Flexibility for Function. Proteins Struct. Funct. Bioinform. 2014, 82, 2657–2670. [Google Scholar] [CrossRef] [PubMed] [Green Version]
- D’Amico, S.; Gerday, C.; Feller, G. Structural Determinants of Cold Adaptation and Stability in a Large Protein*. J. Biol. Chem. 2001, 276, 25791–25796. [Google Scholar] [CrossRef] [PubMed]
- Niu, C.; Zhu, L.; Zhu, P.; Li, Q. Lysine-Based Site-Directed Mutagenesis Increased Rigid β-Sheet Structure and Thermostability of Mesophilic 1,3–1,4-β-Glucanase. J. Agric. Food Chem. 2015, 63, 5249–5256. [Google Scholar] [CrossRef] [PubMed]


Disclaimer/Publisher’s Note: The statements, opinions and data contained in all publications are solely those of the individual author(s) and contributor(s) and not of MDPI and/or the editor(s). MDPI and/or the editor(s) disclaim responsibility for any injury to people or property resulting from any ideas, methods, instructions or products referred to in the content. |
© 2023 by the authors. Licensee MDPI, Basel, Switzerland. This article is an open access article distributed under the terms and conditions of the Creative Commons Attribution (CC BY) license (https://creativecommons.org/licenses/by/4.0/).
Share and Cite
Diessner, E.M.; Takahashi, G.R.; Martin, R.W.; Butts, C.T. Comparative Modeling and Analysis of Extremophilic D-Ala-D-Ala Carboxypeptidases. Biomolecules 2023, 13, 328. https://doi.org/10.3390/biom13020328
Diessner EM, Takahashi GR, Martin RW, Butts CT. Comparative Modeling and Analysis of Extremophilic D-Ala-D-Ala Carboxypeptidases. Biomolecules. 2023; 13(2):328. https://doi.org/10.3390/biom13020328
Chicago/Turabian StyleDiessner, Elizabeth M., Gemma R. Takahashi, Rachel W. Martin, and Carter T. Butts. 2023. "Comparative Modeling and Analysis of Extremophilic D-Ala-D-Ala Carboxypeptidases" Biomolecules 13, no. 2: 328. https://doi.org/10.3390/biom13020328