
Cholesterol and Sphingomyelin Polarize at the Leading Edge of Migrating Myoblasts and Involve Their Clustering in Submicrometric Domains
 , and
, and 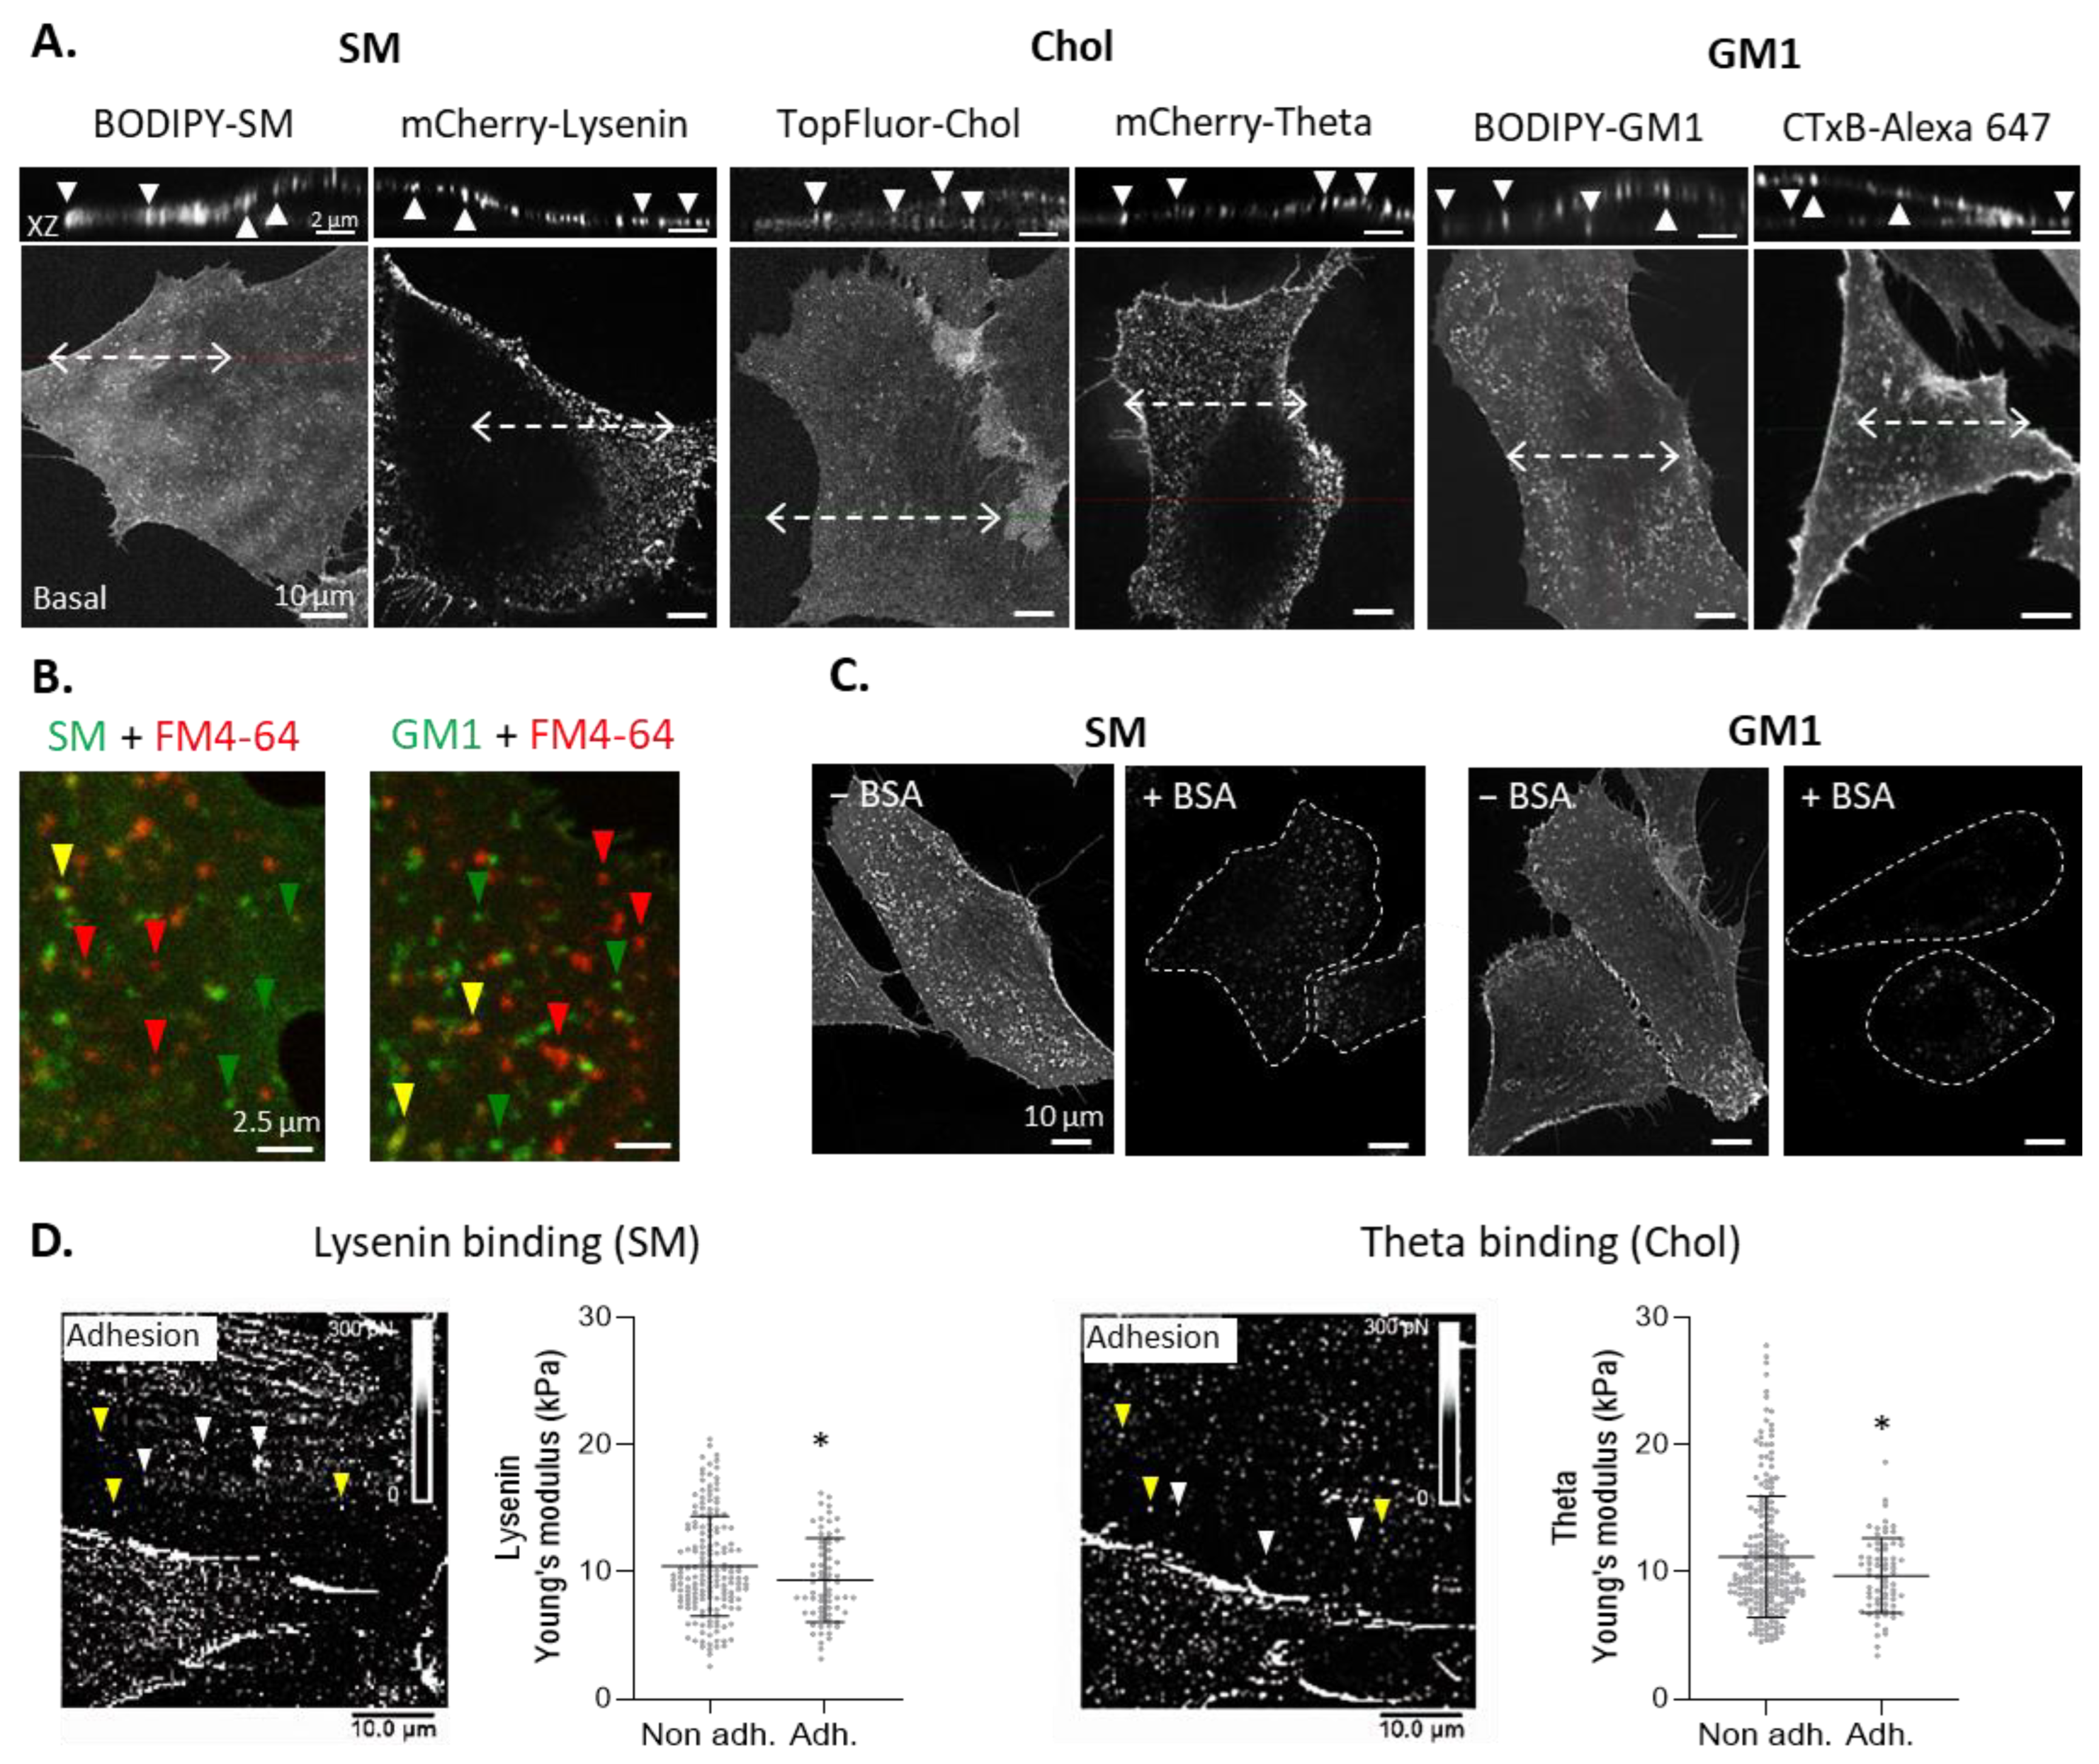
Abstract
:1. Introduction
2. Materials and Methods
2.1. Cell Culture and Chemical Treatments
2.2. Cholesterol Content Determination
2.3. Sphingomyelin Content Determination
2.4. Confocal Live Cell Imaging of Plasma Membrane Sphingomyelin, Cholesterol, GM1 Ganglioside, Non-Specific Membrane Staining, and Actin on Resting and Migrating Myoblasts
2.5. Quantifications of Surface Lipid Labeling, Lipid Colocalization, and Domain Proportion and Abundance
2.6. Atomic Force Microscopy and Quantification
2.7. Spontaneous Migration Assay
2.8. Oriented Migration Assay
2.9. Focal Adhesion and Actin Cytoskeleton (Immuno)Fluorescence and Quantification
2.10. Fluorescence Recovery after Photobleaching
2.11. Statistical Analyses
3. Results
3.1. Sphingomyelin-, Cholesterol-, and GM1 Ganglioside-Enriched Domains Can Be Evidenced at the Myoblast Surface
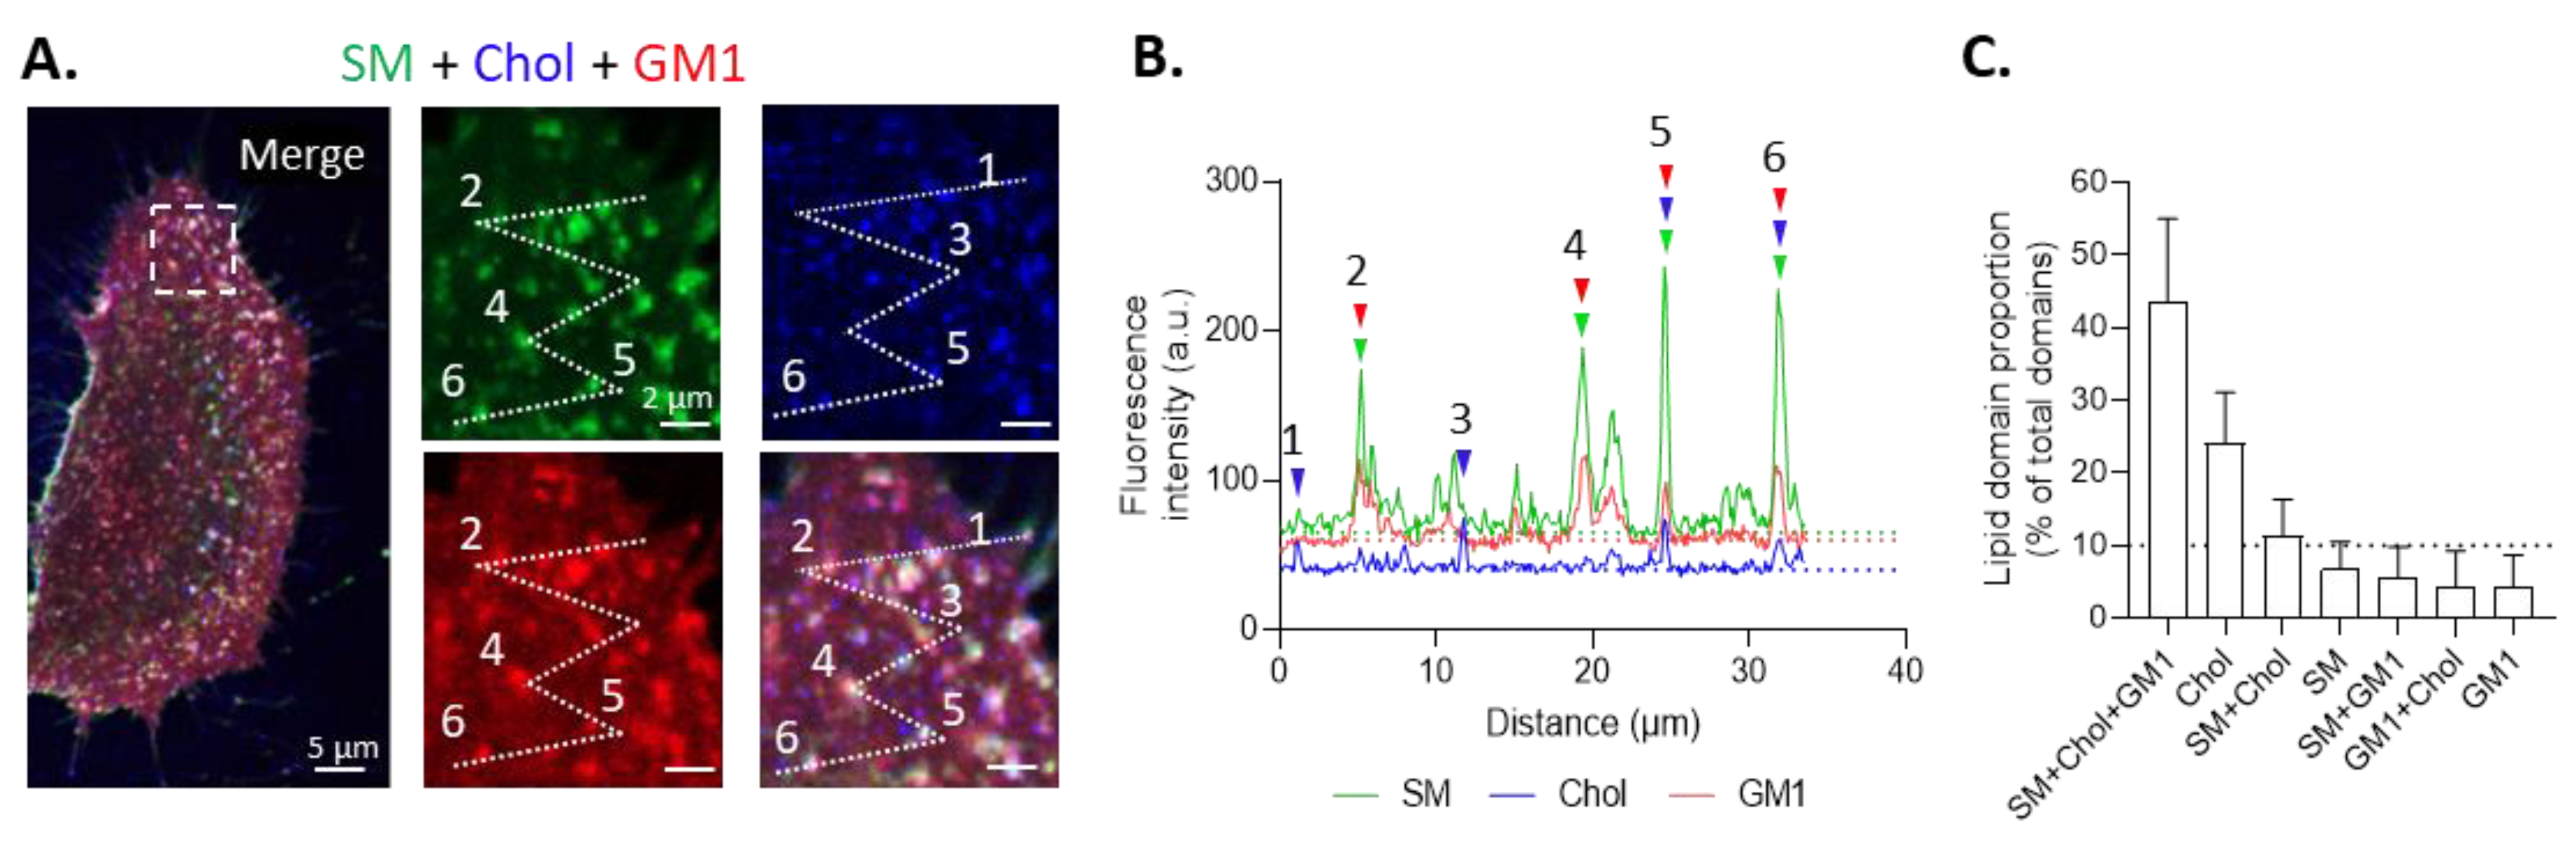
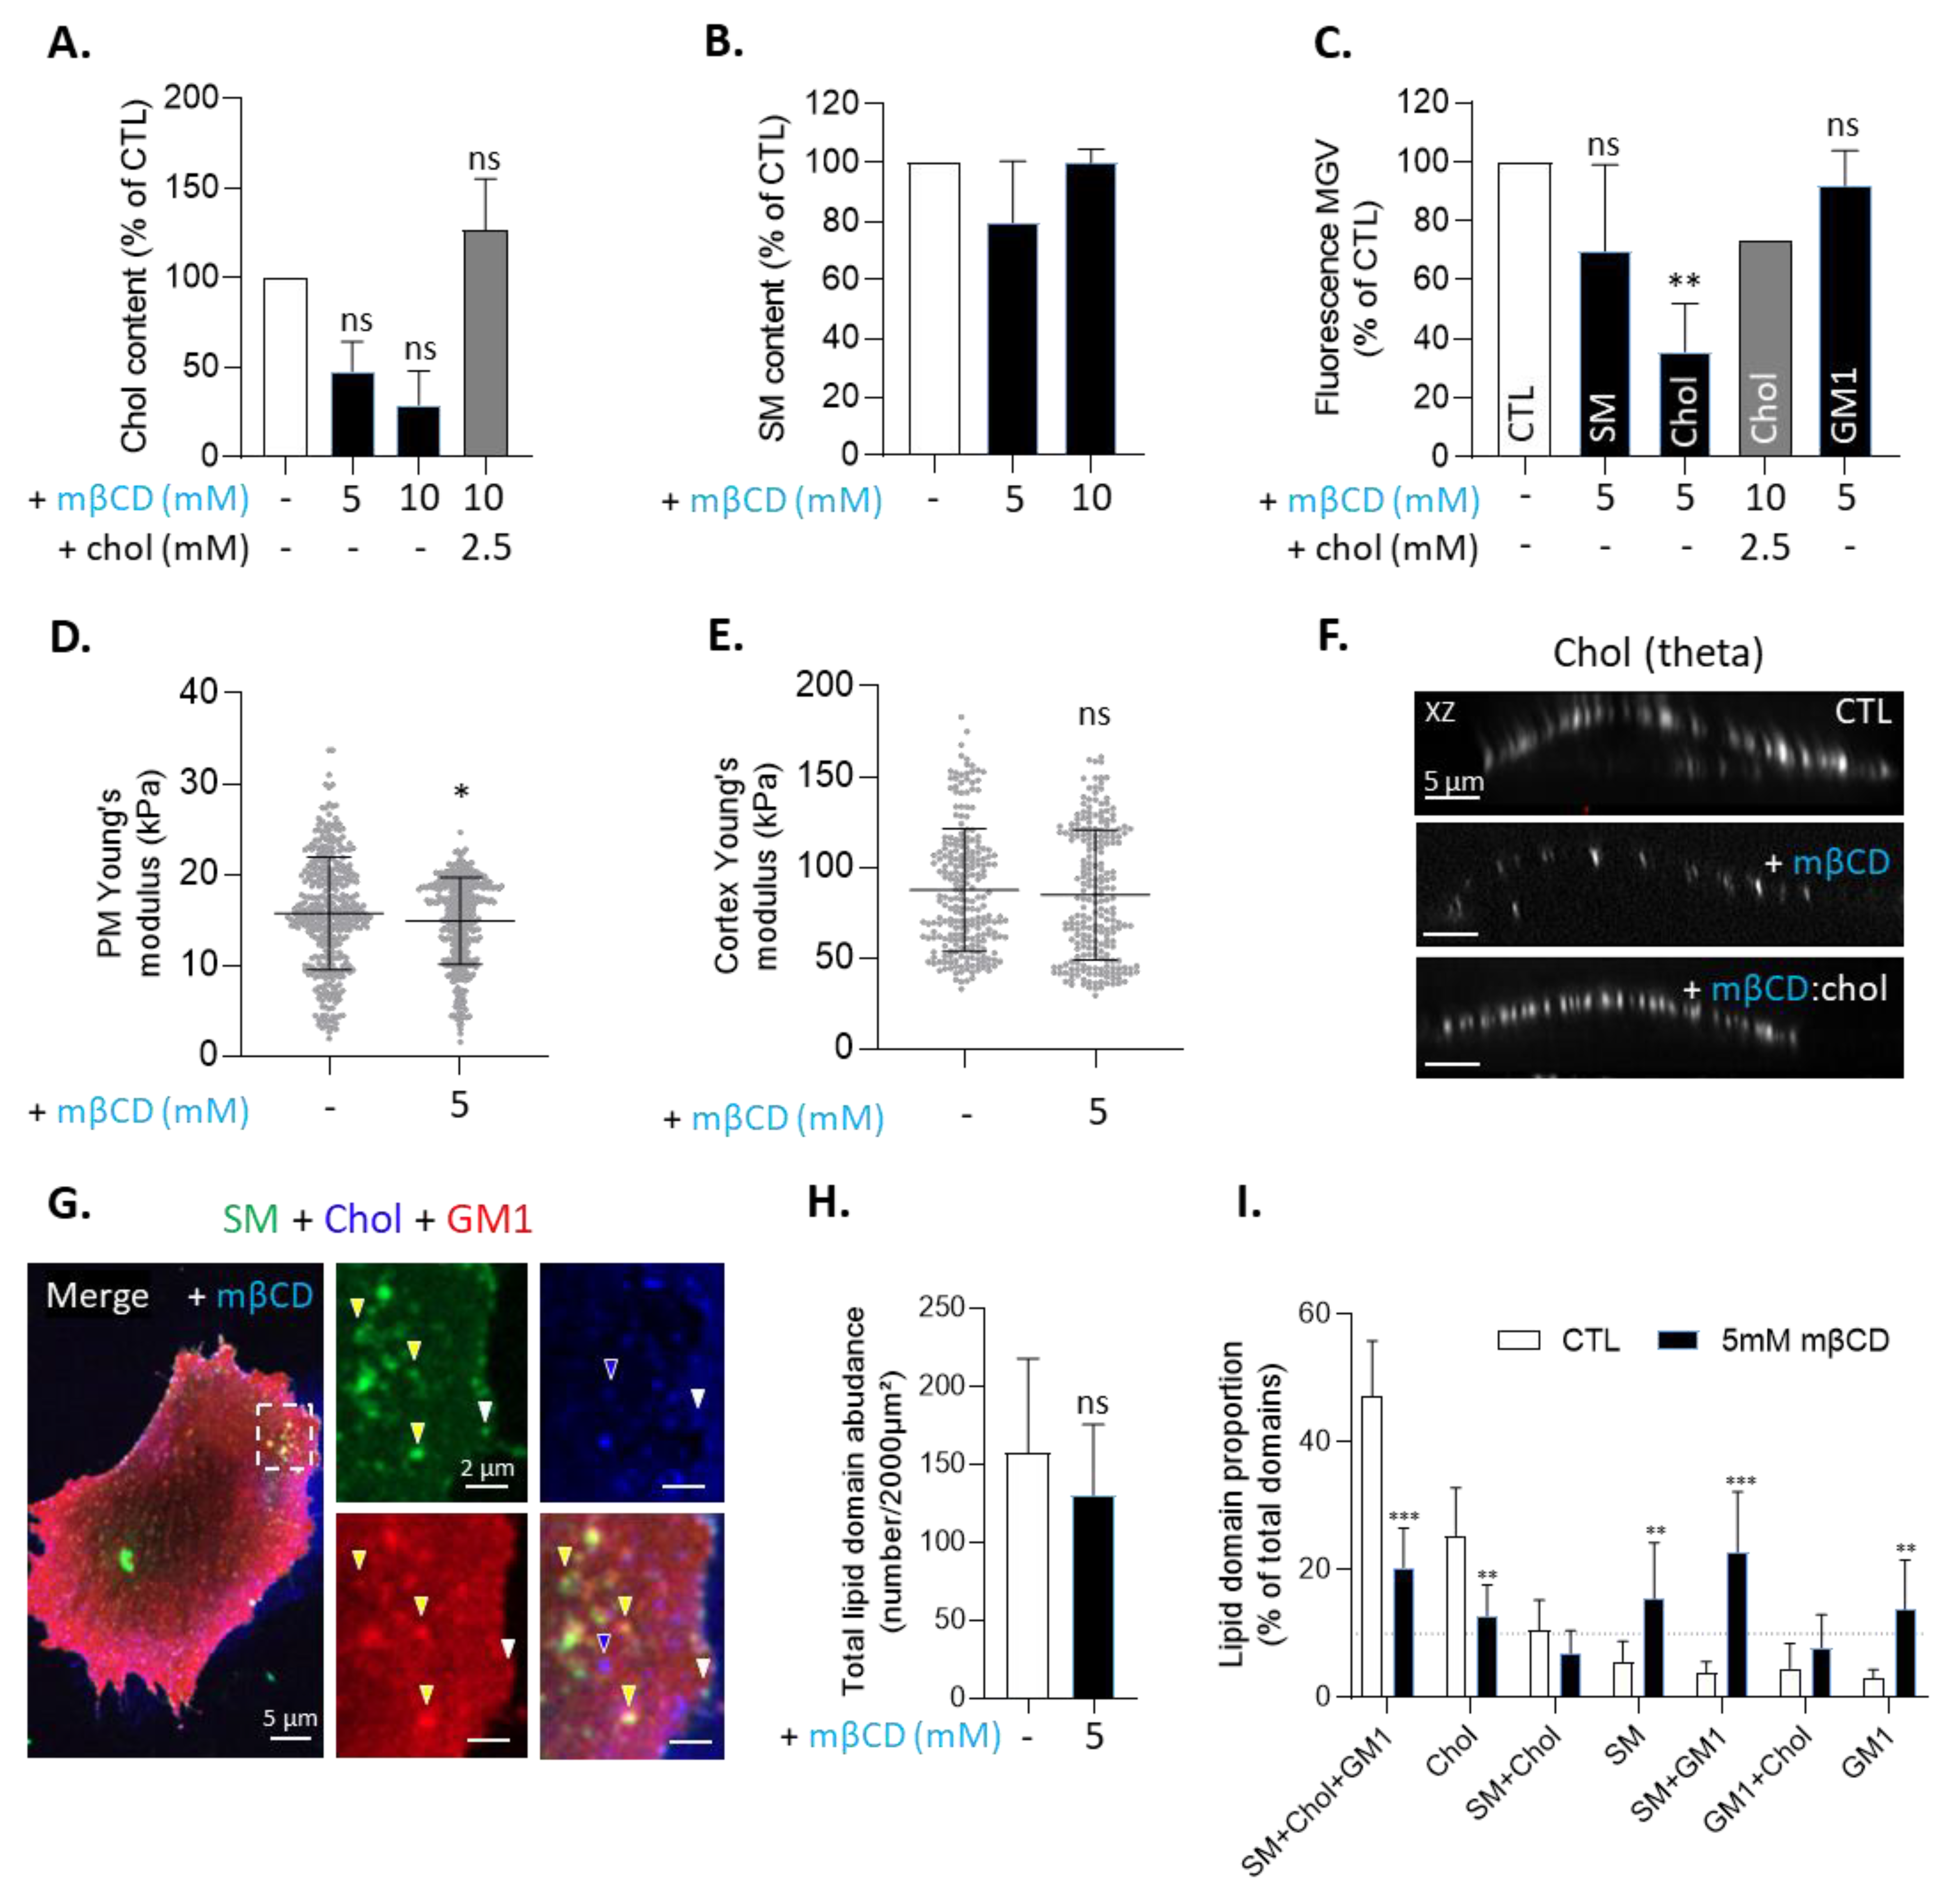
3.2. Two Main Types of Domains, Enriched in SM/Chol/GM1 or in Chol, and Sensitive to Cholesterol Depletion, Coexist at the Myoblast Surface
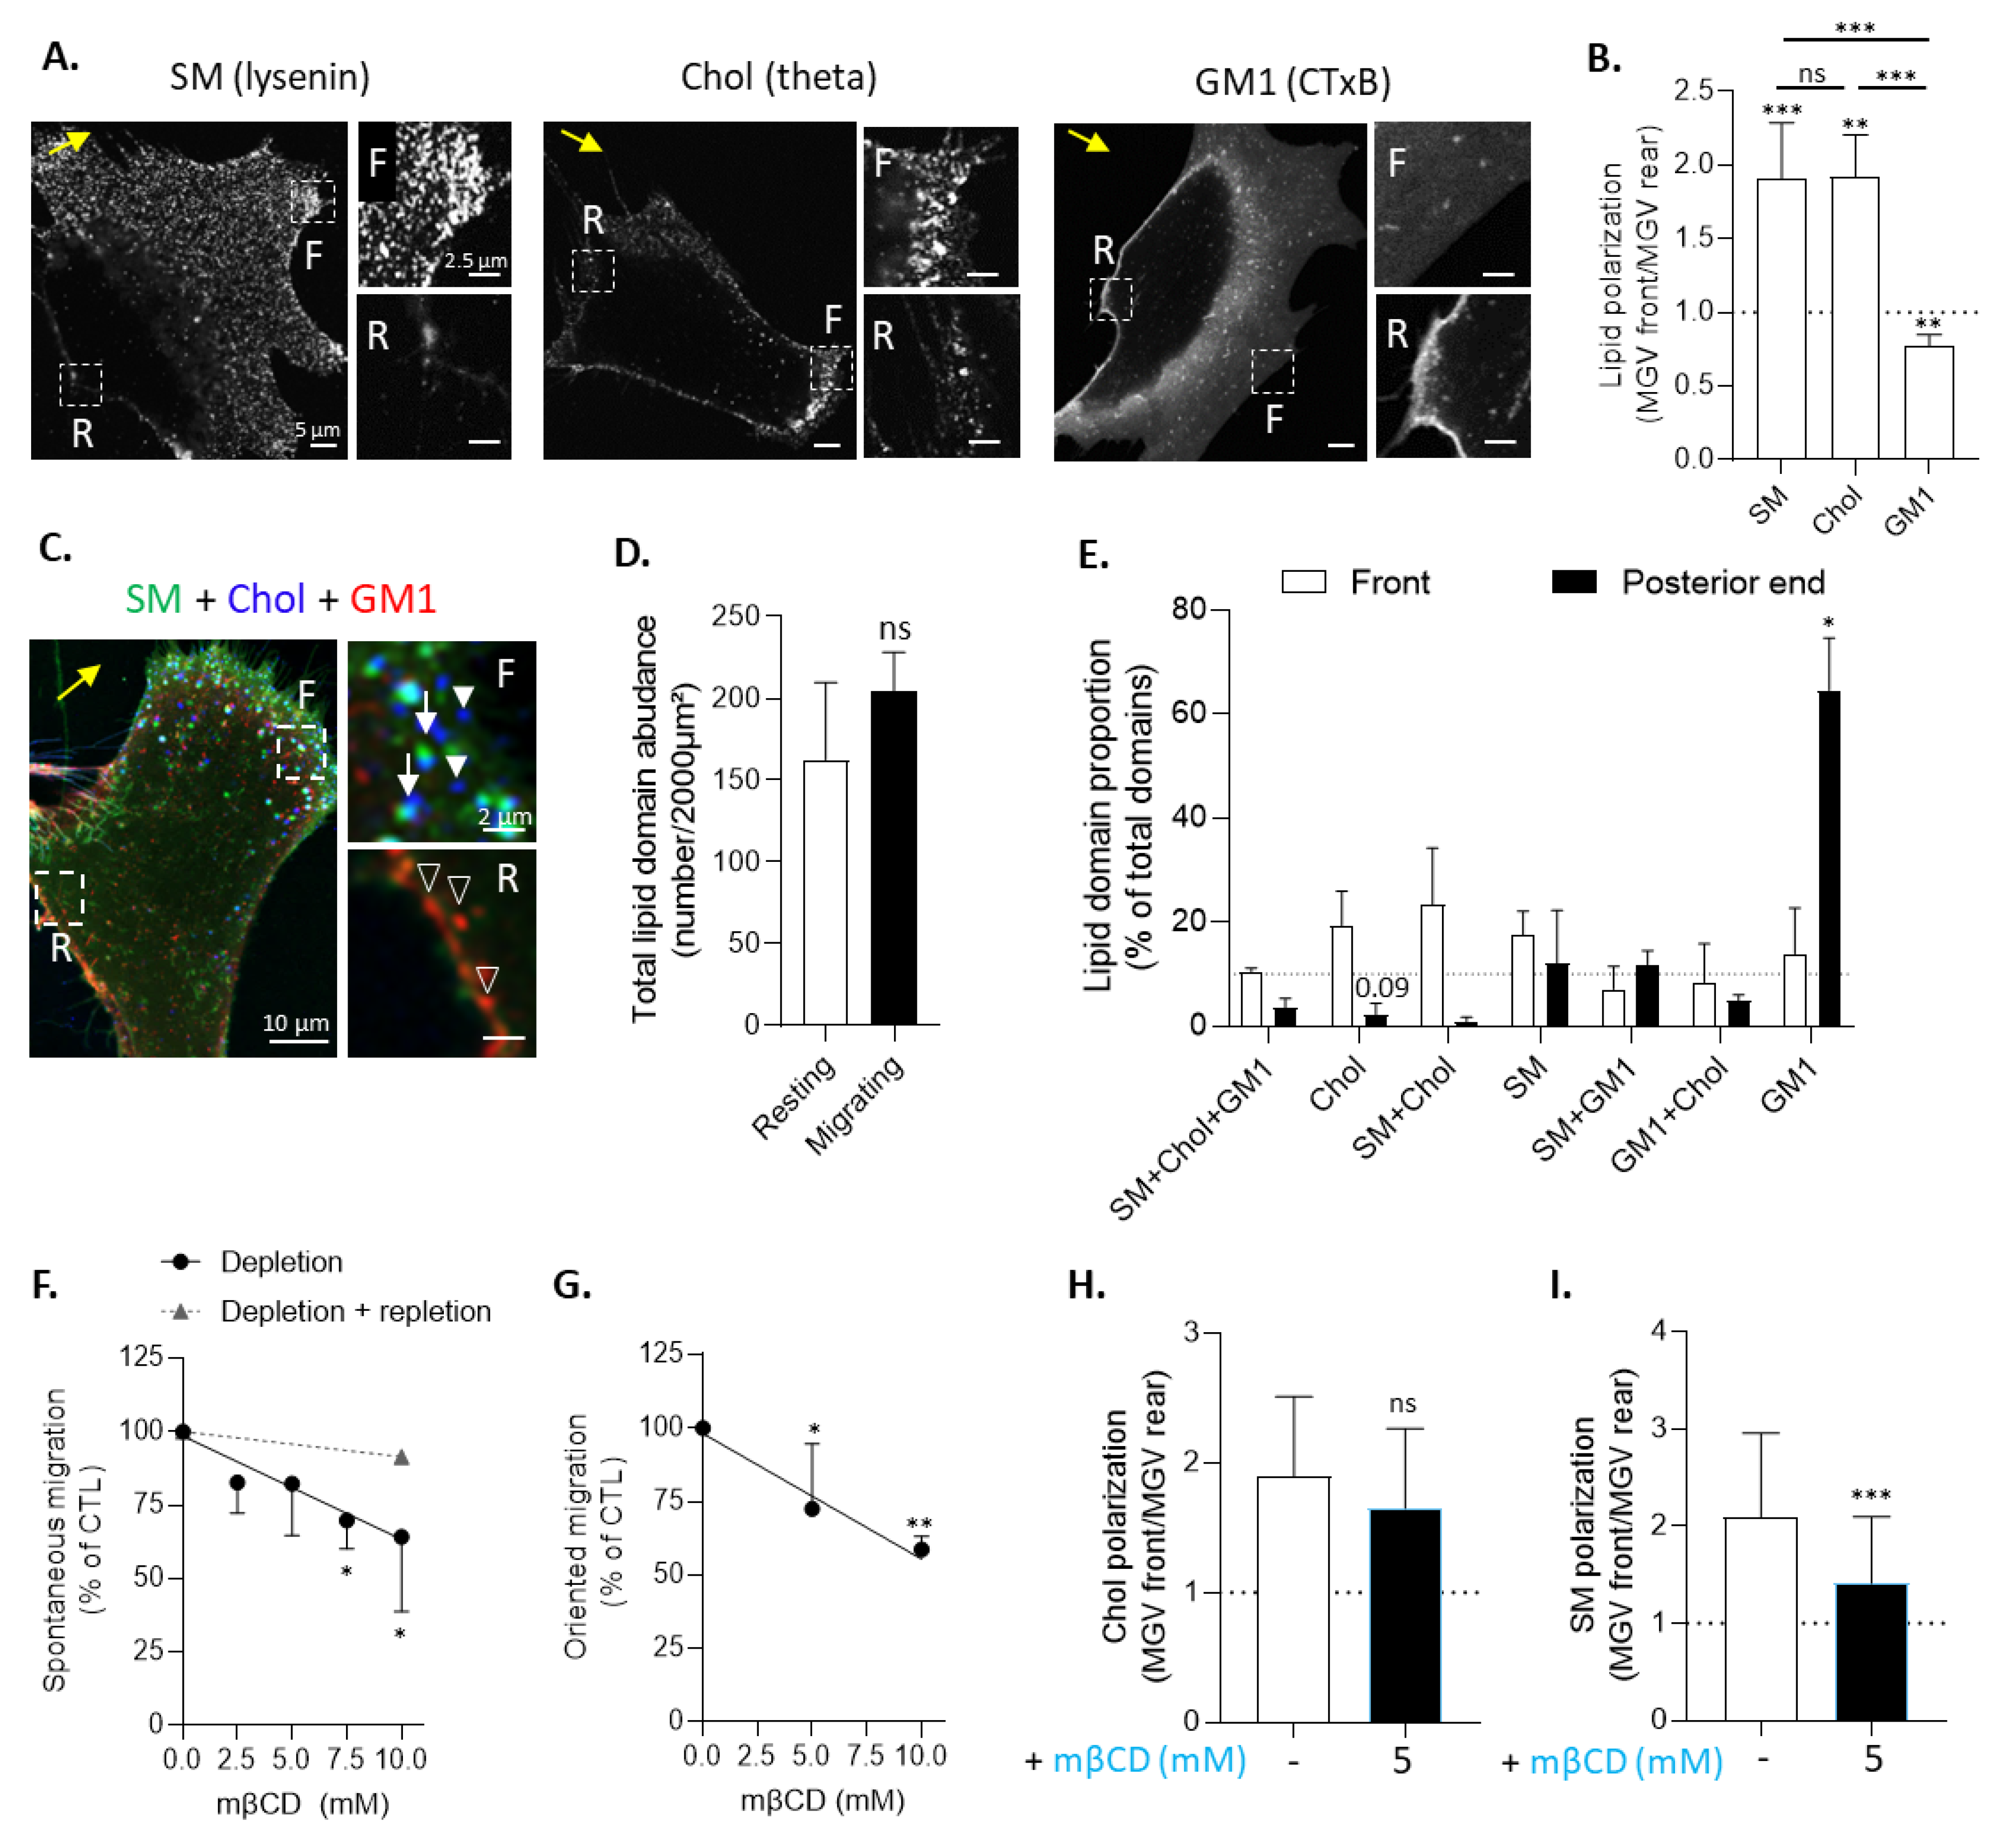
3.3. Chol- and SM/Chol-Enriched Domains Polarize at the Leading Edge and GM1-Enriched Domains at the Trailing Edge of Migrating Myoblasts
3.4. Cholesterol Depletion Impairs Myoblast Migration and Sphingomyelin Polarization
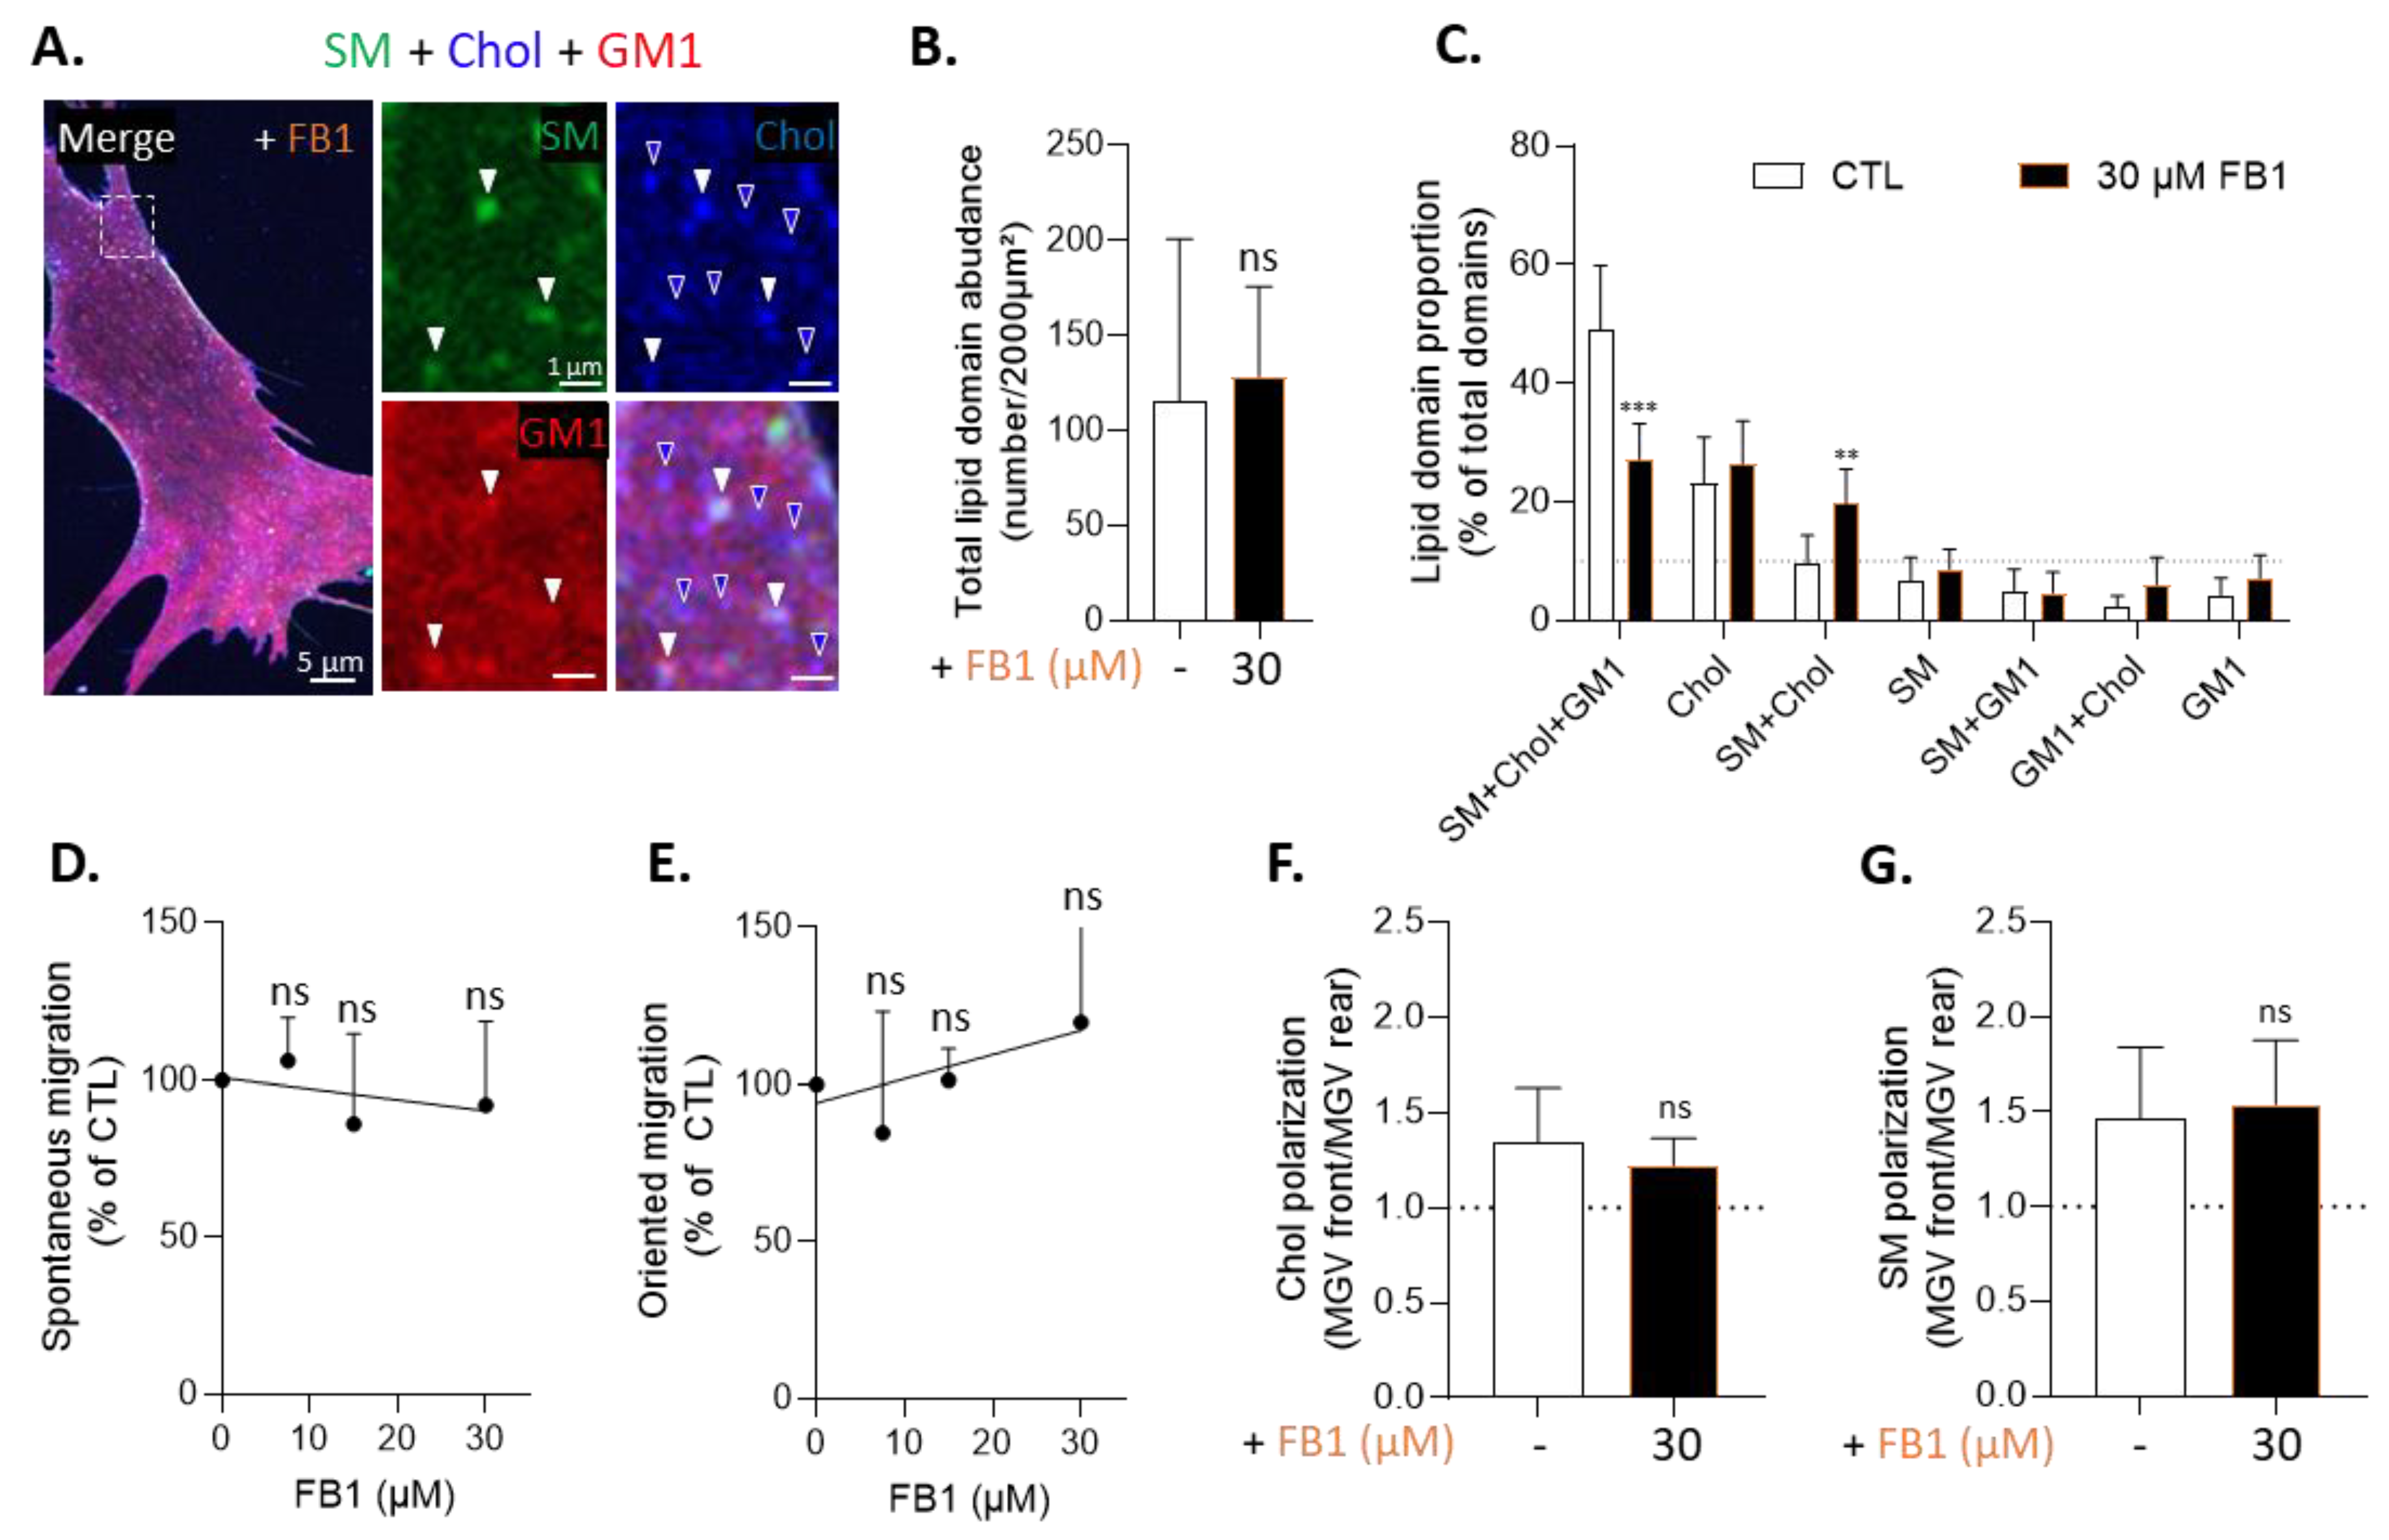
3.5. Sphingolipid Depletion Does Not Impair Chol-Enriched Domain Proportion at Resting State Neither Myoblast Migration nor Cholesterol and Sphingomyelin Polarization
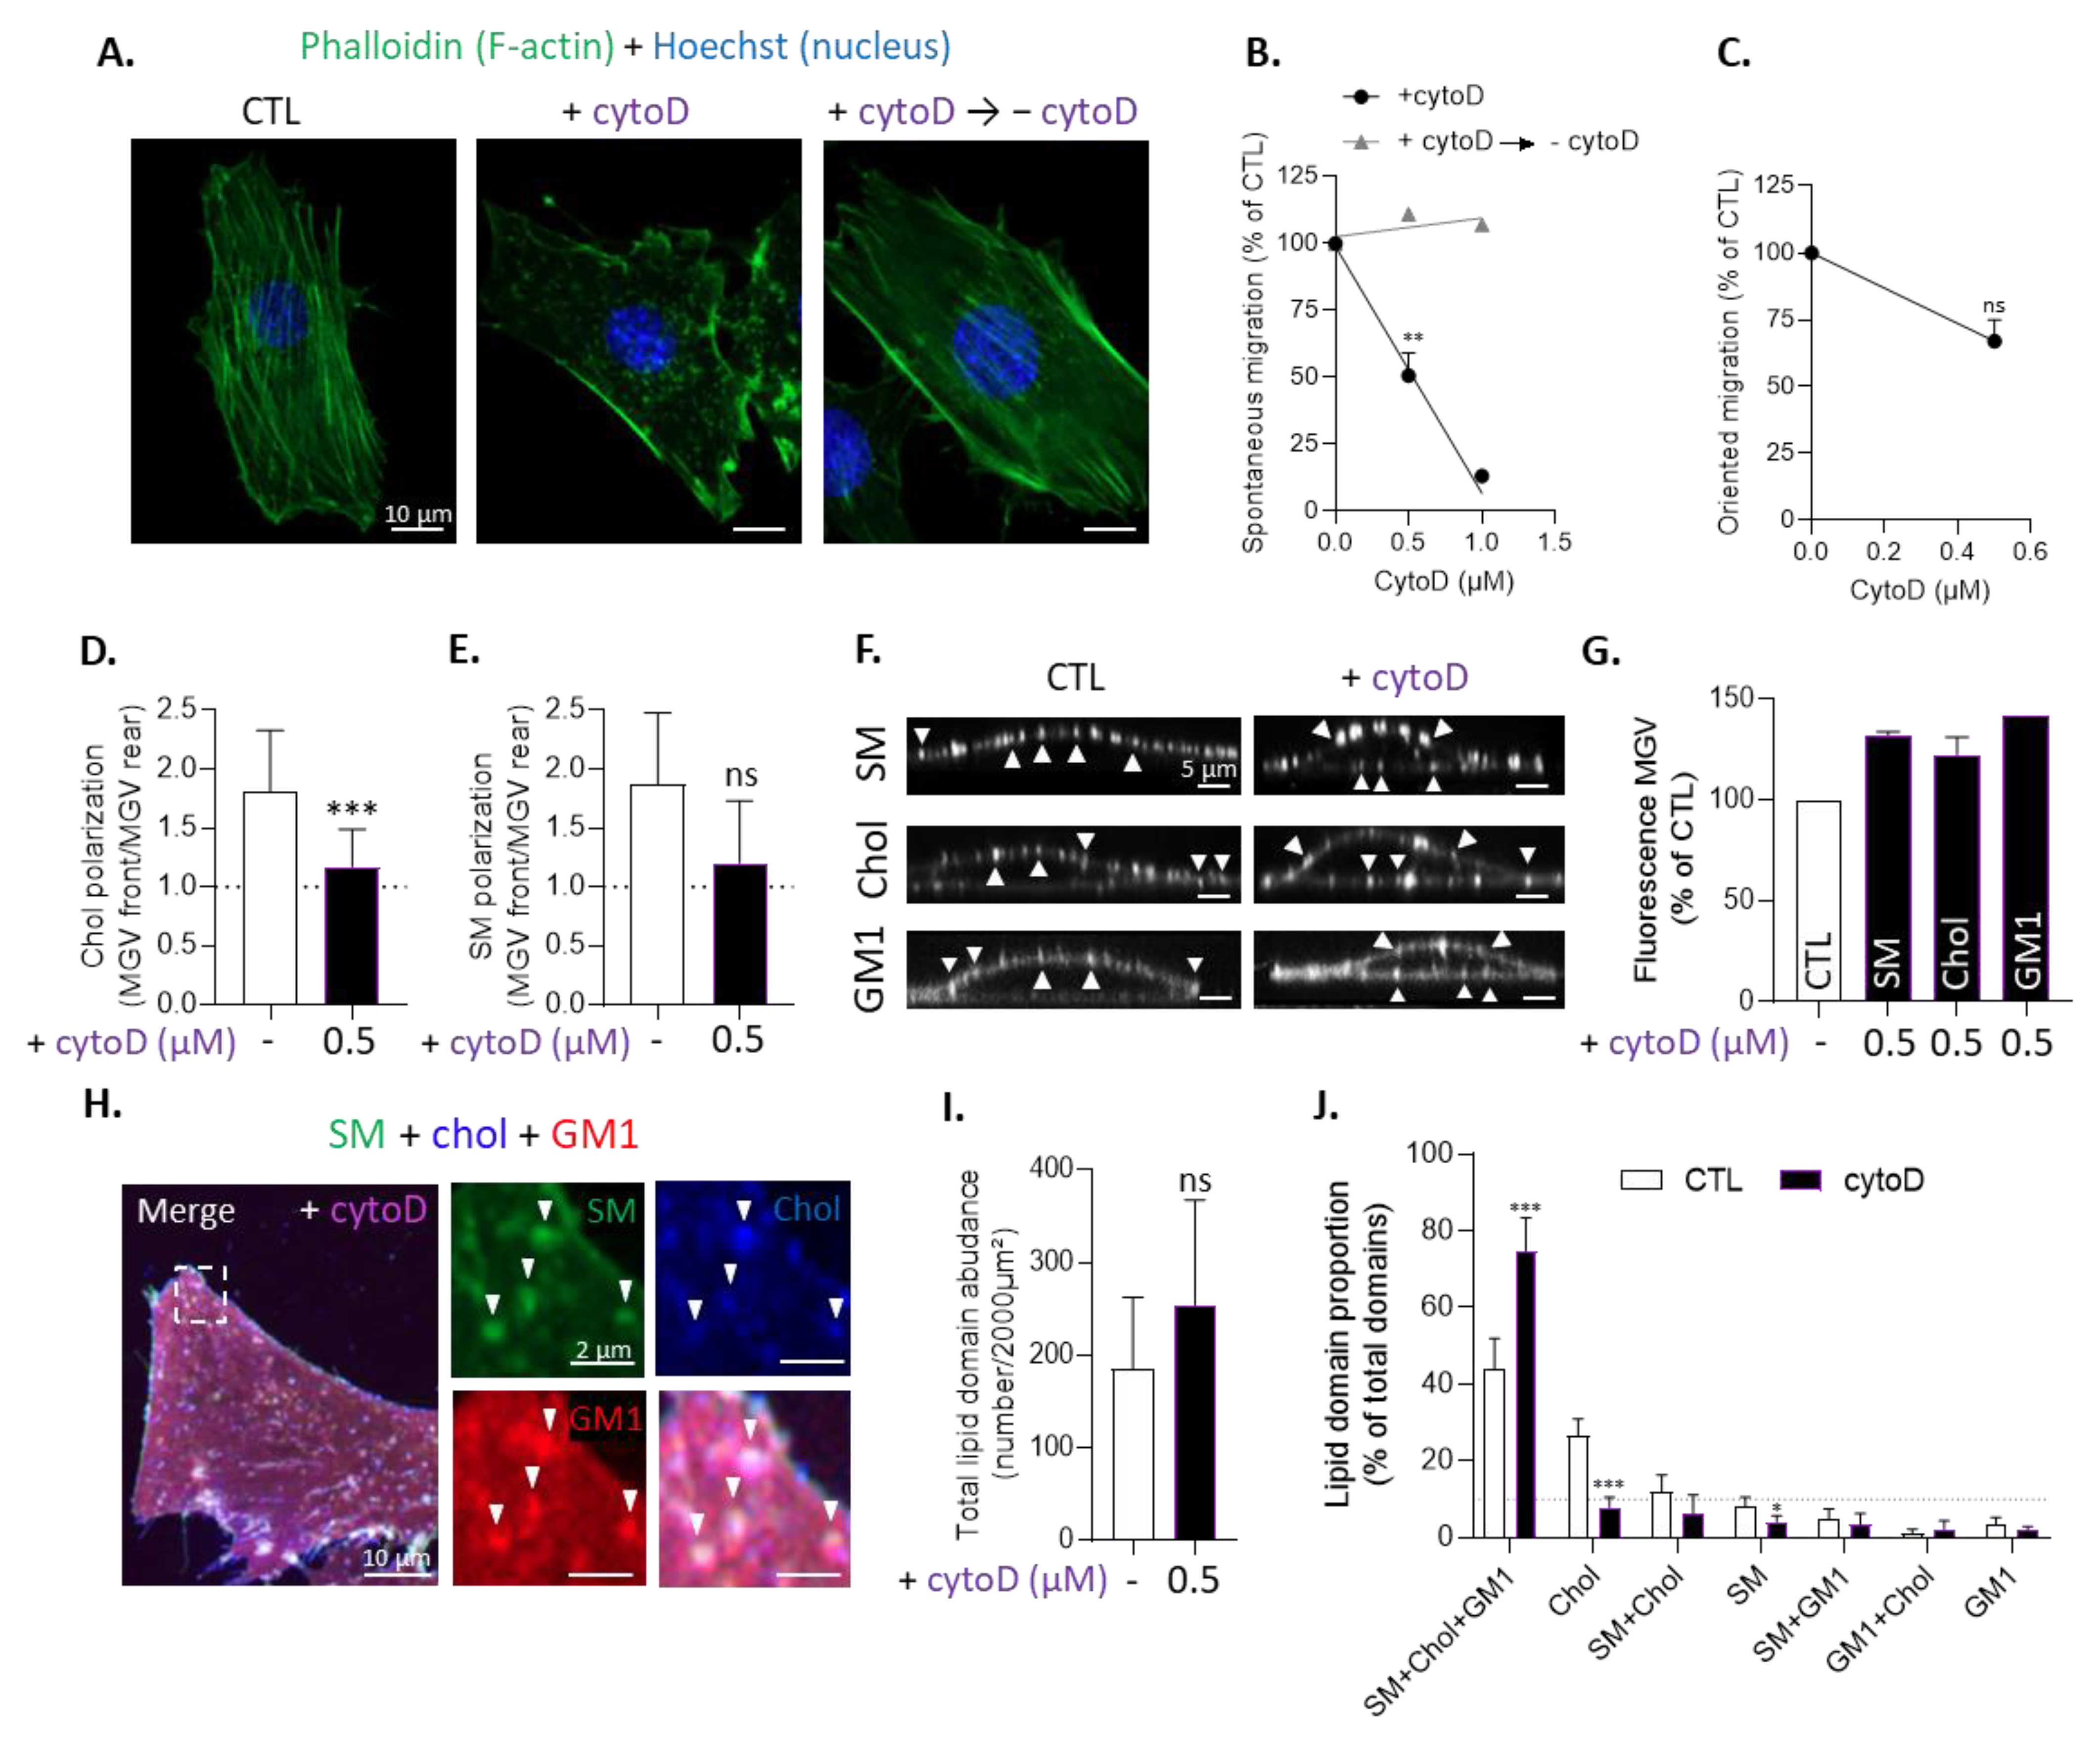
3.6. Inhibition of Actin Polymerization Impairs Chol-Enriched Domain Proportion at Resting State, Myoblast Migration and Cholesterol and Sphingomyelin Polarization
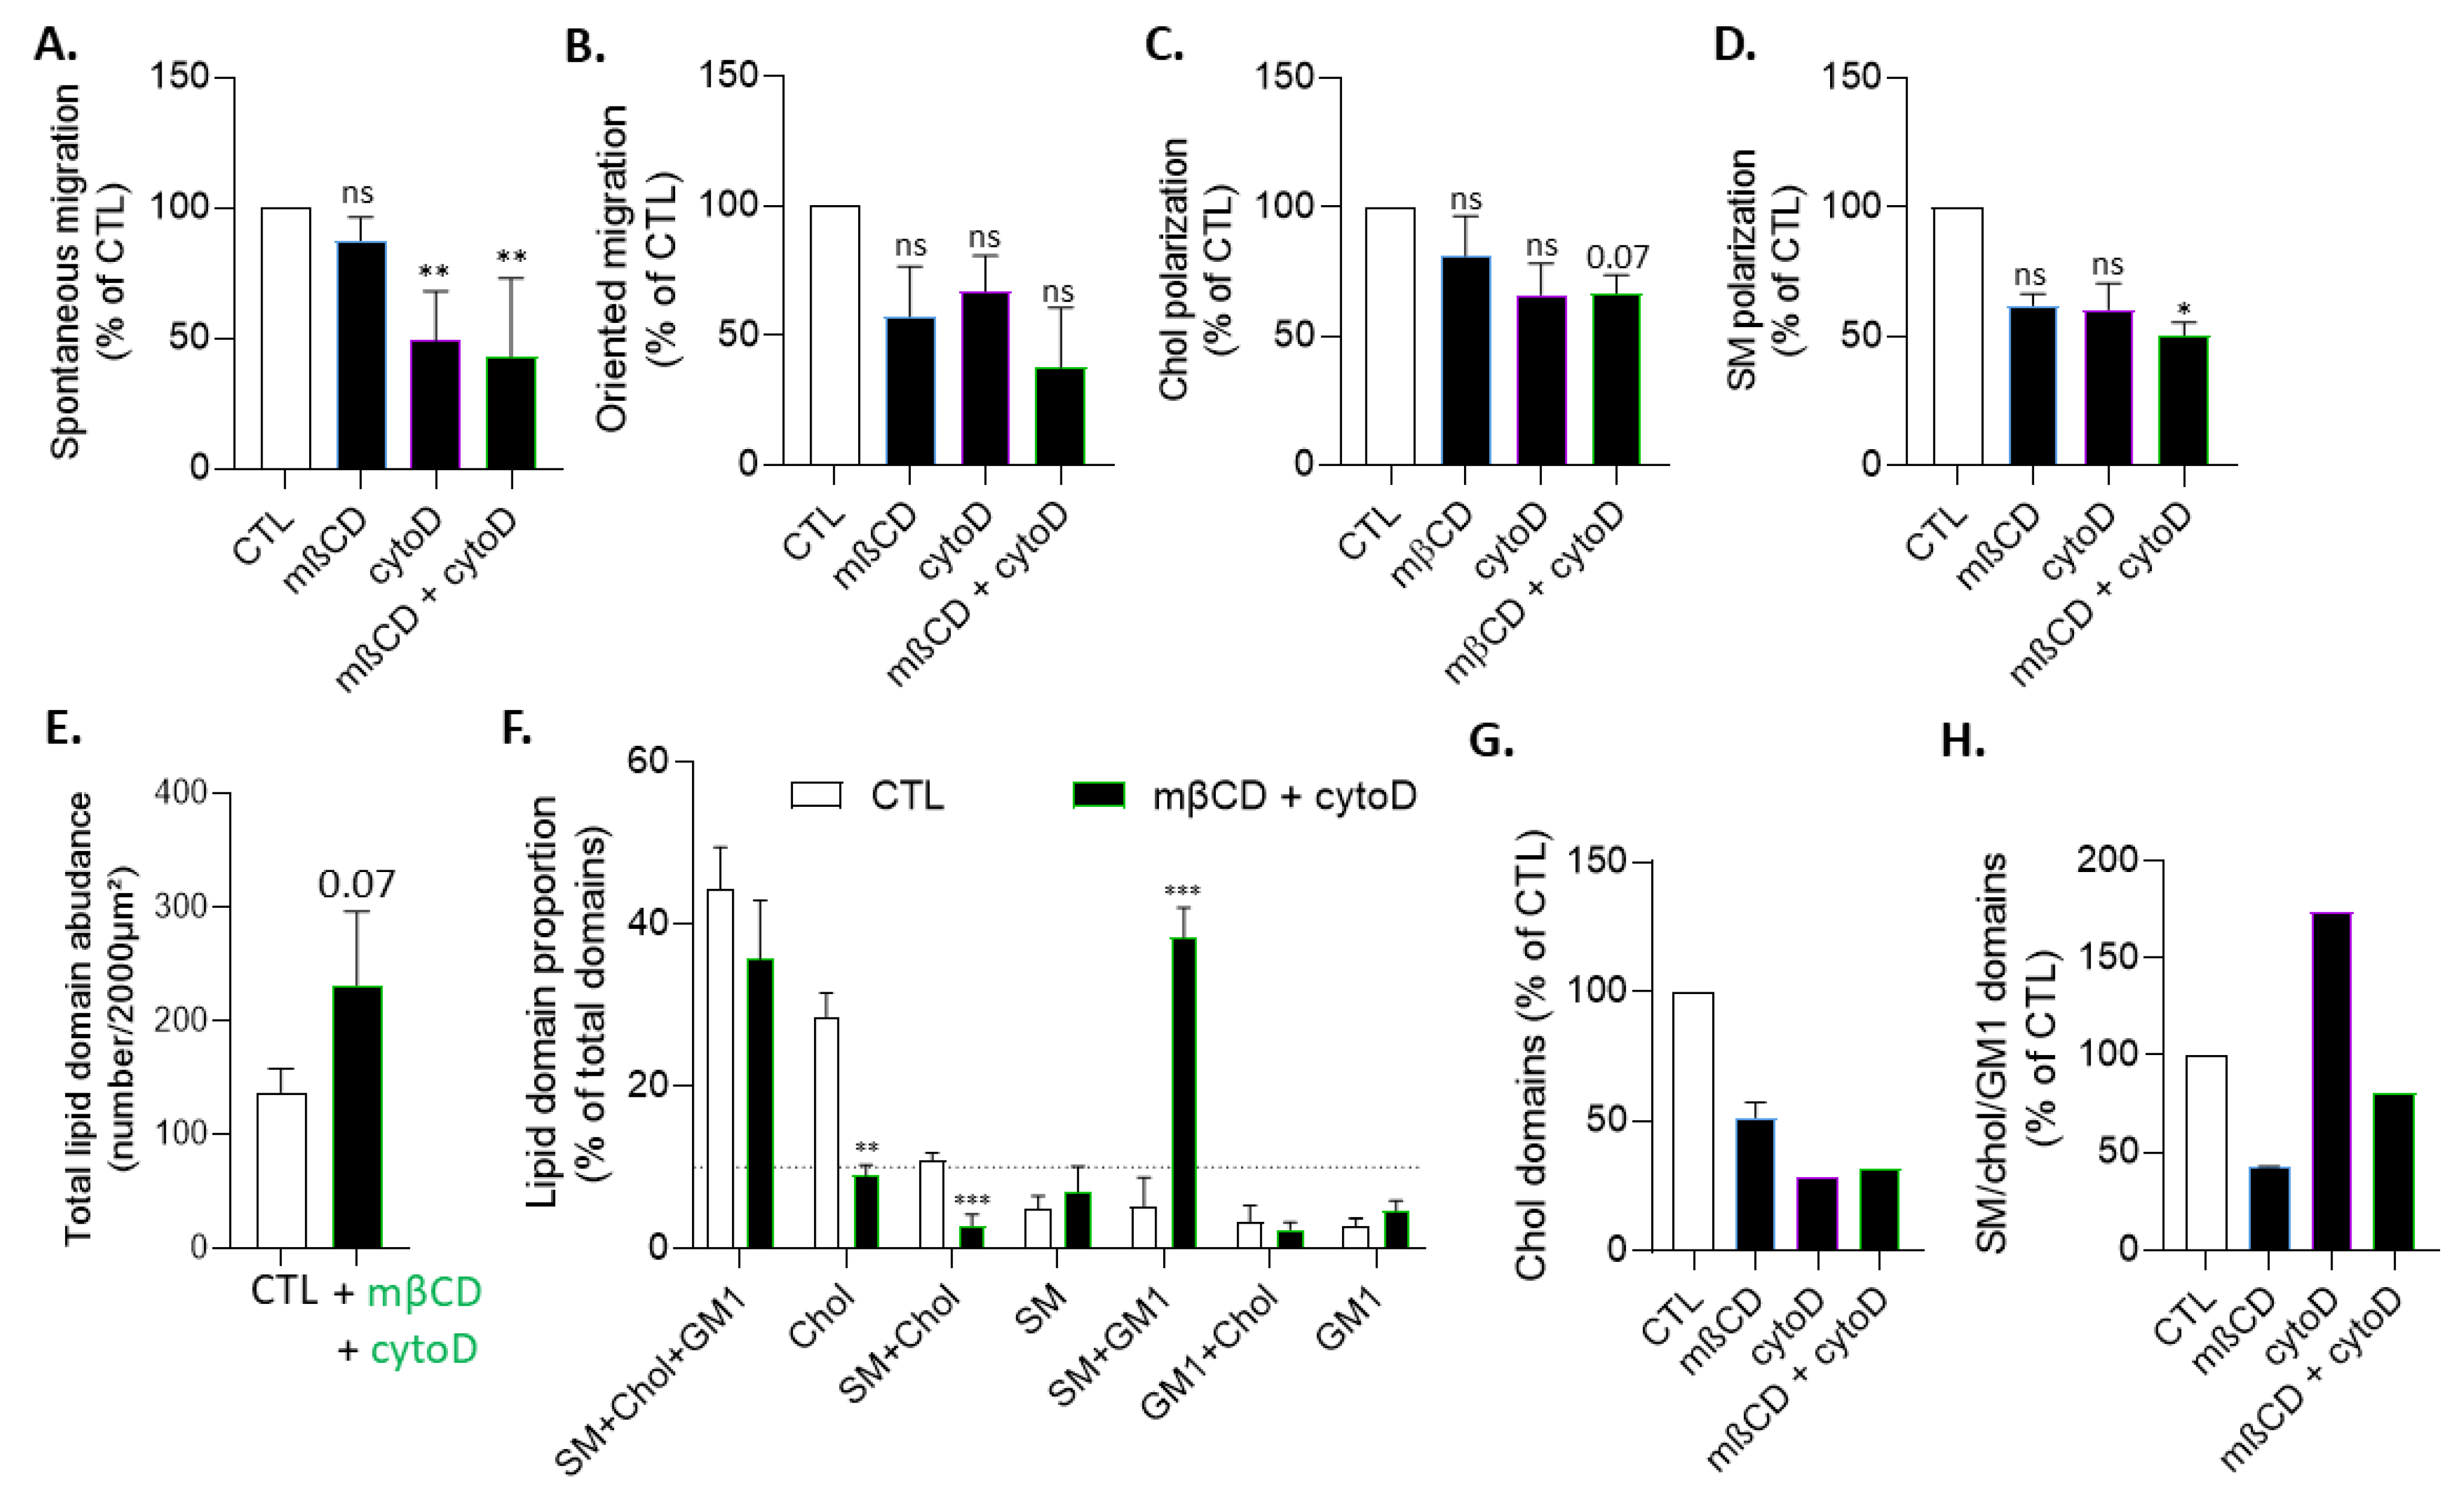
3.7. The Effects of Cholesterol Depletion on Chol-Enriched Domain Proportion at Resting State, Cholesterol and Sphingomyelin Polarization and Myoblast Migration Are Largely Abrogated in Actin-Depolymerized Myoblasts
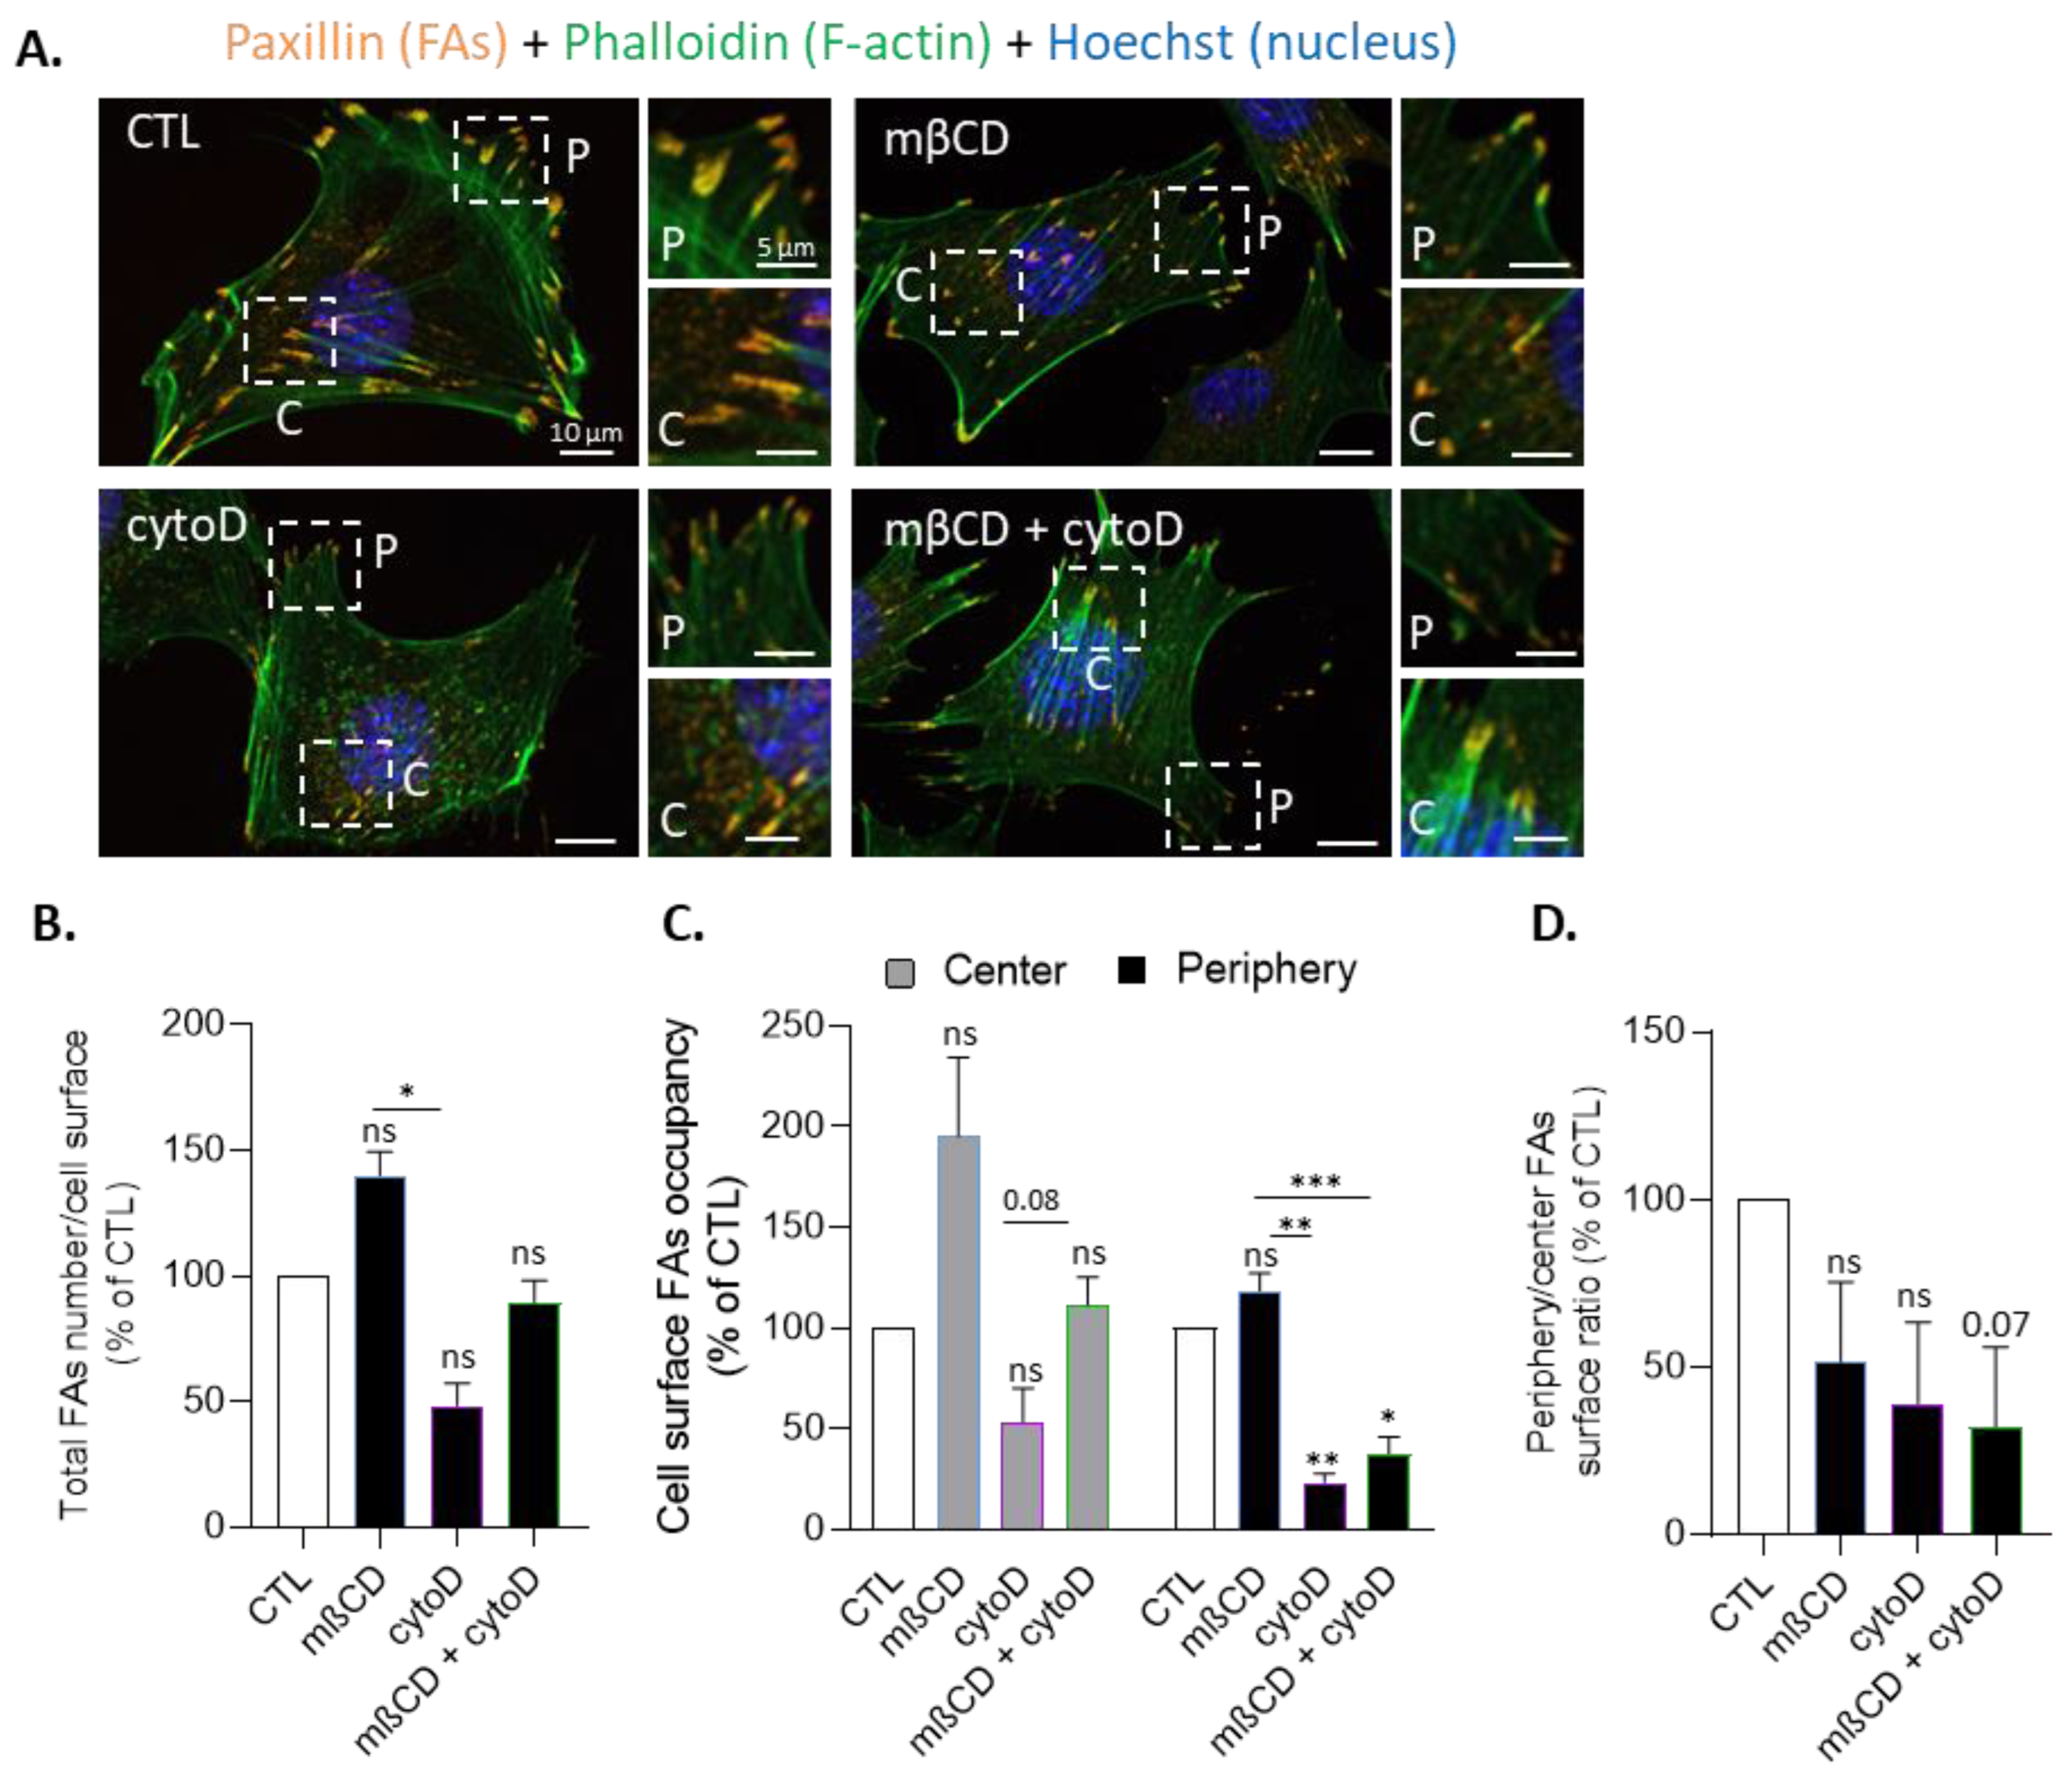
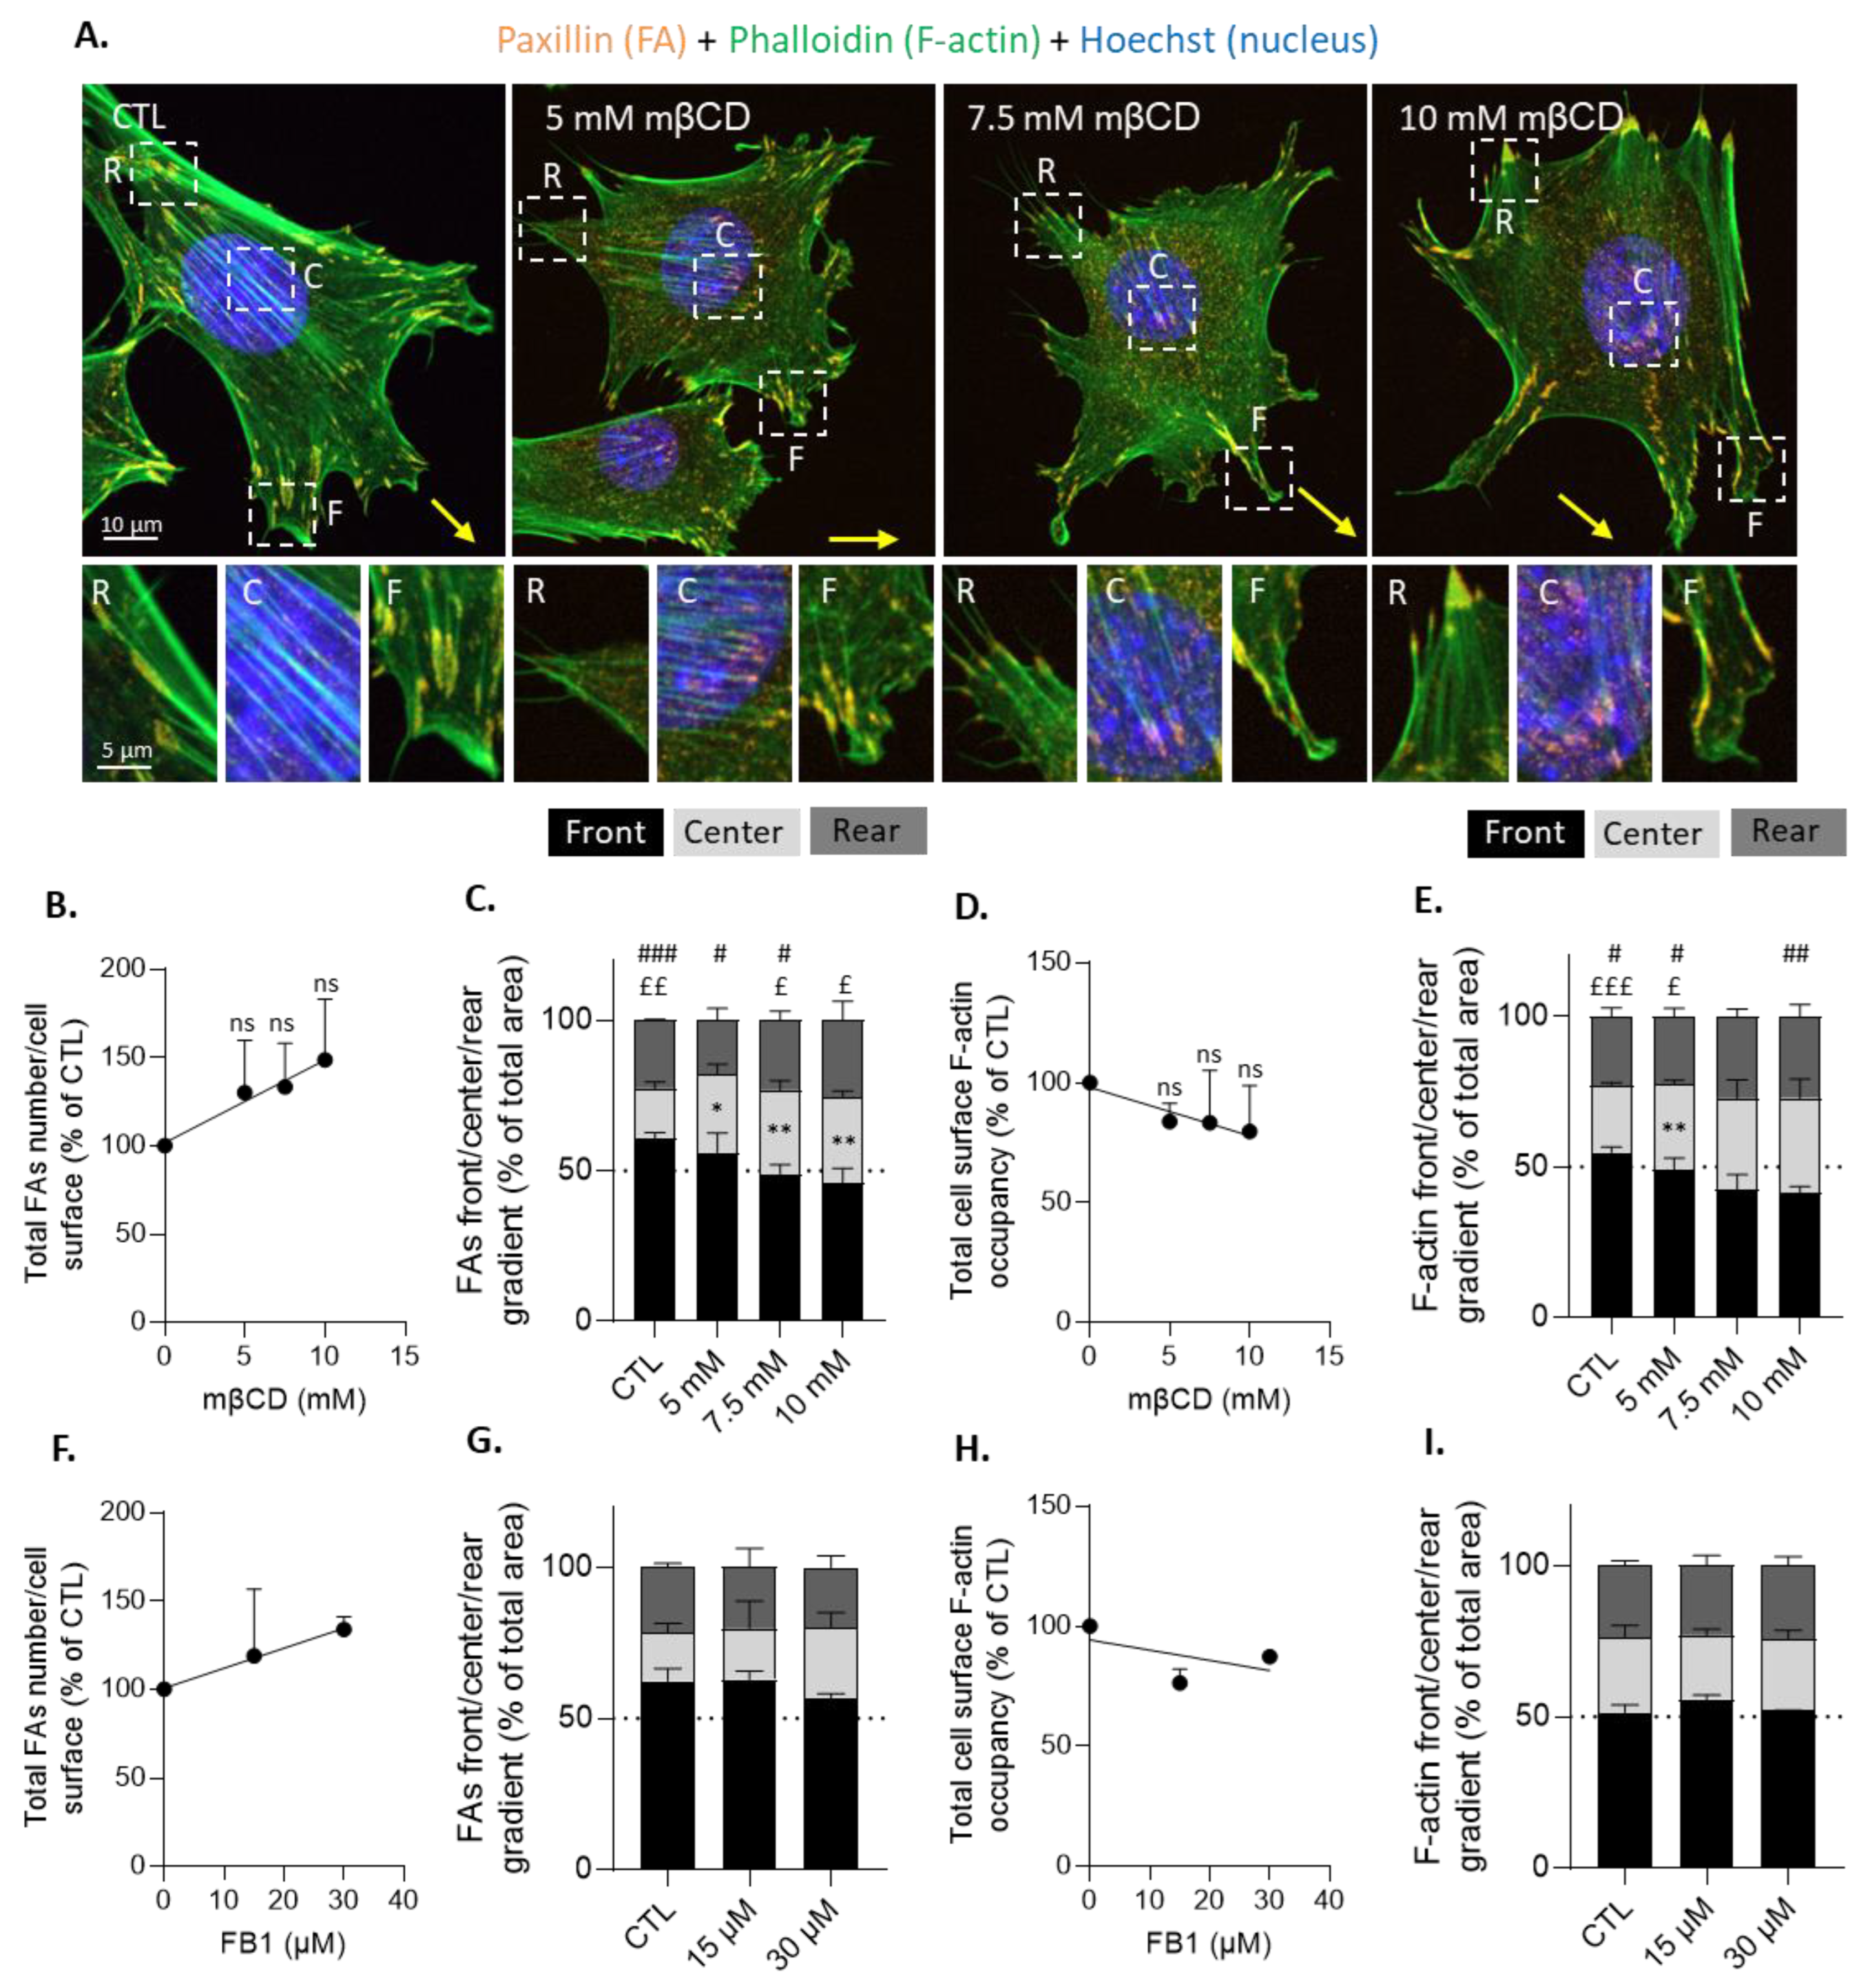
3.8. Cholesterol Depletion Increases Focal Adhesion Surface Occupancy at the Cell Center Both in Resting and Migrating Myoblasts and Impairs Focal Adhesion and F-Actin Polarization at the Front and the Front Surface Size
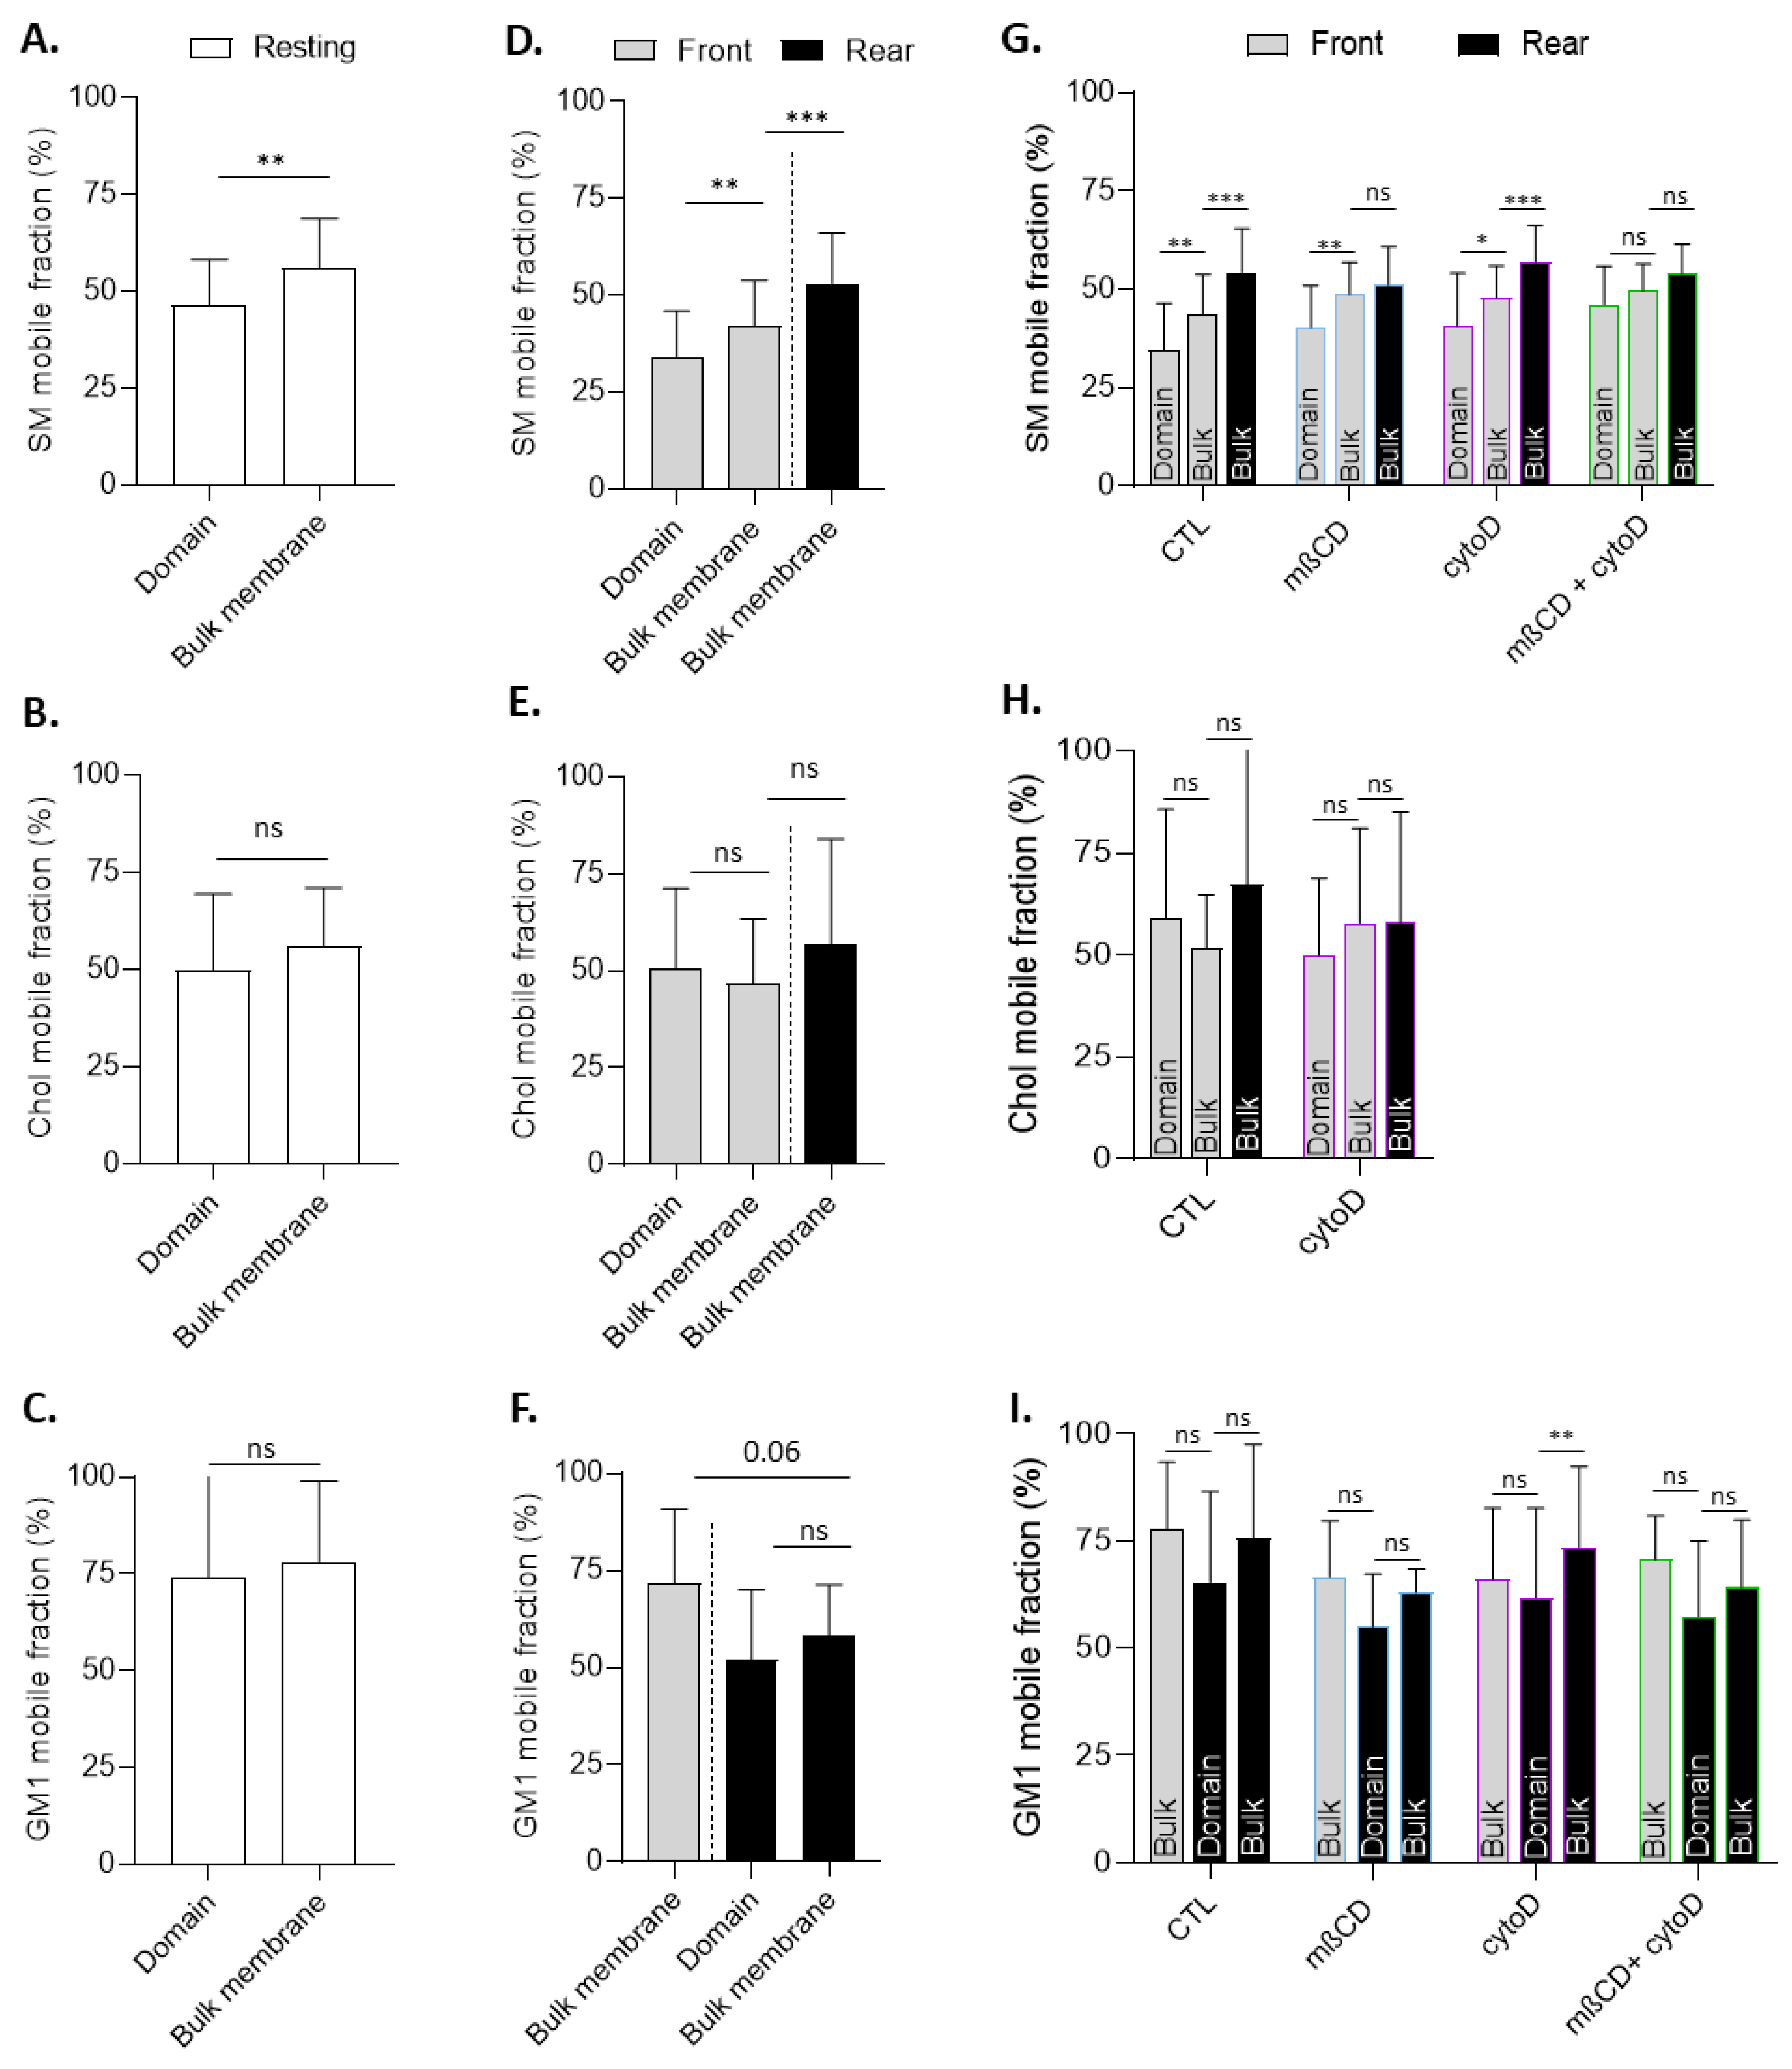
3.9. The Lateral Diffusion of Domain-Associated Sphingomyelin at the Front Is Specifically Restricted in a Cholesterol- and Cytoskeleton-Dependent Manner
4. Discussion
4.1. Main Observations
4.2. Experimental Strategy Strengths and Weaknesses
4.3. Evidence for Two Main Types of Submicrometric Lipid Domains at the Surface of Resting Myoblasts
4.4. Evidence for Cholesterol and Sphingolipid Polarization and Their Clustering in Three Main Types of Submicrometric Domains upon Myoblast Migration
4.5. Chol- and SM/Chol-Enriched Domains at the Leading Edge Present Differential Interplay with the Cytoskeleton and Biophysical Properties
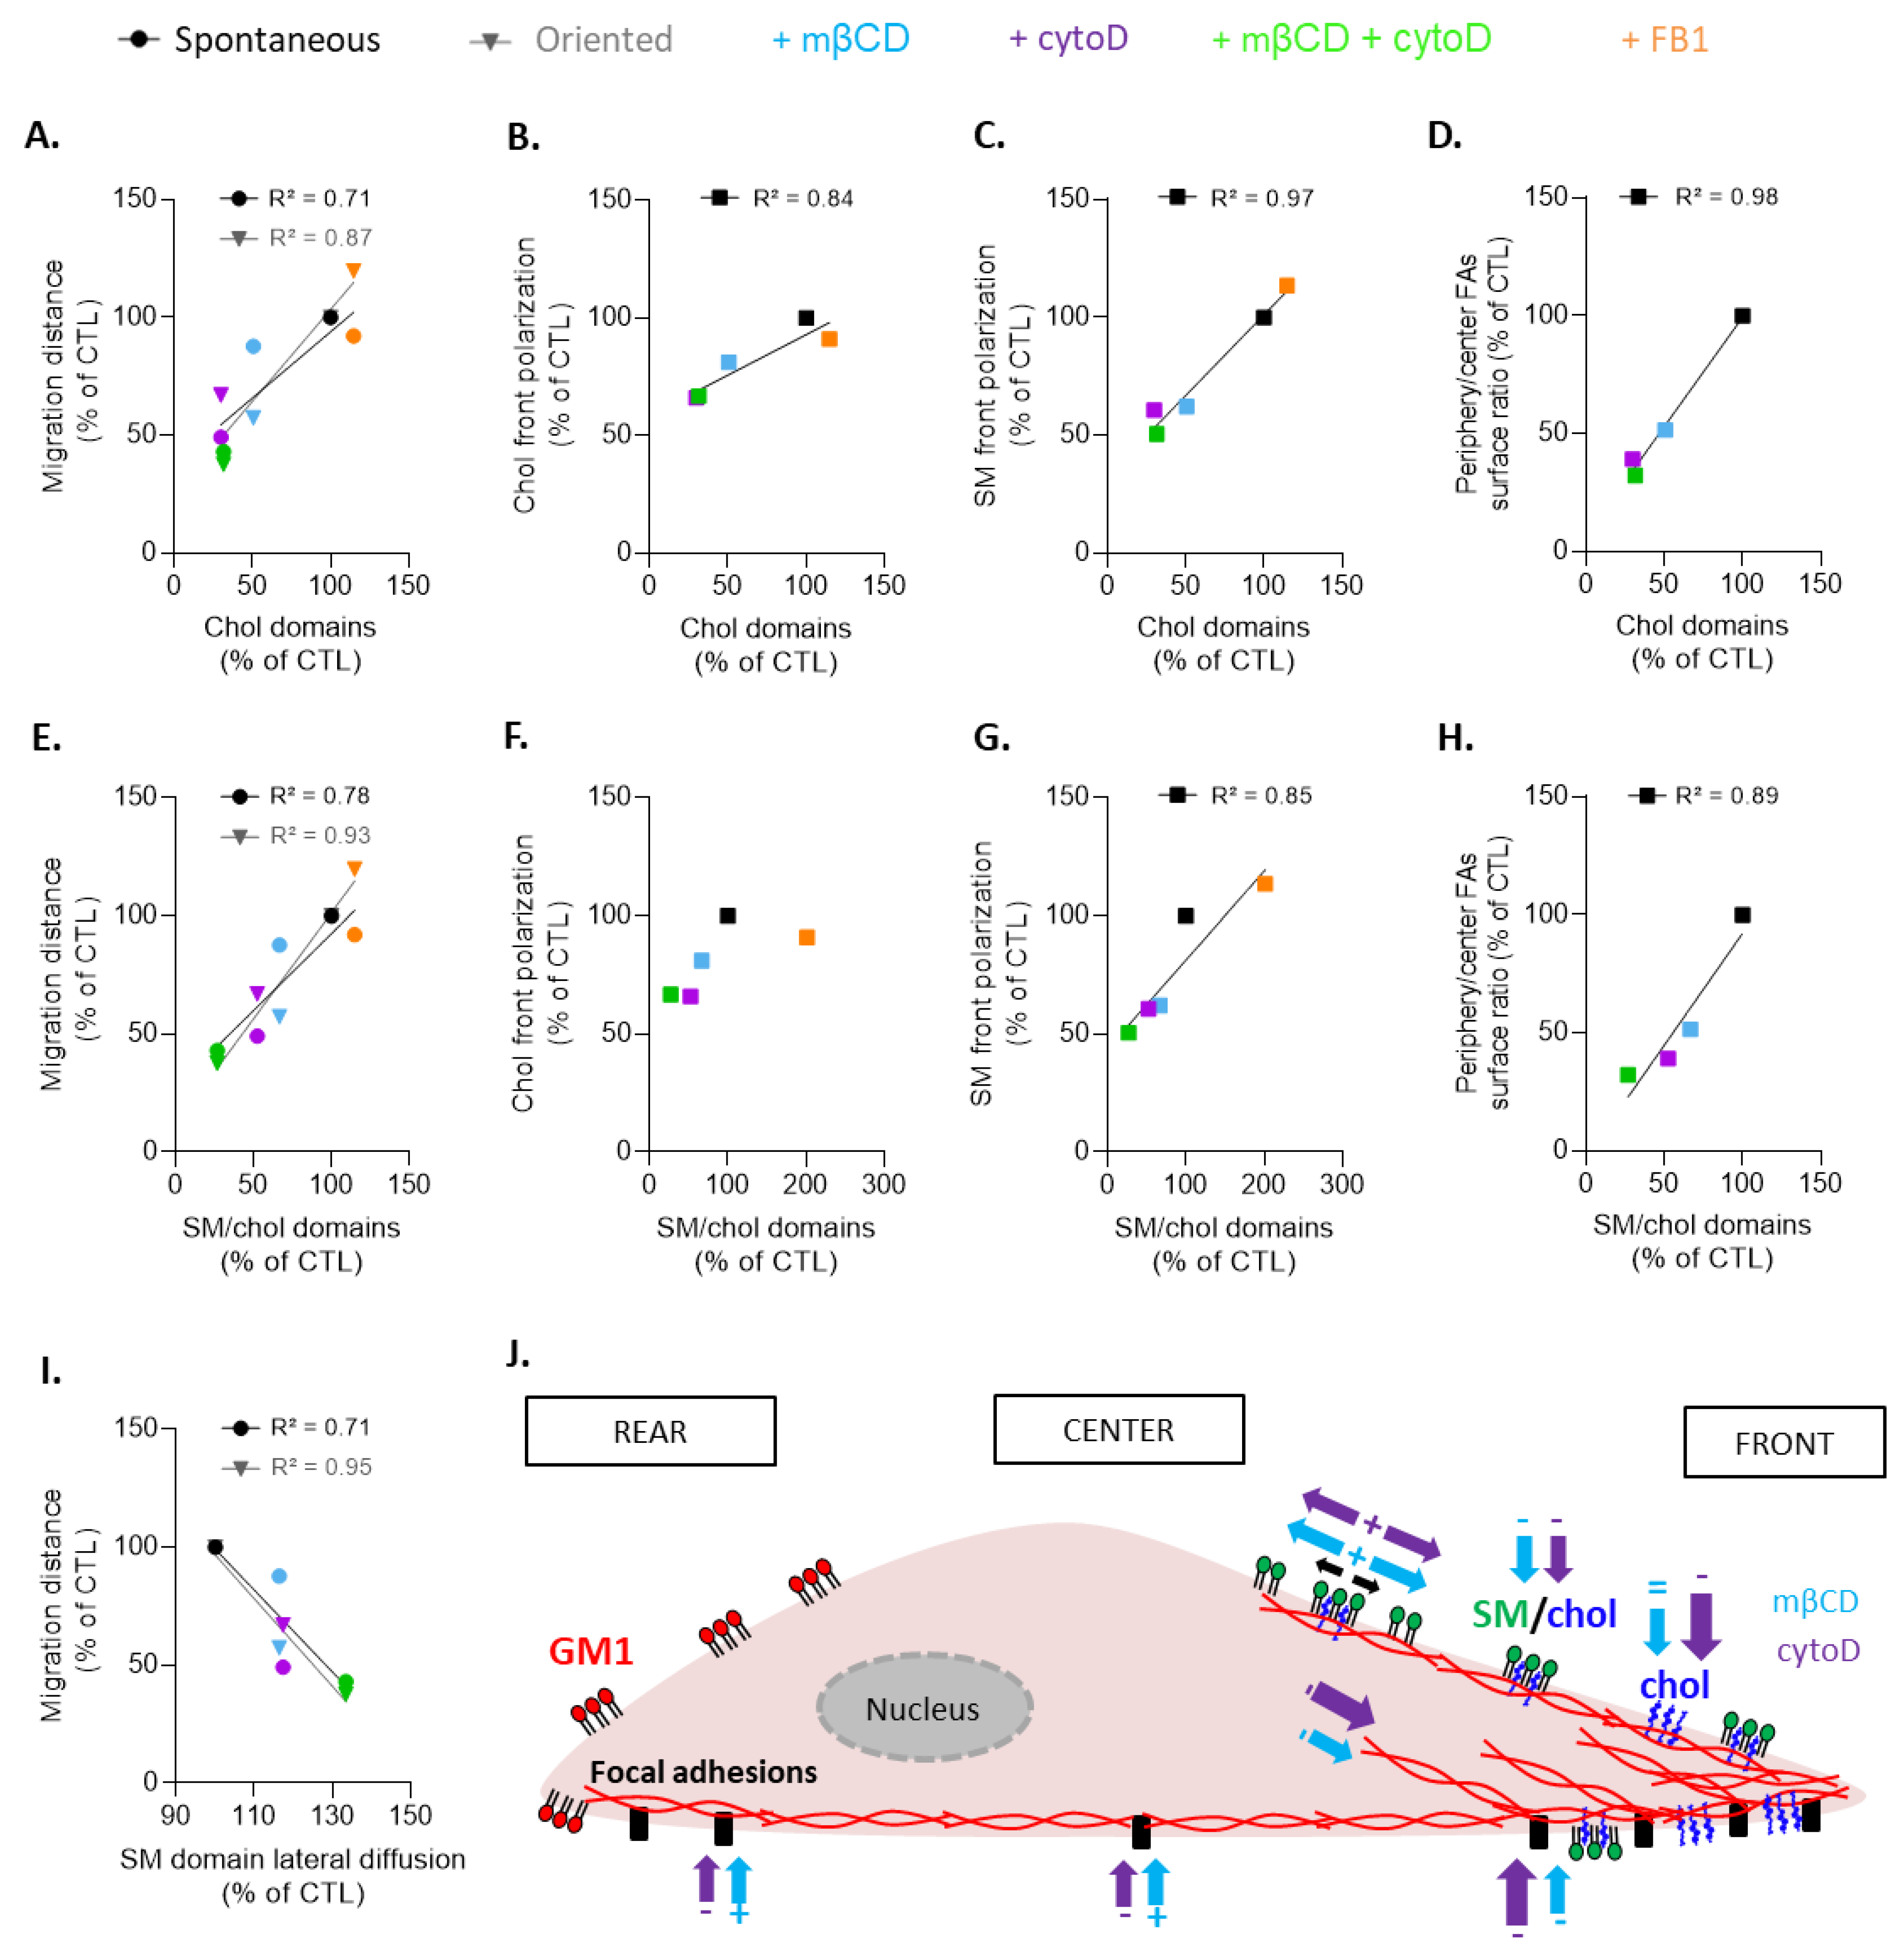
4.6. Chol- and SM/Chol-Enriched Domains at the Leading Edge Present Differential Roles in Myoblast Migration
4.7. Conclusions
Supplementary Materials
Author Contributions
Funding
Institutional Review Board Statement
Informed Consent Statement
Data Availability Statement
Acknowledgments
Conflicts of Interest
References
- Gilbert, S.F. Myogenesis: The Development of Muscle. In Developmental Biology, 6th ed.; NCBI: Bethesda, MD, USA, 2000. [Google Scholar]
- Chaillou, T.; Lanner, J.T. Regulation of Myogenesis and Skeletal Muscle Regeneration: Effects of Oxygen Levels on Satellite Cell Activity. FASEB J. Off. Publ. Fed. Am. Soc. Exp. Biol. 2016, 30, 3929–3941. [Google Scholar] [CrossRef] [PubMed]
- Zanou, N.; Gailly, P. Skeletal Muscle Hypertrophy and Regeneration: Interplay between the Myogenic Regulatory Factors (MRFs) and Insulin-like Growth Factors (IGFs) Pathways. Cell. Mol. Life Sci. CMLS 2013, 70, 4117–4130. [Google Scholar] [CrossRef] [PubMed]
- Morgan, J.E.; Partridge, T.A. Muscle Satellite Cells. Int. J. Biochem. Cell Biol. 2003, 35, 1151–1156. [Google Scholar] [CrossRef] [PubMed]
- Asakura, A.; Rudnicki, M.A.; Komaki, M. Muscle Satellite Cells Are Multipotential Stem Cells That Exhibit Myogenic, Osteogenic, and Adipogenic Differentiation. Differentiation 2001, 68, 245–253. [Google Scholar] [CrossRef] [PubMed]
- Choi, S.; Ferrari, G.; Tedesco, F.S. Cellular Dynamics of Myogenic Cell Migration: Molecular Mechanisms and Implications for Skeletal Muscle Cell Therapies. EMBO Mol. Med. 2020, 12, e12357. [Google Scholar] [CrossRef] [PubMed]
- Kawamura, K.; Takano, K.; Suetsugu, S.; Kurisu, S.; Yamazaki, D.; Miki, H.; Takenawa, T.; Endo, T. N-WASP and WAVE2 Acting Downstream of Phosphatidylinositol 3-Kinase Are Required for Myogenic Cell Migration Induced by Hepatocyte Growth Factor. J. Biol. Chem. 2004, 279, 54862–54871. [Google Scholar] [CrossRef] [PubMed]
- Méhes, E.; Mones, E.; Németh, V.; Vicsek, T. Collective Motion of Cells Mediates Segregation and Pattern Formation in Co-Cultures. PLoS ONE 2012, 7, e31711. [Google Scholar] [CrossRef]
- Lautscham, L.A.; Kämmerer, C.; Lange, J.R.; Kolb, T.; Mark, C.; Schilling, A.; Strissel, P.L.; Strick, R.; Gluth, C.; Rowat, A.C.; et al. Migration in Confined 3D Environments Is Determined by a Combination of Adhesiveness, Nuclear Volume, Contractility, and Cell Stiffness. Biophys. J. 2015, 109, 900–913. [Google Scholar] [CrossRef] [PubMed]
- Winkler, B.; Aranson, I.S.; Ziebert, F. Confinement and Substrate Topography Control Cell Migration in a 3D Computational Model. Commun. Phys. 2019, 2, 82. [Google Scholar] [CrossRef]
- Vaz, R.; Martins, G.; Thorsteinsdóttir, S.; Rodrigues, G. Fibronectin Promotes Migration, Alignment and Fusion in an in Vitro Myoblast Cell Model. Cell Tissue Res. 2012, 348, 569–578. [Google Scholar] [CrossRef] [PubMed]
- Seetharaman, S.; Etienne-Manneville, S. Cytoskeletal Crosstalk in Cell Migration. Trends Cell Biol. 2020, 30, 720–735. [Google Scholar] [CrossRef] [PubMed]
- Kuo, J.-C. Mechanotransduction at Focal Adhesions: Integrating Cytoskeletal Mechanics in Migrating Cells. J. Cell. Mol. Med. 2013, 17, 704–712. [Google Scholar] [CrossRef] [PubMed]
- Llense, F.; Etienne-Manneville, S. Front-to-Rear Polarity in Migrating Cells. In Cell Polarity 1: Biological Role and Basic Mechanisms; Ebnet, K., Ed.; Springer International Publishing: Cham, Switzerland, 2015; pp. 115–146. ISBN 978-3-319-14463-4. [Google Scholar]
- Fortier, M.; Comunale, F.; Kucharczak, J.; Blangy, A.; Charrasse, S.; Gauthier-Rouvière, C. RhoE Controls Myoblast Alignment Prior Fusion through RhoA and ROCK. Cell Death Differ. 2008, 15, 1221–1231. [Google Scholar] [CrossRef] [PubMed]
- Zhang, R.; Lee, D.M.; Jimah, J.R.; Gerassimov, N.; Yang, C.; Kim, S.; Luvsanjav, D.; Winkelman, J.; Mettlen, M.; Abrams, M.E.; et al. Dynamin Regulates the Dynamics and Mechanical Strength of the Actin Cytoskeleton as a Multifilament Actin-Bundling Protein. Nat. Cell Biol. 2020, 22, 674–688. [Google Scholar] [CrossRef] [PubMed]
- Vasyutina, E.; Martarelli, B.; Brakebusch, C.; Wende, H.; Birchmeier, C. The Small G-Proteins Rac1 and Cdc42 Are Essential for Myoblast Fusion in the Mouse. Proc. Natl. Acad. Sci. USA 2009, 106, 8935–8940. [Google Scholar] [CrossRef] [PubMed]
- Chuang, M.-C.; Lin, S.-S.; Ohniwa, R.L.; Lee, G.-H.; Su, Y.-A.; Chang, Y.-C.; Tang, M.-J.; Liu, Y.-W. Tks5 and Dynamin-2 Enhance Actin Bundle Rigidity in Invadosomes to Promote Myoblast Fusion. J. Cell Biol. 2019, 218, 1670–1685. [Google Scholar] [CrossRef] [PubMed]
- Laurent, V.M.; Kasas, S.; Yersin, A.; Schäffer, T.E.; Catsicas, S.; Dietler, G.; Verkhovsky, A.B.; Meister, J.-J. Gradient of Rigidity in the Lamellipodia of Migrating Cells Revealed by Atomic Force Microscopy. Biophys. J. 2005, 89, 667–675. [Google Scholar] [CrossRef] [PubMed]
- Janmey, P.A.; Kinnunen, P.K.J. Biophysical Properties of Lipids and Dynamic Membranes. Trends Cell Biol. 2006, 16, 538–546. [Google Scholar] [CrossRef] [PubMed]
- Chakraborty, S.; Doktorova, M.; Molugu, T.R.; Heberle, F.A.; Scott, H.L.; Dzikovski, B.; Nagao, M.; Stingaciu, L.-R.; Standaert, R.F.; Barrera, F.N.; et al. How Cholesterol Stiffens Unsaturated Lipid Membranes. Proc. Natl. Acad. Sci. USA 2020, 117, 21896–21905. [Google Scholar] [CrossRef]
- Briolay, A.; Jaafar, R.; Nemoz, G.; Bessueille, L. Myogenic Differentiation and Lipid-Raft Composition of L6 Skeletal Muscle Cells Are Modulated by PUFAs. Biochim. Biophys. Acta BBA Biomembr. 2013, 1828, 602–613. [Google Scholar] [CrossRef]
- Mermelstein, C.S.; Portilho, D.M.; Medeiros, R.B.; Matos, A.R.; Einicker-Lamas, M.; Tortelote, G.G.; Vieyra, A.; Costa, M.L. Cholesterol Depletion by Methyl-β-Cyclodextrin Enhances Myoblast Fusion and Induces the Formation of Myotubes with Disorganized Nuclei. Cell Tissue Res. 2005, 319, 289–297. [Google Scholar] [CrossRef] [PubMed]
- Nagata, Y.; Kobayashi, H.; Umeda, M.; Ohta, N.; Kawashima, S.; Zammit, P.S.; Matsuda, R. Sphingomyelin Levels in the Plasma Membrane Correlate with the Activation State of Muscle Satellite Cells. J. Histochem. Cytochem. 2006, 54, 375–384. [Google Scholar] [CrossRef] [PubMed]
- Tsuchiya, M.; Hara, Y.; Okuda, M.; Itoh, K.; Nishioka, R.; Shiomi, A.; Nagao, K.; Mori, M.; Mori, Y.; Ikenouchi, J.; et al. Cell Surface Flip-Flop of Phosphatidylserine Is Critical for PIEZO1-Mediated Myotube Formation. Nat. Commun. 2018, 9, 2049. [Google Scholar] [CrossRef] [PubMed]
- Carquin, M.; D’Auria, L.; Pollet, H.; Bongarzone, E.R.; Tyteca, D. Recent Progress on Lipid Lateral Heterogeneity in Plasma Membranes: From Rafts to Submicrometric Domains. Prog. Lipid Res. 2016, 62, 1–24. [Google Scholar] [CrossRef] [PubMed]
- Maja, M.; Mohammed, D.; Dumitru, A.C.; Verstraeten, S.; Lingurski, M.; Mingeot-Leclercq, M.-P.; Alsteens, D.; Tyteca, D. Surface Cholesterol-Enriched Domains Specifically Promote Invasion of Breast Cancer Cell Lines by Controlling Invadopodia and Extracellular Matrix Degradation. Cell. Mol. Life Sci. CMLS 2022, 79, 417. [Google Scholar] [CrossRef] [PubMed]
- Mound, A.; Lozanova, V.; Warnon, C.; Hermant, M.; Robic, J.; Guere, C.; Vie, K.; de Rouvroit, C.L.; Tyteca, D.; Debacq-Chainiaux, F.; et al. Non-Senescent Keratinocytes Organize in Plasma Membrane Submicrometric Lipid Domains Enriched in Sphingomyelin and Involved in Re-Epithelialization. Biochim. Biophys. Acta BBA Mol. Cell Biol. Lipids 2017, 1862, 958–971. [Google Scholar] [CrossRef] [PubMed]
- Bisel, B.; Calamai, M.; Vanzi, F.; Pavone, F.S. Decoupling Polarization of the Golgi Apparatus and GM1 in the Plasma Membrane. PLoS ONE 2013, 8, e80446. [Google Scholar] [CrossRef]
- Gómez-Moutón, C.; Abad, J.L.; Mira, E.; Lacalle, R.A.; Gallardo, E.; Jiménez-Baranda, S.; Illa, I.; Bernad, A.; Mañes, S.; Martínez, A.C. Segregation of Leading-Edge and Uropod Components into Specific Lipid Rafts during T Cell Polarization. Proc. Natl. Acad. Sci. USA 2001, 98, 9642–9647. [Google Scholar] [CrossRef] [PubMed]
- Tsujita, K.; Itoh, T. Phosphoinositides in the Regulation of Actin Cortex and Cell Migration. Biochim. Biophys. Acta BBA Mol. Cell Biol. Lipids 2015, 1851, 824–831. [Google Scholar] [CrossRef]
- Remorino, A.; Beco, S.D.; Cayrac, F.; Federico, F.D.; Cornilleau, G.; Gautreau, A.; Parrini, M.C.; Masson, J.-B.; Dahan, M.; Coppey, M. Gradients of Rac1 Nanoclusters Support Spatial Patterns of Rac1 Signaling. Cell Rep. 2017, 21, 1922–1935. [Google Scholar] [CrossRef] [Green Version]
- Dumitru, A.C.; Mohammed, D.; Maja, M.; Yang, J.; Verstraeten, S.; Del Campo, A.; Mingeot-Leclercq, M.-P.; Tyteca, D.; Alsteens, D. Label-Free Imaging of Cholesterol Assemblies Reveals Hidden Nanomechanics of Breast Cancer Cells. Adv. Sci. Weinh. Baden-Wurtt. Ger. 2020, 7, 2002643. [Google Scholar] [CrossRef] [PubMed]
- Carquin, M.; Conrard, L.; Pollet, H.; Van Der Smissen, P.; Cominelli, A.; Veiga-da-Cunha, M.; Courtoy, P.J.; Tyteca, D. Cholesterol Segregates into Submicrometric Domains at the Living Erythrocyte Membrane: Evidence and Regulation. Cell. Mol. Life Sci. 2015, 72, 4633–4651. [Google Scholar] [CrossRef] [PubMed]
- Conrard, L.; Stommen, A.; Cloos, A.-S.; Steinkühler, J.; Dimova, R.; Pollet, H.; Tyteca, D. Spatial Relationship and Functional Relevance of Three Lipid Domain Populations at the Erythrocyte Surface. Cell. Physiol. Biochem. 2018, 51, 1544–1565. [Google Scholar] [CrossRef] [PubMed]
- Dumitru, A.C.; Conrard, L.; Lo Giudice, C.; Henriet, P.; Veiga-da-Cunha, M.; Derclaye, S.; Tyteca, D.; Alsteens, D. High-Resolution Mapping and Recognition of Lipid Domains Using AFM with Toxin-Derivatized Probes. Chem. Commun. Camb. Engl. 2018, 54, 6903–6906. [Google Scholar] [CrossRef] [PubMed]
- Carquin, M.; Pollet, H.; Veiga-da-Cunha, M.; Cominelli, A.; Van Der Smissen, P.; N’kuli, F.; Emonard, H.; Henriet, P.; Mizuno, H.; Courtoy, P.J.; et al. Endogenous Sphingomyelin Segregates into Submicrometric Domains in the Living Erythrocyte Membrane. J. Lipid Res. 2014, 55, 1331–1342. [Google Scholar] [CrossRef] [PubMed]
- Burattini, S.; Ferri, P.; Battistelli, M.; Curci, R.; Luchetti, F.; Falcieri, E. C2C12 Murine Myoblasts as a Model of Skeletal Muscle Development: Morpho-Functional Characterization. Eur. J. Histochem. EJH 2004, 48, 223–233. [Google Scholar]
- Ingólfsson, H.I.; Melo, M.N.; van Eerden, F.J.; Arnarez, C.; Lopez, C.A.; Wassenaar, T.A.; Periole, X.; de Vries, A.H.; Tieleman, D.P.; Marrink, S.J. Lipid Organization of the Plasma Membrane. J. Am. Chem. Soc. 2014, 136, 14554–14559. [Google Scholar] [CrossRef] [PubMed]
- Wildling, L.; Unterauer, B.; Zhu, R.; Rupprecht, A.; Haselgrübler, T.; Rankl, C.; Ebner, A.; Vater, D.; Pollheimer, P.; Pohl, E.E.; et al. Linking of Sensor Molecules with Amino Groups to Amino-Functionalized AFM Tips. Bioconjug. Chem. 2011, 22, 1239–1248. [Google Scholar] [CrossRef]
- Alsteens, D.; Newton, R.; Schubert, R.; Martinez-Martin, D.; Delguste, M.; Roska, B.; Müller, D.J. Nanomechanical Mapping of First Binding Steps of a Virus to Animal Cells. Nat. Nanotechnol. 2017, 12, 177–183. [Google Scholar] [CrossRef]
- Butt, H.-J.; Jaschke, M. Calculation of Thermal Noise in Atomic Force Microscopy. Nanotechnology 1995, 6, 1. [Google Scholar] [CrossRef]
- Hermanowicz, P.; Sarna, M.; Burda, K.; Gabryś, H. AtomicJ: An Open Source Software for Analysis of Force Curves. Rev. Sci. Instrum. 2014, 85, 063703. [Google Scholar] [CrossRef] [PubMed]
- Hertz, H. Über Die Berührung Fester Elastischer Körper. J. Für Reine Angew. Math. 1882, 92, 156–171. [Google Scholar] [CrossRef]
- Dimitriadis, E.K.; Horkay, F.; Maresca, J.; Kachar, B.; Chadwick, R.S. Determination of Elastic Moduli of Thin Layers of Soft Material Using the Atomic Force Microscope. Biophys. J. 2002, 82, 2798–2810. [Google Scholar] [CrossRef] [PubMed]
- Horzum, U.; Ozdil, B.; Pesen-Okvur, D. Step-by-Step Quantitative Analysis of Focal Adhesions. MethodsX 2014, 1, 56–59. [Google Scholar] [CrossRef] [PubMed]
- Rissanen, S.; Grzybek, M.; Orłowski, A.; Róg, T.; Cramariuc, O.; Levental, I.; Eggeling, C.; Sezgin, E.; Vattulainen, I. Phase Partitioning of GM1 and Its Bodipy-Labeled Analog Determine Their Different Binding to Cholera Toxin. Front. Physiol. 2017, 8, 252. [Google Scholar] [CrossRef] [PubMed]
- Leonard, C.; Pollet, H.; Vermylen, C.; Gov, N.; Tyteca, D.; Mingeot-Leclercq, M.-P. Tuning of Differential Lipid Order Between Submicrometric Domains and Surrounding Membrane Upon Erythrocyte Reshaping. Cell. Physiol. Biochem. 2018, 48, 2563–2582. [Google Scholar] [CrossRef] [PubMed]
- Yu, M.; Wang, H.; Xu, Y.; Yu, D.; Li, D.; Liu, X.; Du, W. Insulin-like Growth Factor-1 (IGF-1) Promotes Myoblast Proliferation and Skeletal Muscle Growth of Embryonic Chickens via the PI3K/Akt Signalling Pathway. Cell Biol. Int. 2015, 39, 910–922. [Google Scholar] [CrossRef] [PubMed]
- Tyteca, D.; D’Auria, L.; Der Smissen, P.V.; Medts, T.; Carpentier, S.; Monbaliu, J.C.; de Diesbach, P.; Courtoy, P.J. Three Unrelated Sphingomyelin Analogs Spontaneously Cluster into Plasma Membrane Micrometric Domains. Biochim. Biophys. Acta BBA Biomembr. 2010, 1798, 909–927. [Google Scholar] [CrossRef]
- D’Auria, L.; Fenaux, M.; Aleksandrowicz, P.; Van Der Smissen, P.; Chantrain, C.; Vermylen, C.; Vikkula, M.; Courtoy, P.J.; Tyteca, D. Micrometric Segregation of Fluorescent Membrane Lipids: Relevance for Endogenous Lipids and Biogenesis in Erythrocytes. J. Lipid Res. 2013, 54, 1066–1076. [Google Scholar] [CrossRef] [PubMed]
- Leonard, C.; Conrard, L.; Guthmann, M.; Pollet, H.; Carquin, M.; Vermylen, C.; Gailly, P.; Smissen, P.V.D.; Mingeot-Leclercq, M.P.; Tyteca, D. Contribution of Plasma Membrane Lipid Domains to Red Blood Cell (Re)Shaping. Sci. Rep. 2017, 7, 4264. [Google Scholar] [CrossRef]
- D’auria, L.; Van der Smissen, P.; Bruyneel, F.; Courtoy, P.J.; Tyteca, D. Segregation of Fluorescent Membrane Lipids into Distinct Micrometric Domains: Evidence for Phase Compartmentation of Natural Lipids? PLoS ONE 2011, 6, e17021. [Google Scholar] [CrossRef] [PubMed] [Green Version]
- Ohno-Iwashita, Y.; Shimada, Y.; Hayashi, M.; Iwamoto, M.; Iwashita, S.; Inomata, M. Cholesterol-Binding Toxins and Anti-Cholesterol Antibodies as Structural Probes for Cholesterol Localization. Subcell. Biochem. 2010, 51, 597–621. [Google Scholar] [CrossRef] [PubMed]
- Das, A.; Goldstein, J.L.; Anderson, D.D.; Brown, M.S.; Radhakrishnan, A. Use of Mutant 125I-Perfringolysin O to Probe Transport and Organization of Cholesterol in Membranes of Animal Cells. Proc. Natl. Acad. Sci. USA 2013, 110, 10580–10585. [Google Scholar] [CrossRef] [PubMed]
- Patel, H.H.; Insel, P.A. Lipid Rafts and Caveolae and Their Role in Compartmentation of Redox Signaling. Antioxid. Redox Signal. 2009, 11, 1357–1372. [Google Scholar] [CrossRef]
- Biswas, A.; Kashyap, P.; Datta, S.; Sengupta, T.; Sinha, B. Cholesterol Depletion by MβCD Enhances Cell Membrane Tension and Its Variations-Reducing Integrity. Biophys. J. 2019, 116, 1456–1468. [Google Scholar] [CrossRef]
- Cai, C.; Zhu, H.; Chen, J. Overexpression of Caveolin-1 Increases Plasma Membrane Fluidity and Reduces P-Glycoprotein Function in Hs578T/Dox. Biochem. Biophys. Res. Commun. 2004, 320, 868–874. [Google Scholar] [CrossRef]
- Obula, R.; Gunda, S.; Botlagunta, M.; Joshi, P.; Thiery, J.; Dufour, S.; Pande, G. Changes in Cholesterol Levels in the Plasma Membrane Modulate Cell Signaling and Regulate Cell Adhesion and Migration on Fibronectin. Cell Motil. Cytoskelet. 2007, 64, 199–216. [Google Scholar] [CrossRef]
- Yang, Z.; Qin, W.; Chen, Y.; Yuan, B.; Song, X.; Wang, B.; Shen, F.; Fu, J.; Wang, H. Cholesterol Inhibits Hepatocellular Carcinoma Invasion and Metastasis by Promoting CD44 Localization in Lipid Rafts. Cancer Lett. 2018, 429, 66–77. [Google Scholar] [CrossRef]
- Kumar, M.; Irungbam, K.; Kataria, M. Depletion of Membrane Cholesterol Compromised Caspase-8 Imparts in Autophagy Induction and Inhibition of Cell Migration in Cancer Cells. Cancer Cell Int. 2018, 18, 23. [Google Scholar] [CrossRef]
- Nagao, T.; Qin, C.; Grosheva, I.; Maxfield, F.R.; Pierini, L.M. Elevated Cholesterol Levels in the Plasma Membranes of Macrophages Inhibit Migration by Disrupting RhoA Regulation. Arterioscler. Thromb. Vasc. Biol. 2007, 27, 1596–1602. [Google Scholar] [CrossRef] [PubMed]
- Asano, S.; Kitatani, K.; Taniguchi, M.; Hashimoto, M.; Zama, K.; Mitsutake, S.; Igarashi, Y.; Takeya, H.; Kigawa, J.; Hayashi, A.; et al. Regulation of Cell Migration by Sphingomyelin Synthases: Sphingomyelin in Lipid Rafts Decreases Responsiveness to Signaling by the CXCL12/CXCR4 Pathway. Mol. Cell. Biol. 2012, 32, 3242–3252. [Google Scholar] [CrossRef] [PubMed] [Green Version]
- Collenburg, L.; Beyersdorf, N.; Wiese, T.; Arenz, C.; Saied, E.M.; Becker-Flegler, K.A.; Schneider-Schaulies, S.; Avota, E. The Activity of the Neutral Sphingomyelinase Is Important in T Cell Recruitment and Directional Migration. Front. Immunol. 2017, 8, 1007. [Google Scholar] [CrossRef] [PubMed]
- Krummel, M.F.; Friedman, R.S.; Jacobelli, J. Modes and Mechanisms of T Cell Motility: Roles for Confinement and Myosin-IIA. Curr. Opin. Cell Biol. 2014, 30, 9–16. [Google Scholar] [CrossRef] [PubMed]
- Lu, P.; Lu, Y. Born to Run? Diverse Modes of Epithelial Migration. Front. Cell Dev. Biol. 2021, 9, 704939. [Google Scholar] [CrossRef] [PubMed]
- Plutoni, C.; Bazellieres, E.; Le Borgne-Rochet, M.; Comunale, F.; Brugues, A.; Séveno, M.; Planchon, D.; Thuault, S.; Morin, N.; Bodin, S.; et al. P-Cadherin Promotes Collective Cell Migration via a Cdc42-Mediated Increase in Mechanical Forces. J. Cell Biol. 2016, 212, 199–217. [Google Scholar] [CrossRef] [PubMed]
- Amin, L.; Ercolini, E.; Shahapure, R.; Migliorini, E.; Torre, V. The Role of Membrane Stiffness and Actin Turnover on the Force Exerted by DRG Lamellipodia. Biophys. J. 2012, 102, 2451–2460. [Google Scholar] [CrossRef] [PubMed]
- Vasanji, A.; Ghosh, P.K.; Graham, L.M.; Eppell, S.J.; Fox, P.L. Polarization of Plasma Membrane Microviscosity during Endothelial Cell Migration. Dev. Cell 2004, 6, 29–41. [Google Scholar] [CrossRef]
- Jose, J.; Hoque, M.; Engel, J.; Beevi, S.S.; Wahba, M.; Georgieva, M.I.; Murphy, K.J.; Hughes, W.E.; Cochran, B.J.; Lu, A.; et al. Annexin A6 and NPC1 Regulate LDL-Inducible Cell Migration and Distribution of Focal Adhesions. Sci. Rep. 2022, 12, 596. [Google Scholar] [CrossRef]
- Sanyour, H.J.; Li, N.; Rickel, A.P.; Childs, J.D.; Kinser, C.N.; Hong, Z. Membrane Cholesterol and Substrate Stiffness Co-Ordinate to Induce the Remodelling of the Cytoskeleton and the Alteration in the Biomechanics of Vascular Smooth Muscle Cells. Cardiovasc. Res. 2019, 115, 1369–1380. [Google Scholar] [CrossRef]
- Ge, Y.; Gao, J.; Jordan, R.; Naumann, C.A. Changes in Cholesterol Level Alter Integrin Sequestration in Raft-Mimicking Lipid Mixtures. Biophys. J. 2018, 114, 158–167. [Google Scholar] [CrossRef]
- Takahashi, K.; Kanerva, K.; Vanharanta, L.; Almeida-Souza, L.; Lietha, D.; Olkkonen, V.M.; Ikonen, E. ORP2 Couples LDL-Cholesterol Transport to FAK Activation by Endosomal Cholesterol/PI(4,5)P2 Exchange. EMBO J. 2021, 40, e106871. [Google Scholar] [CrossRef] [PubMed]
- Lietha, D.; Izard, T. Roles of Membrane Domains in Integrin-Mediated Cell Adhesion. Int. J. Mol. Sci. 2020, 21, 5531. [Google Scholar] [CrossRef] [PubMed]
- Abe, M.; Makino, A.; Hullin-Matsuda, F.; Kamijo, K.; Ohno-Iwashita, Y.; Hanada, K.; Mizuno, H.; Miyawaki, A.; Kobayashi, T. A Role for Sphingomyelin-Rich Lipid Domains in the Accumulation of Phosphatidylinositol-4,5-Bisphosphate to the Cleavage Furrow during Cytokinesis. Mol. Cell. Biol. 2012, 32, 1396–1407. [Google Scholar] [CrossRef] [PubMed]
- Chinthalapudi, K.; Rangarajan, E.S.; Izard, T. The Interaction of Talin with the Cell Membrane Is Essential for Integrin Activation and Focal Adhesion Formation. Proc. Natl. Acad. Sci. USA 2018, 115, 10339–10344. [Google Scholar] [CrossRef] [PubMed] [Green Version]


Disclaimer/Publisher’s Note: The statements, opinions and data contained in all publications are solely those of the individual author(s) and contributor(s) and not of MDPI and/or the editor(s). MDPI and/or the editor(s) disclaim responsibility for any injury to people or property resulting from any ideas, methods, instructions or products referred to in the content. |
© 2023 by the authors. Licensee MDPI, Basel, Switzerland. This article is an open access article distributed under the terms and conditions of the Creative Commons Attribution (CC BY) license (https://creativecommons.org/licenses/by/4.0/).
Share and Cite
Vanderroost, J.; Avalosse, N.; Mohammed, D.; Hoffmann, D.; Henriet, P.; Pierreux, C.E.; Alsteens, D.; Tyteca, D. Cholesterol and Sphingomyelin Polarize at the Leading Edge of Migrating Myoblasts and Involve Their Clustering in Submicrometric Domains. Biomolecules 2023, 13, 319. https://doi.org/10.3390/biom13020319
Vanderroost J, Avalosse N, Mohammed D, Hoffmann D, Henriet P, Pierreux CE, Alsteens D, Tyteca D. Cholesterol and Sphingomyelin Polarize at the Leading Edge of Migrating Myoblasts and Involve Their Clustering in Submicrometric Domains. Biomolecules. 2023; 13(2):319. https://doi.org/10.3390/biom13020319
Chicago/Turabian StyleVanderroost, Juliette, Noémie Avalosse, Danahe Mohammed, Delia Hoffmann, Patrick Henriet, Christophe E. Pierreux, David Alsteens, and Donatienne Tyteca. 2023. "Cholesterol and Sphingomyelin Polarize at the Leading Edge of Migrating Myoblasts and Involve Their Clustering in Submicrometric Domains" Biomolecules 13, no. 2: 319. https://doi.org/10.3390/biom13020319