
Interaction between Butyrate and Tumor Necrosis Factor α in Primary Rat Colonocytes

 ,
, 
Abstract
:1. Introduction
2. Materials and Methods
2.1. Reagents
2.2. Cell Culture
2.3. AlamarBlue™ (Cell Viability) and CellTox™ Green (Cytotoxicity)
2.4. CellTiter-Glo® Luminescent Cell Viability Assay (Relative ATP Levels)
2.5. Mitochondrial Membrane Potential
2.6. Intracellular and Mitochondrial Calcium
2.7. H2DCFDA Assay (ROS Production)
2.8. Seahorse Flux Assays (Cell Mitochondrial and Glycolytic Stress Tests)
2.9. Gene Expression Analysis
2.10. Cell Culture Exposure for Metabolomics
2.11. Metabolomics Extraction and Analysis via Ultra-High-Performance Liquid Chromatography–Tandem Mass Spectrometry
2.12. Statistical Analysis
3. Results
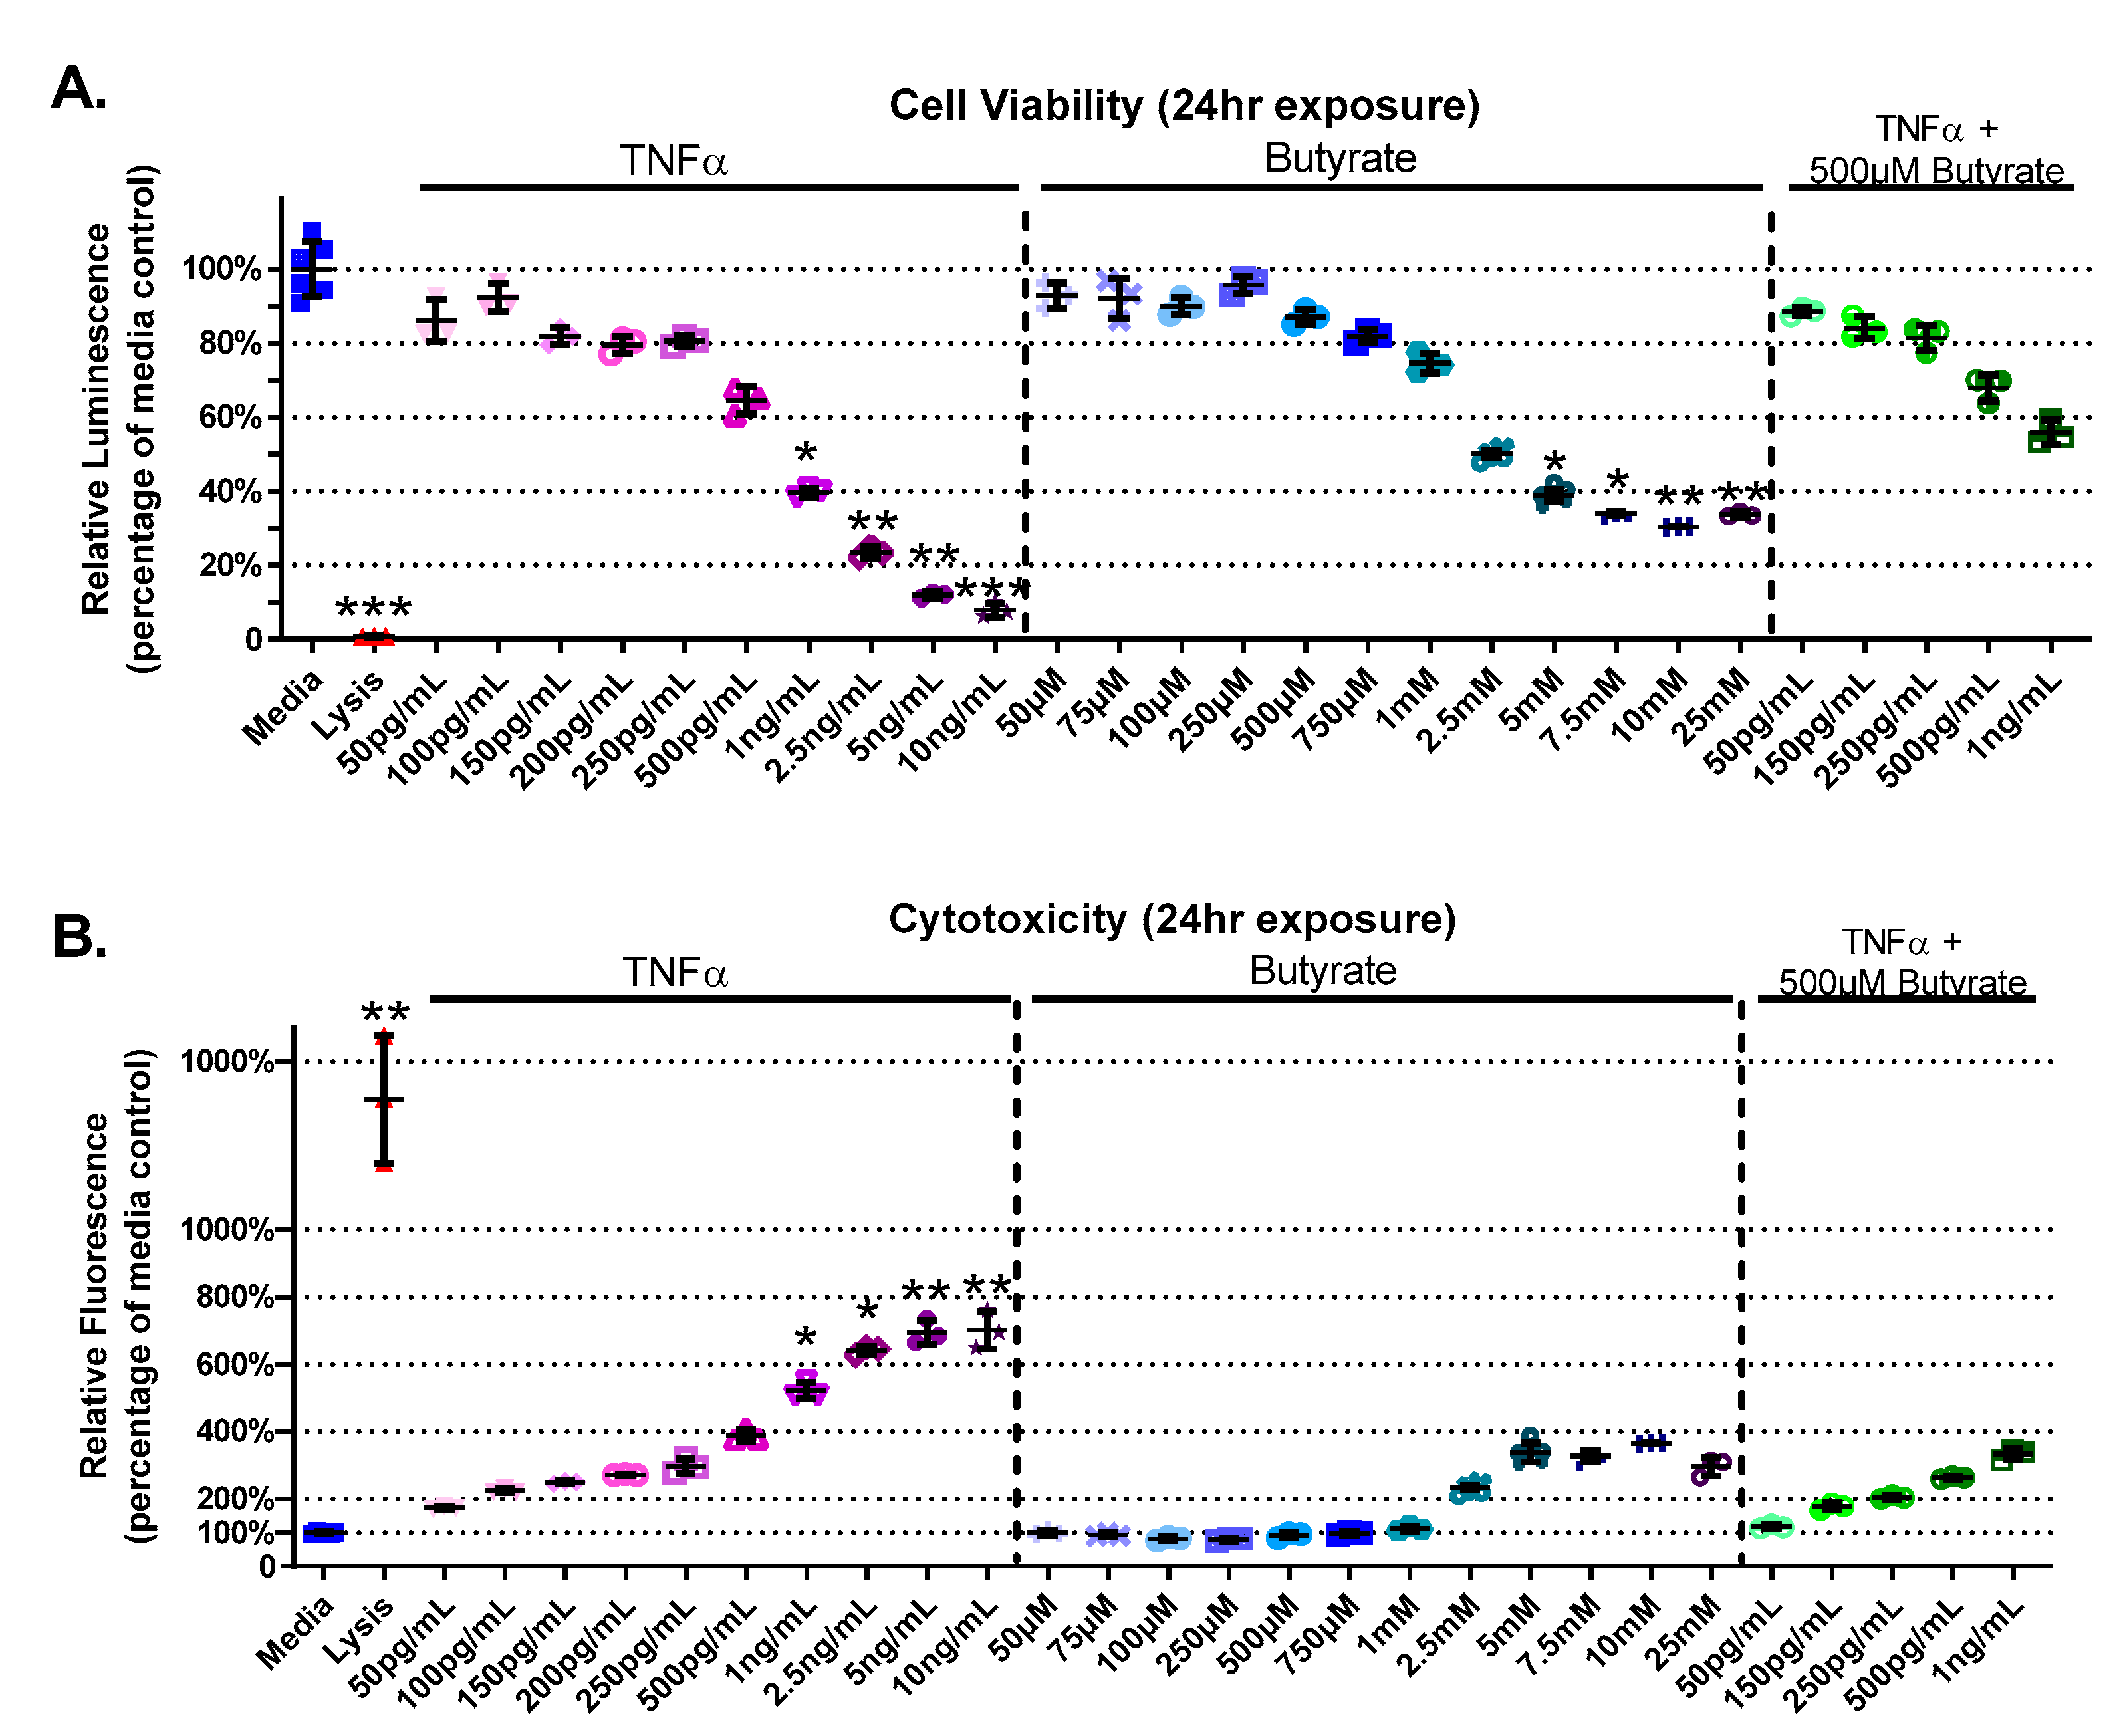
3.1. Cell Viability and Cytotoxicity
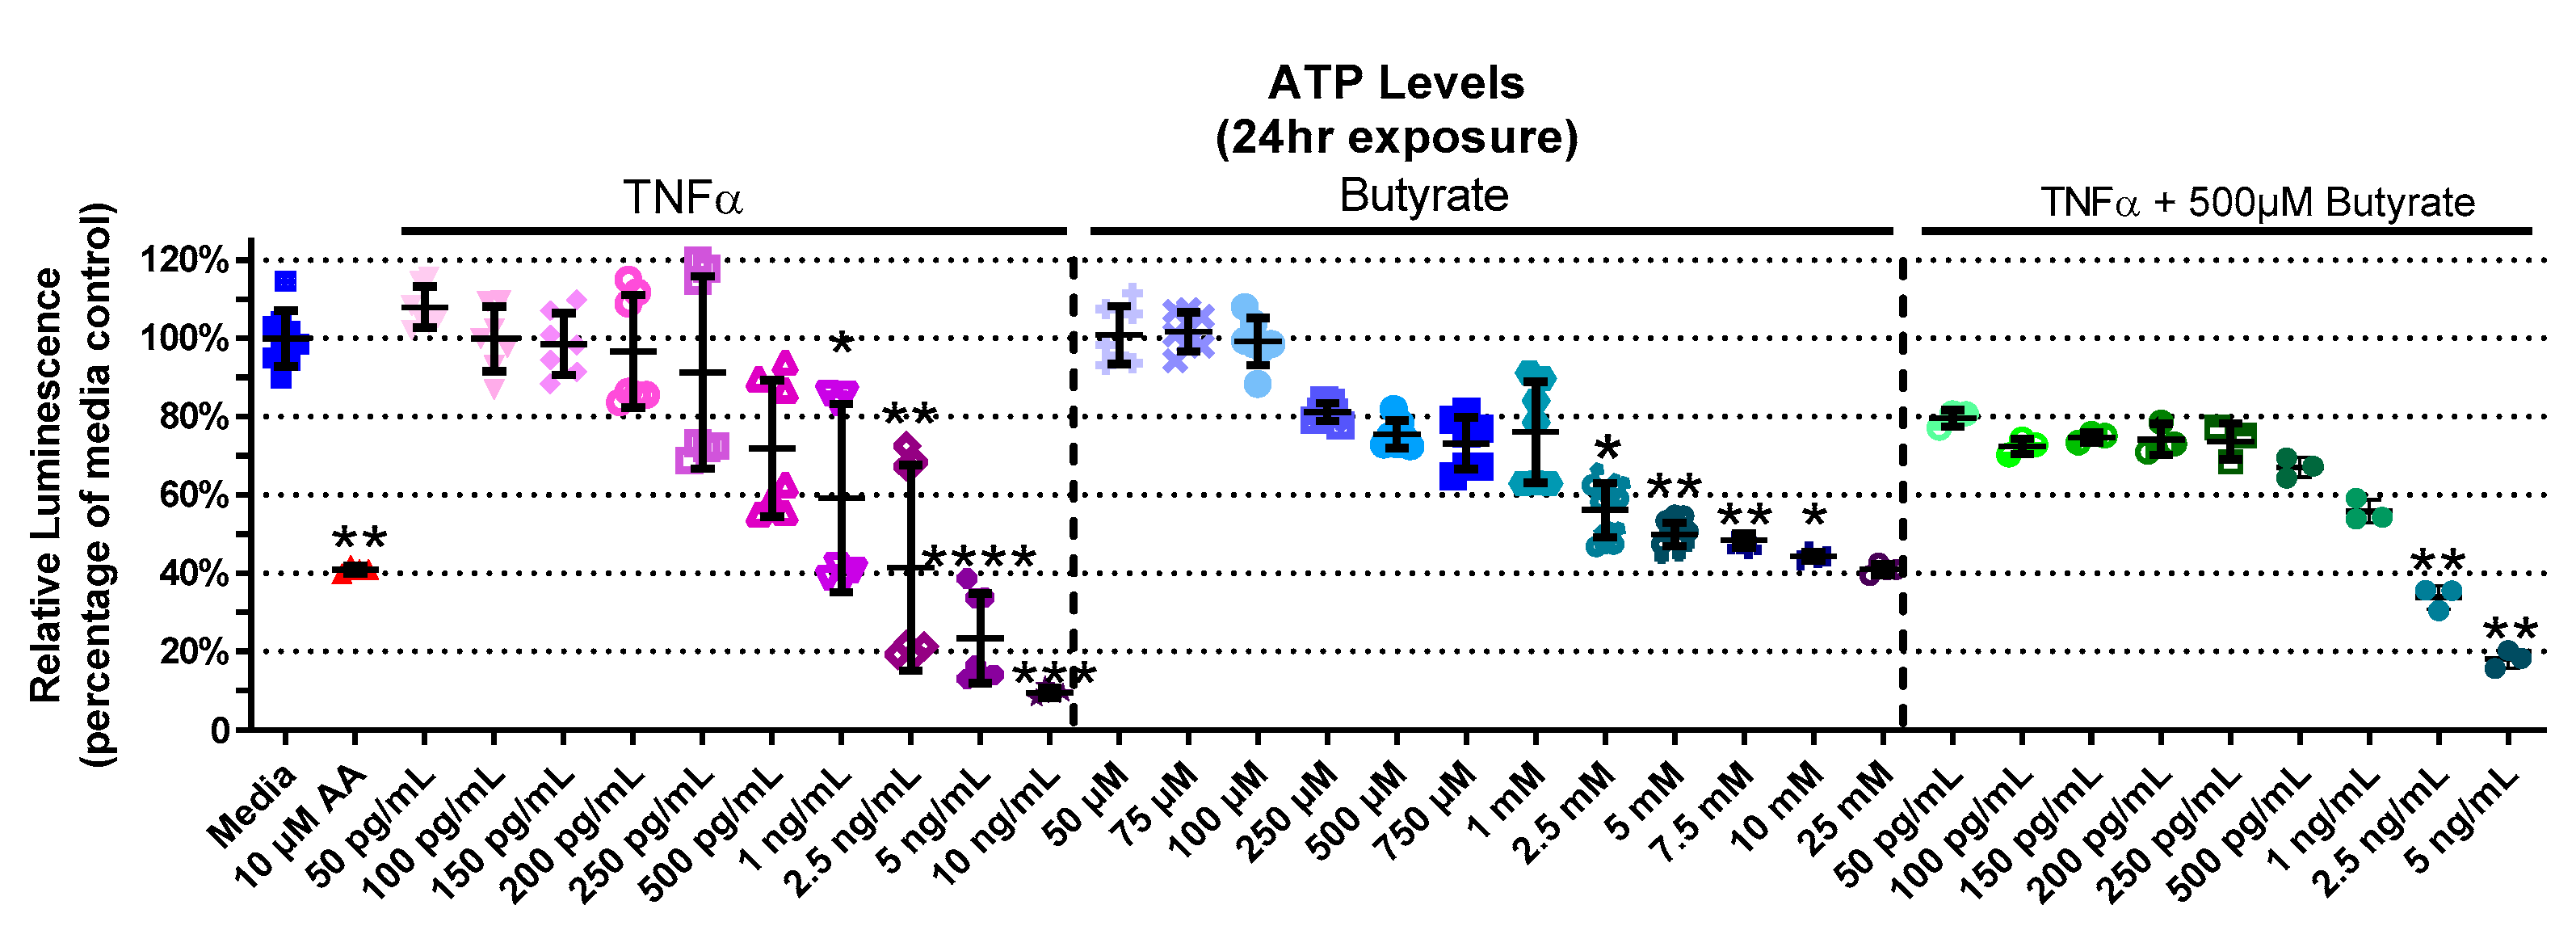
3.2. Relative ATP Levels
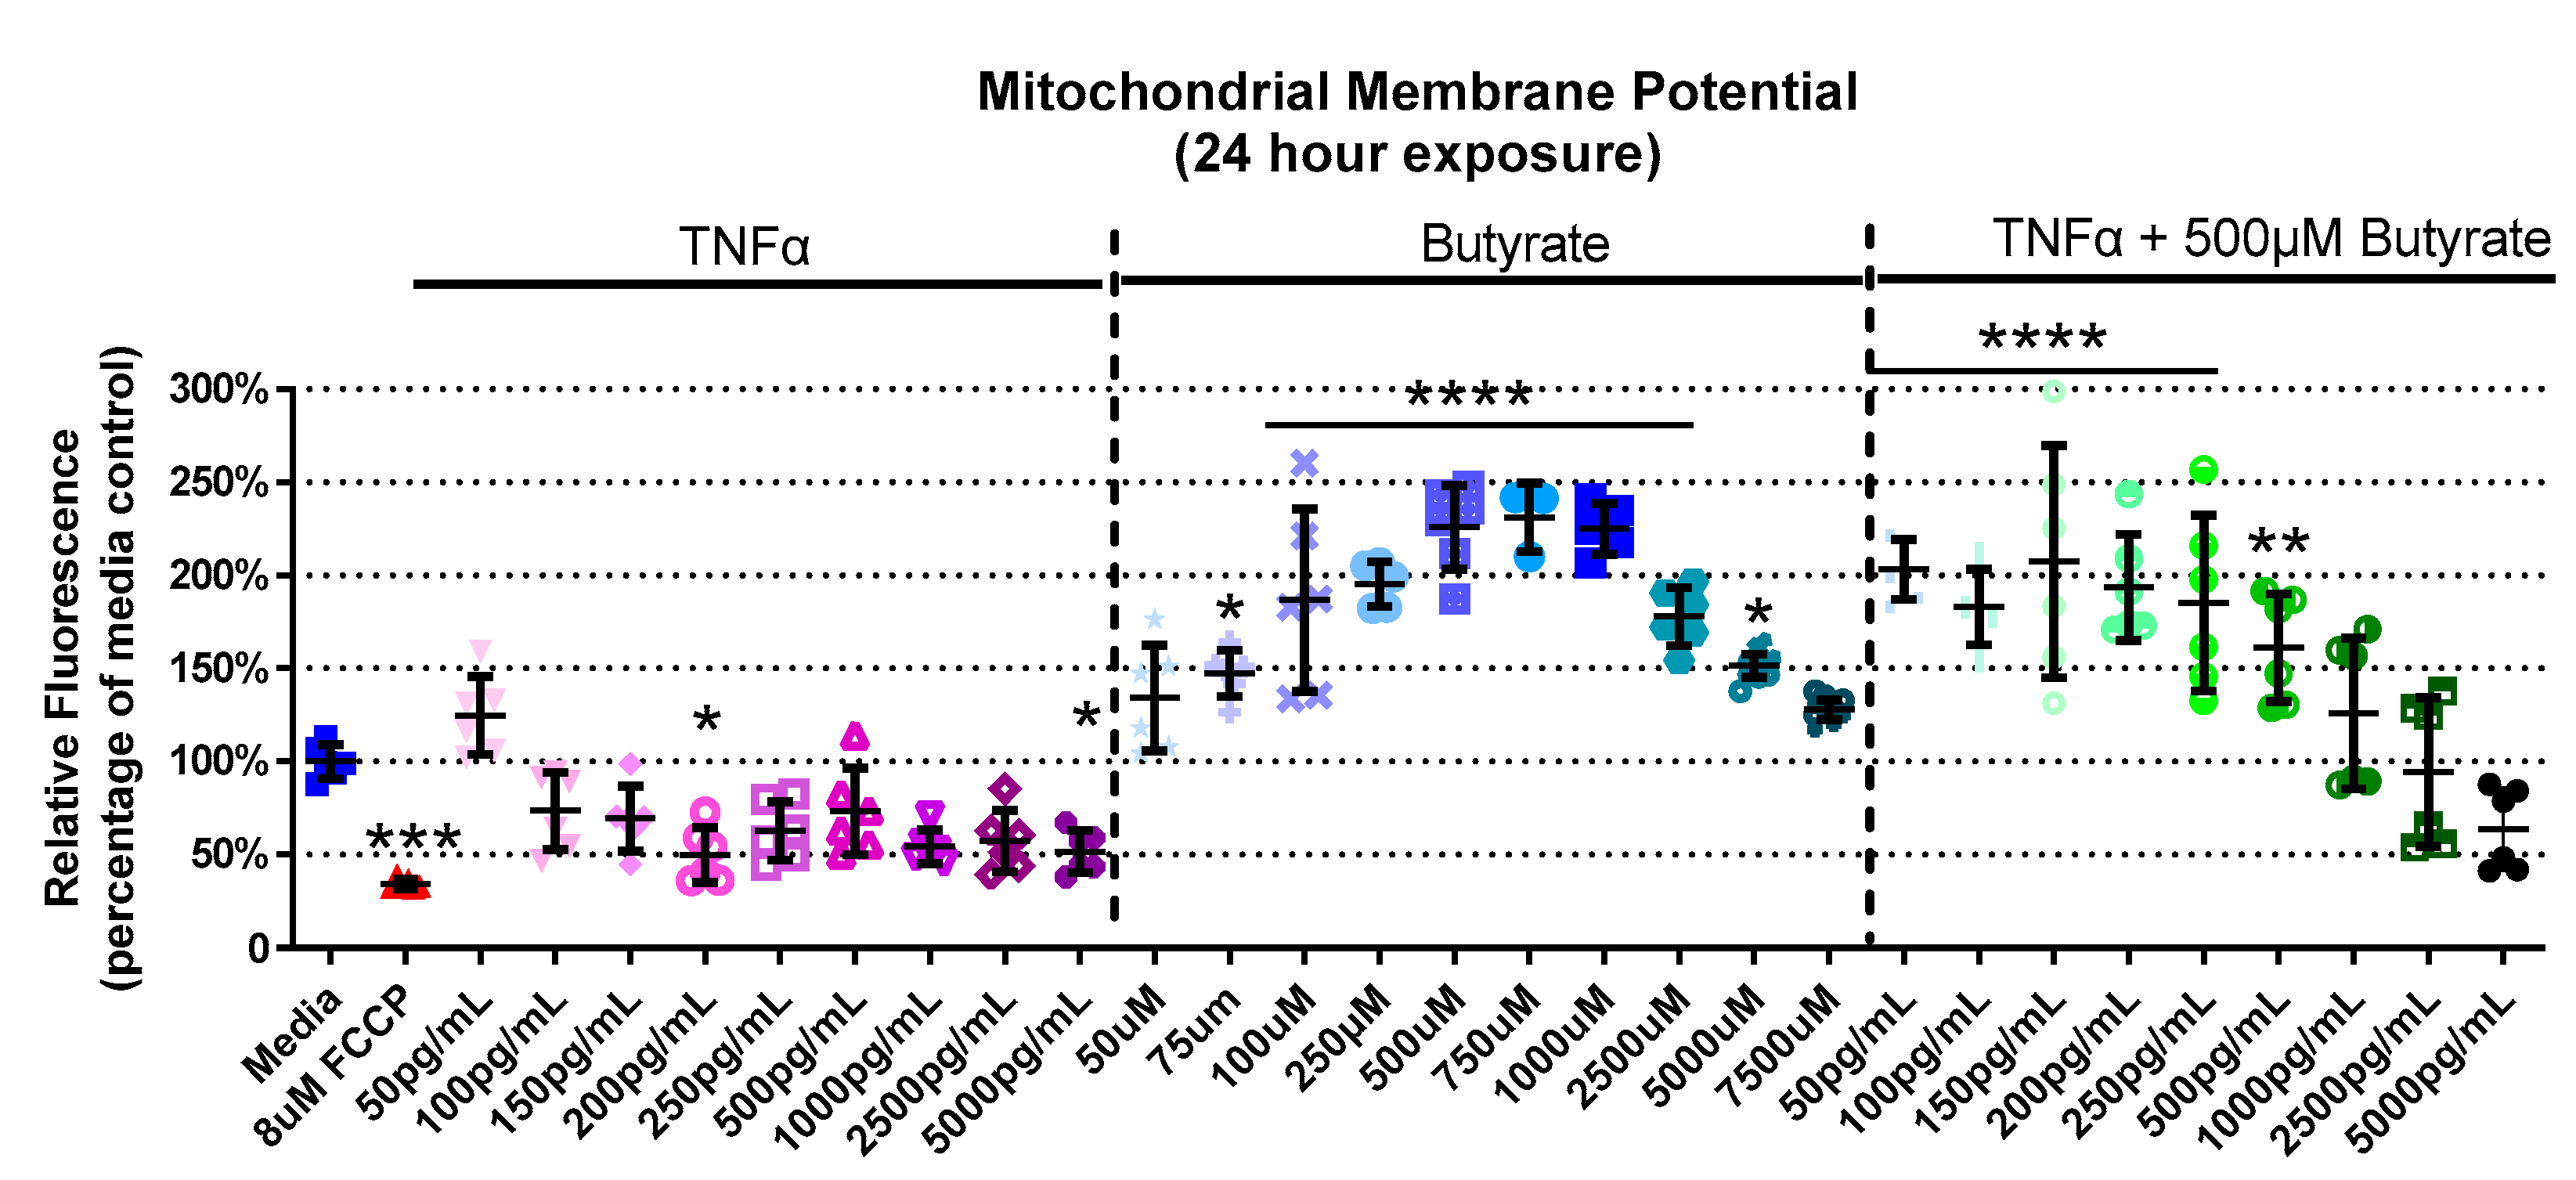
3.3. Mitochondrial Membrane Potential
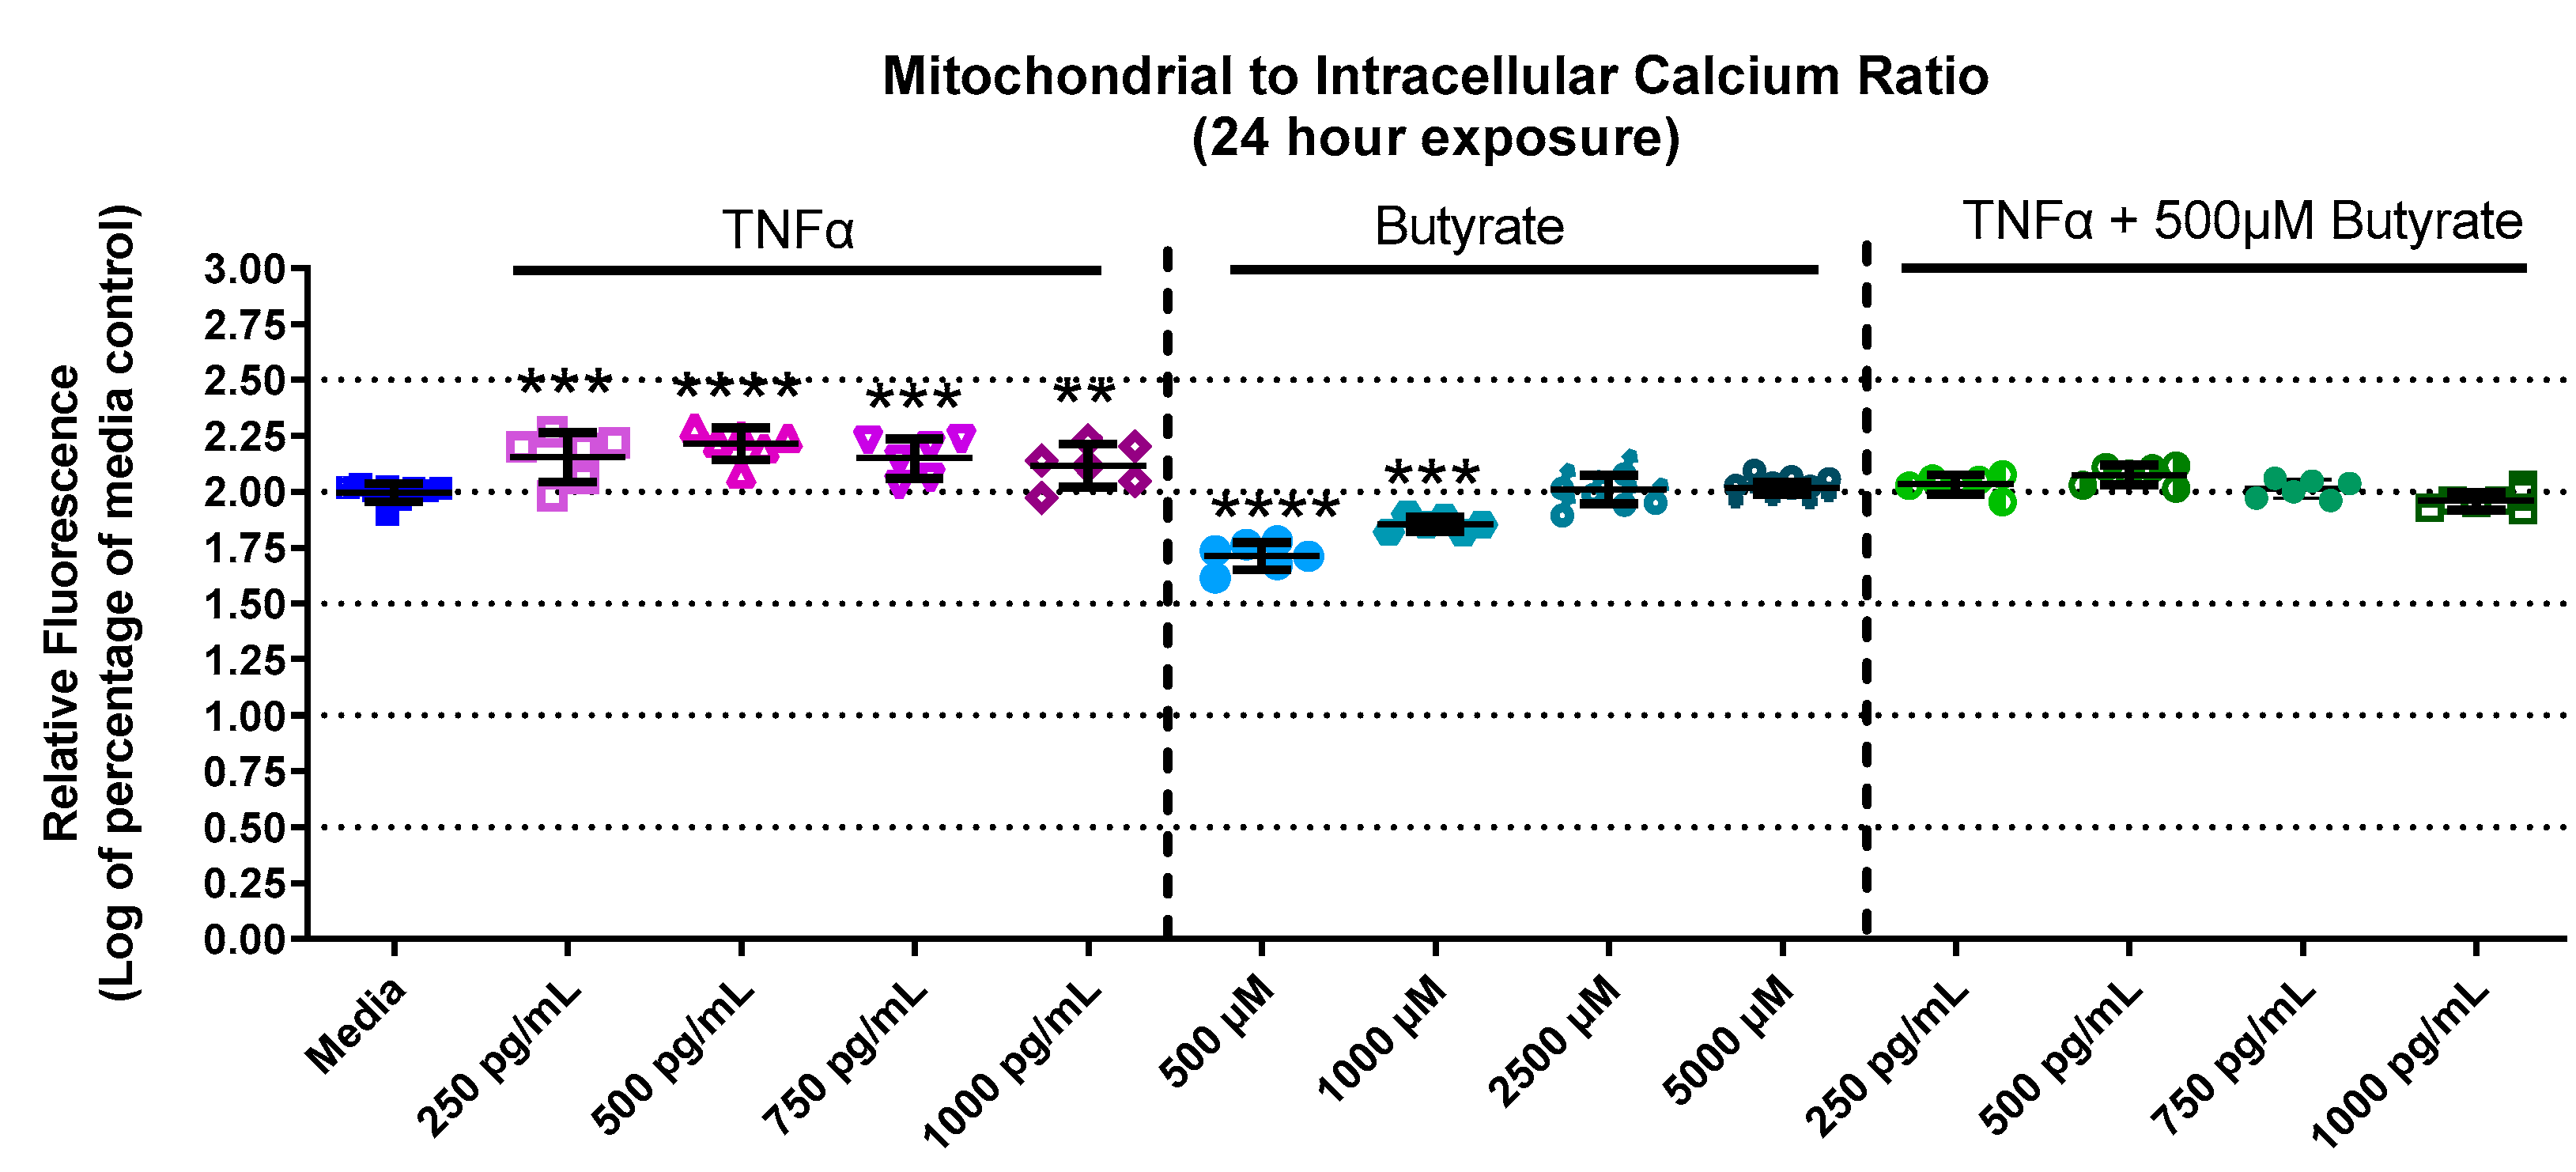
3.4. Mitochondrial and Intracellular Calcium
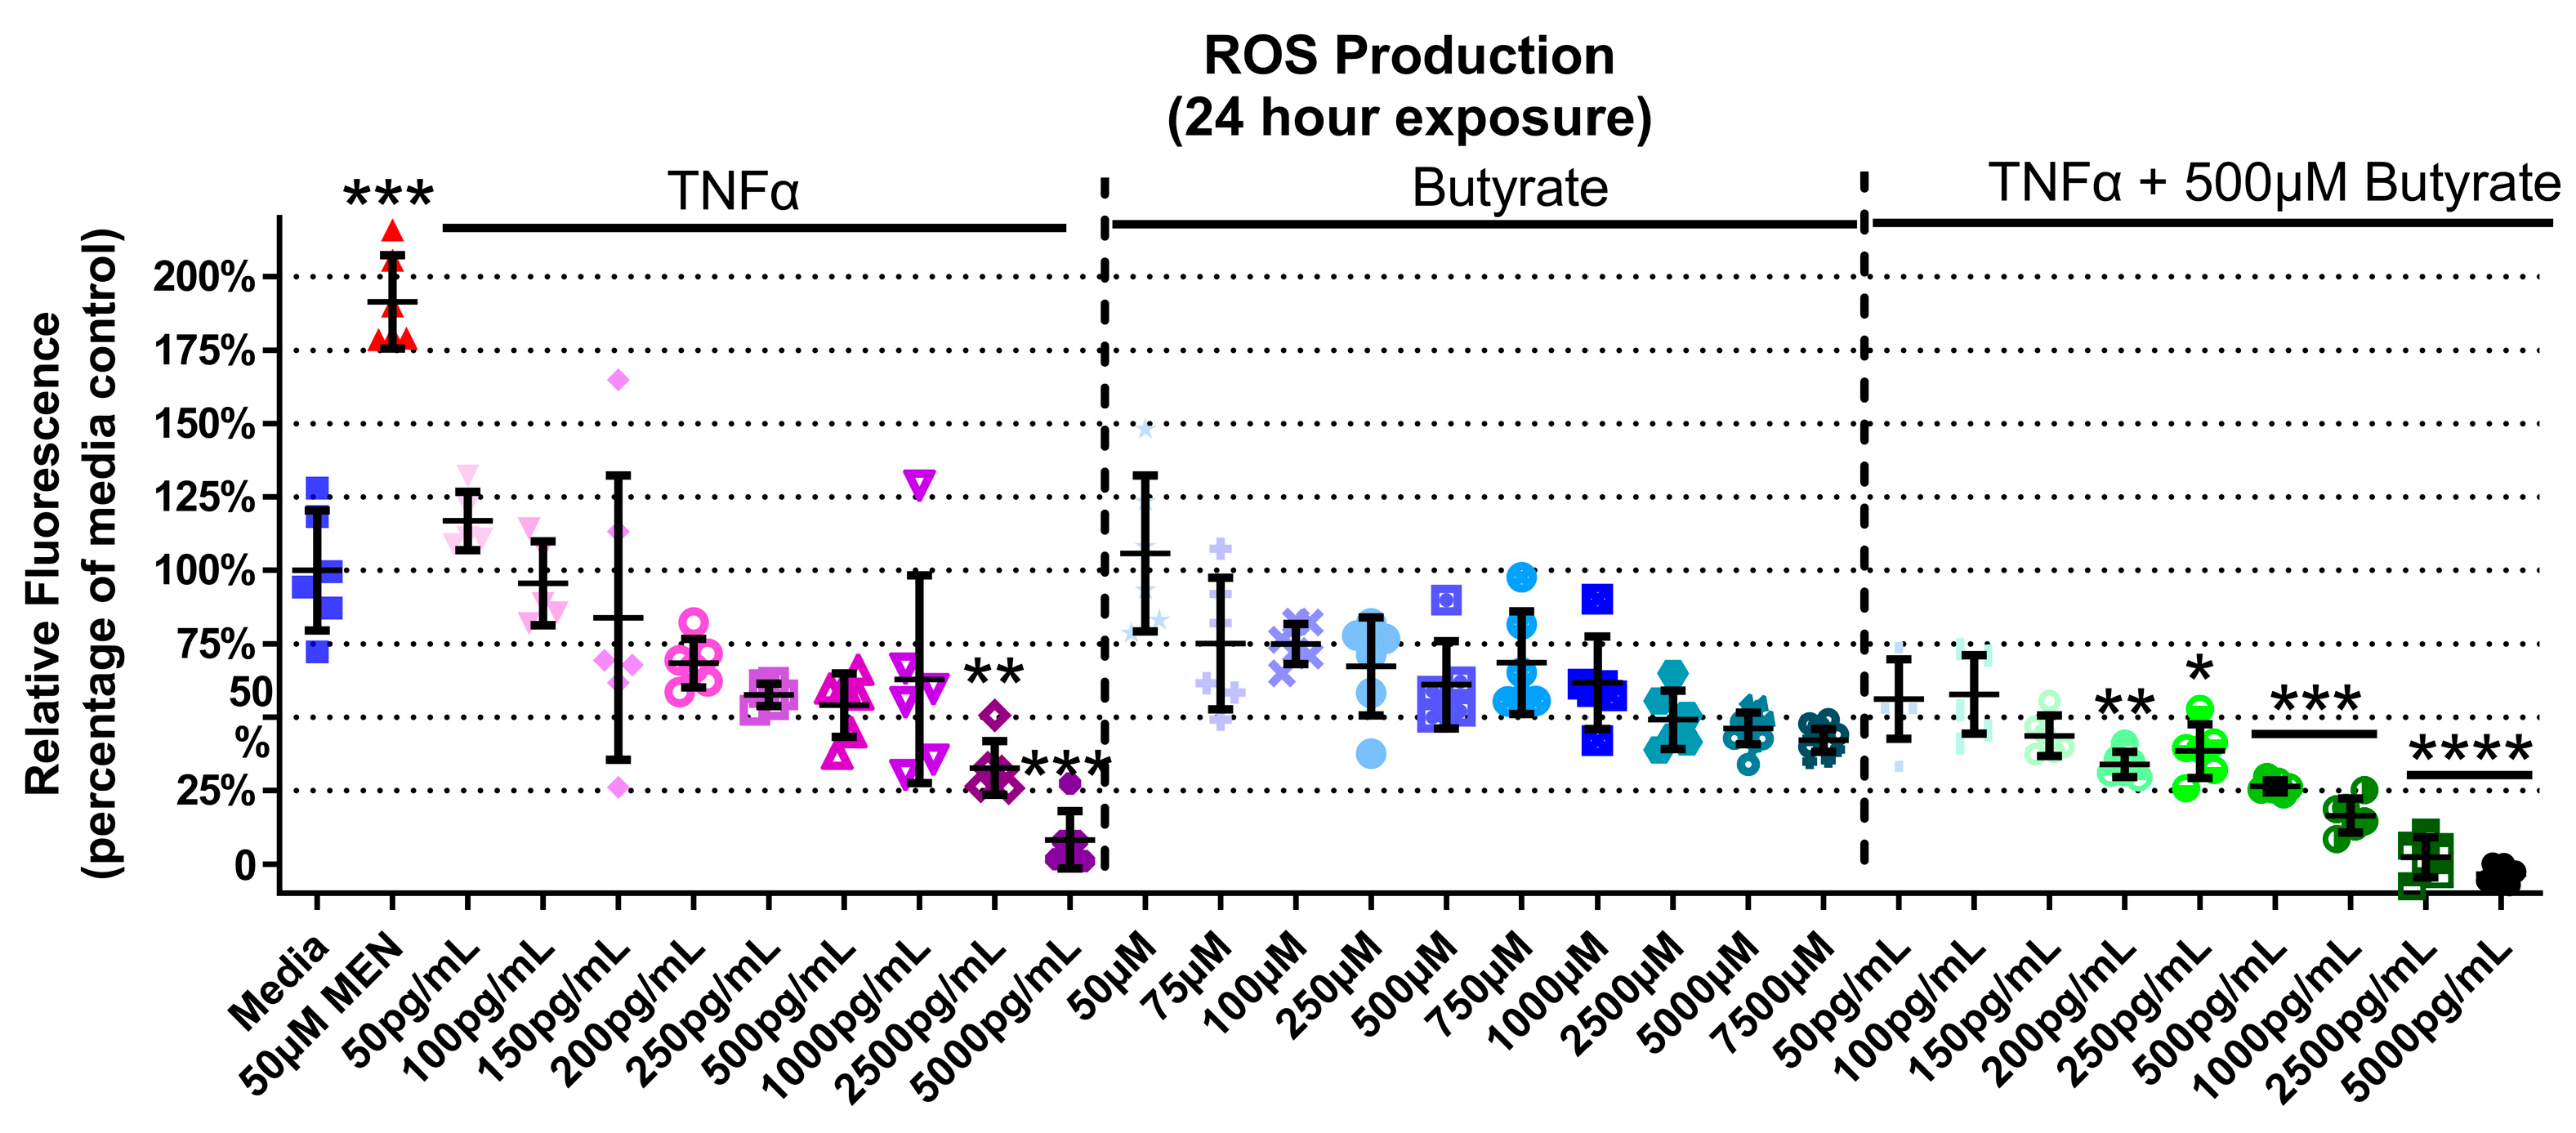
3.5. ROS Production
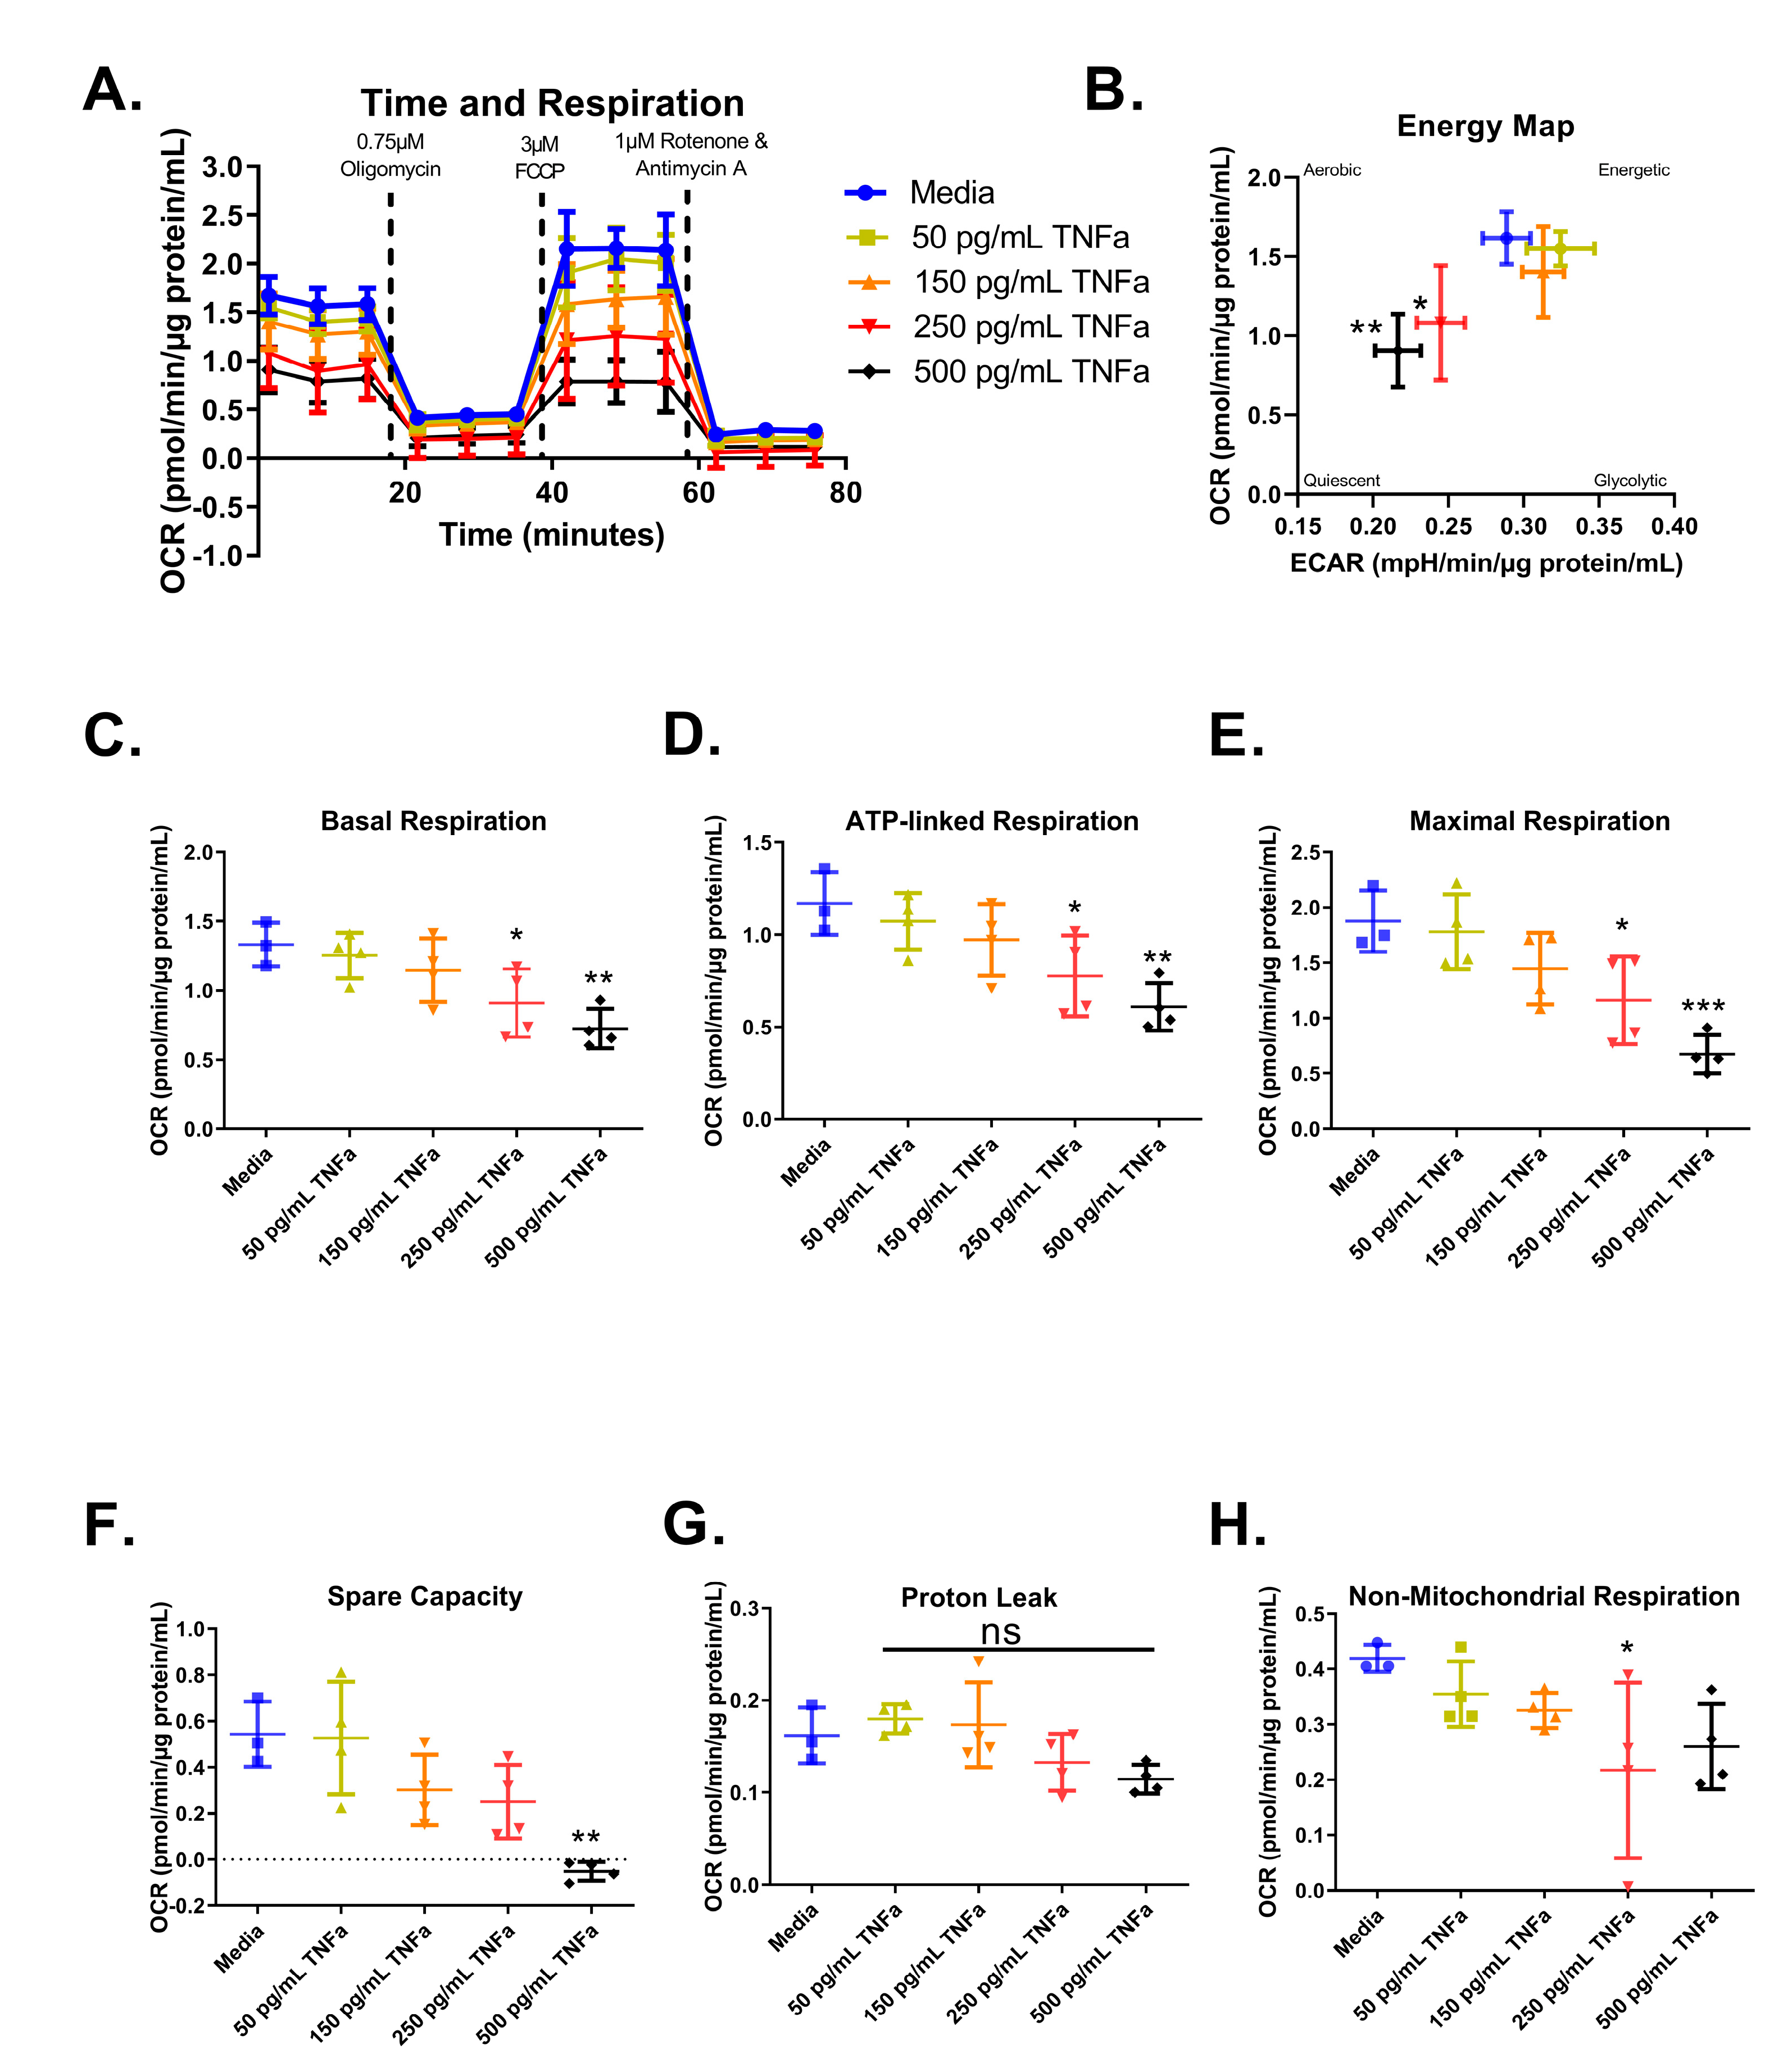
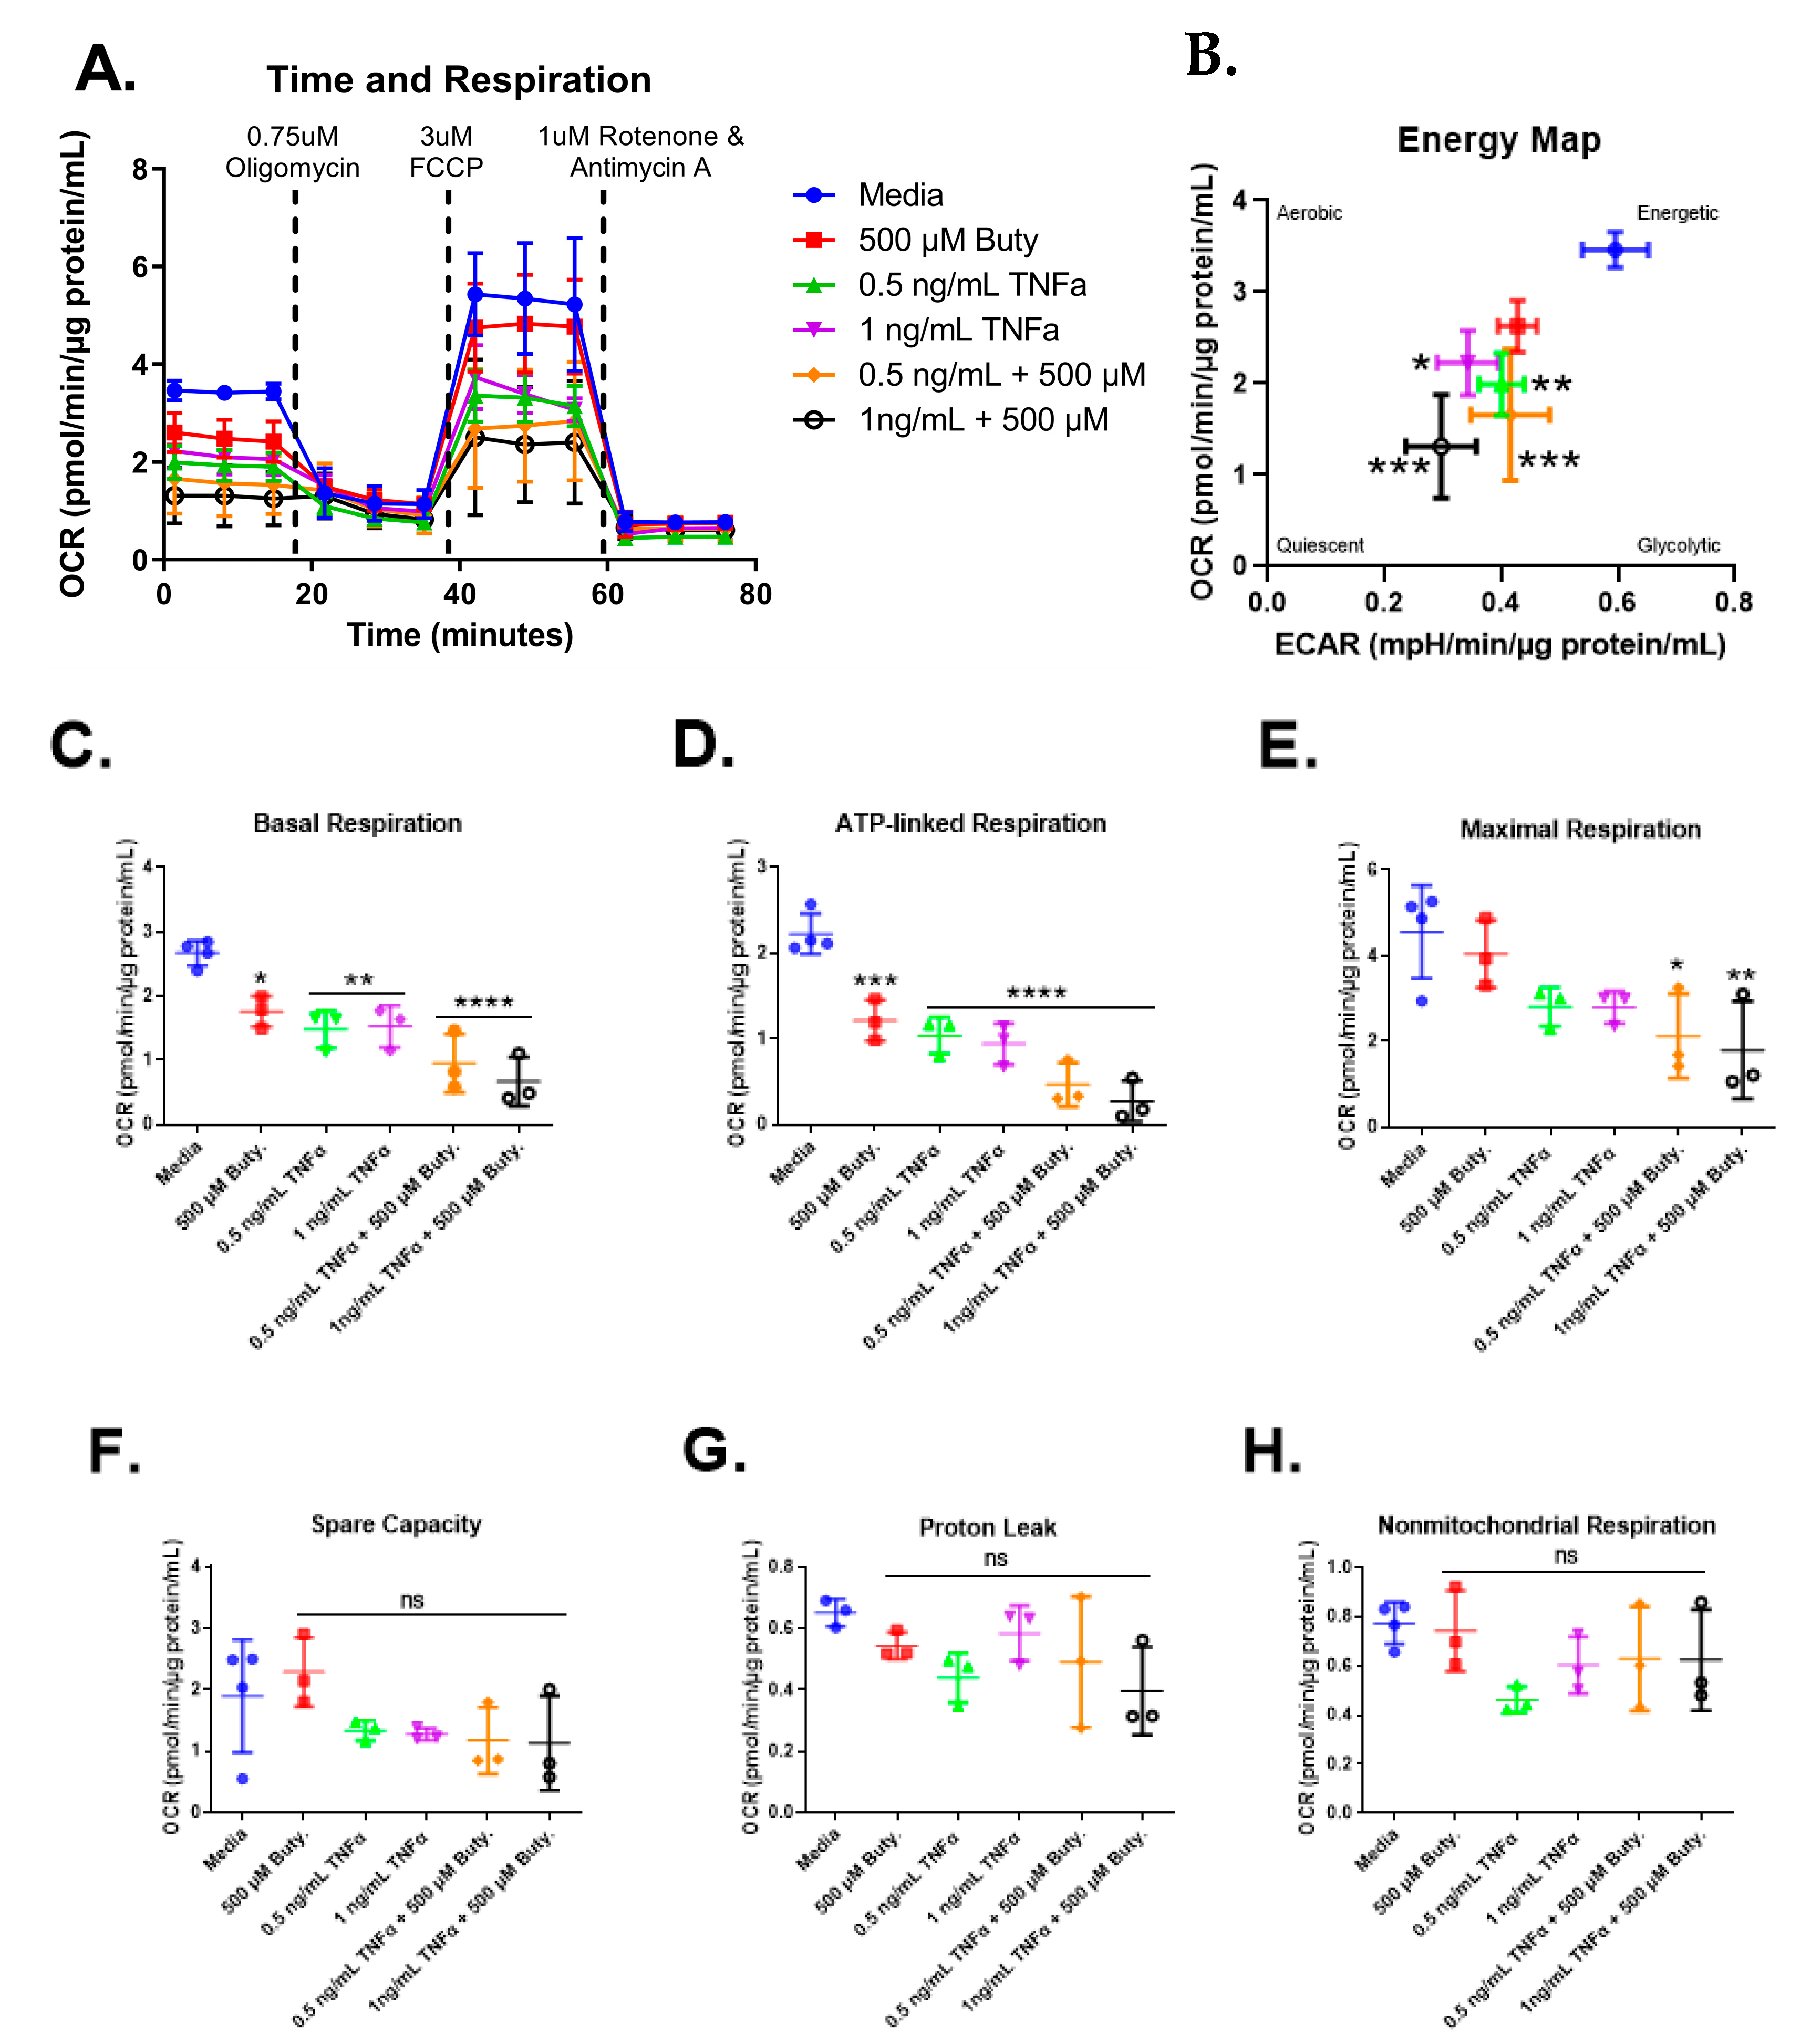
3.6. Cell Mitochondrial Stress Test
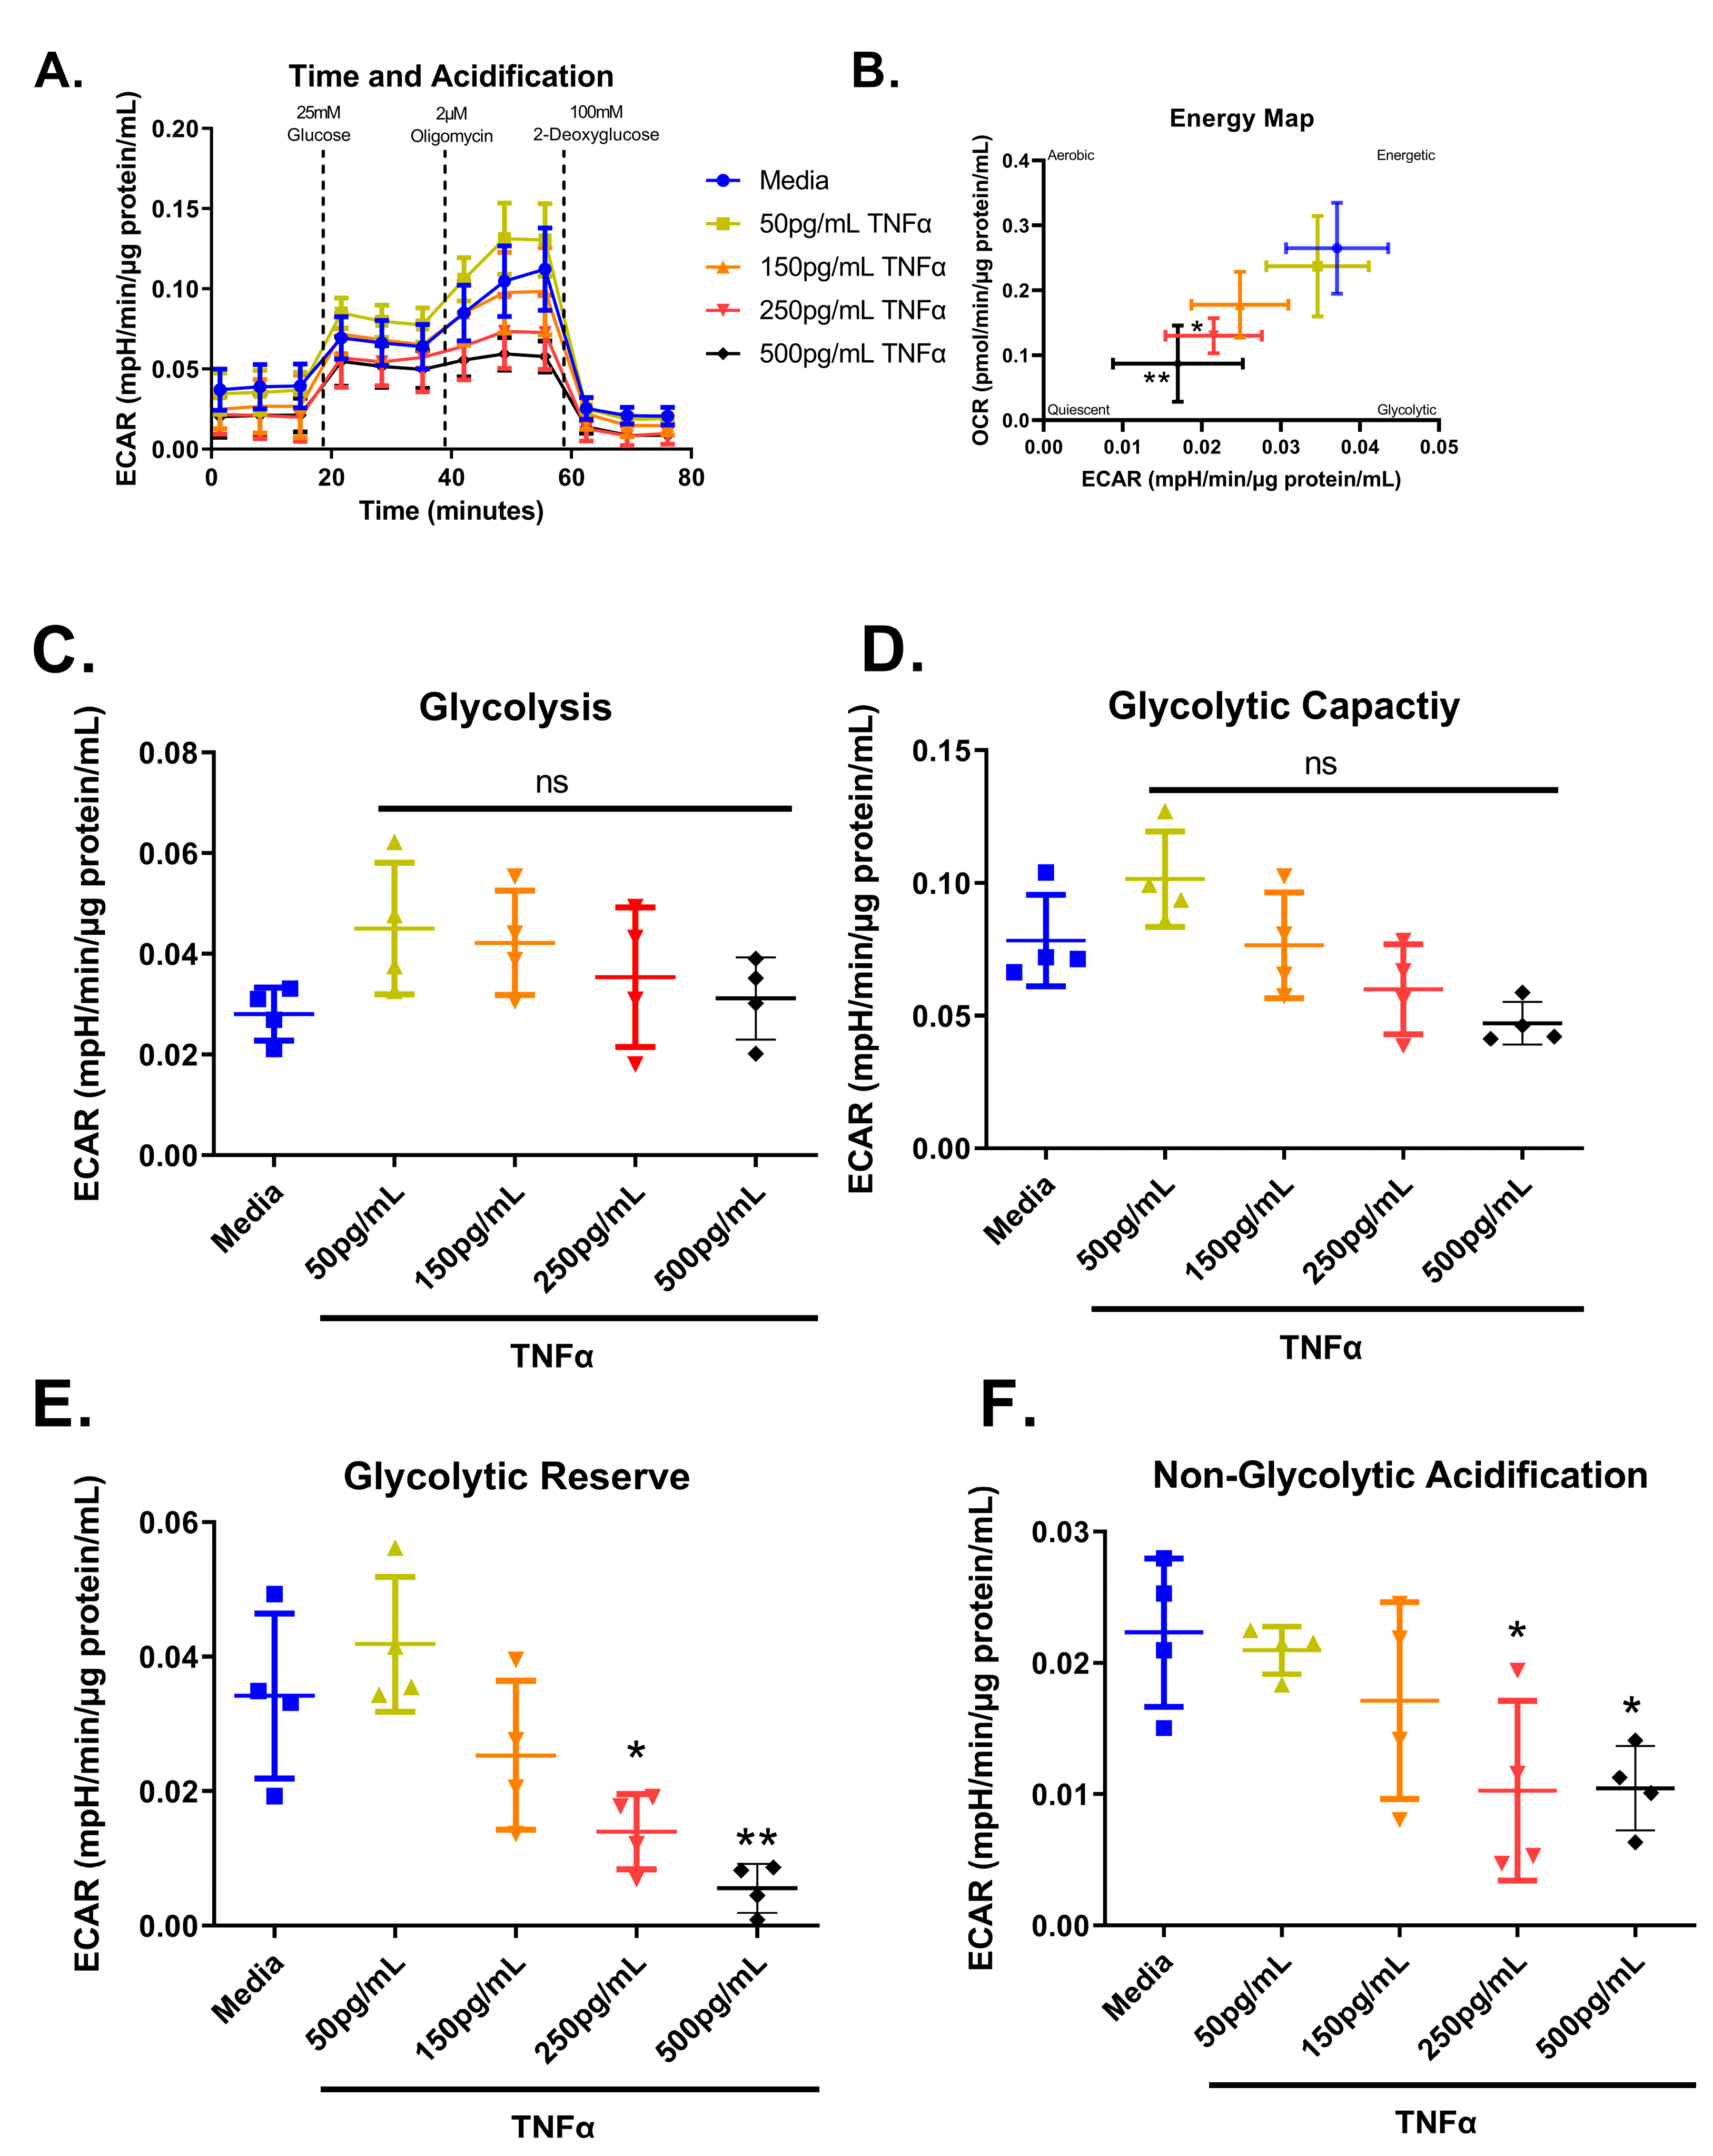
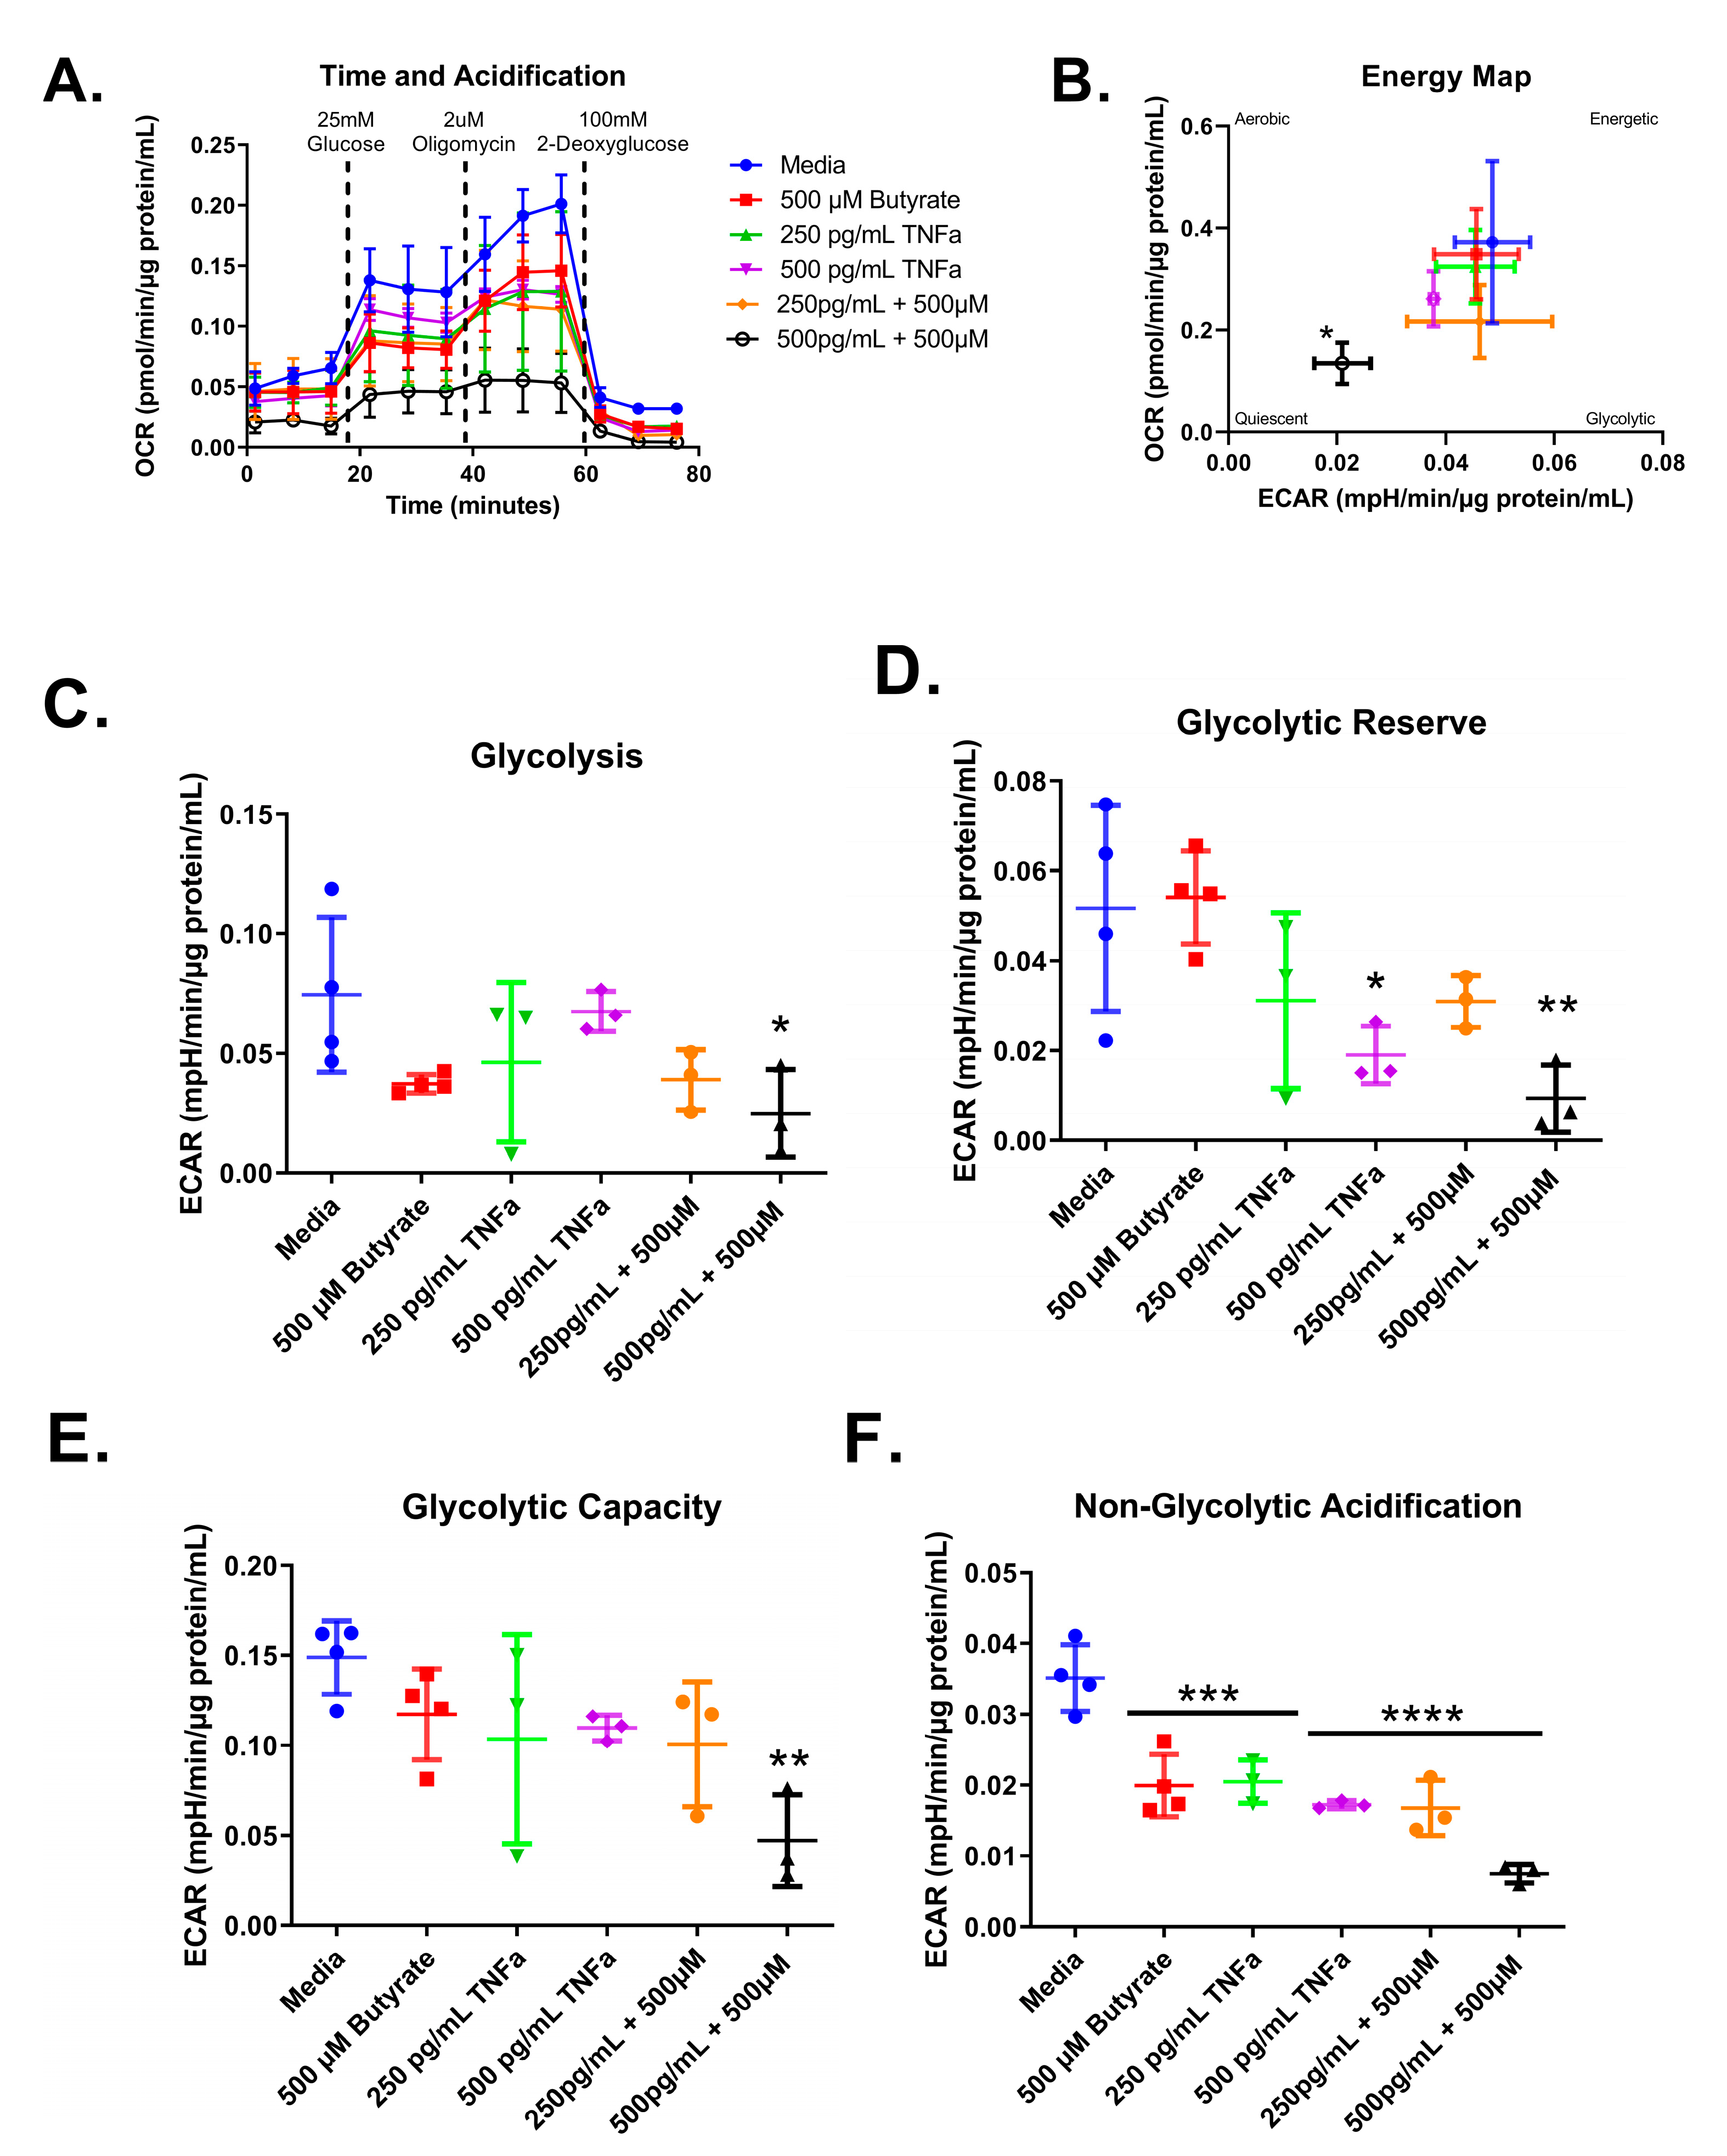
3.7. Glycolytic Stress Test
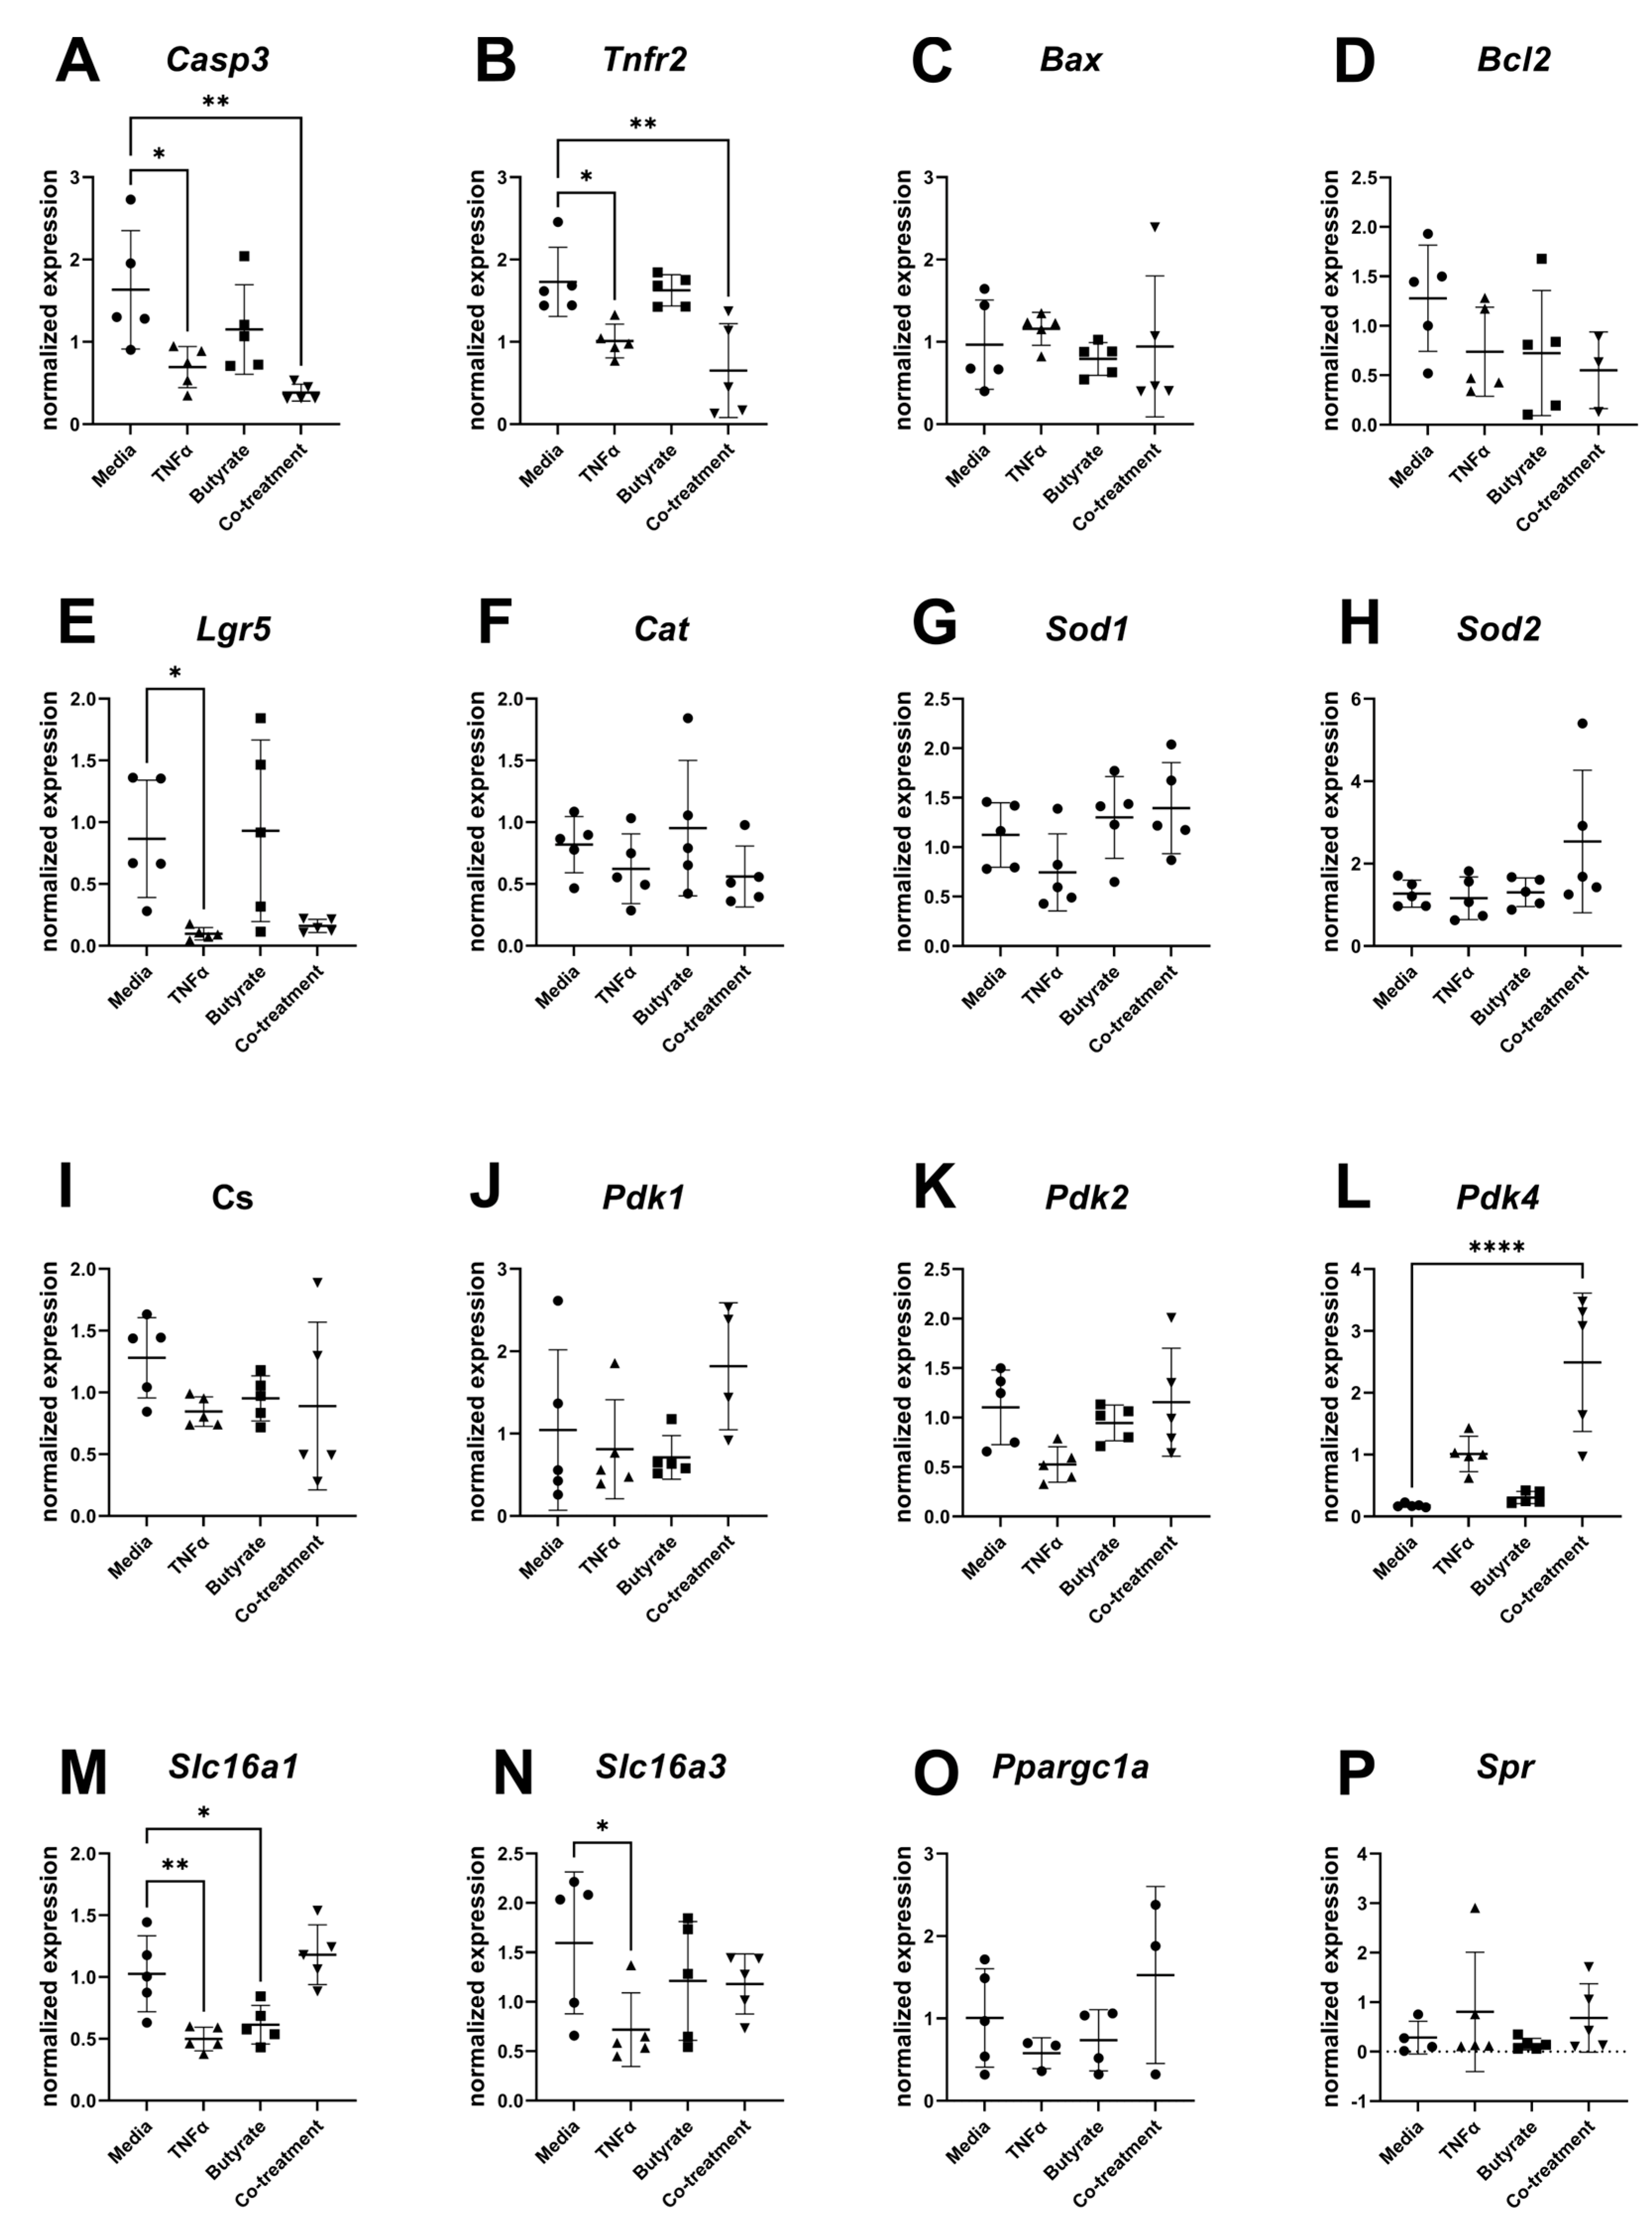
3.8. Gene Expression
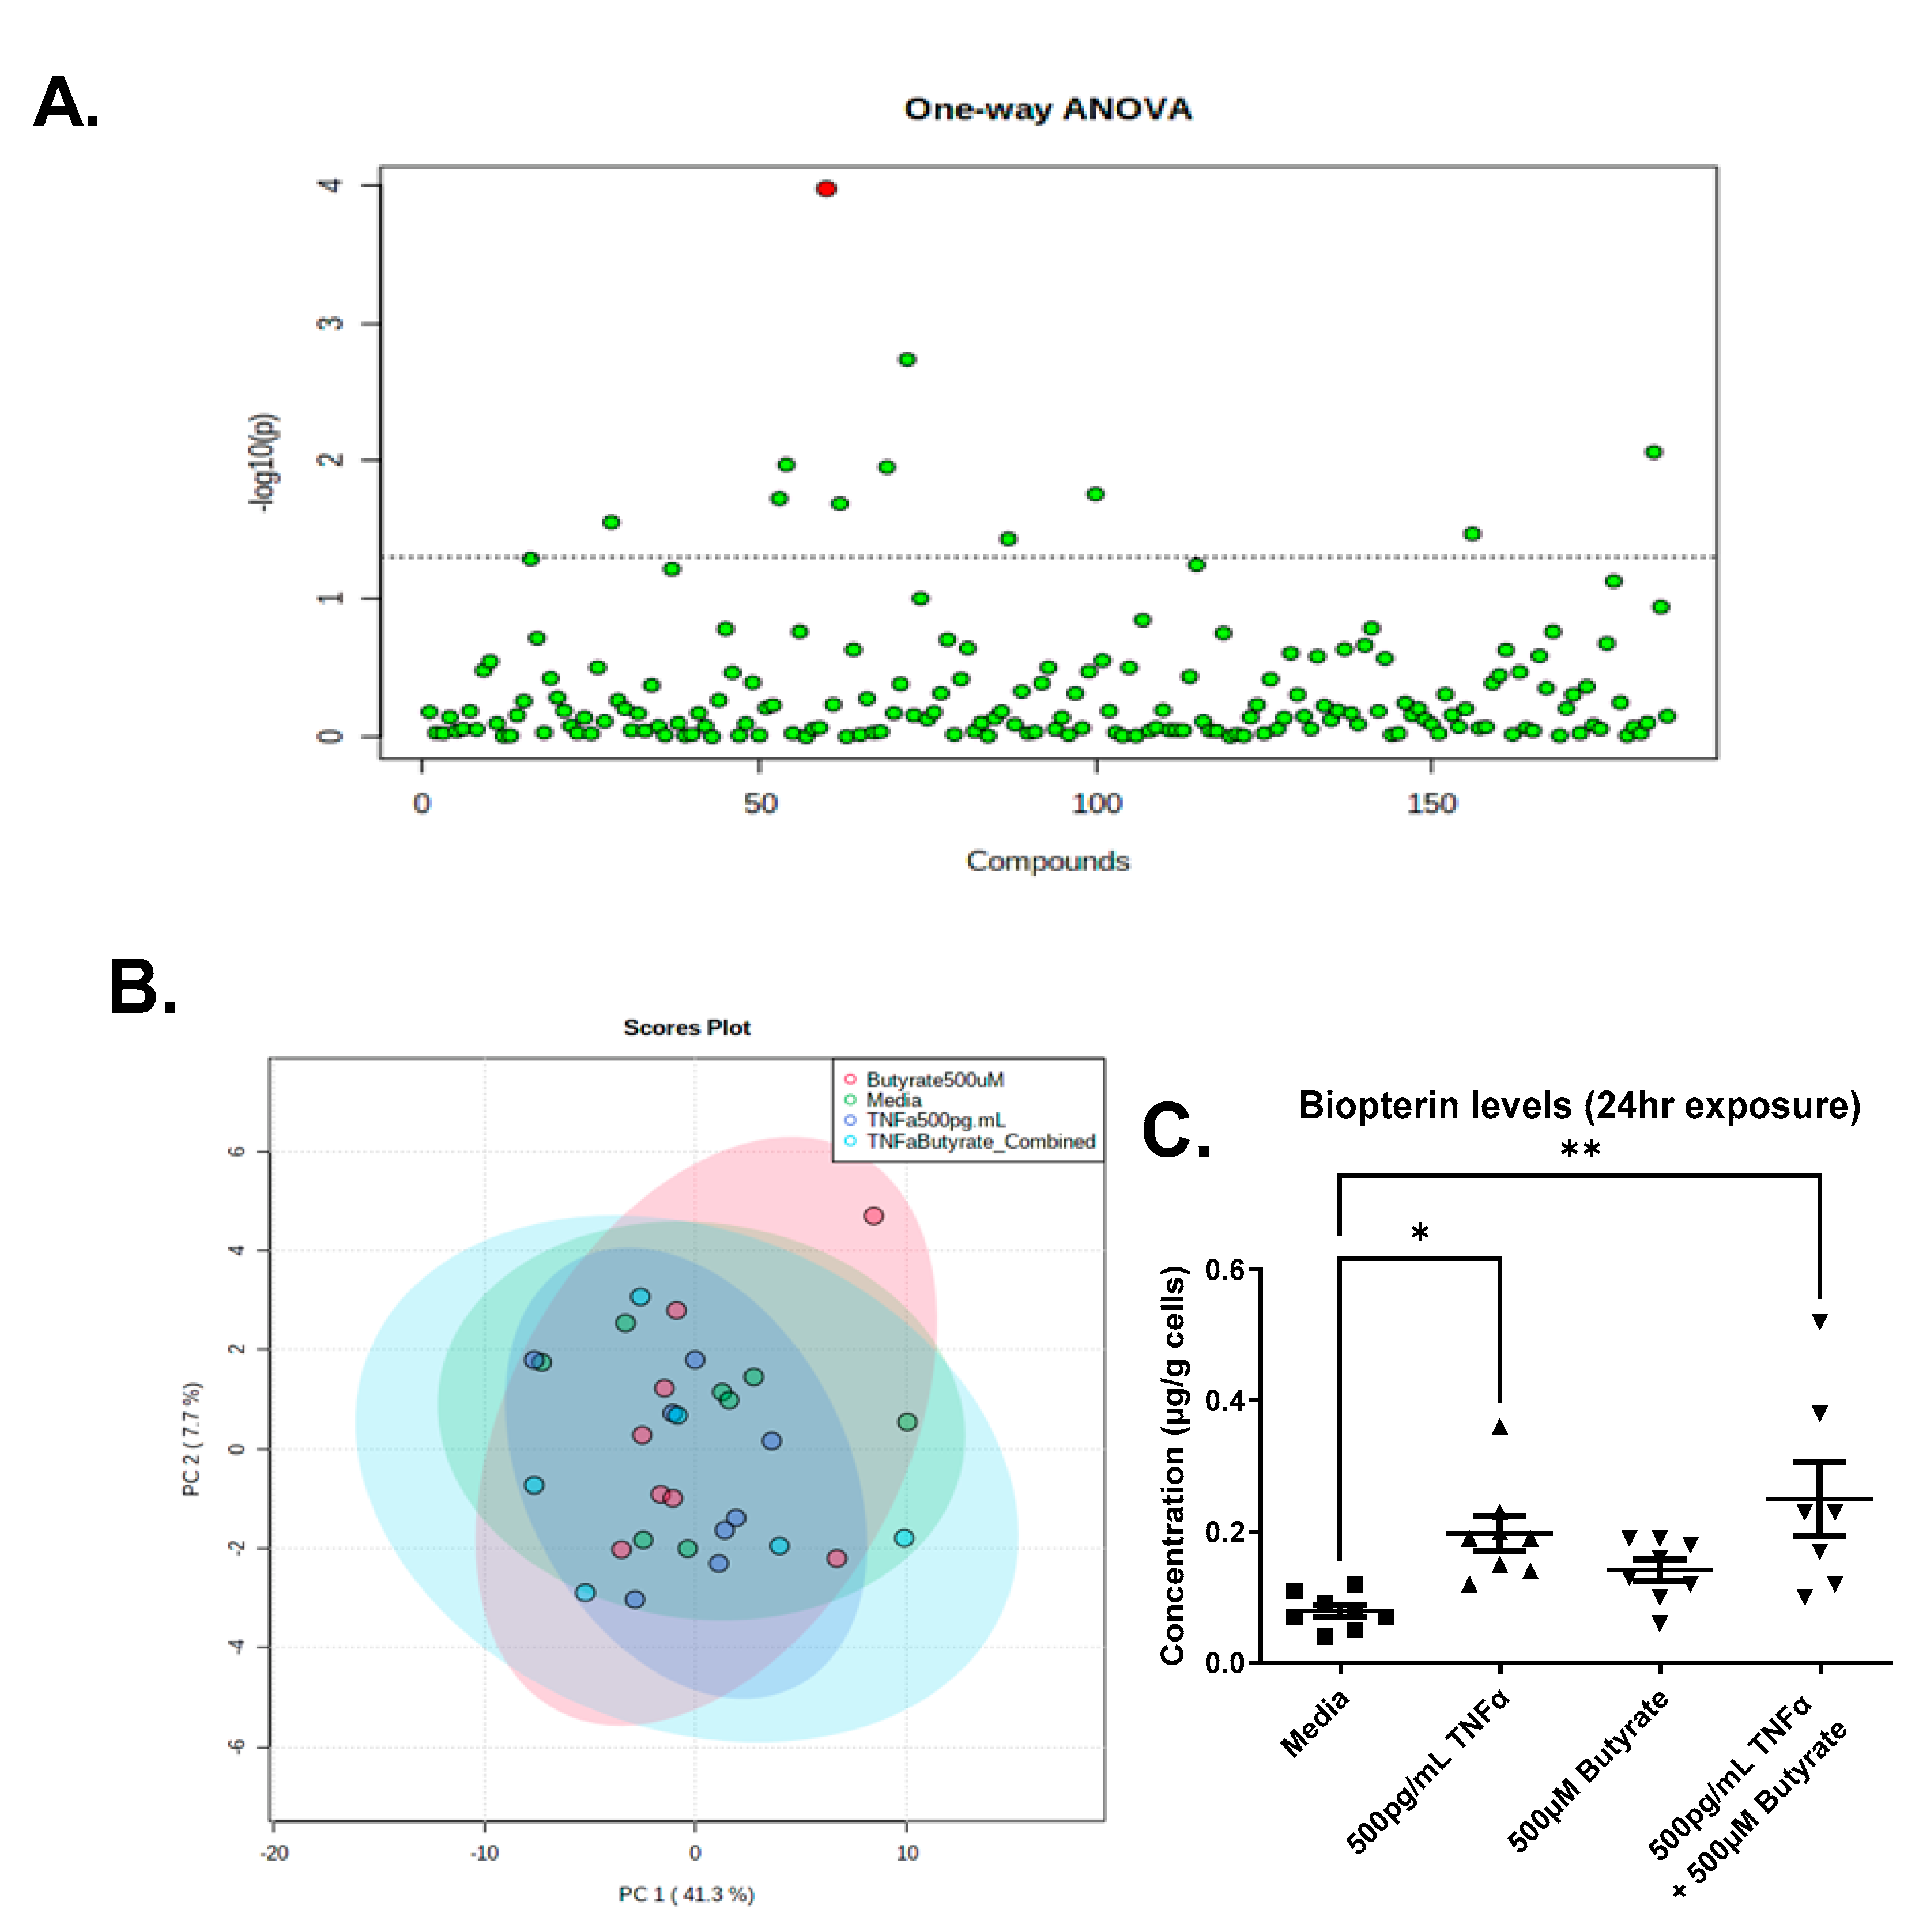
3.9. Metabolomics
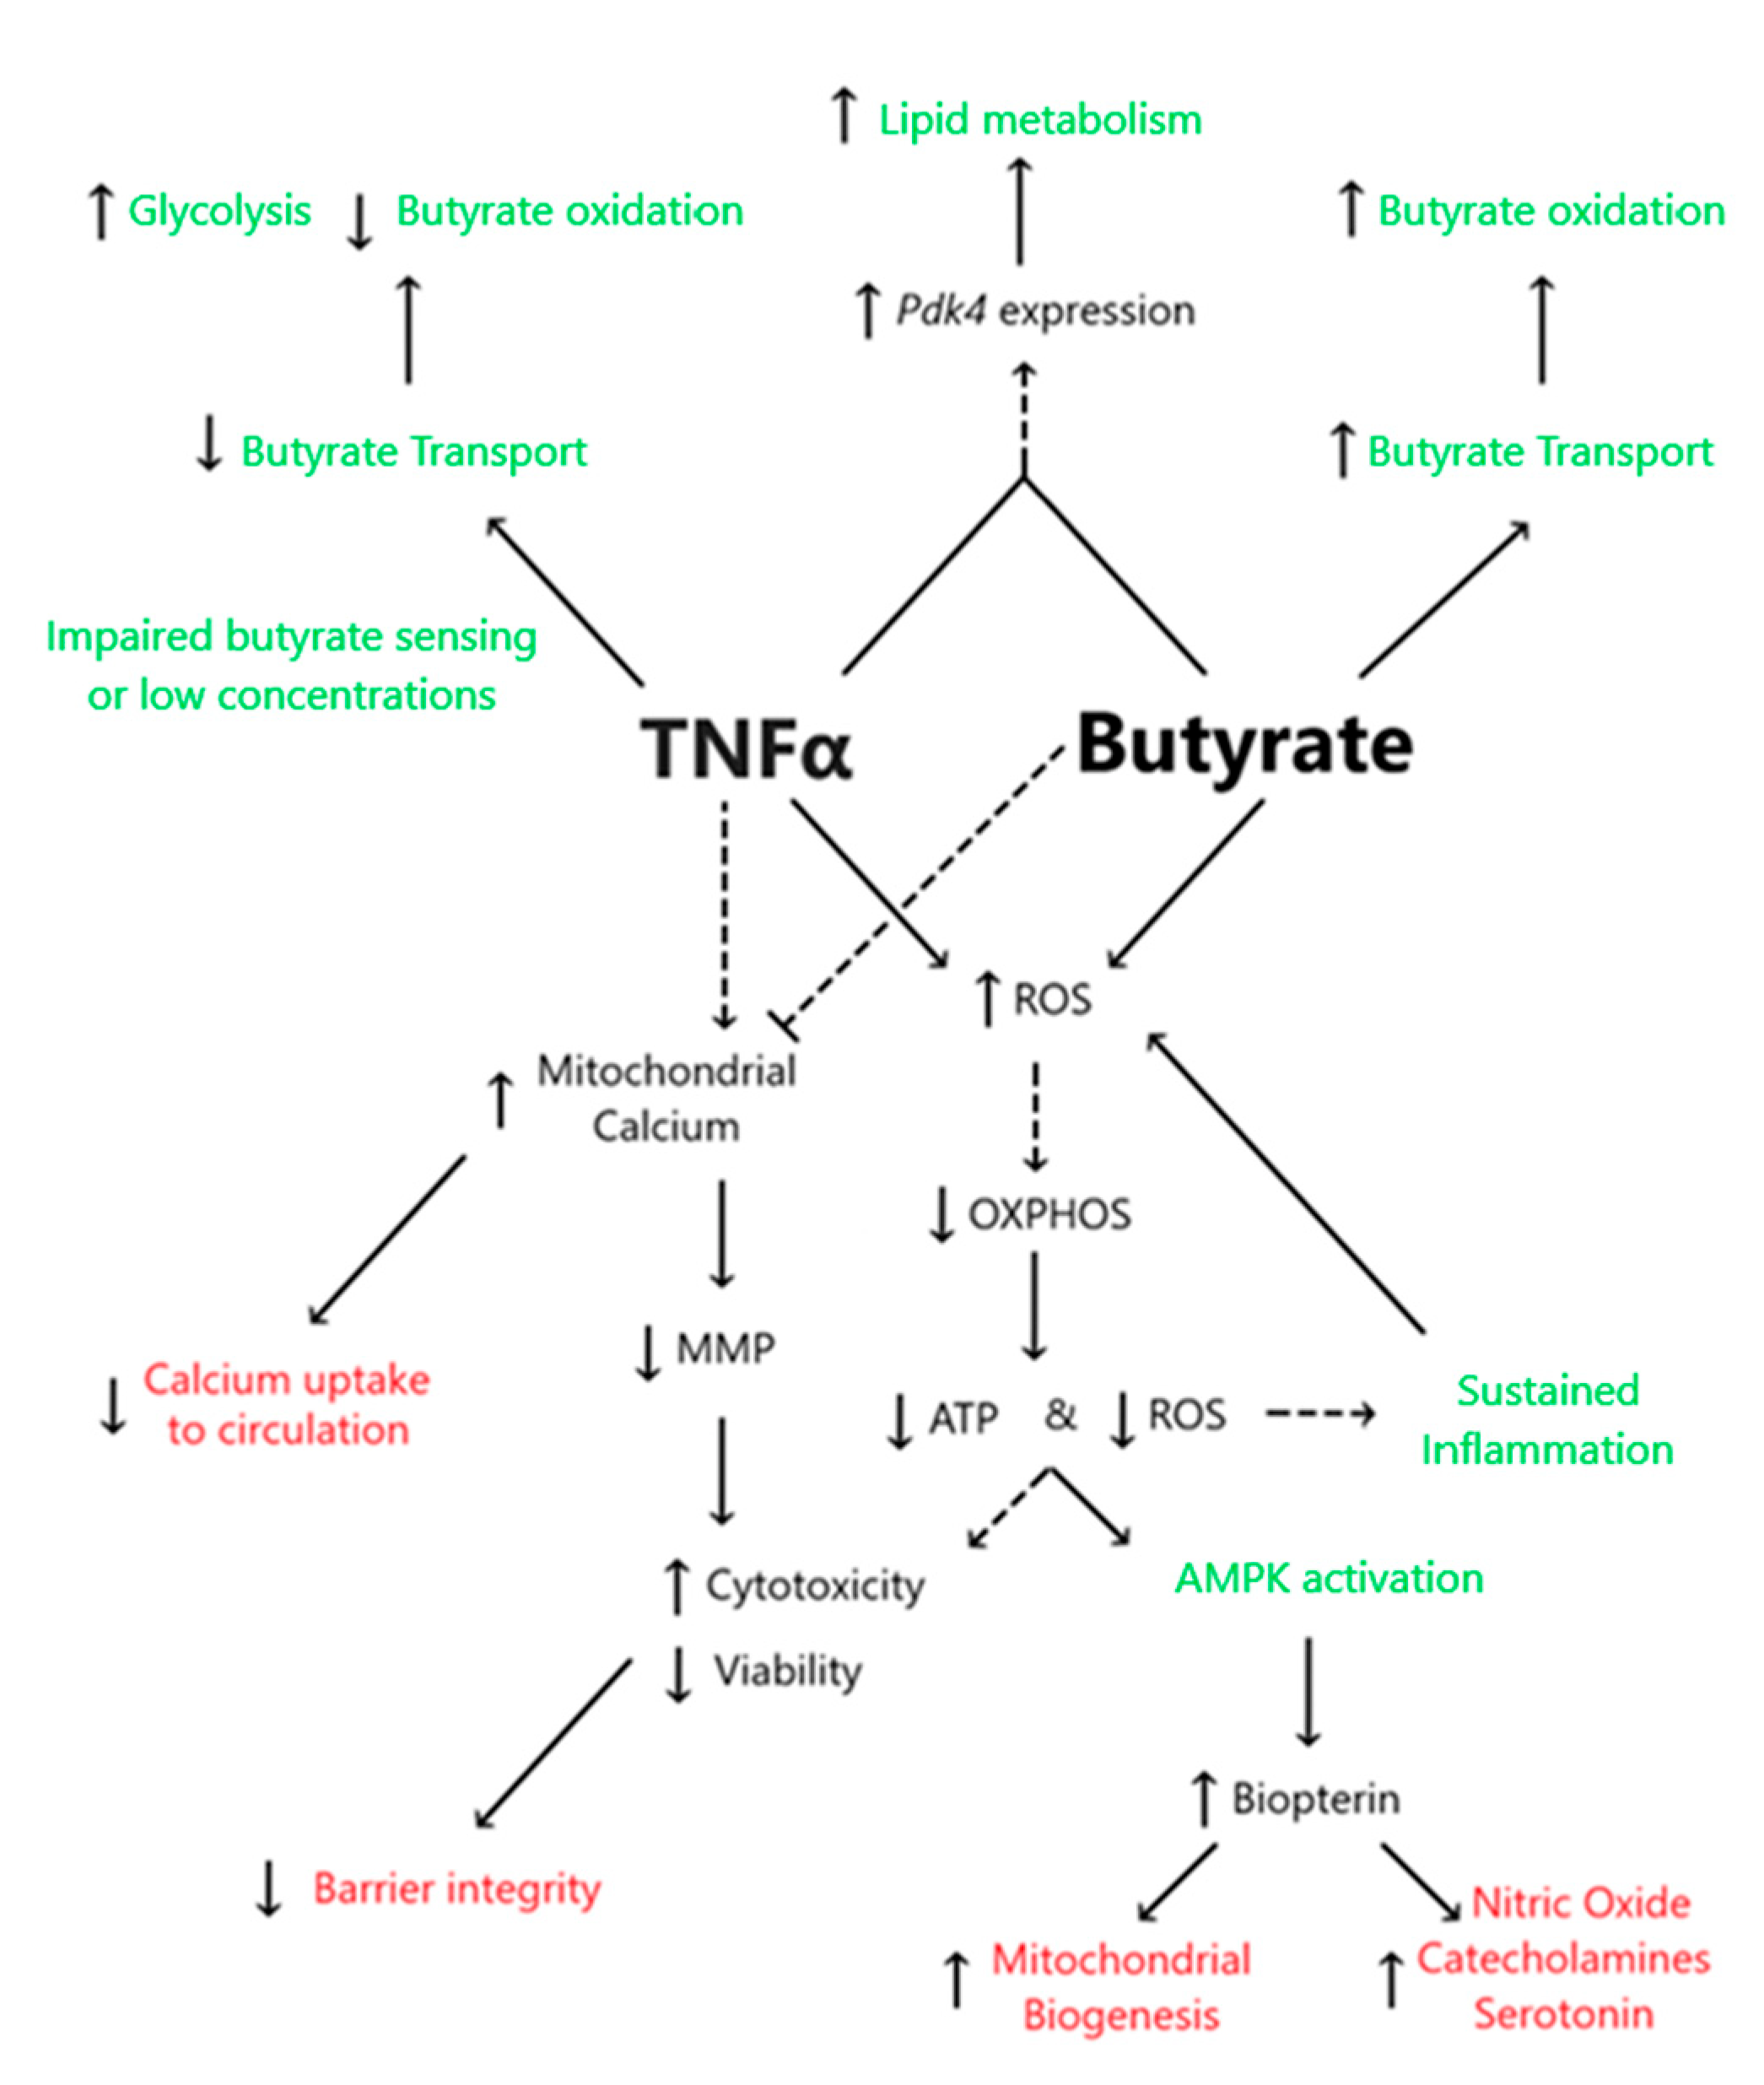
4. Discussion
4.1. TNFα Impairs Glycolysis and Mitochondrial Respiration despite the Presence of Physiologic Butyrate Levels in Rodent Colonic Epithelial Cells
4.2. Butyrate Improves Cell Viability and Decreases TNFα-Induced CEC Cytotoxicity
4.3. Butyrate Protects against TNFα-Induced Reduction in Mitochondrial Membrane by Stabilizing Mitochondrial–Cytosolic Calcium Levels
4.4. Butyrate and TNFα Alter Transcripts Involved in Metabolism and Differentiation of CECs
4.5. TNFα Increases Biopterin Levels in the Presence and Absence of Butyrate
5. Conclusions
Supplementary Materials
Author Contributions
Funding
Institutional Review Board Statement
Informed Consent Statement
Data Availability Statement
Conflicts of Interest
References
- Mohammed Nawi, A.; Mohammad, Z.; Jetly, K.; Abd Razak, M.A.; Ramli, N.S.; Wan Ibadullah WA, H.; Ahmad, N. The Prevalence and Risk Factors of Hypertension among the Urban Population in Southeast Asian Countries: A Systematic Review and Meta-Analysis. Int. J. Hypertens. 2021, 2021, 6657003. [Google Scholar] [CrossRef] [PubMed]
- Mills, K.T.; Stefanescu, A.; He, J. The global epidemiology of hypertension. Nat. Rev. Nephrol. 2020, 16, 223. [Google Scholar] [CrossRef] [PubMed]
- Jose, P.A.; Raj, D. Gut microbiota in hypertension. Curr. Opin. Nephrol. Hypertens. 2015, 24, 403–409. [Google Scholar] [CrossRef] [Green Version]
- Richards, E.M.; Pepine, C.J.; Raizada, M.K.; Kim, S. The Gut, Its Microbiome, and Hypertension. Curr. Hypertens. Rep. 2017, 19, 36. [Google Scholar] [CrossRef] [Green Version]
- Yang, T.; Santisteban, M.M.; Rodriguez, V.; Li, E.; Ahmari, N.; Carvajal, J.M.; Zadeh, M.; Gong, M.; Qi, Y.; Zubcevic, J.; et al. Gut Dysbiosis is Linked to Hypertension. Hypertension 2015, 65, 1331–1340. [Google Scholar] [CrossRef] [Green Version]
- Poll, B.G.; Cheema, M.U.; Pluznick, J.L. Gut microbial metabolites and blood pressure regulation: Focus on SCFAs and TMAO. Physiology 2020, 35, 275–284. [Google Scholar] [CrossRef] [PubMed]
- Wu, Y.; Xu, H.; Tu, X.; Gao, Z. The Role of Short-Chain Fatty Acids of Gut Microbiota Origin in Hypertension. Front. Microbiol. 2021, 12, 2777. [Google Scholar] [CrossRef]
- Yang, F.; Chen, H.; Gao, Y.; An, N.; Li, X.; Pan, X.; Yang, X.; Tian, L.; Sun, J.; Xiong, X.; et al. Gut microbiota-derived short-chain fatty acids and hypertension: Mechanism and treatment. Biomed. Pharmacother. 2020, 130, 110503. [Google Scholar] [CrossRef]
- Yang, T.; Magee, K.L.; Colon-Perez, L.M.; Larkin, R.; Liao, Y.S.; Balazic, E.; Cowart, J.R.; Arocha, R.; Redler, T.; Febo, M.; et al. Impaired butyrate absorption in the proximal colon, low serum butyrate and diminished central effects of butyrate on blood pressure in spontaneously hypertensive rats. Acta Physiol. 2019, 226, e13256. [Google Scholar] [CrossRef]
- Vanhoutvin, S.A.; Troost, F.J.; Hamer, H.M.; Lindsey, P.J.; Koek, G.H.; Jonkers, D.M.; Kodde, A.; Venema, K.; Brummer, R.J. Butyrate-induced transcriptional changes in human colonic mucosa. PloS ONE 2009, 4, e6759. [Google Scholar] [CrossRef] [Green Version]
- Harty, R.F. Energy, oxidative stress, and inflammation in the colon. Dig. Dis. Sci. 2013, 58, 3386–3388. [Google Scholar] [CrossRef] [Green Version]
- Wu, X.; Wu, Y.; He, L.; Wu, L.; Wang, X.; Liu, Z. Effects of the intestinal microbial metabolite butyrate on the development of colorectal cancer. J. Cancer 2018, 9, 2510. [Google Scholar] [CrossRef] [PubMed]
- Magnusson, M.K.; Isaksson, S.; Öhman, L. The Anti-inflammatory Immune Regulation Induced by Butyrate Is Impaired in Inflamed Intestinal Mucosa from Patients with Ulcerative Colitis. Inflammation 2019, 43, 507–517. [Google Scholar] [CrossRef] [PubMed] [Green Version]
- Chen, W.; Zhang, S.; Wu, J.; Ye, T.; Wang, S.; Wang, P.; Xing, D. Butyrate-producing bacteria and the gut-heart axis in atherosclerosis. Clin. Chim. Acta 2020, 507, 236–241. [Google Scholar] [CrossRef] [PubMed]
- Yang, T.; Rodriguez, V.; Malphurs, W.L.; Schmidt, J.T.; Ahmari, N.; Sumners, C.; Martyniuk, C.J.; Zubcevic, J. Butyrate regulates inflammatory cytokine expression without affecting oxidative respiration in primary astrocytes from spontaneously hypertensive rats. Physiol. Rep. 2018, 6, e13732. [Google Scholar] [CrossRef] [Green Version]
- Watson, A.J.; Hughes, K.R. TNF-α-induced intestinal epithelial cell shedding: Implications for intestinal barrier function. Ann. New York Acad. Sci. 2012, 1258, 1–8. [Google Scholar] [CrossRef] [PubMed]
- Ruder, B.; Atreya, R.; Becker, C. Tumour necrosis factor alpha in intestinal homeostasis and gut related diseases. Int. J. Mol. Sci. 2019, 20, 1887. [Google Scholar] [CrossRef] [Green Version]
- Hummel, D.M.; Fetahu, I.S.; Gröschel, C.; Manhardt, T.; Kállay, E. Role of proinflammatory cytokines on expression of vitamin D metabolism and target genes in colon cancer cells. J. Steroid Biochem. Mol. Biol. 2014, 144, 91–95. [Google Scholar] [CrossRef] [Green Version]
- Santisteban, M.M.; Qi, Y.; Zubcevic, J.; Kim, S.; Yang, T.; Shenoy, V.; Cole-Jeffrey, C.T.; Lobaton, G.O.; Stewart, D.C.; Rubiano, A.; et al. Hypertension-linked pathophysiological alterations in the gut. Circ. Res. 2017, 120, 312–323. [Google Scholar] [CrossRef]
- Berg, S.; Sappington, P.L.; Guzik, L.J.; Delude, R.L.; Fink, M.P. Proinflammatory cytokines increase the rate of glycolysis and adenosine-5′-triphosphate turnover in cultured rat enterocytes. Crit. Care Med. 2003, 31, 1203–1212. [Google Scholar] [CrossRef]
- Soto-Heredero, G.; Gomez de las Heras, M.M.; Gabandé-Rodríguez, E.; Oller, J.; Mittelbrunn, M. Glycolysis—A key player in the inflammatory response. FEBS J. 2020, 287, 3350–3369. [Google Scholar] [CrossRef] [Green Version]
- Samavati, L.; Lee, I.; Mathes, I.; Lottspeich, F.; Huttemann, M. Tumor necrosis factor α inhibits oxidative phosphorylation through tyrosine phosphorylation at subunit I of cytochrome c oxidase. J. Biol. Chem. 2008, 283, 21134–21144. [Google Scholar] [CrossRef] [PubMed] [Green Version]
- Calderón-Pérez, L.; Gosalbes, M.J.; Yuste, S.; Valls, R.M.; Pedret, A.; Llauradó, E.; Jimenez-Hernandez, N.; Artacho, A.; Pla-Pagà, L.; Companys, J.; et al. Gut metagenomic and short chain fatty acids signature in hypertension: A cross-sectional study. Sci. Rep. 2020, 10, 6436. [Google Scholar] [CrossRef] [PubMed] [Green Version]
- Chou, T.C.; Yen, M.H.; Li, C.Y.; Ding, Y.A. Alterations of nitric oxide synthase expression with aging and hypertension in rats. Hypertension 1998, 31, 643–648. [Google Scholar] [CrossRef] [Green Version]
- Mazor, R.; Itzhaki, O.; Sela, S.; Yagil, Y.; Cohen-Mazor, M.; Yagil, C.; Kristal, B. Tumor Necrosis Factor-α: A Possible Priming Agent for the Polymorphonuclear Leukocyte–Reduced Nicotinamide-Adenine Dinucleotide Phosphate Oxidase in Hypertension. Hypertension 2010, 55, 353–362. [Google Scholar] [CrossRef] [Green Version]
- Bultman, S.J. Butyrate consumption of differentiated colonocytes in the upper crypt promotes homeostatic proliferation of stem and progenitor cells near the crypt base. Transl. Cancer Res. 2016, 5 (Suppl 3), S526. [Google Scholar] [CrossRef]
- Kaiko, G.E.; Ryu, S.H.; Koues, O.I.; Collins, P.L.; Solnica-Krezel, L.; Pearce, E.J.; Pearce, E.L.; Oltz, E.M.; Stappenbeck, T.S. The colonic crypt protects stem cells from microbiota-derived metabolites. Cell 2016, 165, 1708. [Google Scholar] [CrossRef] [PubMed] [Green Version]
- Lee, C.; Kim, B.G.; Kim, J.H.; Chun, J.; Im, J.P.; Kim, J.S. Sodium butyrate inhibits the NF-kappa B signaling pathway and histone deacetylation, and attenuates experimental colitis in an IL-10 independent manner. Int. Immunopharmacol. 2017, 51, 47–56. [Google Scholar] [CrossRef]
- Schmidt, J.T.; Rushin, A.; Boyda, J.; Souders, C.L., II; Martyniuk, C.J. Dieldrin-induced neurotoxicity involves impaired mitochondrial bioenergetics and an endoplasmic reticulum stress response in rat dopaminergic cells. Neurotoxicology 2017, 63, 1–12. [Google Scholar] [CrossRef]
- Livak, K.J.; Schmittgen, T.D. Analysis of relative gene expression data using real-time quantitative PCR and the 2−ΔΔCT method. Methods 2001, 25, 402–408. [Google Scholar] [CrossRef]
- Taylor, S.; Wakem, M.; Dijkman, G.; Alsarraj, M.; Nguyen, M. A practical approach to RT-qPCR—Publishing data that conform to the MIQE guidelines. Methods 2010, 50, S1–S5. [Google Scholar] [CrossRef]
- Koelmel, J.P.; Kroeger, N.M.; Gill, E.L.; Ulmer, C.Z.; Bowden, J.A.; Patterson, R.E.; Yost, R.A.; Garrett, T.J. Expanding lipidome coverage using LC-MS/MS data-dependent acquisition with automated exclusion list generation. J. Am. Soc. Mass Spectrom. 2017, 28, 908–917. [Google Scholar] [CrossRef] [PubMed] [Green Version]
- Chong, J.; Wishart, D.S.; Xia, J. Using MetaboAnalyst 4.0 for comprehensive and integrative metabolomics data analysis. Curr. Protoc. Bioinform. 2019, 68, e86. [Google Scholar] [CrossRef]
- Yang, T.; Li, H.; Oliveira, A.C.; Goel, R.; Richards, E.M.; Pepine, C.J.; Raizada, M.K. Transcriptomic signature of gut microbiome-contacting cells in colon of spontaneously hypertensive rats. Physiol. Genom. 2020, 52, 121–132. [Google Scholar] [CrossRef] [PubMed] [Green Version]
- Souders, C.L.; Zubcevic, J.; Martyniuk, C.J. Tumor necrosis factor alpha and the gastrointestinal epithelium: Implications for the gut-brain axis and hypertension. Cell. Mol. Neurobiol. 2021, 42, 419–437. [Google Scholar] [CrossRef]
- Heller, S.; Penrose, H.M.; Cable, C.; Biswas, D.; Nakhoul, H.; Baddoo, M.; Flemington, E.; Crawford, S.E.; Savkovic, S.D. Reduced mitochondrial activity in colonocytes facilitates AMPKα2-dependent inflammation. FASEB J. 2017, 31, 2013–2025. [Google Scholar] [CrossRef] [Green Version]
- Ramseyer, V.D.; Garvin, J.L. Tumor necrosis factor-α: Regulation of renal function and blood pressure. Am. J. Physiol.-Ren. Physiol. 2013, 304, F1231–F1242. [Google Scholar] [CrossRef] [Green Version]
- Tanaka, M.; Itoh, H. Hypertension as a metabolic disorder and the novel role of the gut. Curr. Hypertens. Rep. 2019, 21, 63. [Google Scholar] [CrossRef] [Green Version]
- Franklin, S.S. Hypertension in the metabolic syndrome. Metab. Syndr. Relat. Disord. 2006, 4, 287–298. [Google Scholar] [CrossRef] [PubMed]
- Mervin, L.H.; Cao, Q.; Barrett, I.P.; Firth, M.A.; Murray, D.; McWilliams, L.; Haddrick, M.; Wigglesworth, M.; Engkvist, O.; Bender, A. Understanding Cytotoxicity and Cytostaticity in a High-Throughput Screening Collection. ACS Chem. Biol. 2016, 11, 3007–3023. [Google Scholar] [CrossRef] [PubMed] [Green Version]
- Zorova, L.D.; Popkov, V.A.; Plotnikov, E.Y.; Silachev, D.N.; Pevzner, I.B.; Jankauskas, S.S.; Babenko, V.A.; Zorov, S.D.; Balakireva, A.V.; Juhaszova, M.; et al. Mitochondrial membrane potential. Anal. Biochem. 2018, 552, 50–59. [Google Scholar] [CrossRef]
- Twig, G.; Shirihai, O.S. The interplay between mitochondrial dynamics and mitophagy. Antioxid. Redox Signal. 2011, 14, 1939–1951. [Google Scholar] [CrossRef] [PubMed] [Green Version]
- Duchen, M.R. Mitochondria and calcium: From cell signalling to cell death. J. Physiol. 2000, 529, 57–68. [Google Scholar] [CrossRef] [PubMed]
- Dada, L.A.; Sznajder, J.I. Mitochondrial Ca2+ and ROS take center stage to orchestrate TNF-α–mediated inflammatory responses. J. Clin. Investig. 2011, 121, 1683–1685. [Google Scholar] [CrossRef] [PubMed]
- Maiti, A.K.; Sharba, S.; Navabi, N.; Forsman, H.; Fernandez, H.R.; Lindén, S.K. IL-4 protects the mitochondria against TNFα and IFNγ induced insult during clearance of infection with Citrobacter rodentium and Escherichia coli. Sci. Rep. 2015, 5, 15434. [Google Scholar] [CrossRef] [PubMed] [Green Version]
- Polla, B.S.; Jacquier-Sarlin, M.R.; Kantengwa, S.; Mariethoz, E.; Hennet, T.; Russo-Marie, F.; Cossarizza, A. TNFα alters mitochondrial membrane potential in L929 but not in TNFα-resistant L929. 12 cells: Relationship with the expression of stress proteins, annexin 1 and superoxide dismutase activity. Free Radic. Res. 1996, 25, 125–131. [Google Scholar] [CrossRef] [PubMed]
- Gu, B.H.; Kim, M.; Yun, C.H. Regulation of gastrointestinal immunity by metabolites. Nutrients 2021, 13, 167. [Google Scholar] [CrossRef]
- Wang, Y.; Chen, Y.; Zhang, X.; Lu, Y.; Chen, H. New insights in intestinal oxidative stress damage and the health intervention effects of nutrients: A review. J. Funct. Foods 2020, 75, 104248. [Google Scholar] [CrossRef]
- Kumar, A.; Wu, H.; Collier-Hyams, L.S.; Kwon, Y.M.; Hanson, J.M.; Neish, A.S. The bacterial fermentation product butyrate influences epithelial signaling via reactive oxygen species-mediated changes in cullin-1 neddylation. J. Immunol. 2009, 182, 538–546. [Google Scholar] [CrossRef] [Green Version]
- Touyz, R.M.; Briones, A.M. Reactive oxygen species and vascular biology: Implications in human hypertension. Hypertens. Res. 2011, 34, 5–14. [Google Scholar] [CrossRef] [Green Version]
- Villa-Etchegoyen, C.; Lombarte, M.; Matamoros, N.; Belizán, J.M.; Cormick, G. Mechanisms involved in the relationship between low calcium intake and high blood pressure. Nutrients 2019, 11, 1112. [Google Scholar] [CrossRef] [Green Version]
- Nakamura, H.; Tsujiguchi, H.; Hara, A.; Kambayashi, Y.; Miyagi, S.; Thi Thu Nguyen, T.; Suzuki, K.; Tao, Y.; Sakamoto, Y.; Shimizu, Y.; et al. Dietary calcium intake and hypertension: Importance of serum concentrations of 25-hydroxyvitamin D. Nutrients 2019, 11, 911. [Google Scholar] [CrossRef] [PubMed] [Green Version]
- Gaschott, T.; Stein, J. Short-chain fatty acids and colon cancer cells: The vitamin D receptor—Butyrate connection. In Vitamin D Analogs in Cancer Prevention and Therapy; Springer: Berlin/Heidelberg, Germany, 2003; pp. 247–257. [Google Scholar]
- Bush, C.R.; Havens, J.M.; Necela, B.M.; Su, W.; Chen, L.; Yanagisawa, M.; Anastasiadis, P.Z.; Guerra, R.; Luxon, B.A.; Thompson, E.A. Functional genomic analysis reveals cross-talk between peroxisome proliferator-activated receptor γ and calcium signaling in human colorectal cancer cells. J. Biol. Chem. 2007, 282, 23387–23401. [Google Scholar] [CrossRef] [PubMed] [Green Version]
- Ye, J. Regulation of PPARγ function by TNF-α. Biochem. Biophys. Res. Commun. 2008, 374, 405–408. [Google Scholar] [CrossRef] [Green Version]
- Martyniuk, C.J.; Martínez, R.; Kostyniuk, D.J.; Mennigen, J.A.; Zubcevic, J. Genetic ablation of bone marrow beta-adrenergic receptors in mice modulates miRNA-transcriptome networks of neuroinflammation in the paraventricular nucleus. Physiol. Genom. 2020, 52, 169–177. [Google Scholar] [CrossRef] [PubMed]
- Yang, T.; Ahmari, N.; Schmidt, J.T.; Redler, T.; Arocha, R.; Pacholec, K.; Magee, K.L.; Malphurs, W.; Owen, J.L.; Krane, G.A.; et al. Shifts in the gut microbiota composition due to depleted bone marrow beta adrenergic signaling are associated with suppressed inflammatory transcriptional networks in the mouse colon. Front. Physiol. 2017, 8, 220. [Google Scholar] [CrossRef] [Green Version]
- Ahmari, N.; Schmidt, J.T.; Krane, G.A.; Malphurs, W.; Cunningham, B.E.; Owen, J.L.; Martyniuk, C.J.; Zubcevic, J. Loss of bone marrow adrenergic beta 1 and 2 receptors modifies transcriptional networks, reduces circulating inflammatory factors, and regulates blood pressure. Physiol. Genom. 2016, 48, 526–536. [Google Scholar] [CrossRef] [Green Version]
- Jones, G.R.; Bain, C.C.; Fenton, T.M.; Kelly, A.; Brown, S.L.; Ivens, A.C.; Travis, M.A.; Cook, P.C.; MacDonald, A.S. Dynamics of colon monocyte and macrophage activation during colitis. Front. Immunol. 2018, 9, 2764. [Google Scholar] [CrossRef]
- Flatmark, T.; Romslo, I. Energy-dependent accumulation of iron by isolated rat liver mitochondria. Requirement of reducing equivalents and evidence for a unidirectional flux of Fe (II) across the inner membrane. J. Biol. Chem. 1975, 250, 6433–6438. [Google Scholar] [CrossRef]
- Dietz, J.V.; Fox, J.L.; Khalimonchuk, O. Down the Iron Path: Mitochondrial Iron Homeostasis and Beyond. Cells 2021, 10, 2198. [Google Scholar] [CrossRef]
- Galan, P.; Vergnaud, A.C.; Tzoulaki, I.; Buyck, J.F.; Blacher, J.; Czernichow, S.; Hercberg, S. Low total and nonheme iron intakes are associated with a greater risk of hypertension. J. Nutr. 2010, 140, 75–80. [Google Scholar] [CrossRef] [PubMed] [Green Version]
- Jehn, M.; Clark, J.M.; Guallar, E. Serum ferritin and risk of the metabolic syndrome in US adults. Diabetes Care 2004, 27, 2422–2428. [Google Scholar] [CrossRef] [PubMed] [Green Version]
- Kim, M.K.; Baek, K.H.; Song, K.H.; Kang, M.I.; Choi, J.H.; Bae, J.C.; Park, C.Y.; Lee, W.Y.; Oh, K.W. Increased serum ferritin predicts the development of hypertension among middle-aged men. Am. J. Hypertens. 2012, 25, 492–497. [Google Scholar] [CrossRef] [Green Version]
- Zhang, H.M.; Rao, J.N.; Guo, X.; Liu, L.; Zou, T.; Turner, D.J.; Wang, J.Y. Akt kinase activation blocks apoptosis in intestinal epithelial cells by inhibiting caspase-3 after polyamine depletion. J. Biol. Chem. 2004, 279, 22539–22547. [Google Scholar] [CrossRef] [PubMed] [Green Version]
- Punit, S.; Dubé, P.E.; Liu, C.Y.; Girish, N.; Washington, M.K.; Polk, D.B. Tumor necrosis factor receptor 2 restricts the pathogenicity of CD8+ T cells in mice with colitis. Gastroenterology 2015, 149, 993–1005. [Google Scholar] [CrossRef] [Green Version]
- Mizoguchi, E.; Mizoguchi, A.; Takedatsu, H.; Cario, E.; De Jong, Y.P.; Ooi, C.J.; Xavier, R.J.; Terhorst, C.; Podolsky, D.K.; Bhan, A.K. Role of tumor necrosis factor receptor 2 (TNFR2) in colonic epithelial hyperplasia and chronic intestinal inflammation in mice. Gastroenterology 2002, 122, 134–144. [Google Scholar] [CrossRef] [PubMed]
- Rodríguez-Colman, M.J.; Schewe, M.; Meerlo, M.; Stigter, E.; Gerrits, J.; Pras-Raves, M.; Sacchetti, A.; Hornsveld, M.; Oost, K.C.; Snippert, H.J.; et al. Interplay between metabolic identities in the intestinal crypt supports stem cell function. Nature 2017, 543, 424–427. [Google Scholar] [CrossRef]
- Gadeock, S.; Liu, C.Y.; Polk, D.B. 800 MESENCHYMAL TNFR1 EXPRESSION PRESERVES THE COLONIC EPITHELIAL STEM CELL NICHE. Gastroenterology 2021, 160, S-165. [Google Scholar] [CrossRef]
- Parada Venegas, D.; De la Fuente, M.K.; Landskron, G.; González, M.J.; Quera, R.; Dijkstra, G.; Harmsen, H.J.; Faber, K.N.; Hermoso, M.A. Short chain fatty acids (SCFAs)-mediated gut epithelial and immune regulation and its relevance for inflammatory bowel diseases. Front. Immunol. 2019, 10, 277. [Google Scholar] [CrossRef] [Green Version]
- Andoh, A.; Fujiyama, Y.; Hata, K.; Araki, Y.; Takaya, H.; Shimada, M.; Bamba, T. Counter-regulatory effect of sodium butyrate on tumour necrosis factor-alpha (TNF-α)-induced complement C3 and factor B biosynthesis in human intestinal epithelial cells. Clin. Exp. Immunol. 1999, 118, 23–29. [Google Scholar] [CrossRef]
- Donohoe, D.R.; Garge, N.; Zhang, X.; Sun, W.; O’Connell, T.M.; Bunger, M.K.; Bultman, S.J. The microbiome and butyrate regulate energy metabolism and autophagy in the mammalian colon. Cell Metab. 2011, 13, 517–526. [Google Scholar] [CrossRef] [Green Version]
- Blouin, J.M.; Penot, G.; Collinet, M.; Nacfer, M.; Forest, C.; Laurent-Puig, P.; Coumoul, X.; Barouki, R.; Benelli, C.; Bortoli, S. Butyrate elicits a metabolic switch in human colon cancer cells by targeting the pyruvate dehydrogenase complex. Int. J. Cancer 2011, 128, 2591–2601. [Google Scholar] [CrossRef] [PubMed]
- Zhang, S.; Hulver, M.W.; McMillan, R.P.; Cline, M.A.; Gilbert, E.R. The pivotal role of pyruvate dehydrogenase kinases in metabolic flexibility. Nutr. Metab. 2014, 11, 10. [Google Scholar] [CrossRef] [PubMed] [Green Version]
- Goncalves, P.; Martel, F. Regulation of colonic epithelial butyrate transport: Focus on colorectal cancer. Porto Biomed. J. 2016, 1, 83–91. [Google Scholar] [CrossRef] [PubMed] [Green Version]
- Borthakur, A.; Anbazhagan, A.N.; Kumar, A.; Raheja, G.; Singh, V.; Ramaswamy, K.; Dudeja, P.K. The probiotic Lactobacillus plantarum counteracts TNF-α-induced downregulation of SMCT1 expression and function. Am. J. Physiol.-Gastrointest. Liver Physiol. 2010, 299, G928–G934. [Google Scholar] [CrossRef] [Green Version]
- Zhao, C.; Bobe, G.; Wang, Y.; Zhang, X.; Zhao, Z.; Zhang, S.; Sun, G.; Yuan, X.; Li, X.; Liu, G. Potential Role of SLC5A8 Expression in the Etiology of Subacute Ruminal Acidosis. Front. Vet. Sci. 2020, 7, 394. [Google Scholar] [CrossRef] [PubMed]
- Halestrap, A.P.; Price, N.T. The proton-linked monocarboxylate transporter (MCT) family: Structure, function and regulation. Biochem. J. 1999, 343, 281–299. [Google Scholar] [CrossRef]
- Elzaouk, L.; Leimbacher, W.; Turri, M.; Ledermann, B.; Buürki, K.; Blau, N.; Thoöny, B. Dwarfism and low insulin-like growth factor-1 due to dopamine depletion in Pts–/–mice rescued by feeding neurotransmitter precursors and H4-biopterin. J. Biol. Chem. 2003, 278, 28303–28311. [Google Scholar] [CrossRef] [PubMed] [Green Version]
- Silva, Y.P.; Bernardi, A.; Frozza, R.L. The role of short-chain fatty acids from gut microbiota in gut-brain communication. Front. Endocrinol. 2020, 11, 25. [Google Scholar] [CrossRef] [Green Version]
- Werner-Felmayer, G.; Golderer, G.; Werner, E.R. Tetrahydrobiopterin biosynthesis, utilization and pharmacological effects. Curr. Drug Metab. 2002, 3, 159–173. [Google Scholar] [CrossRef] [PubMed] [Green Version]
- Chen, Y.; Xu, J.; Chen, Y. Regulation of neurotransmitters by the gut microbiota and effects on cognition in neurological disorders. Nutrients 2021, 13, 2099. [Google Scholar] [CrossRef]
- Hattori, Y.; Nakanishi, N.; Kasai, K.; Shimoda, S.I. GTP cyclohydrolase I mRNA induction and tetrahydrobiopterin synthesis in human endothelial cells. Biochim. Et Biophys. Acta (BBA)-Mol. Cell Res. 1997, 1358, 61–66. [Google Scholar] [CrossRef] [Green Version]
- Kwon, S.; Newcomb, R.L.; George, S.C. Mechanisms of synergistic cytokine-induced nitric oxide production in human alveolar epithelial cells. Nitric Oxide 2001, 5, 534–546. [Google Scholar] [CrossRef] [PubMed] [Green Version]
- Kwon, Y.H.; Wang, H.; Denou, E.; Ghia, J.E.; Rossi, L.; Fontes, M.E.; Bernier, S.P.; Shajib, M.S.; Banskota, S.; Collins, S.M.; et al. Modulation of gut microbiota composition by serotonin signaling influences intestinal immune response and susceptibility to colitis. Cell. Mol. Gastroenterol. Hepatol. 2019, 7, 709–728. [Google Scholar] [CrossRef] [Green Version]
- Kim, H.K.; Han, J. Tetrahydrobiopterin in energy metabolism and metabolic diseases. Pharmacol. Res. 2020, 157, 104827. [Google Scholar] [CrossRef] [PubMed]
- Abou-Donia, M.M.; Daniels, J.A.; Nichol, C.A.; Viveros, H.L.; Blair, J.A. Regulation of adrenocortical guanosine triphosphate cyclohydrolase and tetrahydrobiopterin in normal and spontaneously hypertensive rats. In Chemistry and Biology of Pteridines; Walter de Gruyter and Co.: New York, NY, USA, 1983; pp. 783–787. [Google Scholar]
- Hong, H.J.; Hsiao, G.; Cheng, T.H.; Yen, M.H. Supplementation with tetrahydrobiopterin suppresses the development of hypertension in spontaneously hypertensive rats. Hypertension 2001, 38, 1044–1048. [Google Scholar] [CrossRef] [PubMed]
- Shinozaki, K.; Nishio, Y.; Okamura, T.; Yoshida, Y.; Maegawa, H.; Kojima, H.; Masada, M.; Toda, N.; Kikkawa, R.; Kashiwagi, A. Oral administration of tetrahydrobiopterin prevents endothelial dysfunction and vascular oxidative stress in the aortas of insulin-resistant rats. Circ. Res. 2000, 87, 566–573. [Google Scholar] [CrossRef] [Green Version]
- Porkert, M.; Sher, S.; Reddy, U.; Cheema, F.; Niessner, C.; Kolm, P.; Jones, D.P.; Hooper, C.; Taylor, W.R.; Harrison, D.; et al. Tetrahydrobiopterin: A novel antihypertensive therapy. J. Hum. Hypertens. 2008, 22, 401–407. [Google Scholar] [CrossRef] [Green Version]
- Gori, T.; Burstein, J.M.; Ahmed, S.; Miner, S.E.; Al-Hesayen, A.; Kelly, S.; Parker, J.D. Folic acid prevents nitroglycerin-induced nitric oxide synthase dysfunction and nitrate tolerance: A human in vivo study. Circulation 2001, 104, 1119–1123. [Google Scholar] [CrossRef] [Green Version]
- Pravenec, M.; Kožich, V.; Krijt, J.; Sokolová, J.; Zídek, V.; Landa, V.; Šimáková, M.; Mlejnek, P.; Šilhavý, J.; Oliyarnyk, O.; et al. Folate deficiency is associated with oxidative stress, increased blood pressure, and insulin resistance in spontaneously hypertensive rats. Am. J. Hypertens. 2013, 26, 135–140. [Google Scholar] [CrossRef] [Green Version]
- Rembold, H.; Buff, K. Tetrahydrobiopterin, a Cofactor in Mitochondrial Electron Transfer: Effect of Tetrahydropterins on Intact Rat-Liver Mitochondria. Eur. J. Biochem. 1972, 28, 579–585. [Google Scholar] [CrossRef]
- Oguri, Y.; Fujita, Y.; Abudukadier, A.; Ohashi, A.; Goto, T.; Furuya, F.; Obara, A.; Fukushima, T.; Matsuo, N.; Kim, M.; et al. Tetrahydrobiopterin activates brown adipose tissue and regulates systemic energy metabolism. JCI Insight 2017, 2, e91981. [Google Scholar] [CrossRef] [Green Version]
- Reigstad, C.S.; Salmonson, C.E.; Rainey, J.F., III; Szurszewski, J.H.; Linden, D.R.; Sonnenburg, J.L.; Farrugia, G.; Kashyap, P.C. Gut microbes promote colonic serotonin production through an effect of short-chain fatty acids on enterochromaffin cells. FASEB J. 2015, 29, 1395–1403. [Google Scholar] [CrossRef] [PubMed] [Green Version]
- Liu, H.; Wang, J.; He, T.; Becker, S.; Zhang, G.; Li, D.; Ma, X. Butyrate: A double-edged sword for health? Adv. Nutr. 2018, 9, 21–29. [Google Scholar] [CrossRef] [PubMed] [Green Version]
- Han, H.; Liu, L.; Chen, M.; Liu, Y.; Wang, H.; Chen, L. The optimal compound reference genes for qRT-PCR analysis in the developing rat long bones under physiological conditions and prenatal dexamethasone exposure model. Reprod. Toxicol. 2020, 98, 242–251. [Google Scholar] [CrossRef]
- Li, X.; Zhou, B.; Han, X.; Liu, H. Effect of nicotine on placental inflammation and apoptosis in preeclampsia-like model. Life Sci. 2020, 261, 118314. [Google Scholar] [CrossRef] [PubMed]
- Serdan, T.D.A.; Masi, L.N.; Pereira, J.N.B.; Rodrigues, L.E.; Alecrim, A.L.; Scervino, M.V.M.; Diniz, V.L.S.; Dos Santos, A.A.C.; Filho, C.P.B.S.; Alba-Loureiro, T.C.; et al. Impaired brown adipose tissue is differentially modulated in insulin-resistant obese wistar and type 2 diabetic Goto-Kakizaki rats. Biomed. Pharmacother. 2021, 142, 112019. [Google Scholar] [CrossRef]
- Xiang, L.; Gilkes, D.M.; Chaturvedi, P.; Luo, W.; Hu, H.; Takano, N.; Liang, H.; Semenza, G.L. Ganetespib blocks HIF-1 activity and inhibits tumor growth, vascularization, stem cell maintenance, invasion, and metastasis in orthotopic mouse models of triple-negative breast cancer. J. Mol. Med. 2014, 92, 151–164. [Google Scholar] [CrossRef] [Green Version]
- Yao, S.; Shang, W.; Huang, L.; Xu, R.; Wu, M.; Wang, F. The oncogenic and prognostic role of PDK1 in the progression and metastasis of ovarian cancer. J. Cancer 2021, 12, 630–643. [Google Scholar] [CrossRef]
- Hernández, A.; Curi, R.; Salazar, L.A.; Hernandez, A.; Curi, R.; Salazar, L. Repression of Ppargc1a Gene in Liver of Hyperglycemic Rats Induced with High Fat Diet Combined with Streptozotocin. Int. J. Morphol. 2012, 30, 643–650. [Google Scholar] [CrossRef] [Green Version]
- Enoki, T.; Yoshida, Y.; Lally, J.; Hatta, H.; Bonen, A. Testosterone increases lactate transport, monocarboxylate transporter (MCT) 1 and MCT4 in rat skeletal muscle. J. Physiol. 2006, 577, 433–443. [Google Scholar] [CrossRef] [PubMed]
- Van Der Hoeven, J.A.; Moshage, H.; Schuurs, T.; Nijboer, M.; Van Schilfgaarde, R.; Ploeg, R.J. Brain death induces apoptosis in donor liver of the rat. Transplantation 2003, 76, 1150–1154. [Google Scholar] [CrossRef] [PubMed]
- Schoemaker, M.H.; Ros, J.E.; Homan, M.; Trautwein, C.; Liston, P.; Poelstra, K.; van Goor, H.; Jansen, P.L.; Moshage, H. Cytokine regulation of pro- and anti-apoptotic genes in rat hepatocytes: NF-kappaB-regulated inhibitor of apoptosis protein 2 (cIAP2) prevents apoptosis. J. Hepatol. 2002, 36, 742–750. [Google Scholar] [CrossRef] [PubMed]


Disclaimer/Publisher’s Note: The statements, opinions and data contained in all publications are solely those of the individual author(s) and contributor(s) and not of MDPI and/or the editor(s). MDPI and/or the editor(s) disclaim responsibility for any injury to people or property resulting from any ideas, methods, instructions or products referred to in the content. |
© 2023 by the authors. Licensee MDPI, Basel, Switzerland. This article is an open access article distributed under the terms and conditions of the Creative Commons Attribution (CC BY) license (https://creativecommons.org/licenses/by/4.0/).
Share and Cite
Souders, C.L., II; Aristizabal-Henao, J.J.; Patuel, S.J.; Bowden, J.A.; Zubcevic, J.; Martyniuk, C.J. Interaction between Butyrate and Tumor Necrosis Factor α in Primary Rat Colonocytes. Biomolecules 2023, 13, 258. https://doi.org/10.3390/biom13020258
Souders CL II, Aristizabal-Henao JJ, Patuel SJ, Bowden JA, Zubcevic J, Martyniuk CJ. Interaction between Butyrate and Tumor Necrosis Factor α in Primary Rat Colonocytes. Biomolecules. 2023; 13(2):258. https://doi.org/10.3390/biom13020258
Chicago/Turabian StyleSouders, Christopher L., II, Juan J. Aristizabal-Henao, Sarah J. Patuel, John A. Bowden, Jasenka Zubcevic, and Christopher J. Martyniuk. 2023. "Interaction between Butyrate and Tumor Necrosis Factor α in Primary Rat Colonocytes" Biomolecules 13, no. 2: 258. https://doi.org/10.3390/biom13020258