
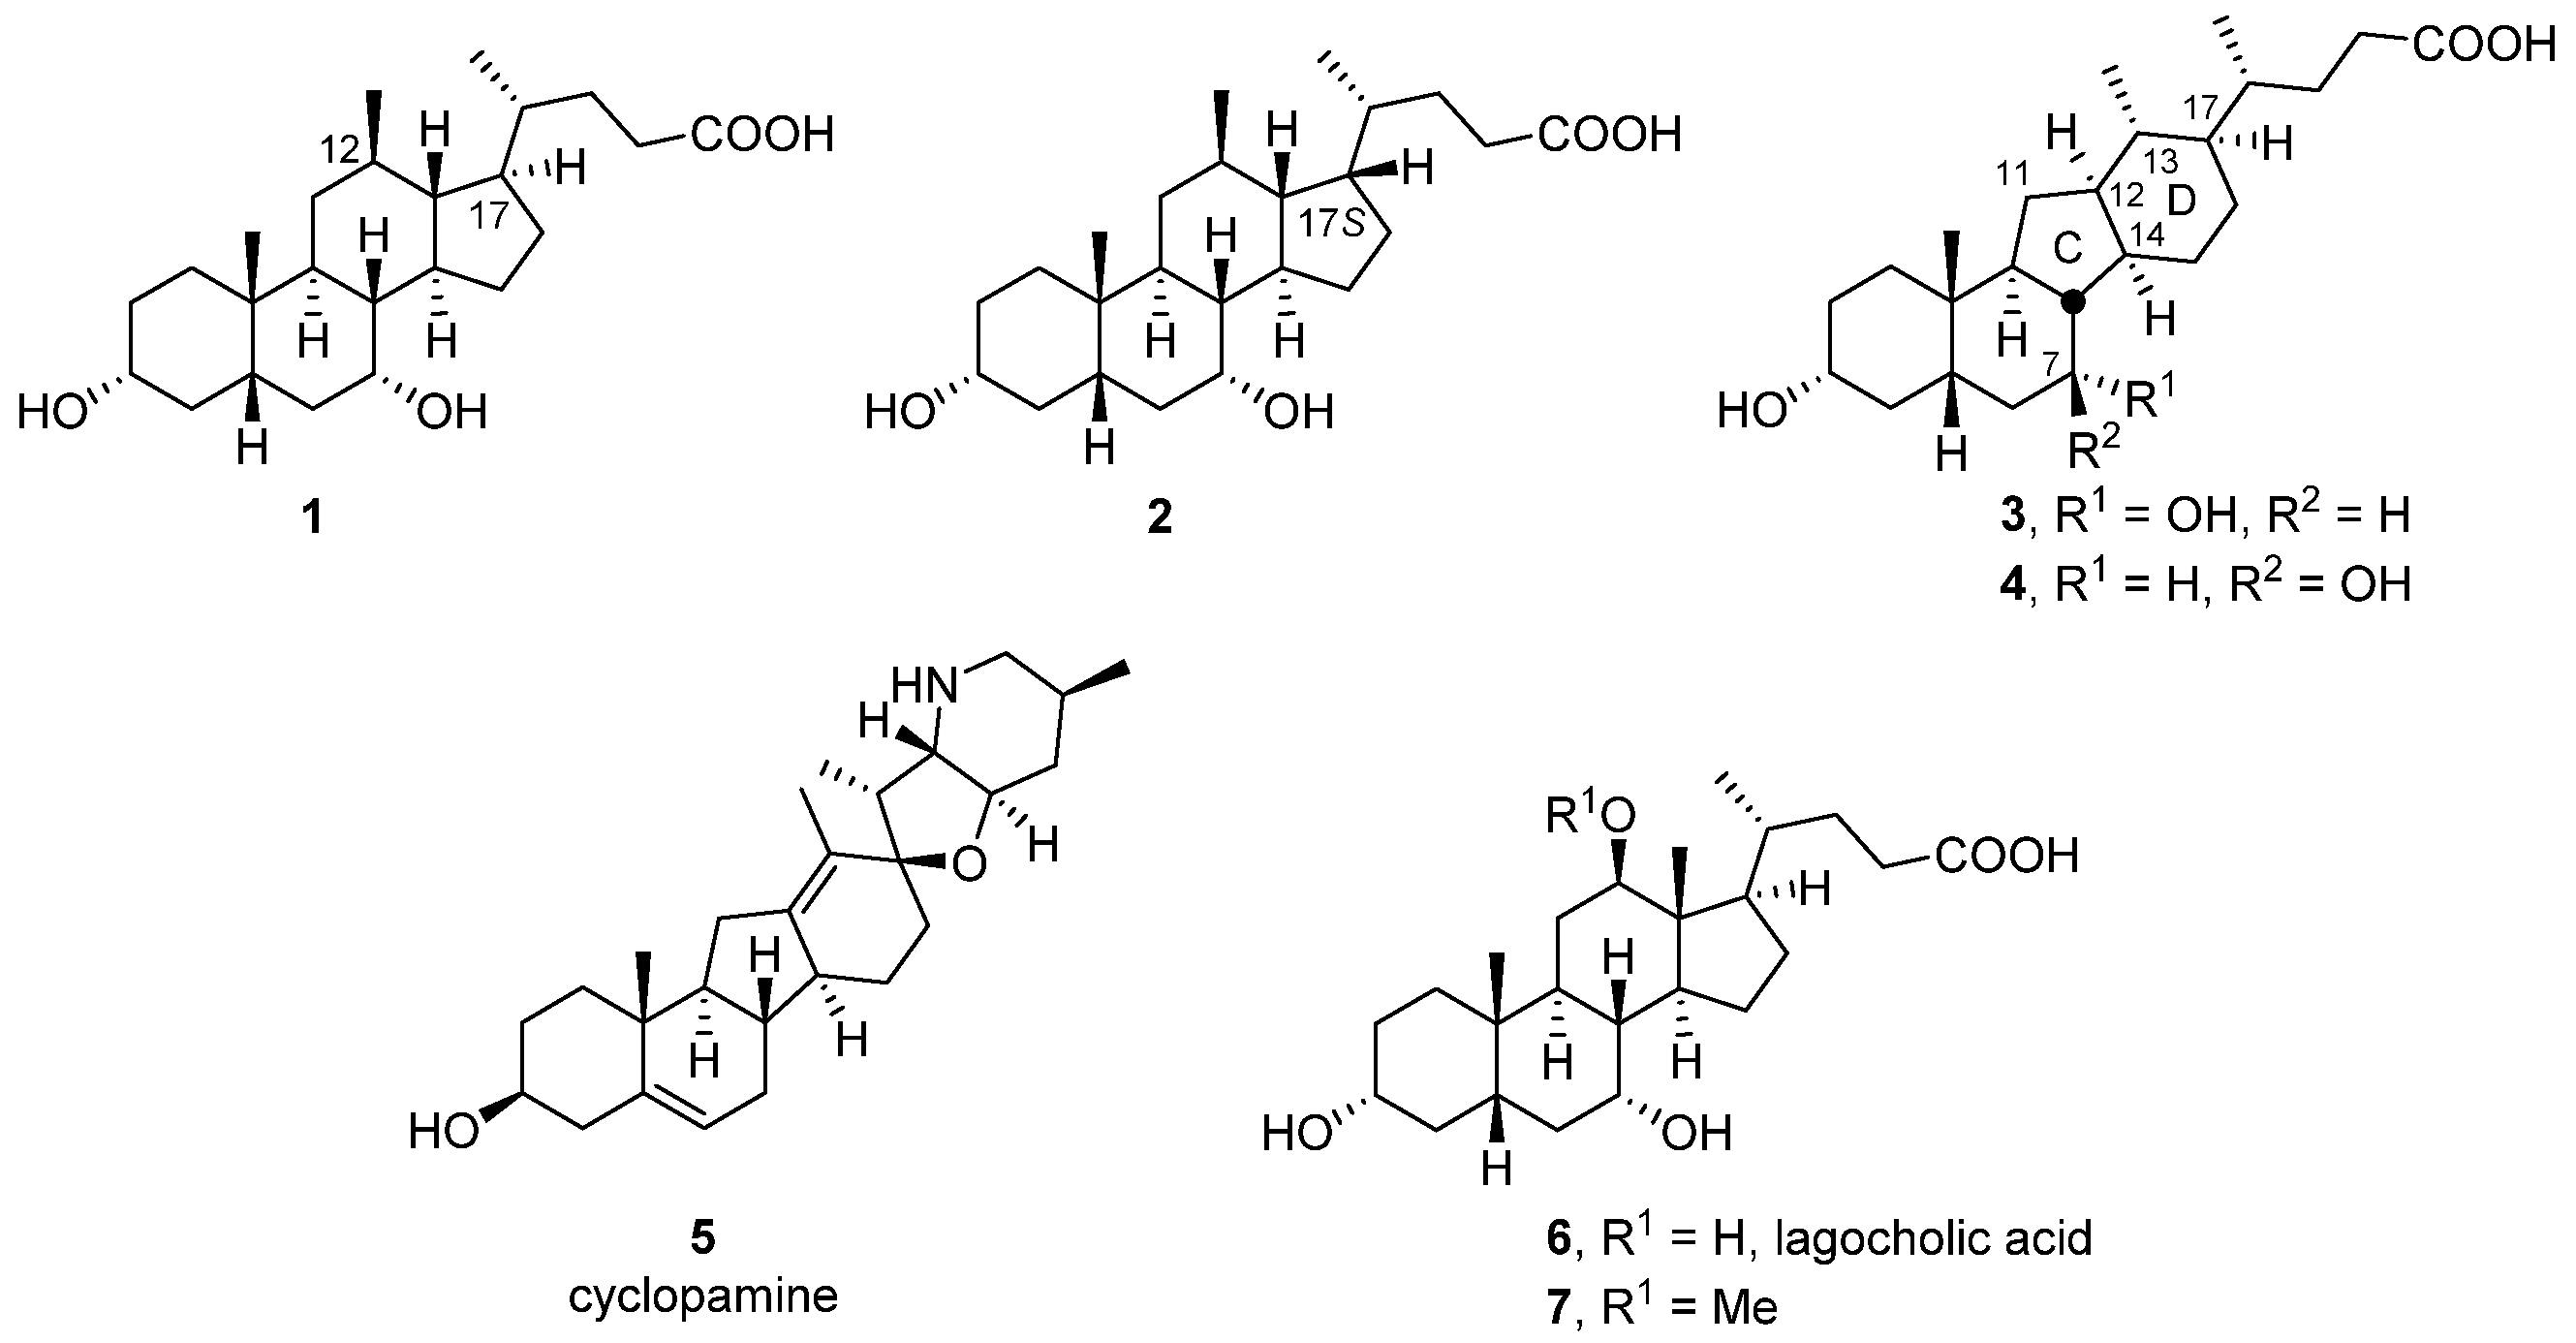
3α,7-Dihydroxy-14(13→12)abeo-5β,12α(H),13β(H)-cholan-24-oic Acids Display Neuroprotective Properties in Common Forms of Parkinson’s Disease

 , , , and
Abstract
:1. Introduction
2. Materials and Methods
2.1. Chemistry
2.1.1. General Experimental Procedures
2.1.2. Syntheses
2.2. Participant Recruitment and Fibroblast Collection
2.3. Fibroblast Culture
2.4. Measurement of Mitochondrial Function
2.5. Mitochondrial Membrane Potential
3. Results and Discussion
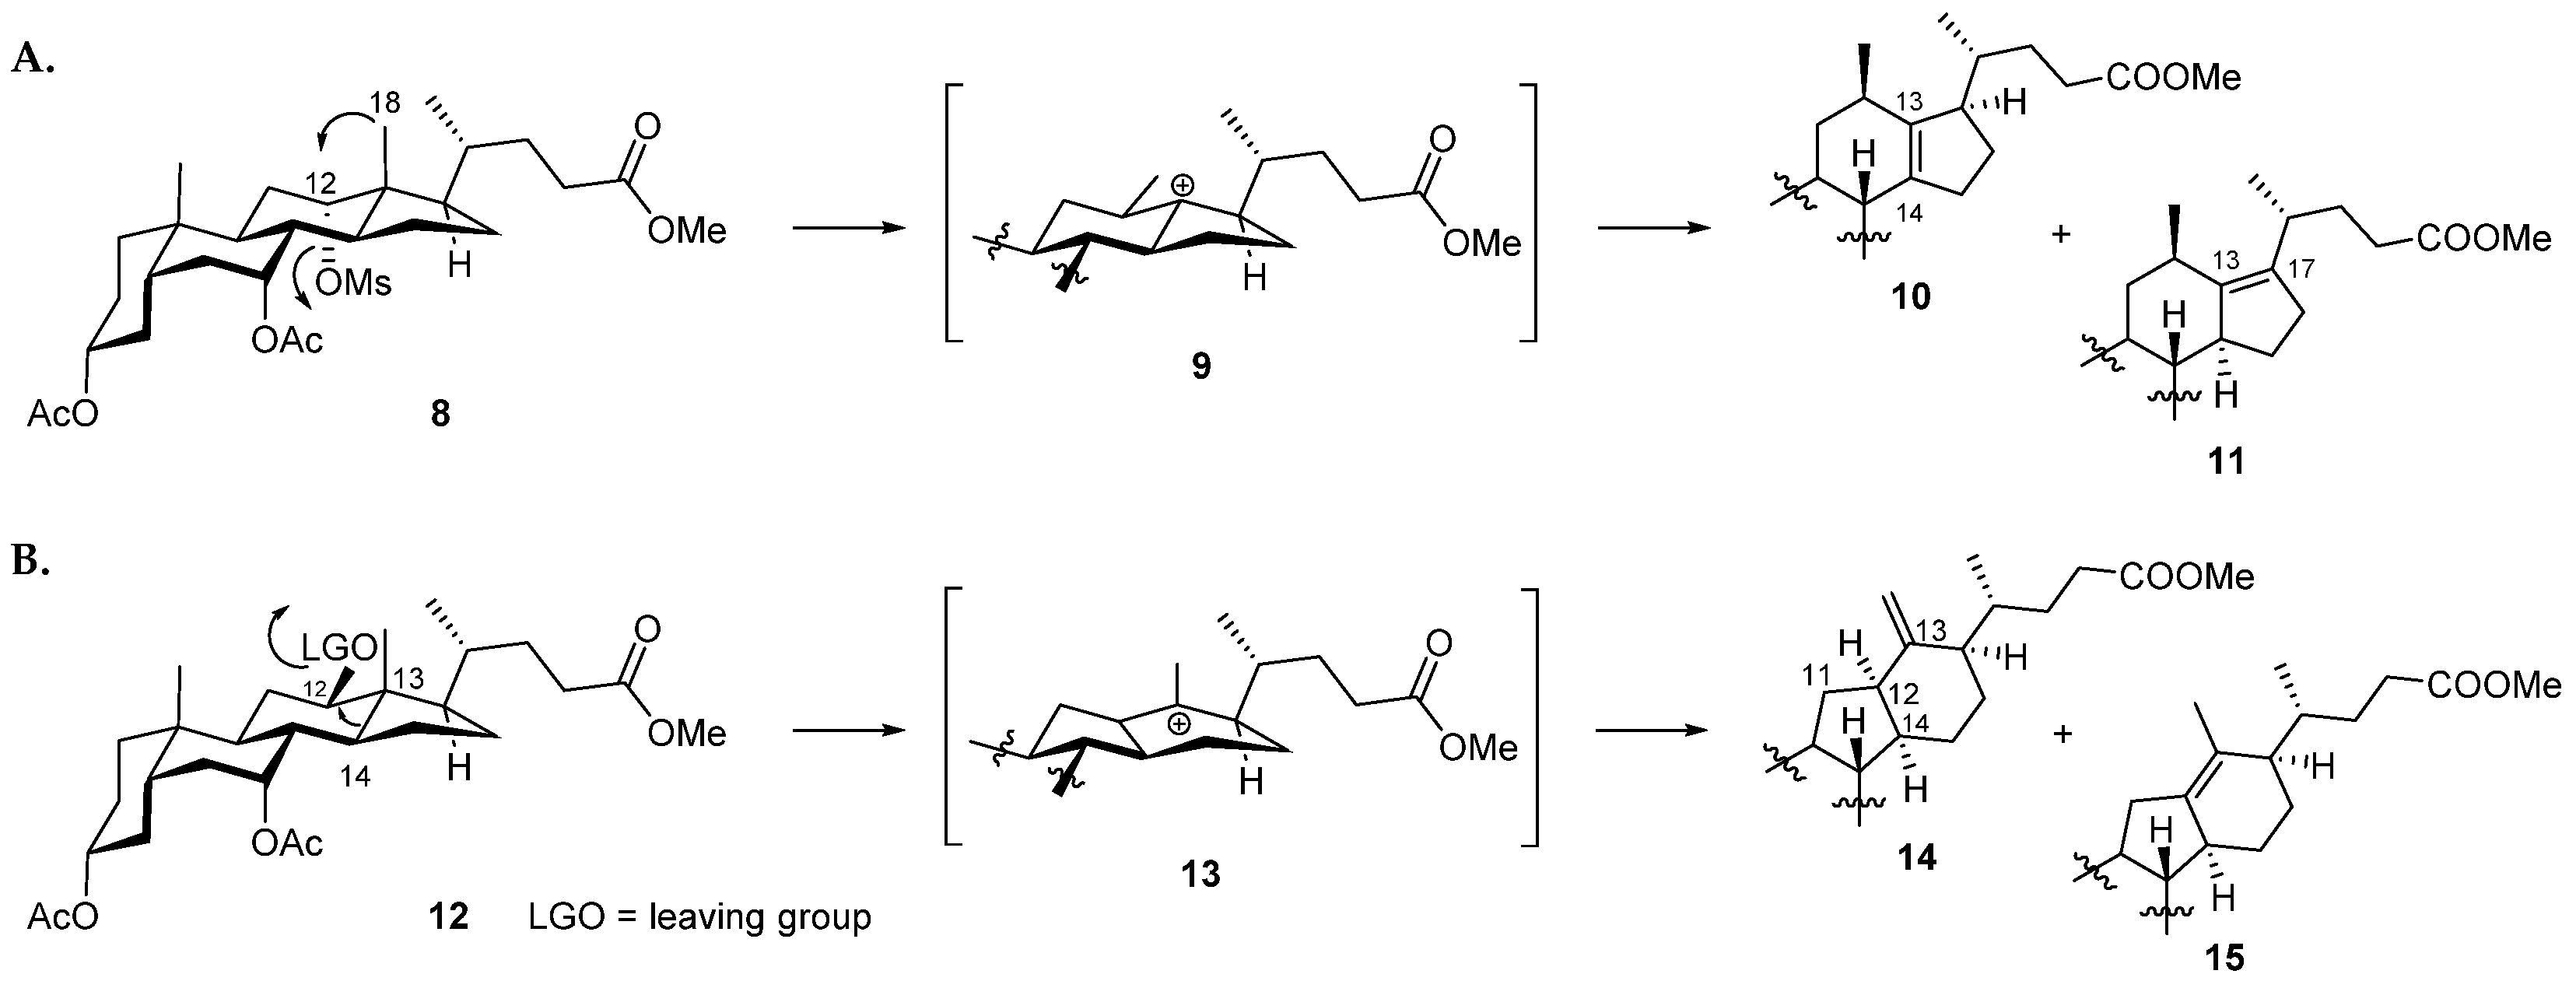
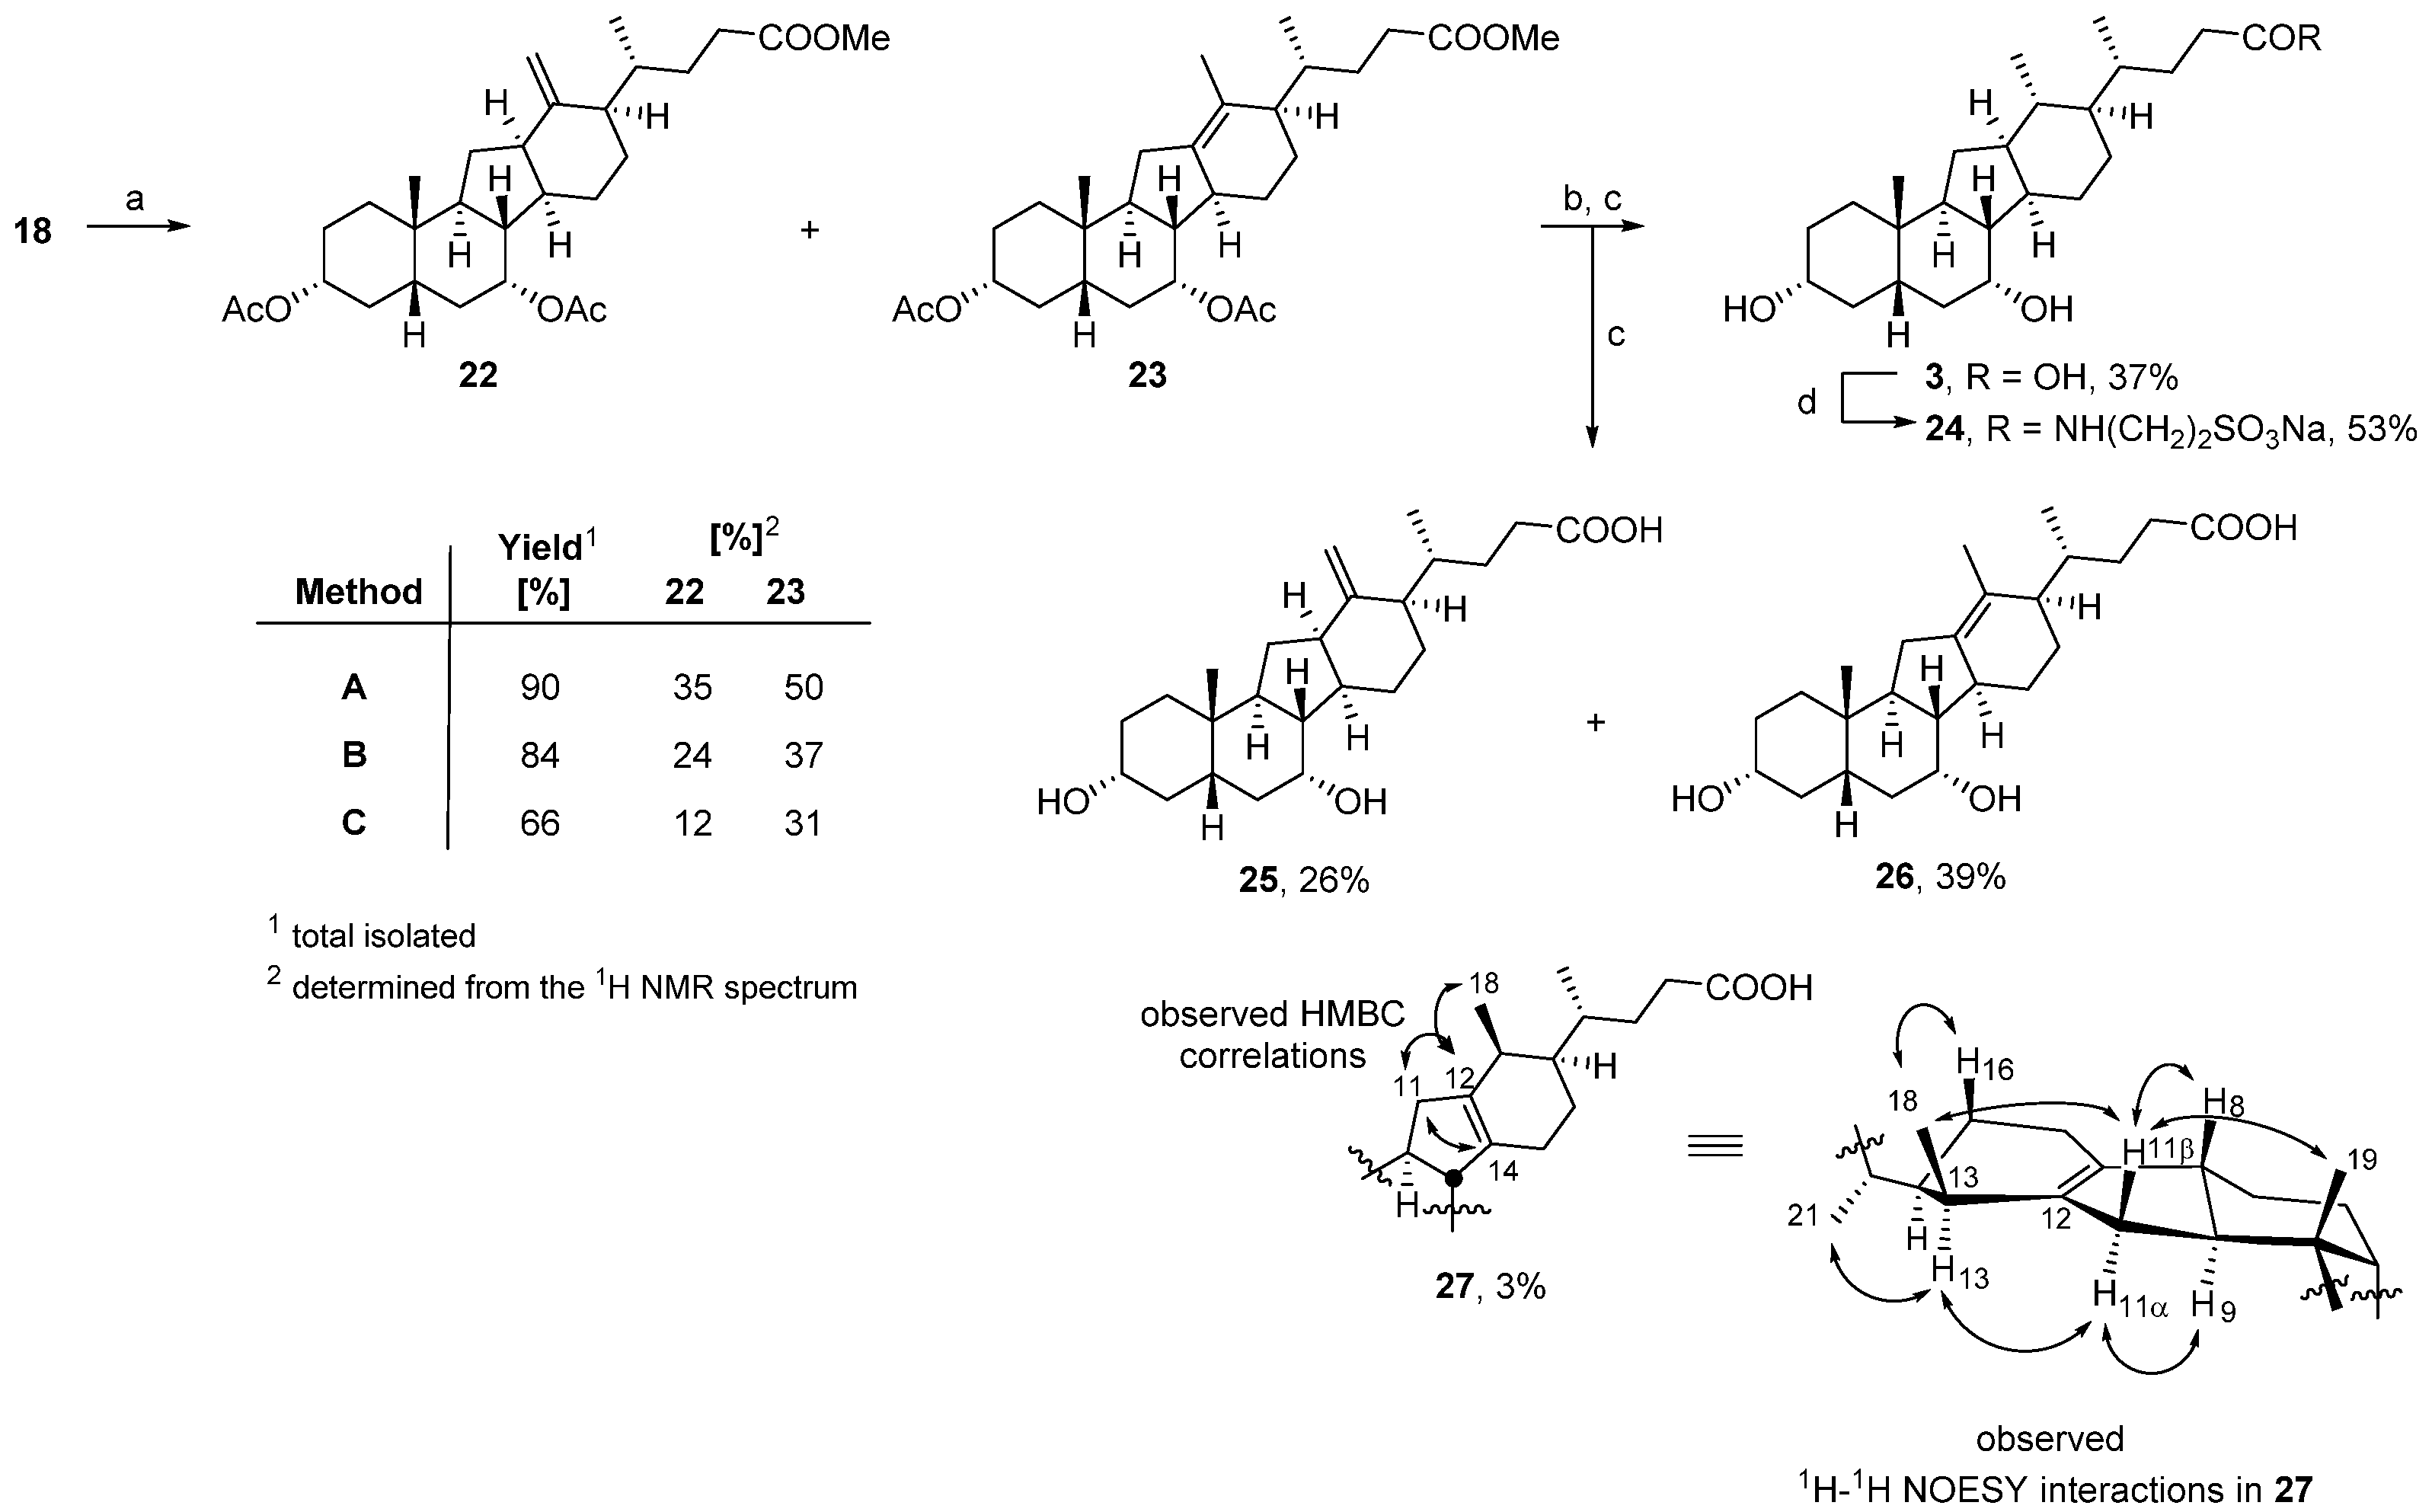
3.1. Chemistry
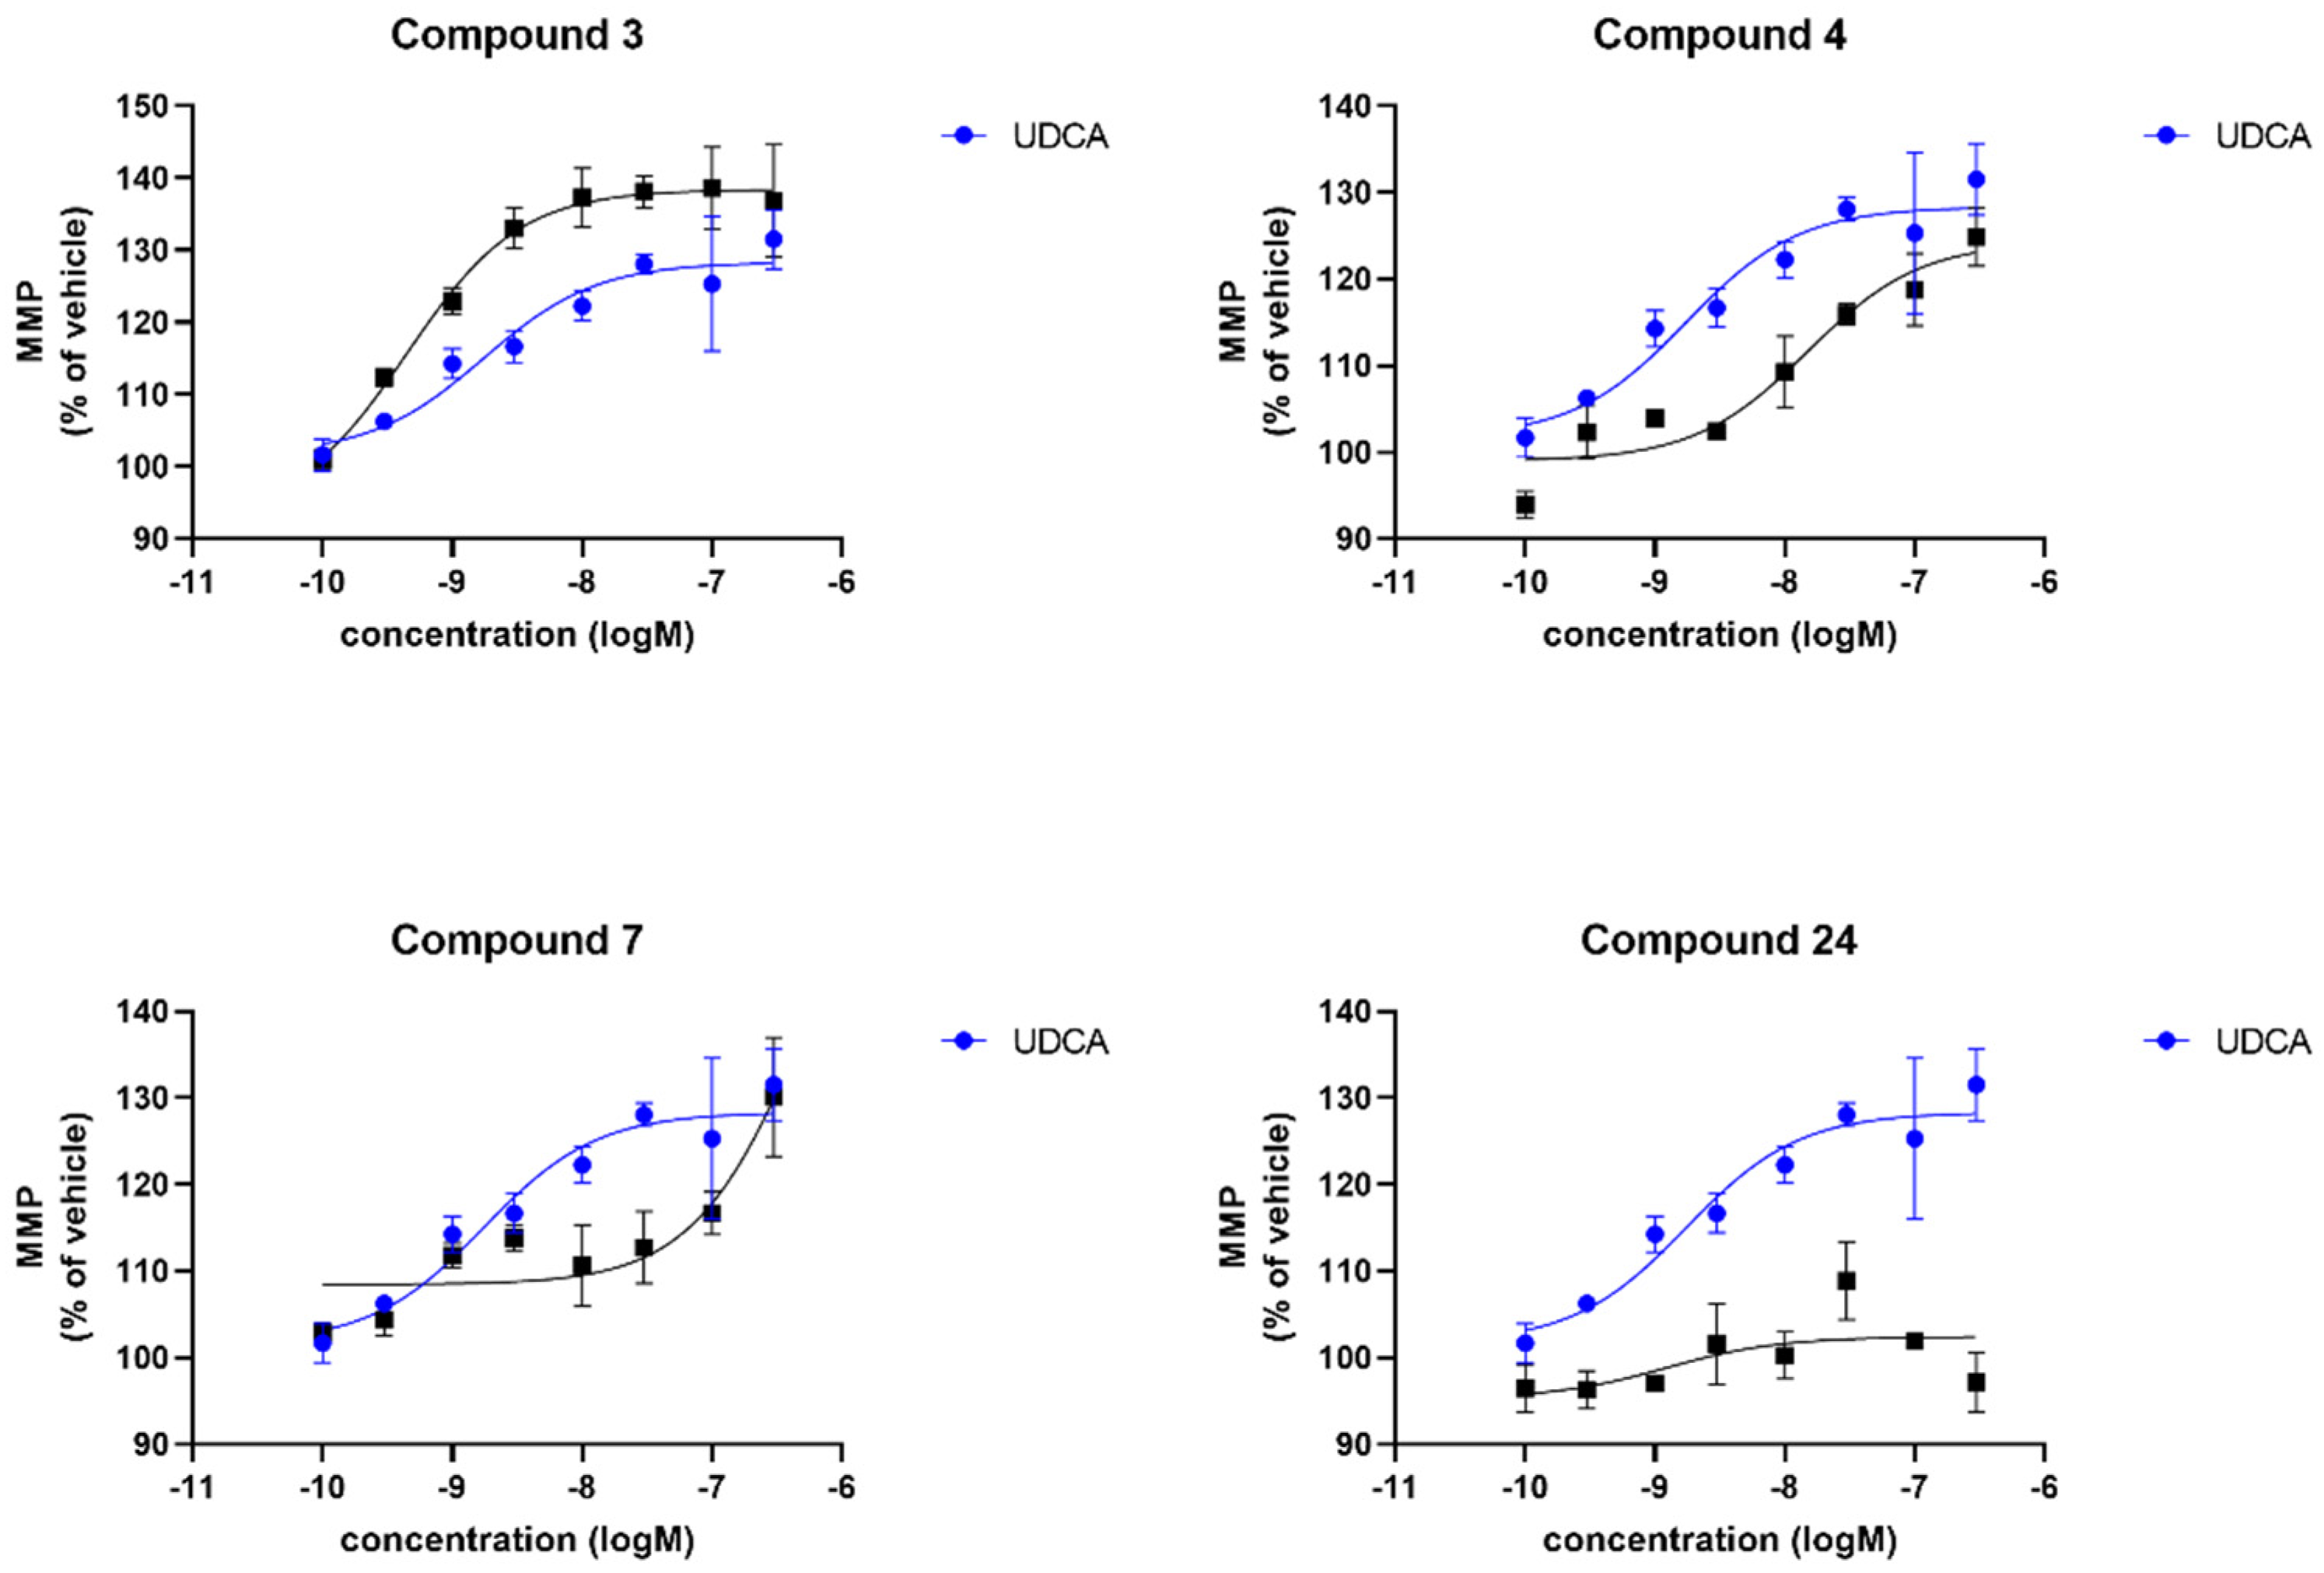
3.2. Biology
4. Conclusions
Supplementary Materials
Author Contributions
Funding
Institutional Review Board Statement
Informed Consent Statement
Data Availability Statement
Acknowledgments
Conflicts of Interest
Sample Availability
Abbreviations
References
- Dorsey, E.R.; Elbaz, A.; Nichols, E.; Abbasi, N.; Abd-Allah, F.; Abdelalim, A.; Adsuar, J.C.; Ansha, M.G.; Brayne, C.; Choi, J.-Y.J.; et al. Global, regional, and national burden of Parkinson’s disease, 1990–2016: A systematic analysis for the Global Burden of Disease Study 2016. Lancet Neurol. 2018, 17, 939–953. [Google Scholar] [CrossRef] [PubMed] [Green Version]
- Schilder, B.M.; Navarro, E.; Raj, T. Multi-omic insights into Parkinson’s Disease: From genetic associations to functional mechanisms. Neurobiol. Dis. 2022, 163, 105580. [Google Scholar] [CrossRef] [PubMed]
- McFarthing, K.; Rafaloff, G.; Baptista, M.; Mursaleen, L.; Fuest, R.; Wyse, R.K.; Stott, S.R.W. Parkinson’s Disease Drug Therapies in the Clinical Trial Pipeline: 2022 Update. J. Parkinsons Dis. 2022, 12, 1073–1082. [Google Scholar] [CrossRef] [PubMed]
- Langston, J.W. The MPTP story. J. Parkinsons Dis. 2017, 7, S11–S19. [Google Scholar] [CrossRef] [Green Version]
- Schapira, A.H.; Cooper, J.M.; Dexter, D.; Clark, J.B.; Jenner, P.; Marsden, C.D. Mitochondrial complex I deficiency in Parkinson’s disease. J. Neurochem. 1990, 54, 823–827. [Google Scholar] [CrossRef]
- Blake, C.I.; Spitz, E.; Leehey, M.; Hoffer, B.J.; Boyson, S.J. Platelet mitochondrial respiratory chain function in Parkinson’s disease. Mov. Disord. 1997, 12, 3–8. [Google Scholar] [CrossRef]
- Carling, P.J.; Mortiboys, H.; Green, C.; Mihaylov, S.; Sandor, C.; Schwartzentruber, A.; Taylor, R.; Wei, W.; Hastings, C.; Wong, S.; et al. Deep phenotyping of peripheral tissue facilitates mechanistic disease stratification in sporadic Parkinson’s disease. Prog. Neurobiol. 2020, 187, 101772. [Google Scholar] [CrossRef]
- Milanese, C.; Payan-Gomez, C.; Galvani, M.; Molano Gonzalez, N.; Tresini, M.; Nait Abdellah, S.; van Roon-Mom, W.M.C.; Figini, S.; Marinus, J.; van Hilten, J.J.; et al. Peripheral mitochondrial function correlates with clinical severity in idiopathic Parkinson’s disease. Mov. Disord. 2019, 34, 1192–1202. [Google Scholar] [CrossRef]
- Winkler-Stuck, K.; Wiedemann, F.R.; Wallesch, C.W.; Kunz, W.S. Effect of coenzyme Q10 on the mitochondrial function of skin fibroblasts from Parkinson patients. J. Neurol. Sci. 2004, 220, 41–48. [Google Scholar] [CrossRef]
- Grunewald, A.; Voges, L.; Rakovic, A.; Kasten, M.; Vandebona, H.; Hemmelmann, C.; Lohmann, K.; Orolicki, S.; Ramirez, A.; Schapira, A.H.; et al. Mutant Parkin impairs mitochondrial function and morphology in human fibroblasts. PLoS ONE 2010, 5, e12962. [Google Scholar] [CrossRef]
- Macdonald, R.; Barnes, K.; Hastings, C.; Mortiboys, H. Mitochondrial abnormalities in Parkinson’s disease and Alzheimer’s disease: Can mitochondria be targeted therapeutically? Biochem. Soc. Trans. 2018, 46, 891–909. [Google Scholar] [CrossRef] [PubMed]
- Mortiboys, H.; Aasly, J.; Bandmann, O. Ursocholanic acid rescues mitochondrial function in common forms of familial Parkinson’s disease. Brain 2013, 136, 3038–3050. [Google Scholar] [CrossRef] [PubMed] [Green Version]
- Pryde, K.R.; Smith, H.L.; Chau, K.Y.; Schapira, A.H. PINK1 disables the anti-fission machinery to segregate damaged mitochondria for mitophagy. J. Cell Biol. 2016, 213, 163–171. [Google Scholar] [CrossRef] [PubMed] [Green Version]
- Payne, T.; Sassani, M.; Buckley, E.; Moll, S.; Anton, A.; Appleby, M.; Maru, S.; Taylor, R.; McNeill, A.; Hoggard, N.; et al. Ursodeoxycholic acid as a novel disease-modifying treatment for Parkinson’s disease: Protocol for a two-centre, randomised, double-blind, placebo-controlled trial, The UP study. BMJ Open 2020, 10, e038911. [Google Scholar] [CrossRef]
- Luxenburger, A.; Harris, L.D.; Ure, E.M.; Landaeta Aponte, R.A.; Woolhouse, A.D.; Cameron, S.A.; Ling, C.D.; Piltz, R.O.; Lewis, A.R.; Gainsford, G.J.; et al. Synthesis of 12β-Methyl-18-nor-bile Acids. ACS Omega 2021, 6, 25019–25039. [Google Scholar] [CrossRef]
- Heretsch, P.; Giannis, A. The Veratrum and Solanum alkaloids. Alkaloids Chem. Biol. 2015, 74, 201–232. [Google Scholar] [CrossRef]
- Heretsch, P.; Tzagkaroulaki, L.; Giannis, A. Cyclopamine and hedgehog signaling: Chemistry, biology, medical perspectives. Angew. Chem. Int. Ed. Engl. 2010, 49, 3418–3427. [Google Scholar] [CrossRef]
- Chen, J.K. I only have eye for ewe: The discovery of cyclopamine and development of Hedgehog pathway-targeting drugs. Nat. Prod. Rep. 2016, 33, 595–601. [Google Scholar] [CrossRef] [Green Version]
- Trinh, T.N.; McLaughlin, E.A.; Gordon, C.P.; McCluskey, A. Hedgehog signalling pathway inhibitors as cancer suppressing agents. Med. Chem. Commun. 2014, 5, 117–133. [Google Scholar] [CrossRef]
- Huang, Y.; Li, G.; Hong, C.; Zheng, X.; Yu, H.; Zhang, Y. Potential of Steroidal Alkaloids in Cancer: Perspective Insight Into Structure-Activity Relationships. Front. Oncol. 2021, 11, 733369. [Google Scholar] [CrossRef]
- Lee, S.T.; Welch, K.D.; Panter, K.E.; Gardner, D.R.; Garrossian, M.; Chang, C.W. Cyclopamine: From cyclops lambs to cancer treatment. J. Agric. Food Chem. 2014, 62, 7355–7362. [Google Scholar] [CrossRef] [PubMed]
- Ma, H.; Li, H.Q.; Zhang, X. Cyclopamine, a naturally occurring alkaloid, and its analogues may find wide applications in cancer therapy. Curr. Top Med. Chem. 2013, 13, 2208–2215. [Google Scholar] [CrossRef] [PubMed]
- Landaeta Aponte, R.A.; Luxenburger, A.; Cameron, S.A.; Weymouth-Wilson, A.; Furneaux, R.H.; Harris, L.D.; Compton, B.J. Synthesis of Novel C/D Ring Modified Bile Acids. Molecules 2022, 27, 2364. [Google Scholar] [CrossRef] [PubMed]
- Ure, E.M.; Harris, L.D.; Cameron, S.A.; Weymouth-Wilson, A.; Furneaux, R.H.; Pitman, J.L.; Hinkley, S.F.; Luxenburger, A. Synthesis of 12β-methyl-18-nor-avicholic acid analogues as potential TGR5 agonists. Org. Biomol. Chem. 2022, 20, 3511–3527. [Google Scholar] [CrossRef] [PubMed]
- Franco, P.; Porru, E.; Fiori, J.; Gioiello, A.; Cerra, B.; Roda, G.; Caliceti, C.; Simoni, P.; Roda, A. Identification and quantification of oxo-bile acids in human faeces with liquid chromatography-mass spectrometry: A potent tool for human gut acidic sterolbiome studies. J. Chromatogr. A 2019, 1585, 70–81. [Google Scholar] [CrossRef] [PubMed]
- Iida, T.; Momose, T.; Chang, F.C.; Nambara, T. Potential bile acid metabolites. XI Syntheses of stereoisomeric 7,12-dihydroxy-5α-cholanic acids. Chem. Pharm. Bull. 1986, 34, 1934–1938. [Google Scholar] [CrossRef] [Green Version]
- Yao, F. Method for Producing Ursodesoxycholic Acid from 98.0% of Cholic Acid of Cattle and Sheep. China Patent CN101215310A, September 2008. [Google Scholar]
- Tinajero-Delgado, V.; Romero-Ávila, M.; Flores-Álamo, M.; Arteaga, M.A.I. Synthesis, NMR Characterization and Crystal Structure of Methyl 3α,7α-Dihydroxy-12-oxo-5β-cholanate. J. Chem. Crystallogr. 2014, 44, 487–492. [Google Scholar] [CrossRef]
- Chang, F.C. Potential bile acid metabolites. 2. 3,7,12-Trisubstituted 5β-cholanic acids. J. Org. Chem. 1979, 44, 4567–4572. [Google Scholar] [CrossRef]
- Mortiboys, H.; Johansen, K.K.; Aasly, J.O.; Bandmann, O. Mitochondrial impairment in patients with Parkinson disease with the G2019S mutation in LRRK2. Neurology 2010, 75, 2017–2020. [Google Scholar] [CrossRef]
- Kaneko, K.; Mitsuhashi, H.; Hirayama, K.; Ohmori, S. 11-Deoxojervine as a precursor for jervine biosynthesis in Veratrum grandiflorum. Phytochemistry 1970, 9, 2497–2501. [Google Scholar] [CrossRef]
- Kaneko, K.; Mitsuhashi, H.; Hirayama, K.; Yoshida, N. Biosynthesis of C-nor-D-homo-steroidal alkaloids from acetate-1-14C, cholesterol-4-14C and cholesterol-26-14C in Veratrum grandiflorum. Phytochemistry 1970, 9, 2489–2495. [Google Scholar] [CrossRef]
- Kaneko, K.; Seto, H.; Motoki, C.; Mitsuhashi, H. Biosynthesis of rubijervine in Veratrum grandiflorum. Phytochemistry 1975, 14, 1295–1301. [Google Scholar] [CrossRef]
- Kaneko, K.; Tanaka, M.W.; Mitsuhashi, H. Origin of nitrogen in the biosynthesis of solanidine by Veratrum grandiflorum. Phytochemistry 1976, 15, 1391–1393. [Google Scholar] [CrossRef]
- Kaneko, K.; Tanaka, M.W.; Mitsuhashi, H. Dormantinol, a possible precursor in solanidine biosynthesis, from budding Veratrum grandiflorum. Phytochemistry 1977, 16, 1247–1251. [Google Scholar] [CrossRef]
- Tschesche, R.; Hulpke, H.; Fritz, R. Zur biosynthese von steroidderivaten im pflanzenreich—X. Phytochemistry 1968, 7, 2021–2026. [Google Scholar] [CrossRef]
- Giannis, A.; Mousavizadeh, F.; Meyer, D. Synthesis of C-Nor-D-homo-steroidal Alkaloids and Their Derivatives. Synthesis 2018, 50, 1587–1600. [Google Scholar] [CrossRef]
- Roumana, A.; Yektaoğlu, A.; Pliatsika, D.; Bantzi, M.; Nikolaropoulos, S.S.; Giannis, A.; Fousteris, M.A. New Spiro-Lactam C-nor-D-homo Steroids. Eur. J. Org. Chem. 2018, 2018, 4147–4160. [Google Scholar] [CrossRef]
- Šťastná, E.; Černý, I.; Pouzar, V.; Chodounská, H. Stereoselectivity of sodium borohydride reduction of saturated steroidal ketones utilizing conditions of Luche reduction. Steroids 2010, 75, 721–725. [Google Scholar] [CrossRef]
- Yu, D.D.; Sousa, K.M.; Mattern, D.L.; Wagner, J.; Fu, X.; Vaidehi, N.; Forman, B.M.; Huang, W. Stereoselective synthesis, biological evaluation, and modeling of novel bile acid-derived G-protein coupled bile acid receptor 1 (GP-BAR1, TGR5) agonists. Bioorg. Med. Chem. 2015, 23, 1613–1628. [Google Scholar] [CrossRef]
- Shimizu, T. Chloromethanesulfonate as an Efficient Leaving Group: Rearrangement of the Carbon-Carbon Bond and Conversion of Alcohols into Azides and Nitriles. Synthesis 1999, 1999, 1373–1385. [Google Scholar] [CrossRef]
- Giannis, A.; Heretsch, P.; Sarli, V.; Stossel, A. Synthesis of cyclopamine using a biomimetic and diastereoselective approach. Angew. Chem. Int. Ed. Engl. 2009, 48, 7911–7914. [Google Scholar] [CrossRef] [PubMed]
- Heretsch, P.; Rabe, S.; Giannis, A. A biomimetic approach to C-nor-D-homo-steroids. J. Am. Chem. Soc. 2010, 132, 9968–9969. [Google Scholar] [CrossRef] [PubMed]
- Anelli, P.L.; Lattuada, L.; Lorusso, V.; Lux, G.; Morisetti, A.; Morosini, P.; Serleti, M.; Uggeri, F. Conjugates of Gadolinium Complexes to Bile Acids as Hepatocyte-Directed Contrast Agents for Magnetic Resonance Imaging. J. Med. Chem. 2004, 47, 3629–3641. [Google Scholar] [CrossRef] [PubMed]
- Sepe, V.; Ummarino, R.; D’Auria, M.V.; Chini, M.G.; Bifulco, G.; Renga, B.; D’Amore, C.; Debitus, C.; Fiorucci, S.; Zampella, A. Conicasterol E, a small heterodimer partner sparing farnesoid X receptor modulator endowed with a pregnane X receptor agonistic activity, from the marine sponge Theonella swinhoei. J. Med. Chem. 2012, 55, 84–93. [Google Scholar] [CrossRef]
- Dangate, P.S.; Salunke, C.L.; Akamanchi, K.G. Regioselective oxidation of cholic acid and its 7β epimer by using o-iodoxybenzoic acid. Steroids 2011, 76, 1397–1399. [Google Scholar] [CrossRef]
- Mortiboys, H.; Furmston, R.; Bronstad, G.; Aasly, J.; Elliott, C.; Bandmann, O. UDCA exerts beneficial effect on mitochondrial dysfunction in LRRK2(G2019S) carriers and in vivo. Neurology 2015, 85, 846–852. [Google Scholar] [CrossRef] [Green Version]
- Mortiboys, H.; Thomas, K.J.; Koopman, W.J.H.; Klaffke, S.; Abou-Sleiman, P.; Olpin, S.; Wood, N.W.; Willems, P.H.G.M.; Smeitink, J.A.M.; Cookson, M.R.; et al. Mitochondrial function and morphology are impaired in parkin-mutant fibroblasts. Ann. Neurol. 2008, 64, 555–565. [Google Scholar] [CrossRef]
- Moreira, S.; Fonseca, I.; Nunes, M.J.; Rosa, A.; Lemos, L.; Rodrigues, E.; Carvalho, A.N.; Outeiro, T.F.; Rodrigues, C.M.P.; Gama, M.J.; et al. Nrf2 activation by tauroursodeoxycholic acid in experimental models of Parkinson’s disease. Exp. Neurol. 2017, 295, 77–87. [Google Scholar] [CrossRef]
- Castro-Caldas, M.; Carvalho, A.N.; Rodrigues, E.; Henderson, C.J.; Wolf, C.R.; Rodrigues, C.M.; Gama, M.J. Tauroursodeoxycholic acid prevents MPTP-induced dopaminergic cell death in a mouse model of Parkinson’s disease. Mol. Neurobiol. 2012, 46, 475–486. [Google Scholar] [CrossRef]
- Rosa, A.I.; Duarte-Silva, S.; Silva-Fernandes, A.; Nunes, M.J.; Carvalho, A.N.; Rodrigues, E.; Gama, M.J.; Rodrigues, C.M.P.; Maciel, P.; Castro-Caldas, M. Tauroursodeoxycholic Acid Improves Motor Symptoms in a Mouse Model of Parkinson’s Disease. Mol. Neurobiol. 2018, 55, 9139–9155. [Google Scholar] [CrossRef]
- Shao, Y.; Li, T.; Liu, Z.; Wang, X.; Xu, X.; Li, S.; Xu, G.; Le, W. Comprehensive metabolic profiling of Parkinson’s disease by liquid chromatography-mass spectrometry. Mol. Neurodegener. 2021, 16, 4. [Google Scholar] [CrossRef] [PubMed]
- Nie, K.; Li, Y.; Zhang, J.; Gao, Y.; Qiu, Y.; Gan, R.; Zhang, Y.; Wang, L. Distinct Bile Acid Signature in Parkinson’s Disease With Mild Cognitive Impairment. Front. Neurol. 2022, 13, 897867. [Google Scholar] [CrossRef] [PubMed]


| Compound | sPD | LRRK2 | ||
|---|---|---|---|---|
| Maximal Response [%] 1 | logEC50 2 | Maximal Response [%] 1 | logEC50 2 | |
| UDCA | 165 | −7.1 | 127 | −8.4 |
| 3 | 230 | -6 | 141 | −9.3 |
| 4 | 125 | −8.6 | 173 | −8 |
| 7 | 132 | −8.9 | 147 | −7.7 |
| 24 | 143 | −9.1 | 140 | −8.1 |
| Compound | sPD | LRRK2 | ||
|---|---|---|---|---|
| Maximal Response [%] 1 | logEC50 2 | Maximal Response [%]1 | logEC50 2 | |
| UDCA | 122 | −8.2 | 128 | −8.7 |
| 3 | n.d. | n.d. | 138 | −9.3 |
| 4 | 161 | −5.9 | 124 | −7.8 |
| 7 | 116 | −11.4 | 169 | −6.2 |
| 24 | n.d. | n.d. | n.d. | n.d. |
Disclaimer/Publisher’s Note: The statements, opinions and data contained in all publications are solely those of the individual author(s) and contributor(s) and not of MDPI and/or the editor(s). MDPI and/or the editor(s) disclaim responsibility for any injury to people or property resulting from any ideas, methods, instructions or products referred to in the content. |
© 2022 by the authors. Licensee MDPI, Basel, Switzerland. This article is an open access article distributed under the terms and conditions of the Creative Commons Attribution (CC BY) license (https://creativecommons.org/licenses/by/4.0/).
Share and Cite
Luxenburger, A.; Clemmens, H.; Hastings, C.; Harris, L.D.; Ure, E.M.; Cameron, S.A.; Aasly, J.; Bandmann, O.; Weymouth-Wilson, A.; Furneaux, R.H.; et al. 3α,7-Dihydroxy-14(13→12)abeo-5β,12α(H),13β(H)-cholan-24-oic Acids Display Neuroprotective Properties in Common Forms of Parkinson’s Disease. Biomolecules 2023, 13, 76. https://doi.org/10.3390/biom13010076
Luxenburger A, Clemmens H, Hastings C, Harris LD, Ure EM, Cameron SA, Aasly J, Bandmann O, Weymouth-Wilson A, Furneaux RH, et al. 3α,7-Dihydroxy-14(13→12)abeo-5β,12α(H),13β(H)-cholan-24-oic Acids Display Neuroprotective Properties in Common Forms of Parkinson’s Disease. Biomolecules. 2023; 13(1):76. https://doi.org/10.3390/biom13010076
Chicago/Turabian StyleLuxenburger, Andreas, Hannah Clemmens, Christopher Hastings, Lawrence D. Harris, Elizabeth M. Ure, Scott A. Cameron, Jan Aasly, Oliver Bandmann, Alex Weymouth-Wilson, Richard H. Furneaux, and et al. 2023. "3α,7-Dihydroxy-14(13→12)abeo-5β,12α(H),13β(H)-cholan-24-oic Acids Display Neuroprotective Properties in Common Forms of Parkinson’s Disease" Biomolecules 13, no. 1: 76. https://doi.org/10.3390/biom13010076