Article

Exploring the Distinct Distribution of Archaeal Communities in Sites Contaminated with Explosives

by
Yash Pal
,
Shanmugam Mayilraj
*,† and
Srinivasan Krishnamurthi
*
Microbial Type Culture Collection & Gene Bank (MTCC), CSIR-Institute of Microbial Technology, Sec-39A, Chandigarh 160036, India
*
Authors to whom correspondence should be addressed.
Present Address: Bentoli AgriNutrition India Pvt Ltd., 3F2, Third Floor, Front Block, Metro Tower, Building No. 115, Poonamallee, High Road, Chennai 600084, India.
Biomolecules 2022, 12(4), 489; https://doi.org/10.3390/biom12040489
Submission received: 4 October 2021 / Revised: 24 December 2021 / Accepted: 30 December 2021 / Published: 23 March 2022
(This article belongs to the Collection Archaea: Diversity, Metabolism and Molecular Biology)

Abstract

:
Most of the research on bioremediation and estimation of microbial diversity in waste contaminated sites is focused on the domain Bacteria, whereas details on the relevance of Archaea are still lacking. The present study examined the archaeal diversity and predicted metabolic pathways in two discrete sites (SITE1 and SITE2) contaminated with explosives (RDX and HMX) by amplicon-targeted sequencing of 16S rRNA genes. In total, 14 soil samples were processed, and 35,758 OTUs were observed, among which 981 OTUs were classified as Archaea, representing ~2.7% of the total microbial diversity in our samples. The majority of OTUs belonged to phyla Euryarchaeota (~49%), Crenarchaeota (~24%), and Thaumarchaeota (~23%), while the remaining (~4%) OTUs were affiliated to Candidatus Parvarchaeota, Candidatus Aenigmarchaeota, and Candidatus Diapherotrites. The comparative studies between explosives contaminated and agricultural soil samples (with no history of explosives contamination) displayed significant differences between the compositions of the archaeal communities. Further, the metabolic pathways pertaining to xenobiotic degradation were presumably more abundant in the contaminated sites. Our data provide a first comprehensive report of archaeal communities in explosives contaminated sites and their putative degradation role in such ecosystems which have been as yet unexplored.

1. Introduction

Archaea accounts for ~1–5% of all prokaryotes in soil surface layers and substantially impacts the biogeochemical cycling process [1,2]. Archaeal processes are of particular interest in “extreme” environments since they have evolved a range of energy metabolisms, including carbon fixation from inorganic sources [2]. In addition to the extremophilic Archaea, several non-extremophilic lineages have been detected in environments varying from marine to terrestrial using culture-independent techniques such as stable isotope probing (SIP), catalyzed reporter deposition-fluorescence in situ hybridization (CARD-FISH), and amplicon targeted sequencing [3]. Studies concerning the global distribution of dominant Archaea have revealed Crenarchaeota and Euryarchaeota in samples collected from soil, sediments, and water [1,4,5,6,7]. Interestingly, a few members of Euryarchaeota, in particular, haloarchaea and methanogens, are known to degrade xenobiotic pollutants and crude oil in the soil and marine sediments [8,9].
Among the explosives, RDX (research developed explosive; 1,3,5-Trinitro-1,3,5-triazine) and HMX (high melting explosive; 1,3,5,7-Tetranitro-1,3,5,7-tetrazocane) are the most widely used compounds for military operations and detonation [10,11]. RDX and HMX belong to nitramines class of explosives and hexamine is the major constituent for production of both the compounds. The low octanol-water partition coefficient of HMX (0.16, log Kow) and RDX (0.87, log Kow) suggests that they are not robustly absorbed by the organic molecules present in soil/sediment and have a tendency to migrate through groundwater flow [12]. As a result of increasing demands of explosives in military operations and their careless disposal, an overwhelming amount of explosives is released in soil and water ecosystems and exerts a noxious effect on the surrounding ecosystems. The effect of high and low concentrations of environmental contaminants and variables can range from total inhibition to bio-stimulation of some groups of native microbial communities [13,14]. Previous studies on evaluation of microbial community composition at explosives contaminated sites have utilized both the culture-dependent [15,16,17,18] and culture-independent [19,20,21,22,23] methods. Although in both intrinsic and engineered bioremediation processes, Archaea are often involved along with bacteria, unfortunately most of the above research has focused on the latter domain [22,23]. In addition, the sequencing protocol, including the primer specificity, depth of sequencing, sequencing platforms, varied significantly between the studies [21,22,23,24]. Similar disparity exists among other studies practicing RFLP (restriction fragment length polymorphism), DGGE (denaturing gradient gel electrophoresis), and SIP (stable isotope probing) techniques for the estimation of microbial diversity in explosives contaminated sites [19,20,23]. Indeed, very little is known about the diversity and distribution of archaeal communities compared to bacterial diversity and function in explosives contaminated sites.
For the present study, we investigated and compared the archaeal community structure and its distribution using NGS based meta-barcoding analysis of 16S rRNA gene at two geographically distinct explosives contaminated sites. Our findings suggest that the archaeal community composition at explosives contaminated site was significantly different from the agricultural soil samples. Until the time of writing this manuscript and to our knowledge, this is the first detailed evaluation and comparison of archaeal diversity from explosives contaminated sites.

2. Materials and Methods

2.1. Sample Collection

Soil samples were collected from two explosives (RDX/HMX) contaminated sites located at Central (SITE1; samples labeled as NS) and Northern (SITE2; samples labeled as PS) parts of India in the month of January and April 2016, respectively. Moreover, SITE2 has previously been studied for the isolation of explosives degrading bacteria [25]. Soil samples were collected in whirl pack bags (1L, Hi-Media, Mumbai, India) and transported to the laboratory within 4 h of sampling and immediately stored at −20 °C until further processing. Raw sequencing reads under the accession number PRJNA635685, experiment, SRX8429566 (labled as C1) and SRX8429565 (labled as C2) [26], from Rodale institute’s farming systems trial, running since 1981, with no history of exposure to explosive compounds were used as control samples to exclude their influence on microbial community structure during comparative analysis with explosives contaminated sites.

2.2. Analytical Techniques

Standard protocols described by Baruah and Barthakur [27] and AOAC 990.08 [28] specifications were used to determine the physicochemical parameters of only two samples with highest concentration of explosives contamination (NS2 sample for SITE1 and PS2 sample for SITE2). The concentration of explosives in all samples was detected as per U.S, EPA, 8330 methods [29]. Briefly, the soil samples were analyzed using LC-20, HPLC system (Shimadzu, Kyoto, Japan) equipped with Restek ultra C18 column (25 cm × 4.6 mm) (Restek, Bellefonte, PA, USA) and a UV-photodiode array detector (9926). The mobile phase consisted of 46% methanol (Merck, Darmstadt, Germany) and 54% deionised water (Merck, Germany) at 1 mL/min flow rate. The sample injection volume used was 10 µL with absorption detection at 254 nm. Samples quantification was performed using EPA certified RDX/HMX standards (Cat 31450; Restek, Bellefonte, PA, USA,) and known concentrations of RDX and HMX.

2.3. DNA Extraction and High-Throughput Sequencing

According to the manufacturer’s instructions, total community DNA from soil samples was isolated using a PowerSoil DNA isolation kit (MO-BIO, Carlsbad, CA, USA). The purity and concentration of isolated DNA were accessed using NanoDrop spectrophotometer (Nanodrop Technologies Inc., Wilmington, DE, USA) and agarose gel electrophoresis (365 nm, UV-A). Targeted amplicon sequencing was performed using Illumina sequencing platform (Hi-Seq 2500). Briefly, about 4 ng of total community DNA was used for specifically amplifying V3-V4 region with Archaea specific primers (Arch-349F, Forward primer: 5′ TCGTCGGCAGCGTCAGATGTGTATAAGAGACAGGTGYCAGCM-GCCGCGGTAA 3′; Arch-519R, Reverse primer: 5′ GTCTCGTGGGCTCGGAGATGTGT-ATAAGAGACAGGGACTCANVGGGTWTCTAAT 3′) [30] containing a ‘tag’ sequence (F; TCGTCGGCAGCGTCAGATGTGTATAAGAGACAG, R; GTCTCGTGGGCTCGGAGATGTGTATAAGAGACAG) complementary to adapter and index primers from the Nextera XT Index kit V2 resulting in the generation of single amplicons of ~265 × 2 bp. The quality of amplified products was checked on the agarose gel before proceeding for the next round of PCR (indexing PCR). The Illumina sequencing adapters and dual indexing barcodes were further added, using limited cycle PCR, resulting in ~305 × 2 bp PCR product. The quality of the library was validated by running an aliquot (1:10) on High Sensitivity Bioanalyzer Chip (Agilent, Santa Clara, CA, USA), and the sequences were determined using Hiseq 250 Rapid-Run, using TruSeq dual index primers. The raw reads from SITE1 and SITE2 were submitted in the NCBI SRA database under Bioproject PRJNA391401.

2.4. Sequence and Statistical Analyses

The Illumina paired end reads were demultiplexed using bcl2fastq, and quality checked using FastQC2. The raw reads having primer sequence and high-quality bases were selected and checked for sequence accuracy using Phred quality score, and the high quality reads with more than 70% of bases and Q score >20 were considered for further analysis. The quality reads were further stitched using Fastq-join3 command. These stitched reads were considered for further analysis using USEARCH version 10.24 [31]. Briefly, the reads were quality filtered, trimmed, and the chimeric reads were removed before unique OTU identification and clustering. The OTU files from USEARCH analysis were further used for classification using RDPclassifier version 2.11, database release 11.5 (≥97% sequence similarity) [32]. The assigned archaeal OTUs were manually segregated from the output file for each sample. The OTU files with only archaea assigned taxonomy were further used for graphical representation using MEGAN version 6 [33]. The Bacteria:Archaea ratio was calculated manually using the classified OTUs (Bacteria or Archaea) from RDPclassifier output. Co-occurring taxa were determined in MEGAN using the Jaccard correlation coefficient with an edge threshold of 70%, while the core-biome representatives were determined using a sample threshold of 50%. Calculation of diversity indexes, i.e., Shannon, Simpson, Chao1, observed species, and rarefaction curves were performed using MEGAN and PAST software version 4.03 [34]. Similarity or dissimilarity between archaeal taxa of contaminated and agricultural soil samples was calculated using PCoA plots in MEGAN and NMDS plots (Bray-Curtis index, p < 0.005) in PAST. The correlation between environmental parameters and archaeal taxa was tested using linear unconstrained PCA model by selecting default Canoco advisor settings in Canoco 5 (version 5.10) [35]. The difference between archaeal communities in contaminated and agricultural site was further validated using ANOSIM in PAST. The canonical correspondence analysis (CCA) of environmental variables and operational taxonomic units was performed using PAST with the Bray-Curtis similarity index.

2.5. Archaeal Communities Predictive Metabolic Profiling

The predictive functional profiles of archaeal communities were inferred by using PICRUSt version 1.4.1 [36]. To enhance the accuracy of predictive profiles specific to archaeal communities, high-throughput sequencing reads of classified archaeal OTUs (from RDPclassifier) were extracted manually. QIIME [37] module in galaxy server [38] was used for closed-reference out picking to fulfill the PICRUSt pipeline criteria followed by copy number normalization, metagenome prediction, and functional characterization using KEGG pathway at different hierarchy levels. Data from the PICRUSt in the biom format was exported to STAMP [39] for graphical representation.

3. Results

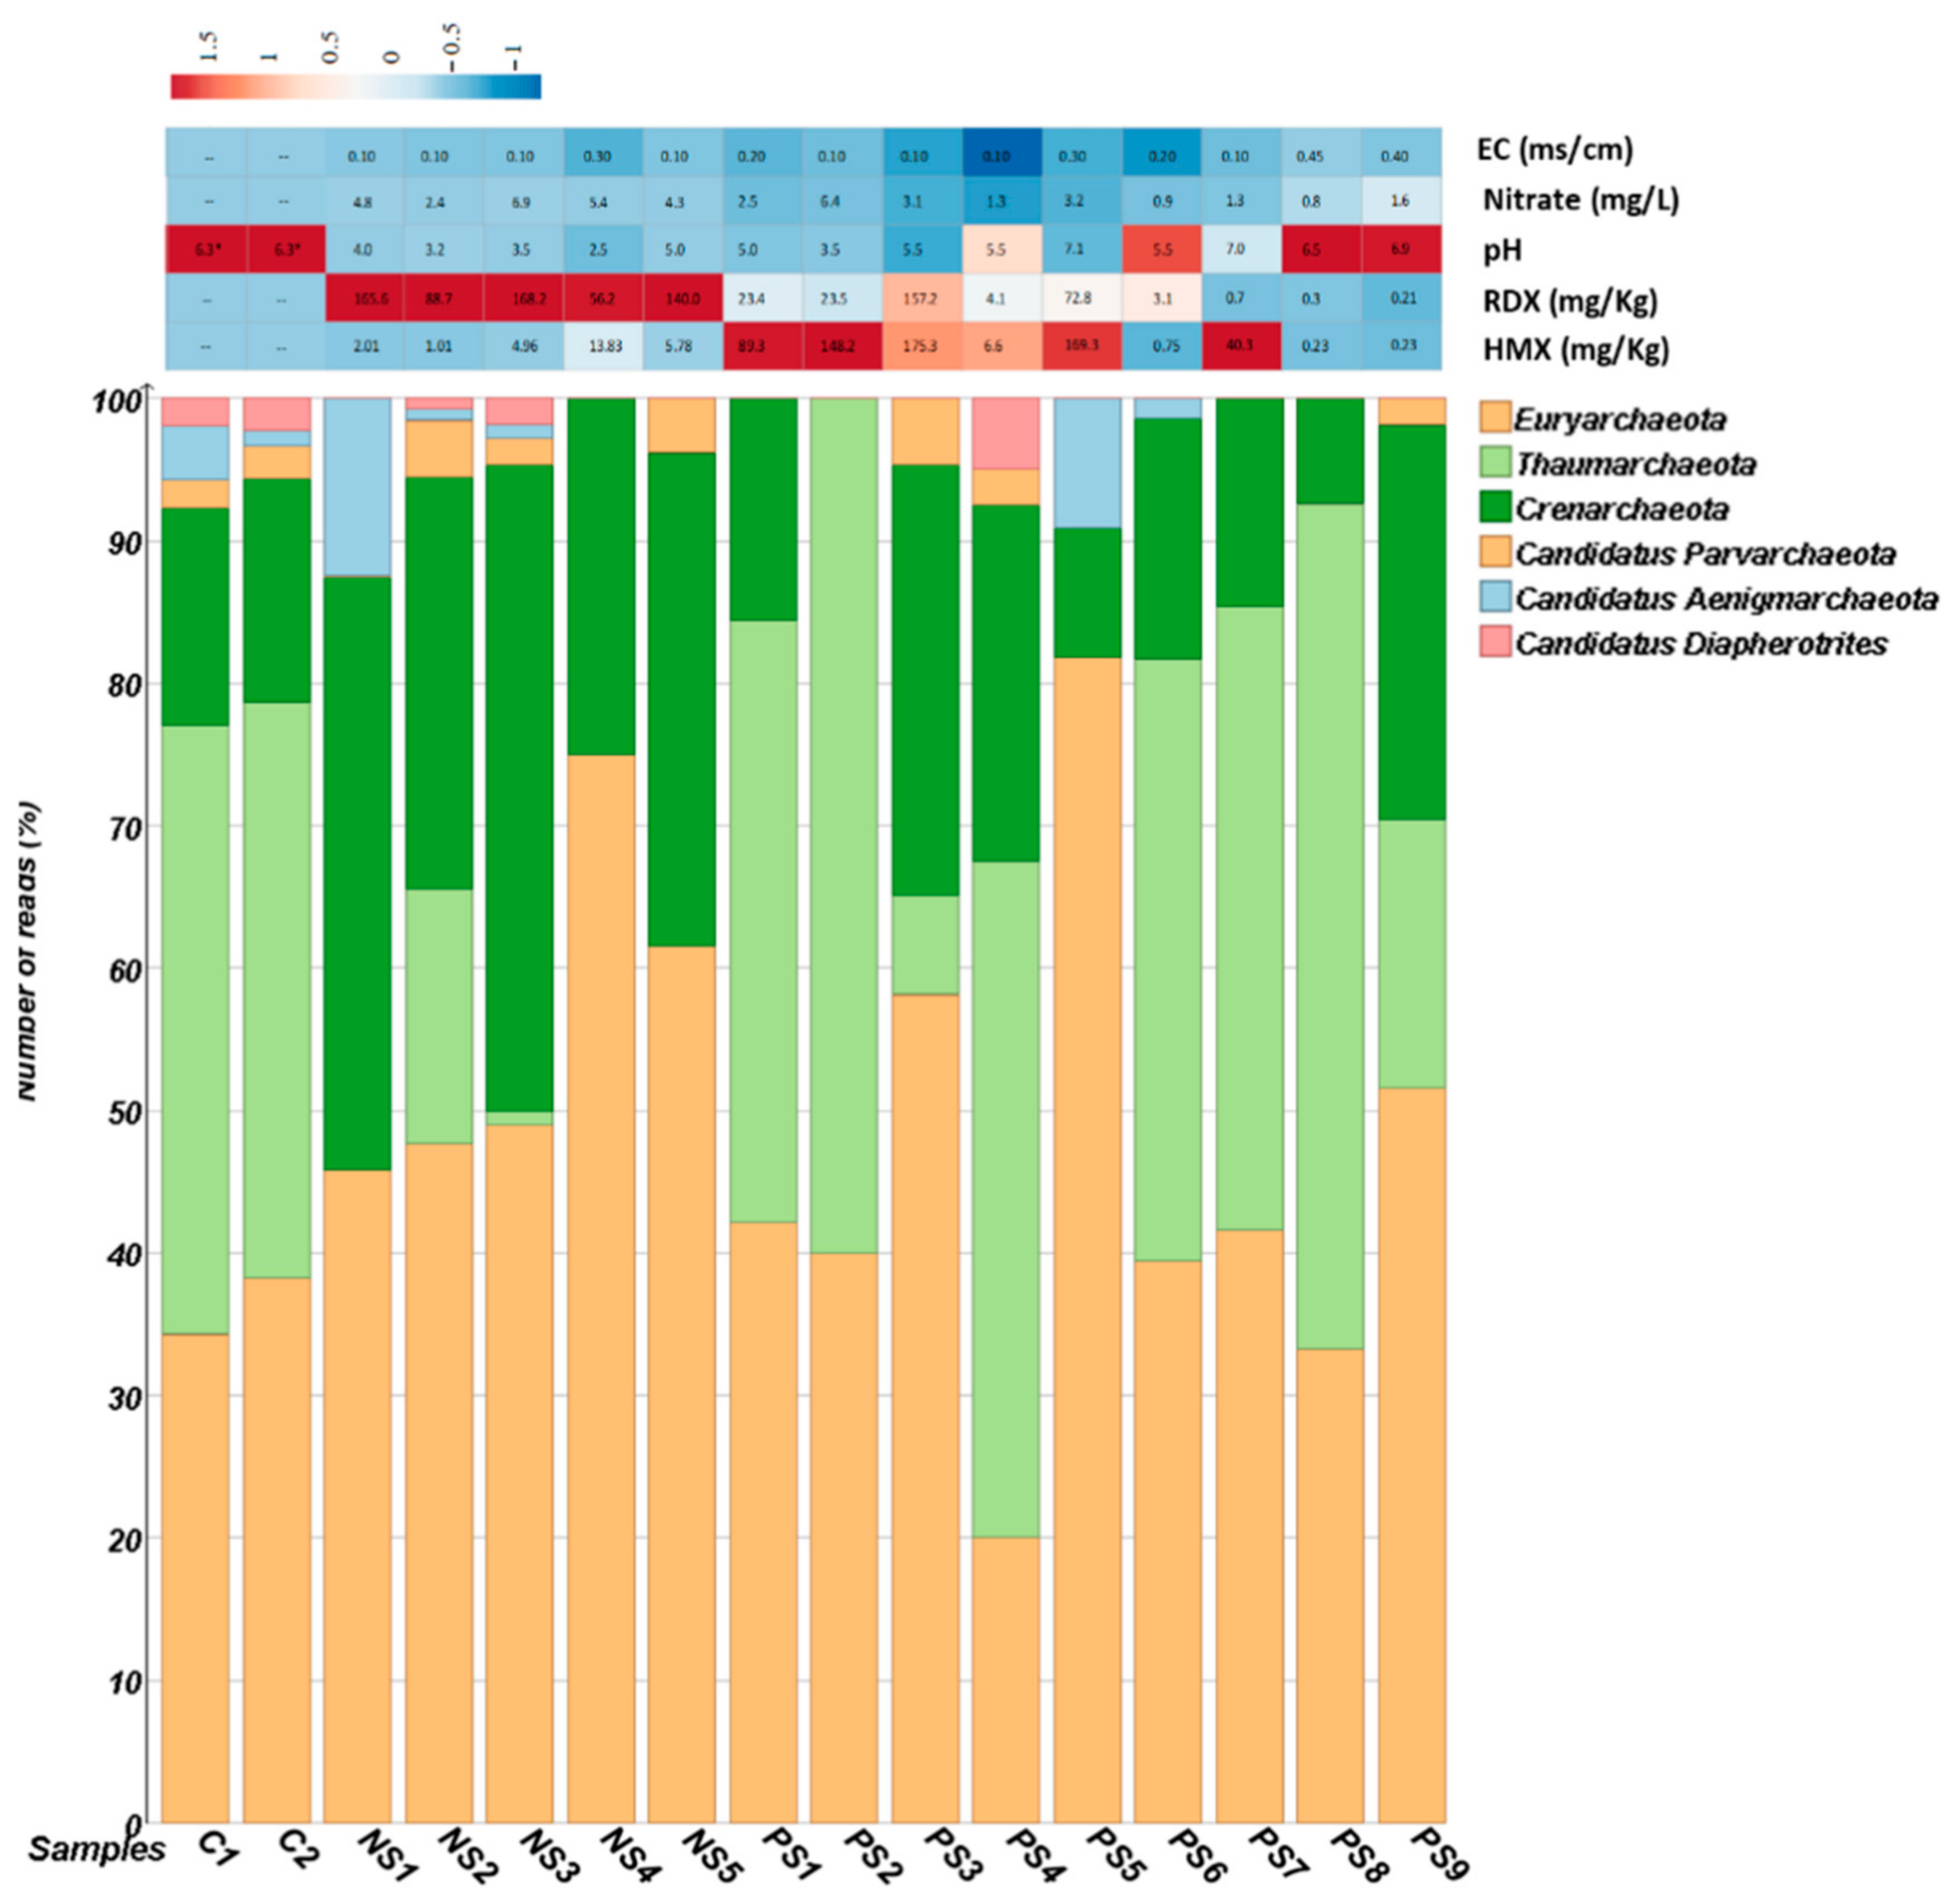
3.1. Physicochemical Analysis of Soil

From SITE1 (n = 5 samples) and SITE2 (n = 9 samples), a total of 14 samples were subjected to pH, nitrate, electrical conductivity (EC), RDX, and HMX concentration estimation. Briefly, the concentration of RDX and HMX in SITE1 samples ranges from 56–165 mg/kg and 1–13 mg/kg, respectively, while the concentration of RDX and HMX in SITE2 soil was 0.2–157 mg/kg and 0.2–175 mg/kg, respectively. The soil samples from SITE1 and SITE2 (PS1, PS2, PS3, PS5, and PS7) showed high levels of RDX/HMX (>24 mg/kg) contamination. The pH, nitrate and E.C. were in the range of 2.5–5 and 3.5–7.1, 2.4–6.9 and 0.8–6.4 (mg/l), and 0.10–0.30 and 0.10–0.45 (mS/cm) in SITE1 and SITE2 samples, respectively. The pH levels in C1 and C2 were in the range of 6.2–6.3.

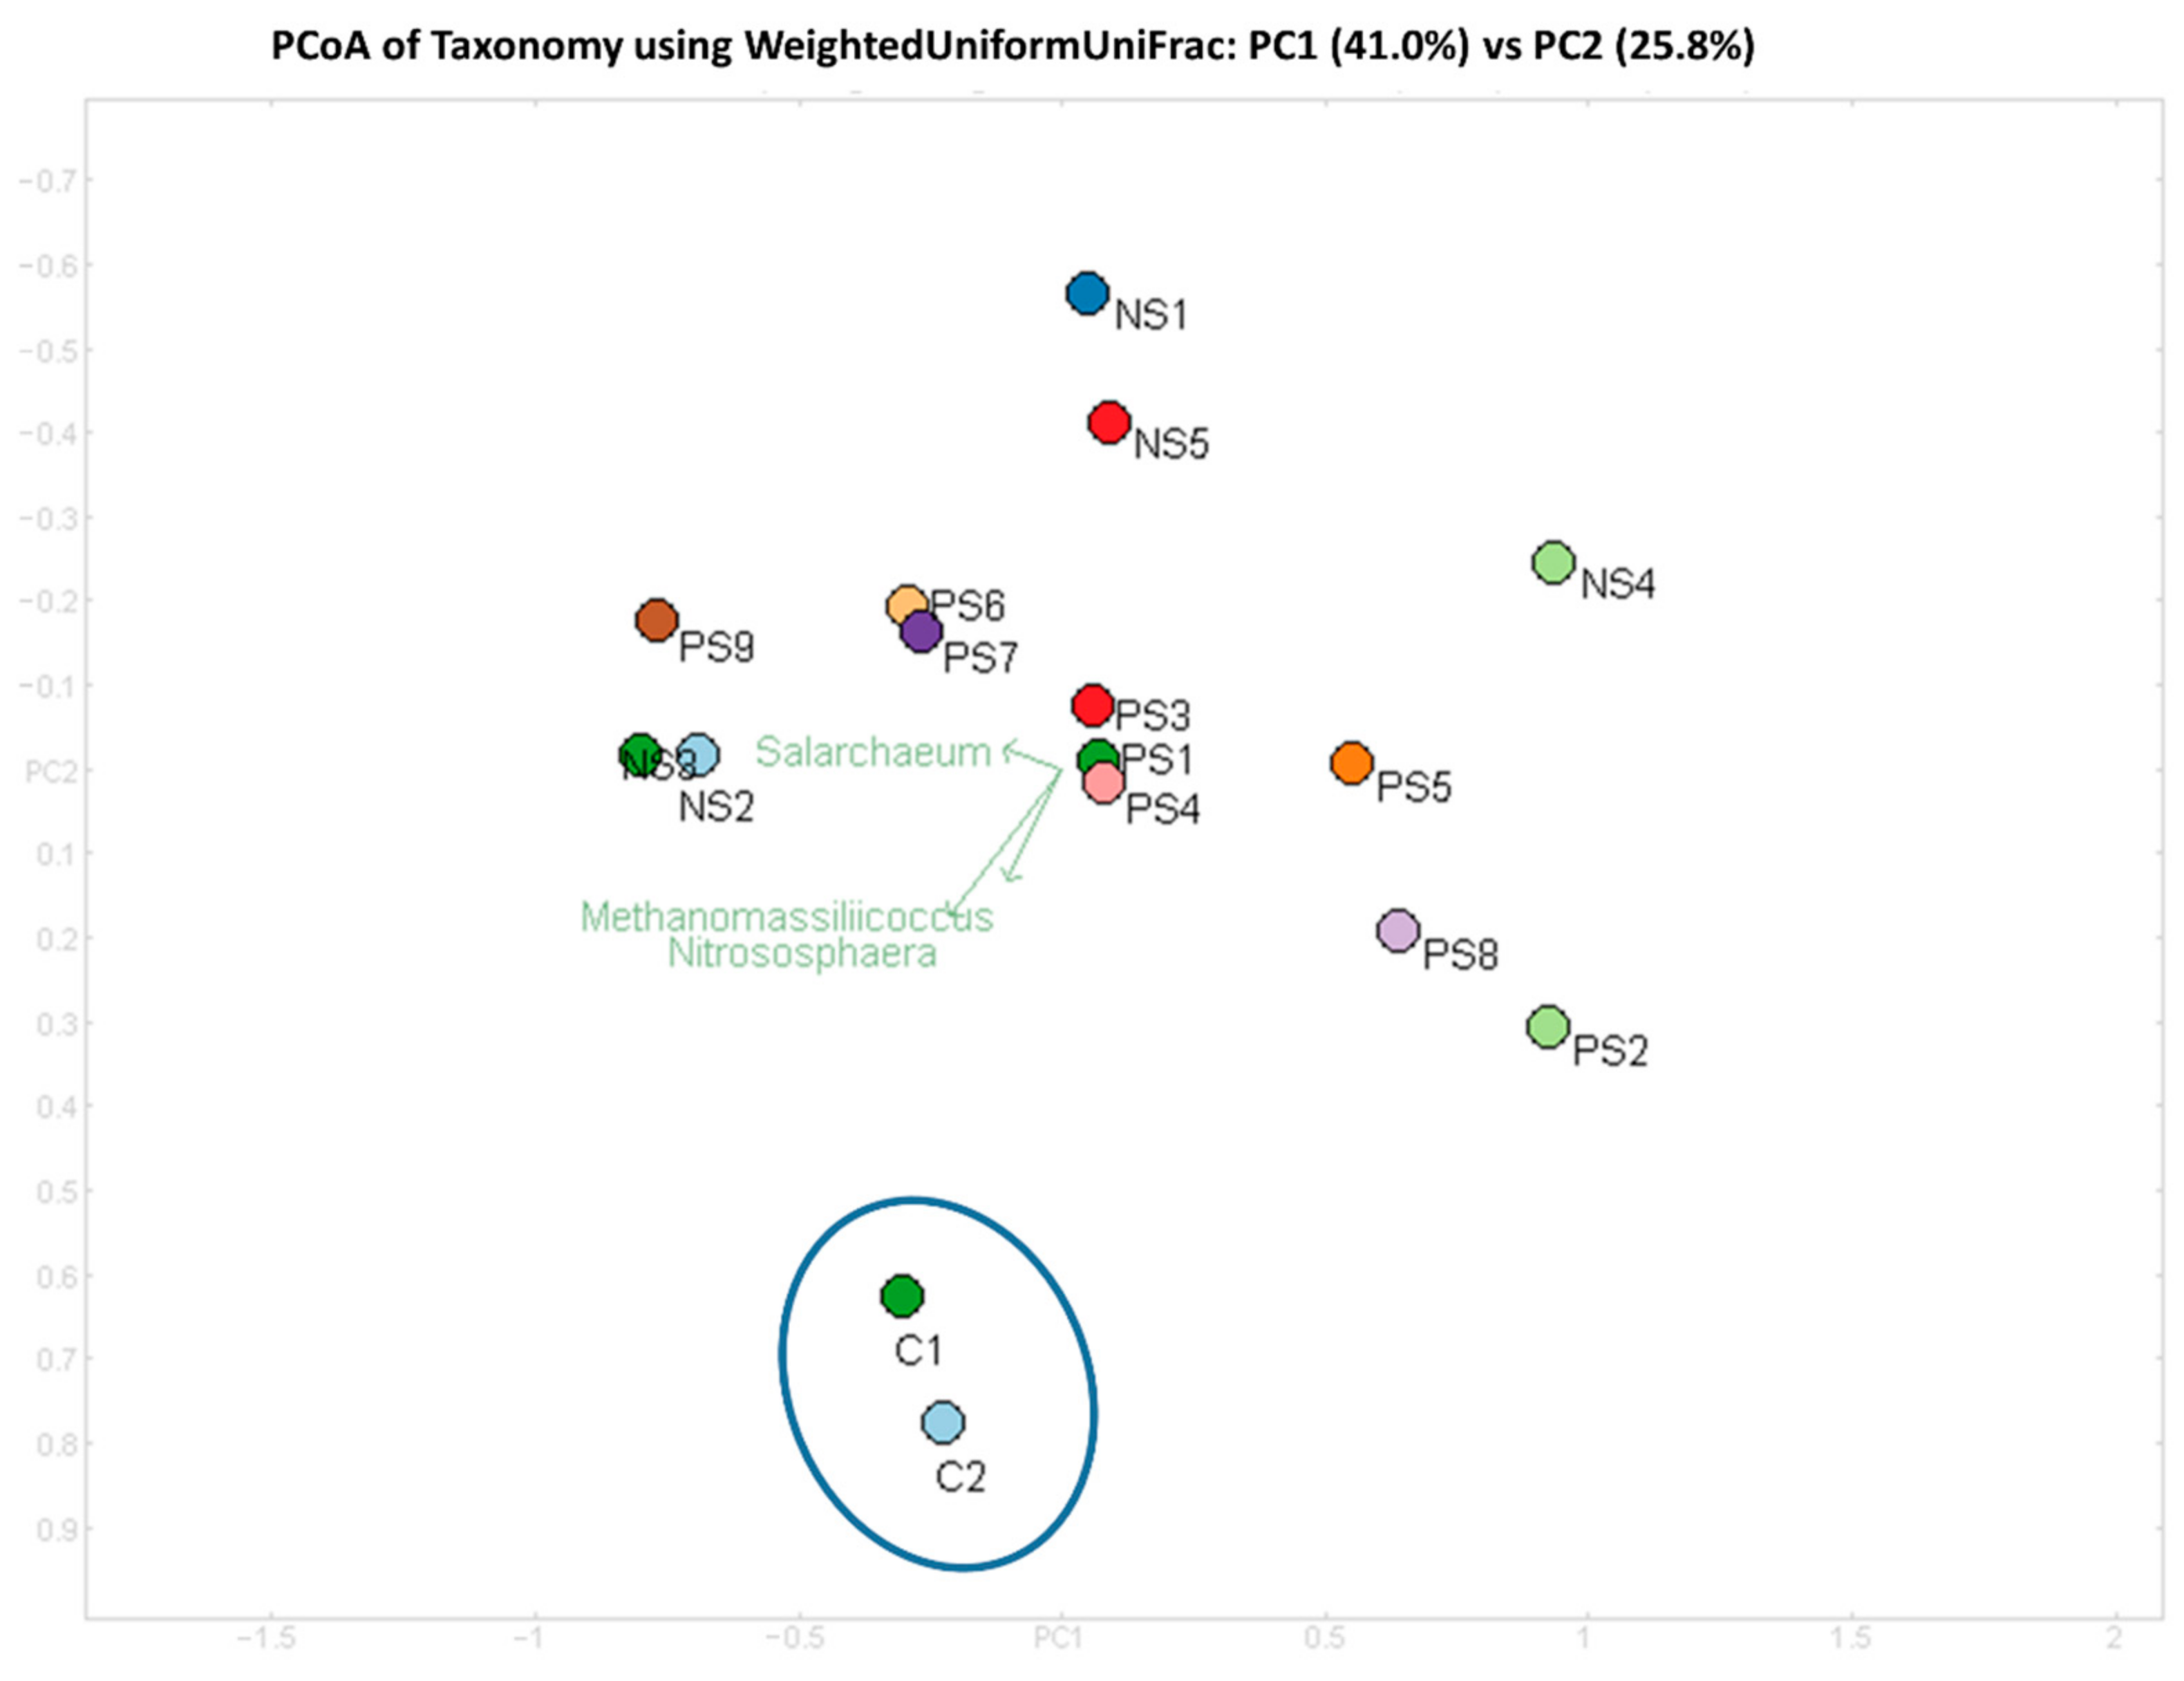
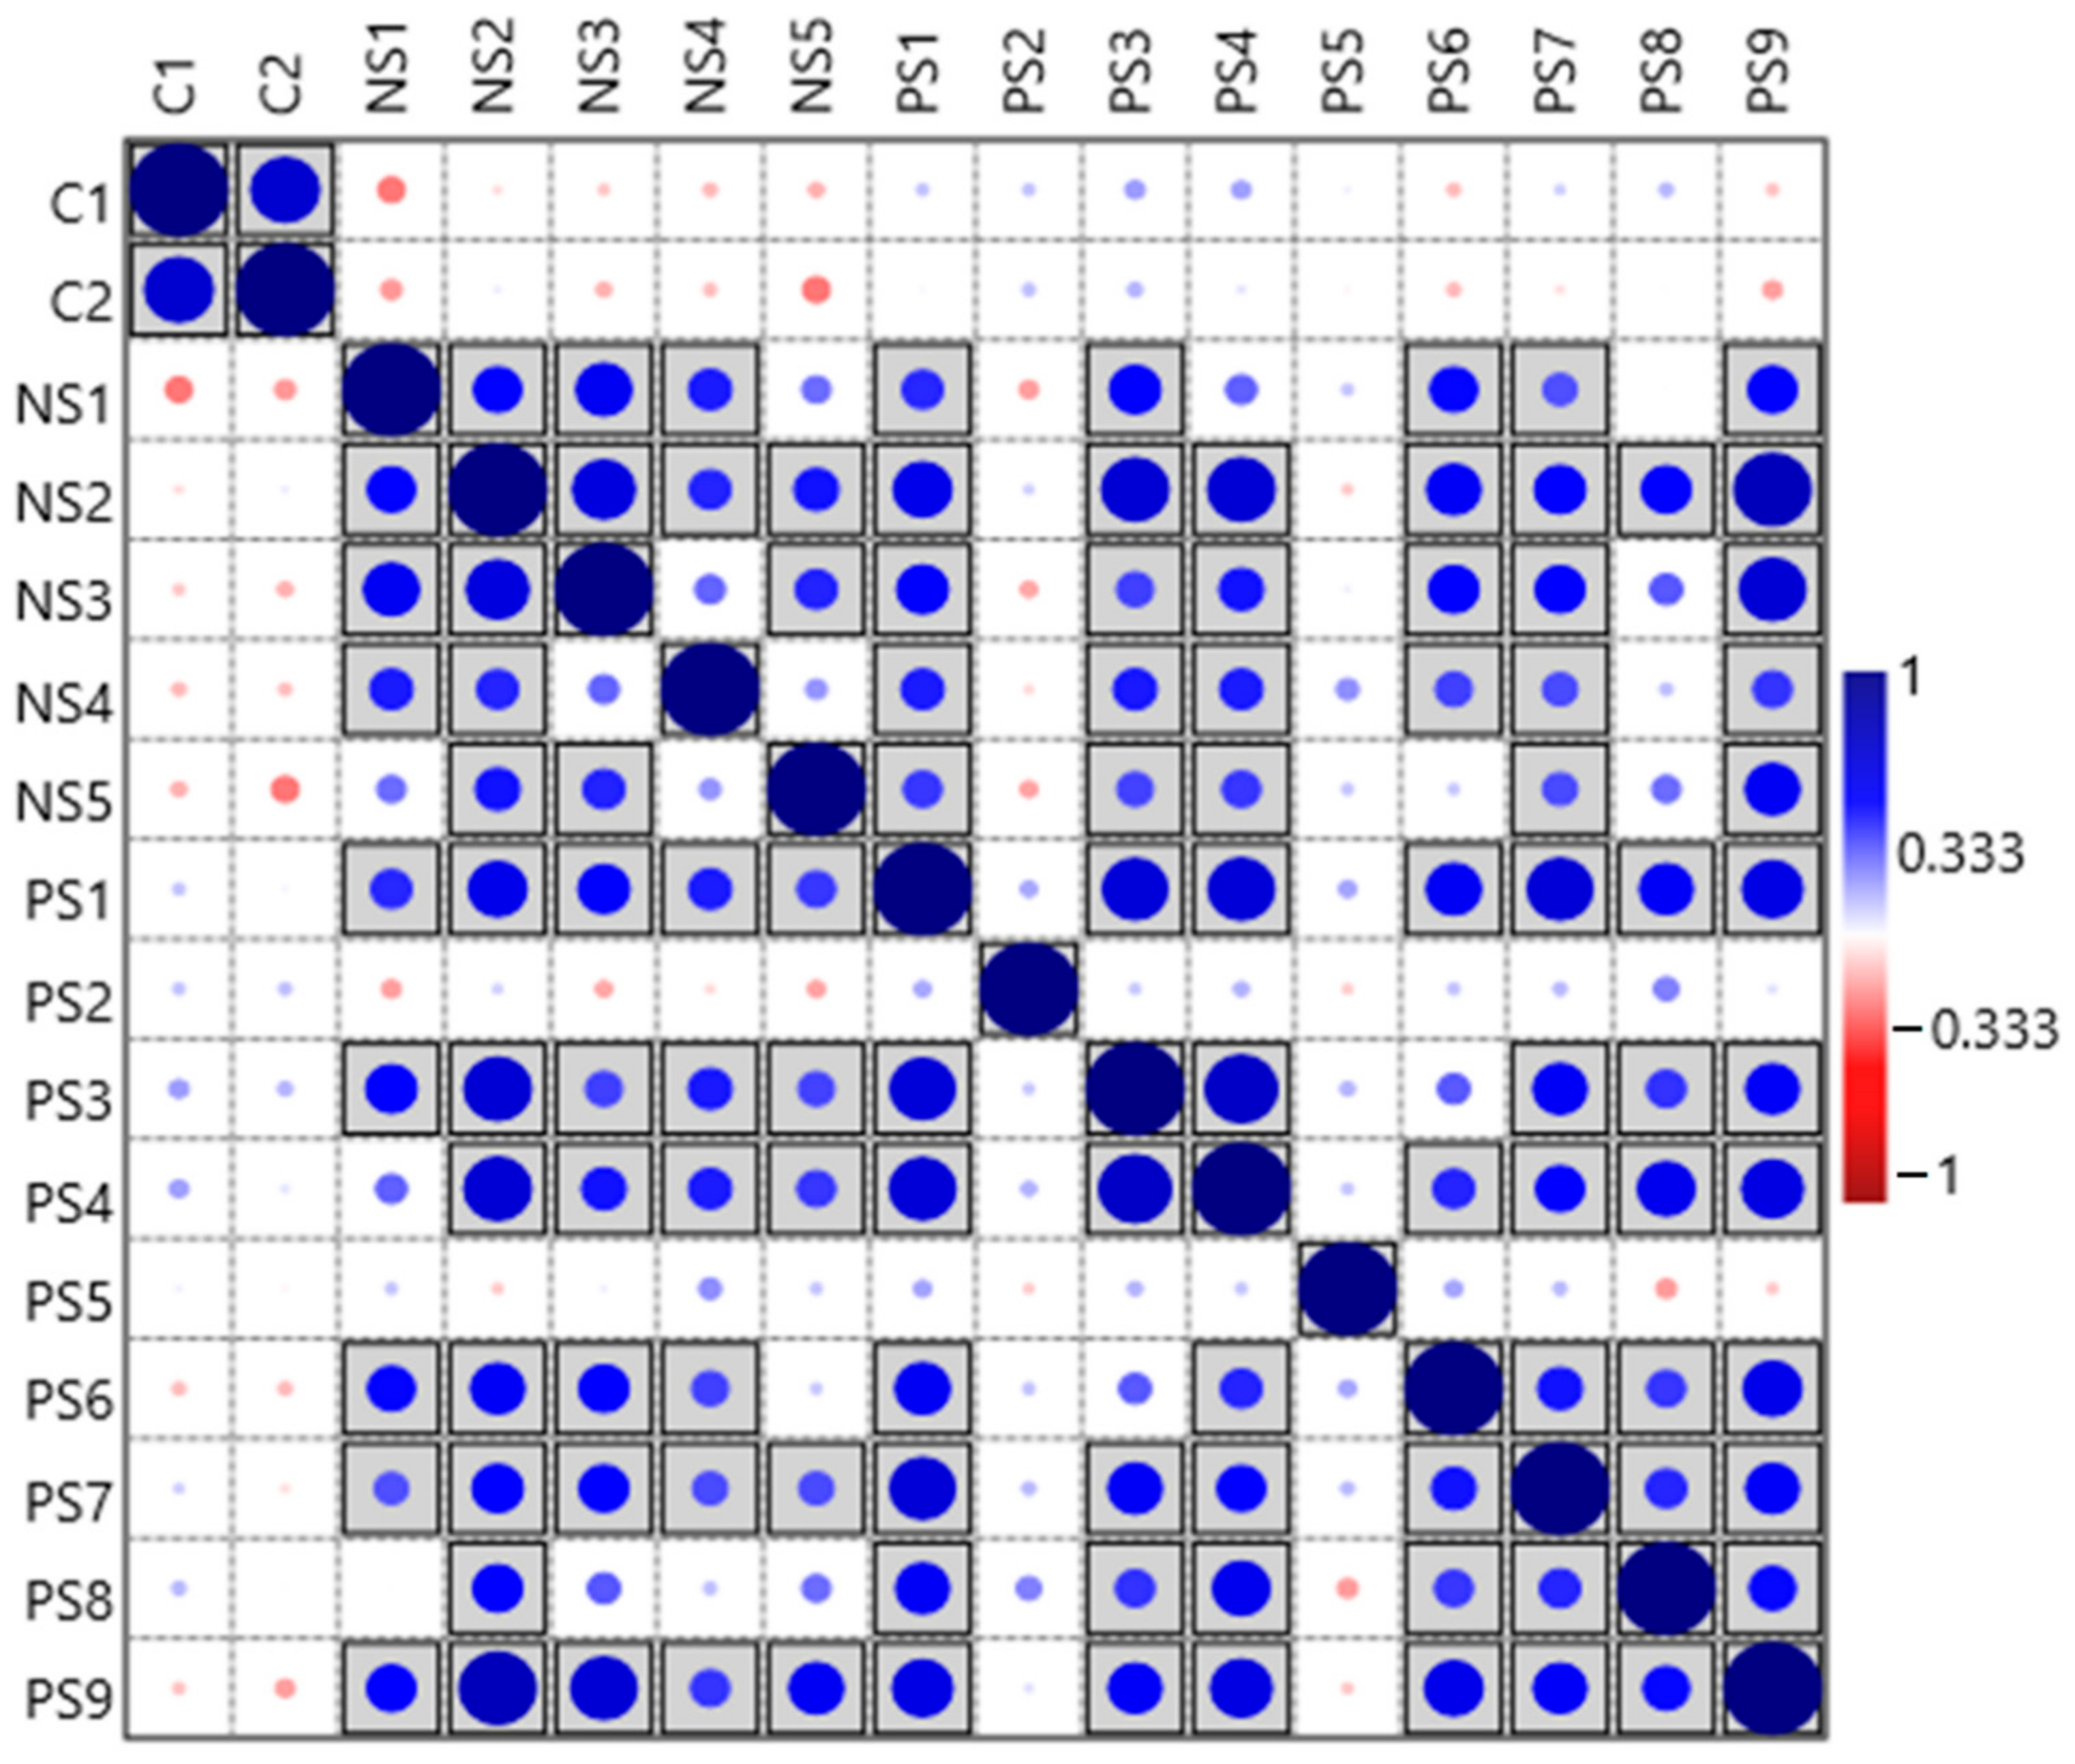
3.2. Diversity of Archaeal Community across SITE1 and SITE2

The archaeal population comprised a broad diversity of taxa across SITE1 and SITE2 samples. The alpha diversity (Shannon index) was greater on average in soil samples collected from SITE1 than SITE2 (Figure S1; Table S1). By contrast, the alpha diversity (Shannon index) was higher in control samples than SITE1 and SITE2 (Figure S1). In SITE1 maximum species diversity (Chao-1) was observed in NS3, while PS7 showed greater diversity in SITE2 samples (Table S1). The evenness of archaeal communities was considerably dissimilar in both sites, and SITE2 samples showed, on average, less evenness in archaeal population (Table S1). The ratio of total relative abundance of Archaea varied in average between the two sites and among the samples (Figure S2A,B). The total relative Archaea: Bacteria ratio in SITE2 (2.3:97.7) soil samples was lower than SITE1 (3.8:96.2) and control samples (2.9:97.05) (Figure S2A). Among SITE1 and SITE2, samples NS2 and PS9 showed highest relative abundance of Archaea (Figure S2B). The Bacteria: Archaea ratio was relatively higher in samples with higher RDX contamination (NS2, NS3), while in SITE2, samples with low HMX concentration (PS9, PS6) had high Bacteria: Archaea ratio (Figure S2B).

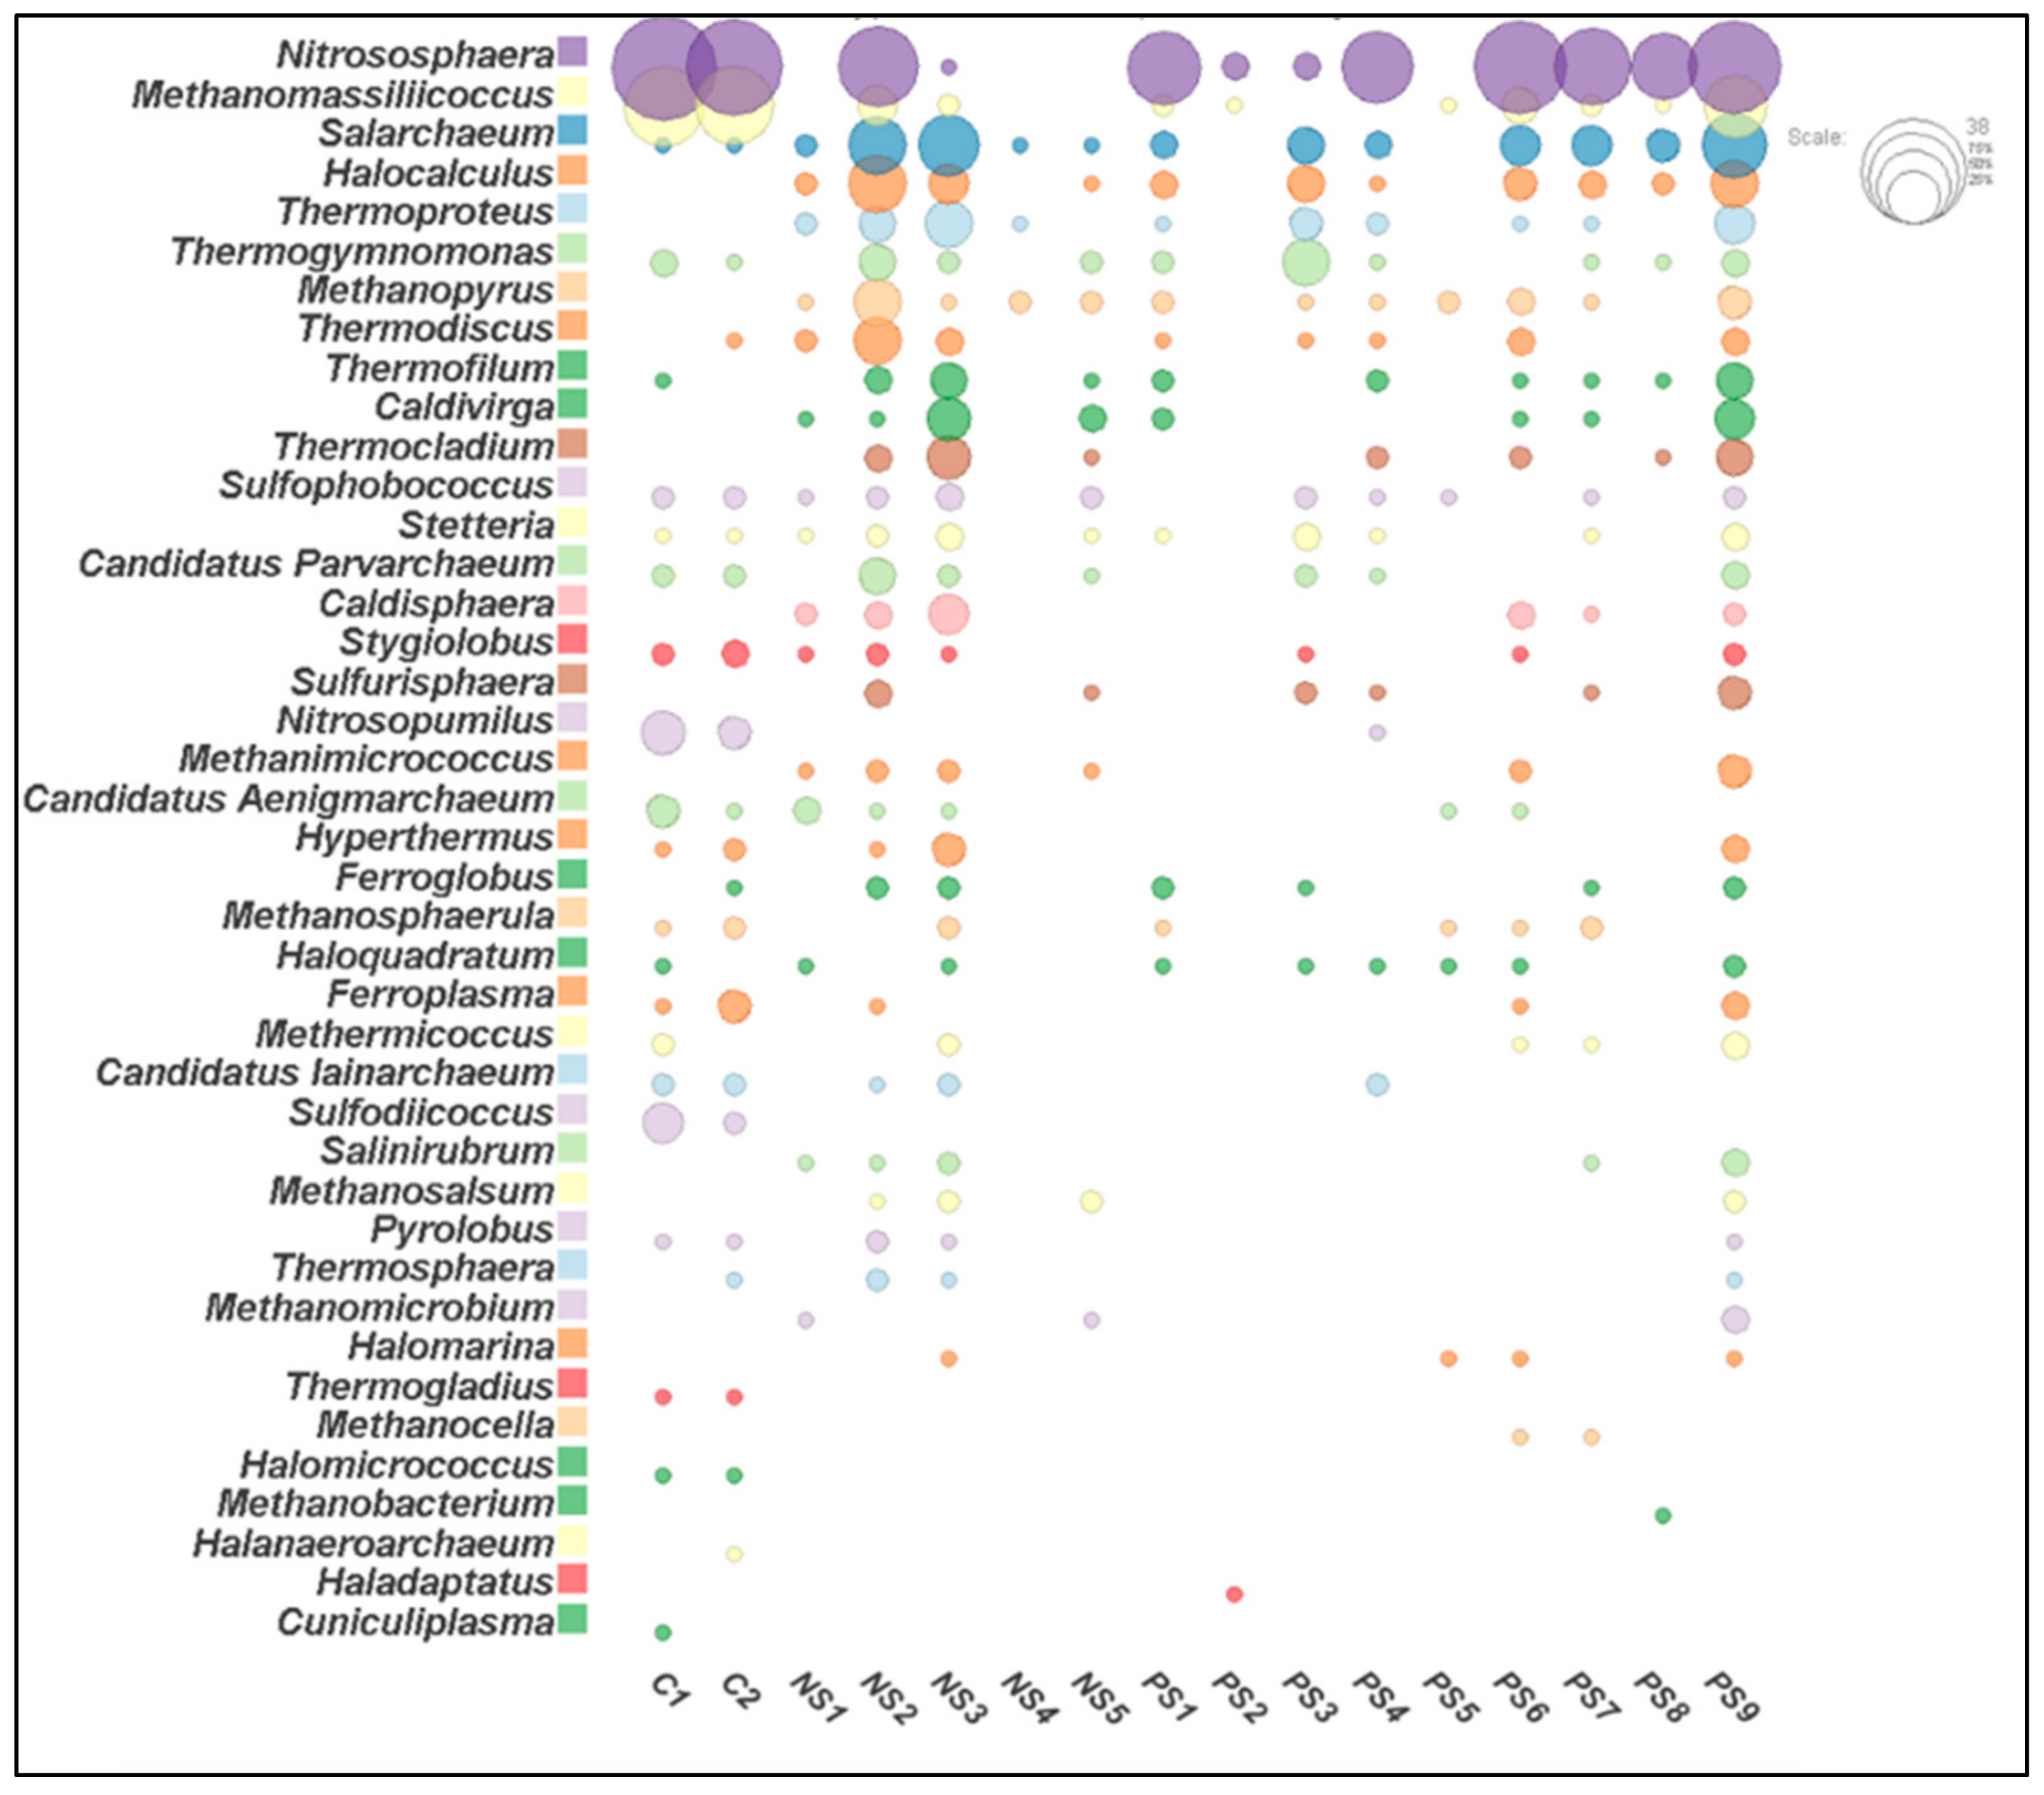
3.3. Archaeal Community Structure

For a total of 14 samples in SITE1 and SITE2, the numbers of processed reads were in the range of 71,420–1,015,934 per sample and the numbers of the total observed OTU’s were in the range of 247–6568 per sample (Table S2). The number of OTUs identified as Archaea were in the range of 7–208 per sample, and in total 981 OTUs were identified as archaeal taxa in both sites. In the control samples (C1 and C2) the number of processed reads were in the range of 866,059–962,822 per sample and the total observed OTUs classified as Archaea were 614. The archaeal communities were dominated by Euryarchaeota (~47%), Crenarchaeota (~27%), and Thaumarchaeota (~22%) followed by small proportions of (~4%) Candidatus Parvarchaeota, Candidatus Aenigmarchaeota, and Candidatus Diapherotrites in SITE1 and 2. Moreover, the relative abundance of these major archaeal groups varied among these two sites. The relative abundance of Euryarchaeota and Crenarchaeota together constituted ~91% of archaeal population in SITE1, while Euryarchaeota and Thaumarchaeota constitute ~81% of relative archaeal diversity in SITE2 samples (Figure 1). By contrast, in the control samples Thaumarchaeota, Euryarchaeota and Crenarchaeota together constitute ~91% of archaeal diversity (Figure 1).
The PCoA plots based on Weighted-Uniform-Unifrac (phylum level) showed two distinct groups between SITE1 and SITE2 samples, however, sample PS3 and PS9 group with SITE1 samples, and C1 and C2 with SITE2, and sample PS4 and PS5 were the outliers (Figure S3). At the class level Thermoprotei (~37%) was more abundant in SITE1 samples, while in SITE2 and control samples Nitrososphaeria (~36%) was more dominant (Figure S4A–C). Interestingly, class Methanobacteria was not observed in SITE1 samples and was observed at significant levels only in a single sample from SITE2 (PS8) (Figure S4A). The archaeal communities belonging to family Halobacteriaceae were most dominant in SITE1 and Nitrososphaeraceae, in SITE2 and control samples (Figure S5). The major distinction at the family level was observed in terms of lack of Methanocellaceae, Methanobacteriaceae, and Nitrosopumilaceae in SITE1 samples (Figure S5). Interestingly, in control samples Nitrosopumilaceae was found abundant (~6.7%). Meanwhile, the top three most abundant genera at both (SITE1 and 2) sites belonged to Nitrososphaeria (~21%), Salarchaeum (~9.8%), and Halocalculus (~6%) (Figure S6). These two sites were also unique in their core-biome (taxa that are present in each sample of a considered site) composition. In SITE2, 12 taxa were found to represent the core-biome composition among which Nitrososphaeria, and Haloquadratum were unique to SITE2, while in SITE1, 18 taxa were identified, among which 9 taxa (Candidatus Aenigmarchaeum, Candidatus Parvarchaeum, Caldisphaera, Caldivirga, Methanimicrococcus, Methanosalsum, Salinirubrum, Stygiolobus, and Thermocladium) were found unique (Figure S7). In control samples, 26 taxa were found to represent the core-biome composition among which 14 taxa (Candidatus Iainarchaeum, Cuniculiplasma, Ferroglobus, Ferroplasma, Halanaeroarchaeum, Halomicrococcus, Hyperthermus, Methanosphaerula, Methermicoccus, Nitrosopumilus, Pyrolobus, Sulfodiicoccus, Thermogladius and Thermosphaera) were unique to control samples (Figure S7).

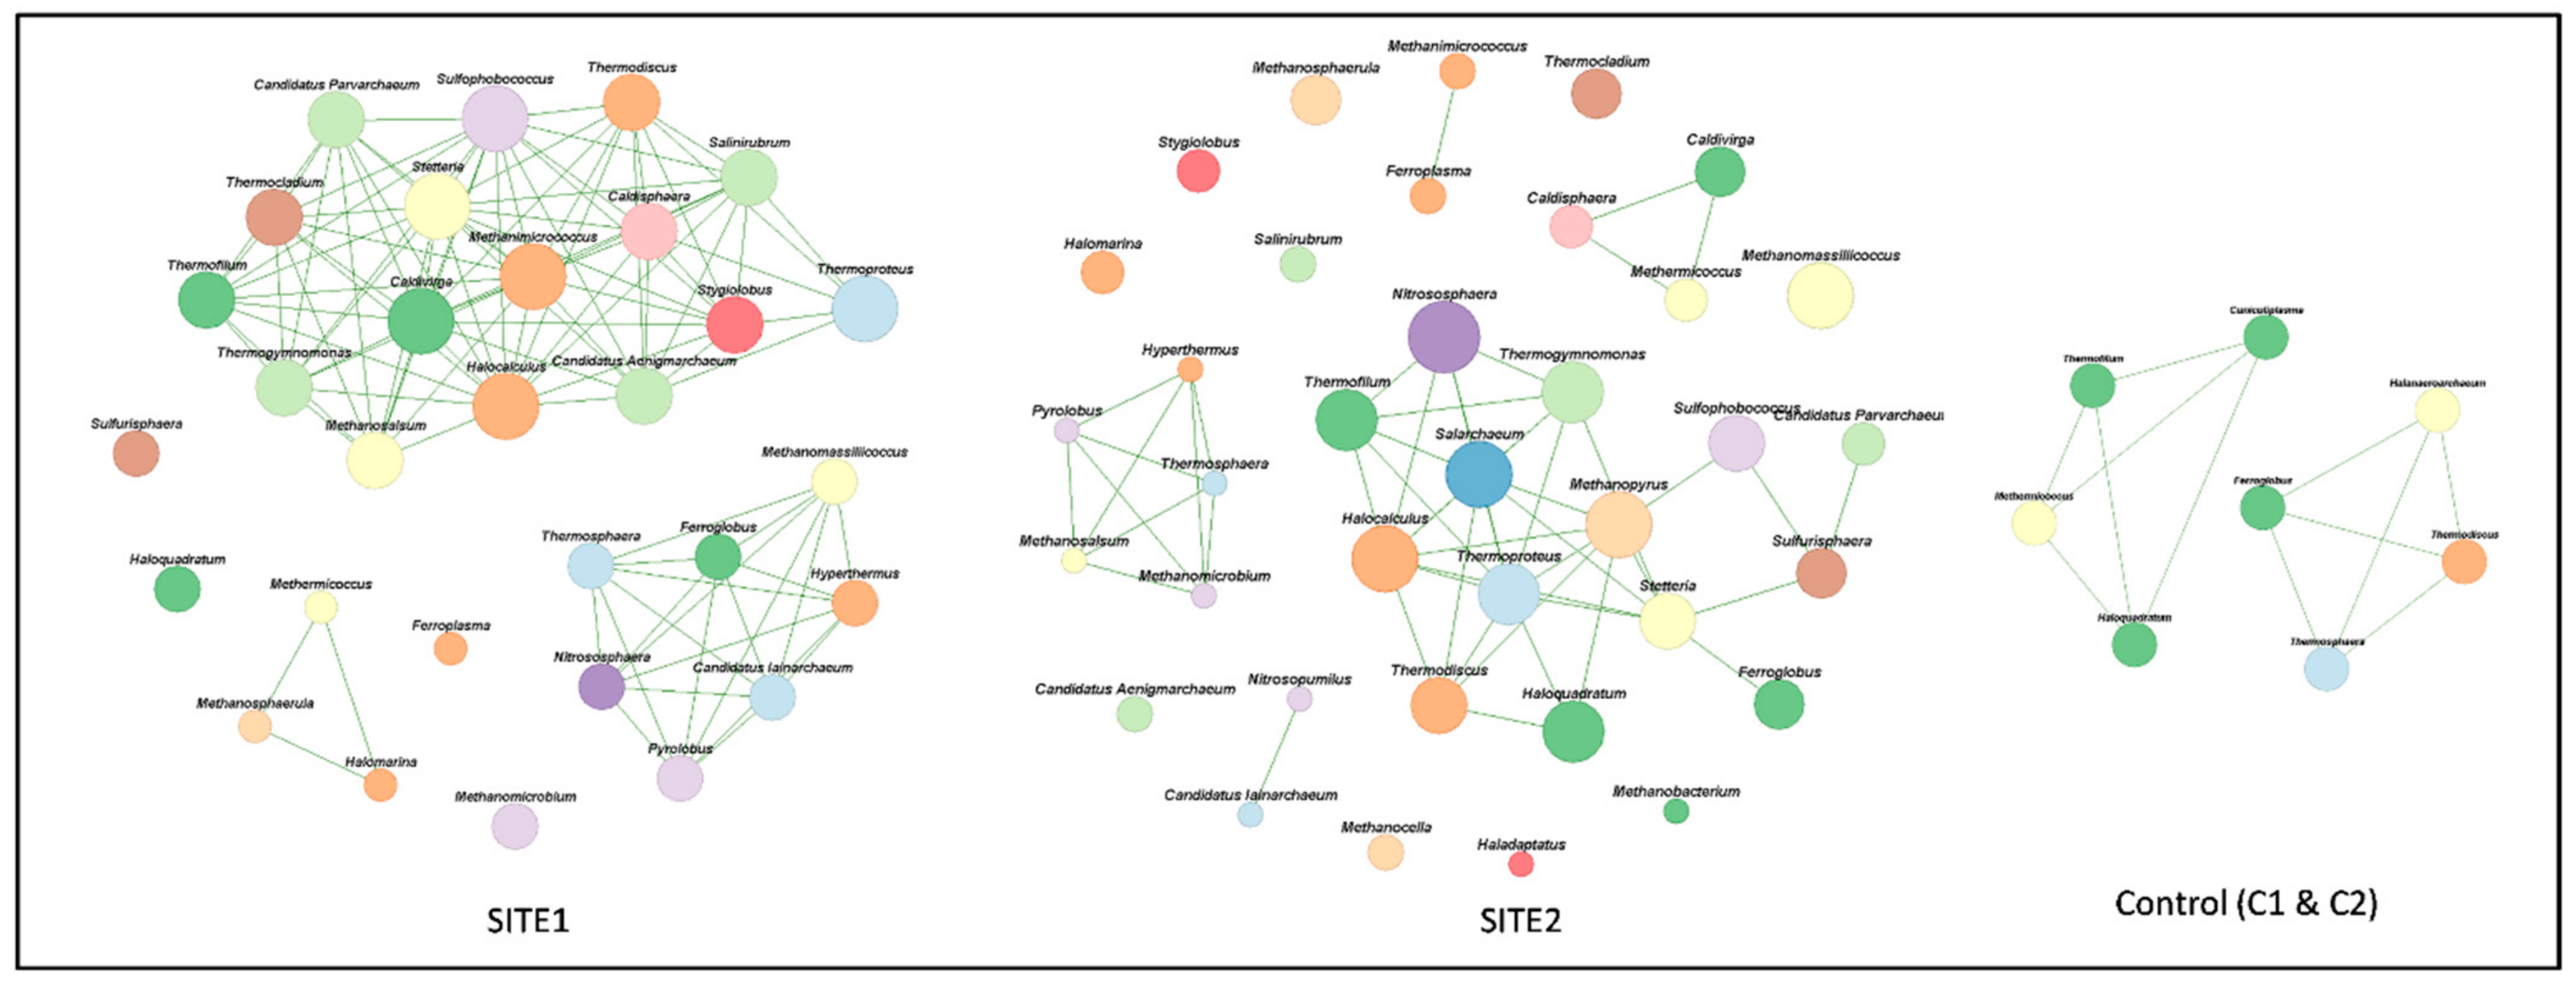
3.4. Archaeal Networks

The co-occurrence network analysis showed that the association between the archaeal communities in SITE1 and SITE2 is distinct at the genus level. Greater significant relationships were observed in SITE1 samples (26 taxa with 126 correlations) compared to SITE2 samples (26 taxa with 48 correlations) (Figure 2). Further, associations between Candidatus Aenigmarchaeum (6 associations) and other taxa were only observed in SITE1 samples. Meanwhile, the key archaeal taxa in both sites with highest number of associations belonged to Crenarchaeota and Euryarchaeota. Interestingly, two distinct groups were observed for taxa representing phylum Thaumarchaeota (4 associations) in the SITE2 samples compared to a single group in SITE1 (Figure 2). By contrast, in the control samples only 8 taxa with 12 correlations were observed.

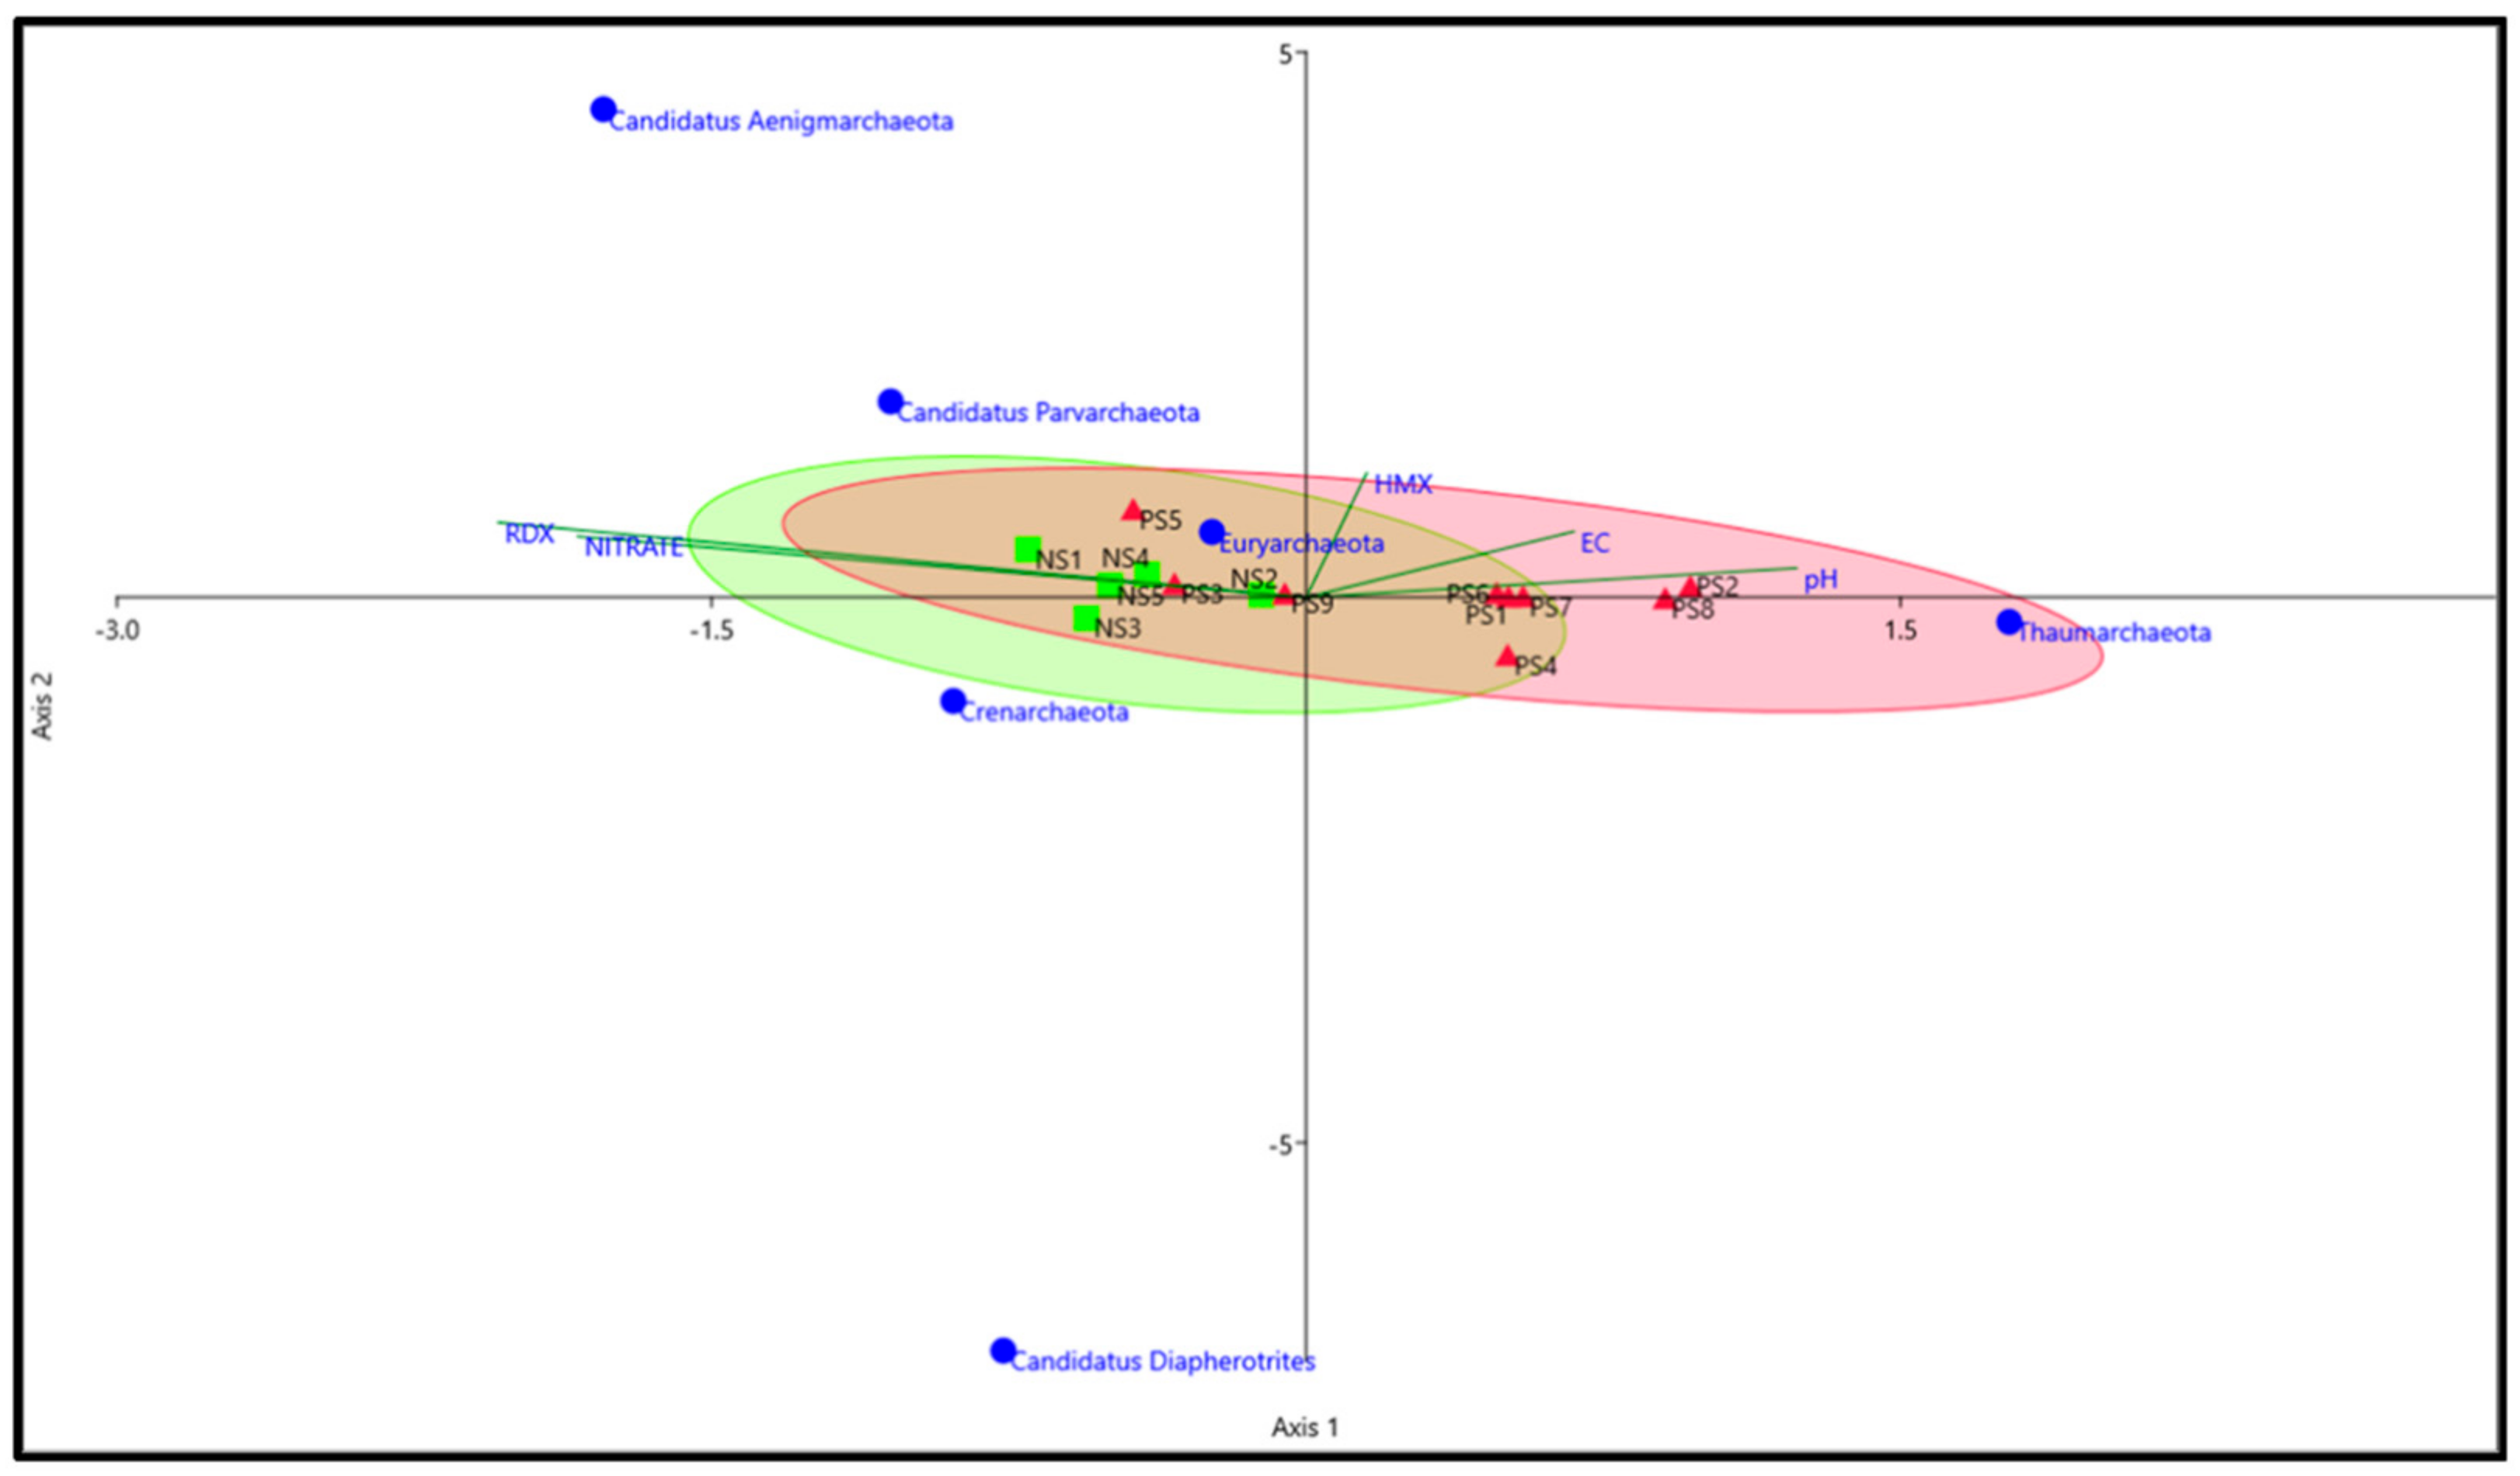
3.5. Comparison of the Archaeal Community in Explosives Contaminated and Agricultural Soil

Samples from the present study were also compared with agricultural soil samples (designated as C1 and C2) to differentiate the archaeal community structure in explosives contaminated soils versus agricultural soil samples. The archaeal community in contaminated soil samples was clearly different from agricultural soil samples and clustered separately from SITE1 SITE2 samples (Figure 3).
Moreover, the findings of ANOSIM statistics further validated a clear distinction between archaeal communities in explosives contaminated and agricultural soil samples (R = 0.8592, p = 0.0001). Further, the correlation plots (Spearman rank correlation, p ≤ 0.005) showed no significant relation between samples from two environments (Figure 4) and suggest that archaeal composition is different in contaminated and agricultural site.
When the archaeal communities were compared at genus level between the contaminated and agricultural soil samples striking differences were observed. A total of 15 genera (Caldisphaera, Caldivirga, Haladaptatus, Halocalculus, Halomarina, Methanimicrococcus, Methanobacterium, Methanocella, Methanomicrobium, Methanopyrus, Methanosalsum, Salinirubrum, Sulfurisphaera, Thermocladium, and Thermoproteus) were unique to SITE1, and SITE2 samples, while Cuniculiplasma, Halanaeroarchaeum, Halomicrococcus, Thermogladius, Sulfodiicoccus were unique to agricultural soil samples (Figure 5).

3.6. Predictive Archaeal Metabolic Profiles

The predictive metabolic profiles of archaeal communities resulted in 203 functional pathways. Metabolism of amino acid, carbohydrate, energy, translation, and membrane transport were the top five metabolic pathways in archaeal communities observed in SITE1 and SITE2. In addition, the pathways involved in the membrane transport, energy and lipid metabolism were more dominant in agricultural soil samples. Pathways responsible for the metabolism of xenobiotic biodegradation were identified in both sites (SITE 1 and SITE 2; Figure S8) and in higher proportions compared to the agricultural soil samples. However, the pathways for metabolism of xenobiotics by cytochrome P450, xylene and atrazine degradation were in greater abundance in SITE2 samples (data not shown).

4. Discussion

Physicochemical parameters and microbial factors [40,41] often govern the degradation of explosives in soil and groundwater. Several culture independent studies have revealed the bacterial community structures at various explosives contaminated sites [23,42,43,44,45], though knowledge on the role and association of archaeal communities is still rudimentary. The present work gives a broader view of archaeal community composition and their metabolic profiles at two geographically distinct explosives contaminated sites. To our knowledge, this is the first Archaea-specific metabarcoding analysis of explosive contaminated environments.
The degree of explosives contamination and other prevalent factors were highlighted by physicochemical analysis of samples. The soil samples from SITE1 and SITE2 (PS1, PS2, PS3, PS5, and PS7) showed high levels of RDX/HMX (> 24 mg/kg) contamination, which surpasses both the U.S, EPA residential soil screening levels (SSL) (5.6 mg/kg) and industrial screening level (ISL, 24 mg/kg) [46] limits. These elevated levels highlight the extent of contamination at the sites and the potential of RDX and HMX to migrate in soil by virtue of low sorption capacity [47]. Further, the nitrate-nitrogen (32–96 mg/kg) and ammoniacal nitrogen (240–875 mg/kg) were detected in high quantities in our samples that could be a result of RDX and HMX degradation by photolysis/alkaline hydrolysis or microbiological activities resulting in the release of nitrate/nitrite/ammonia in the environment [48,49,50]. Overall, the physicochemical parameters indicated extreme conditions with respect to pH and xenobiotic compounds, suitable for the success of archaeal communities [51,52].
The disparity in Bacteria: Archaea ratios and differences between SITE1 and SITE2 samples is noticeable (Figure S2A). It was interesting to note that the prokaryotic communities varied considerably within the samples (Figure S2B). Surprisingly in SITE1 samples, higher Bacteria: Archaea ratio was observed in samples with higher RDX contamination (NS2, NS3). However, in SITE2, high Bacteria: Archaea ratio was observed in samples with low HMX concentration (PS9, PS6) (Figure S2B). A possible explanation could be a relatively complex structure of HMX and lower rates of photolysis compared to RDX, thus making it recalcitrant towards utilization by the microbial population [51,53]. In addition, pH and physiologically important elements like NH4, nitrate which lead to niche separation and differentiation, may possibly result in the diverse distribution of archaeal taxa in these sites [54,55,56].
The Archaea form a significant part of the ecological niche and account for >3.36% of the Prokaryotes on Earth [1,57] (https://www.arb-silva.de/documentation/release-138/)(accessed on 2 January 2022) thus, our study focused on the prevalence of these taxa. High-throughput sequencing analysis in our study suggested that the dominant OTU’s belonged to phyla Euryarchaeota, Crenarchaeota, and Thaumarchaeota (Figure 1) in SITE1, SITE2 and control samples. Surprisingly, a clear distinction was observed at the phylum level in samples contaminated with high concentrations of RDX (≥56–166 mg/kg), i.e., SITE1 and HMX (≥6–174 mg/kg), i.e., SITE2 (Figure 1) with a possible positive correlation between concentration of RDX and abundance of Candidatus Aenigmarchaeota (Figure S9). In addition, the environmental parameters RDX and nitrate were found more linked to SITE1 samples than pH and E.C which were observed more associated to SITE2 samples (Figure S9). Though the role of Candidatus Aenigmarchaeota is not very well understood in explosives contaminated sites, previous reports on their symbiotic relations have suggest their ability to thrive in environmental stresses, such as oxidative stress and high temperature [58].
The correlation between concentration of RDX and abundance of Candidatus Aenigmarchaeota is also well supported by the CCA and NMDS plots of physicochemical parameters highlighting the abundance of Candidatus Aenigmarchaeota in samples with higher concentration of RDX and nitrate (SITE1), while members of Thaumarchaeota were more prevalent in samples with higher levels of pH and EC (SITE2) (Figure 6, Figures S9 and S10).
The predominance of Euryarchaeota in SITE1 and SIET2 samples was not surprising considering the fact that it forms about ~25% of the total archaeal population in the environmental samples [59], and members of Euryarchaeota (Methanococcus sp.) are known degraders of explosives [60]. In contrast, members of Thaumarchaeota are known for their potential to oxidize ammonia [61,62,63] and play a significant role in global nitrogen cycling [64]. Both nitrate and ammonia are important intermediates during microbial degradation of explosives [65], therefore, members of Thaumarchaeota can be of key importance in these habitats. Studies related to the role of archaeal communities in biodegradation showed more prominent abundance of Crenarchaeota in soil samples contaminated with crude oil [9] supporting a possible role of these lineages in the biodegradation of explosives.
The two most dominant classes in our samples, Thermoprotei and Nitrososphaeria (Figure S4), have not yet been reported from explosives contaminated sites. However, the available literature suggest Thermoprotei presence and role in hydrocarbon (crude oil) biotransformation while members of Nitrososphaeria (ammonia-oxidizing archaea) were reported to transform pharmaceutical products and to have a specific role in ammonia oxidation [66,67]. It is pertinent to mention here that ammoniacal nitrogen, a biodegradation product of explosives [64] was detected in high quantities in both SITE1 (875 mg/kg) and SITE2 (239 mg/kg) samples NS2 and PS2, respectively, contaminated with highest concentrations of explosives and this can possibly be linked to the abundant ammonia-oxidizing Nitrososphaeria (ammonia-oxidizing archaea) populations involved in nitrification in both sites [66,67]. Though the ammoniacal nitrogen data is not available for the control samples, it is also important to note that Nitrososphaeria are also found abundant in agricultural samples and further investigation with respect to physicochemical parameters will be important to highlight their role in agricultural soil. Our study also indicates the predominance of genera Salarchaeum and Halocalculus (both genera comprising only a single representative species) in SITE1 and SITE2 samples (Figure S6), which have not yet been isolated from contaminated sites and were previously identified only from commercial salt brines [68,69]. The prevalence of halophiles and methanogens have previously been associated with degradation of aliphatic-aromatic hydrocarbons and nitrate-driven oxidation of methane [70,71]. The available literature to date insinuates that role of these taxa in explosive contaminated habitats is still unrecognized.
The co-occurrence network analysis suggested that archaeal communities formed a complex network (26 taxa with 166 and 48 correlations respectively at SITE1 and SITE2), and the key taxa identified were mainly from Desulfurococcaceae, Halobacteriaceae, Thermoproteaceae, Methanosarcinaceae, Pyrodictiaceae, and Methermicoccaceae, while the major distinctiveness in SITE1 and SITE2 co-occurrence pattern was Nitrosopumilus and was only observed in SITE2 samples (Figure 2). Subsequently, a similar pattern was observed in the core biome profile where Nitrososphaeria was the major taxa in SITE2 and Salarchaeum in SITE1 (Figure S7). In addition, Halocalculus, Salarchaeum, and Haloquadratum within the class Halobacteria were found co-occurring with the methanogenic archaeal groups (i.e., Methanopyrus) at SITE2 (Figure 2) that are involved in nitrogen fixation and nitrogen cycling [72] and have been earlier reported to biotransform and metabolize RDX in Ovine ruminal fluid [73]. The archaeal communities have a profound effect on their proximity via interaction with biotic and abiotic environmental components, mainly detoxification, capability for exchange of metabolites and capacity for structural adaptation and has been well researched [74,75,76]. We speculate that these co-occurring taxa and core biome populations may have an imperative role in shaping the overall microbial profile in these contaminated sites.
The archaeal diversity of explosives contaminated sites was also compared with two agricultural soils [26] where two samples with no history of exposure to explosives (agricultural soil) were used for comparison. The archaeal diversity was considerably different between the agricultural soil and contaminated soil samples (Figure 5). The ANOSIM statistical analysis (R = 0.8592, p = 0.0001) suggests strong, statistically significant difference in the microbial communities of agricultural soil and contaminated samples. Further, the correlation plots (Spearman rank correlation, p ≤ 0.005) also suggested no significant relation between samples from both environments (Figure 4). The agricultural soil and contaminated sites (SITE1 and SITE2) were also found unique at the genus level, where 15 genera were found exclusive in our samples (Figure 5). Although no direct study is available to link presence of these genera in explosives contaminated sites however, some of these taxa, i.e., Halocalculus, Methanopyrus, Methanomicrococcus, Sulfurisphaera, Thermocladium, and Thermoproteus have previously been associated with hydrocarbon, organics degradation, and have been isolated from acid mine drainage, hypersaline, and acidic environments [10,65,77,78,79,80], highlighting the adaptability of these archaeal groups to thrive in such niches. In addition, all these genera were only observed in SITE1 and SITE2 samples and were not observed in the control (C1and C2) samples (Figure S6).
The predictive metabolic pathways of both the sites showed the abundance of amino acid, carbohydrate, nucleotide metabolism, membrane transport, replication and repair, xenobiotics biodegradation, metabolism of terpenoids and polyketides (Figure S8). Meanwhile, pathways for metabolism of xenobiotics by cytochrome P450, xylene, and atrazine degradation were in greater abundance in SITE2 samples. Expectedly, the pathways for xenobiotic biodegradation and metabolism could not be discerned in the control samples (Figure S8). Though at this point the archaeal community responsible for xenobiotic degradation pathways could not be directly discerned using predictive metabolic profiling, the available data indeed indicate potentially active degradation processes in explosives contaminated sites. The data from previous studies also indicate that microbial communities can sustain the environmental stress incurred by extreme conditions, to which the Archaea are evolutionarily adapted [81]. Future efforts could be directed to assess the targeted archaeal communities using meta-transcriptomics, culturable, and whole metagenome approaches and how these communities specifically respond to environmental stress.

5. Conclusions

For the present study, we analyzed and compared the archaeal distribution, diversity, network, and potential metabolic pathways in soil samples from two distinct explosives contaminated sites using Archaea-specific, 16S amplicon high-throughput sequencing. Our results suggest distinct distribution of archaeal communities at the explosives contaminated sites and indicate a substantial influence of abiotic factors on archaeal abundance. In addition, significant disparity in the pattern of archaeal communities in explosives contaminated and agricultural sites was also observed. These archaeal communities have numerous metabolic pathways and complex co-occurring networks which perhaps aids in proliferation of archaeal communities in contaminated sites and their potential degradative metabolism. Collectively, our research suggests that explosives contaminated sites have a unique archaeal community profile that require further introspection through conventional culturomics and other omics based approaches to understand their role in explosive degradation directly and through interaction with bacterial communities.

Supplementary Materials

The following supporting information can be downloaded at: https://www.mdpi.com/article/10.3390/biom12040489/s1, Figure S1: The image represent collective Shannon diversity in SITE1, SITE2 and control samples; Figure S2: (A) OTU based relative Bacteria and Archaea ratio in SITE1, SITE2 and control samples; (B) OTU based relative Bacteria and Archaea ratio between SITE1, SITE2 and control samples; Figure S3: PCoA plot of samples at phylum level using Weighted-Uniform-UniFrac distance; Figure S4: Bar chart represent class level distribution. (A) Represent SITE1; (B) SITE2; and (C) Control samples; Figure S5: Bar chart represent family level distribution. (A,B) Represent SITE1; SITE2; and (C) Control samples; Figure S6: Image represent genus level distribution in Control, SITE1 and SITE2 samples; Figure S7: Bubble plot represent core-biome composition in SITE1, SITE2 and control samples; Figure S8: Heatmap represent distribution of metabolic pathways in SITE1, SITE2, and Control (uncontaminated samples C1 & C2) based on KEGG pathways (Hierarchy level 2); Figure S9: Unconstrained PCA plot constructed using linear ordination method represents environmental variables and the archaeal taxa; Figure S10: Non-metric multidimensional scaling (NMDS) plot at phylum level; Table S1: Table represent different diversity Indices for SITE1, SITE2 and control samples; Table S2: Table represents the total number of paired end reads, processed reads, total number of OTU’s picked and the identified archaeal OTUs in SITE 1, SITE 2 and control samples.

Author Contributions

Y.P. performed the methodology, collection of data, experiments and wrote the original manuscript. Y.P. completed the preliminary bioinformatics and statistical analysis. S.M. and S.K. contributed towards overall conceptualization, supervision and project administration. S.M. was responsible for funding acquisition. All authors have read and agreed to the published version of the manuscript.

Funding

This work was supported by project number GAP0152 from the Defence research and Development Organization (DRDO), Government of India, titled “Identification of Explosives Degrading Microbes by Culture Dependent/Independent Approach.

Institutional Review Board Statement

This is IMTECH communication number 062/2021.

Data Availability Statement

The raw sequencing reads data is available at NCBI SRA database under Bioproject PRJNA391401.

Acknowledgments

We acknowledge DRDO-CFEES for assistance in sampling and preliminary physicochemical analysis of only few samples. We would also like to thank Rup Lal (University of Delhi, Department of Zoology) for his inputs in metagenomic analysis. Y.P. is a recipient of UGC fellowship.

Conflicts of Interest

The authors declare no conflict of interest.

References

  1. Offre, P.; Spang, A.; Schleper, C. Archaea in biogeochemical cycles. Annu. Rev. Microbiol. 2013, 67, 437–457. [Google Scholar] [CrossRef] [Green Version]
  2. Amann, R.I.; Ludwig, W.; Schleifer, K.H. Phylogenetic identification and in situ detection of individual microbial cells without cultivation. Microbiol. Rev. 1995, 59, 143–169. [Google Scholar] [CrossRef] [PubMed]
  3. Bomberg, M.; Montonen, L.; Münster, U.; Jurgens, G. Diversity and function of archaea in freshwater habitats. Curr. Trends Microbiol. 2008, 4, 61–89. [Google Scholar]
  4. Timonen, S.; Bomberg, M. Archaea in dry soil environments. Phytochem. Rev. 2009, 8, 505–518. [Google Scholar] [CrossRef]
  5. Schleper, C.; Nicol, G.W. Ammonia-oxidising archaea—Physiology, ecology and evolution. Adv. Microb. Physiol. 2010, 57, 1–41. [Google Scholar] [CrossRef]
  6. Chen, S.; Wang, P.; Liu, H.; Xie, W.; Wan, X.S.; Kao, S.J.; Phelps, T.J.; Zhang, C. Population dynamics of methanogens and methanotrophs along the salinity gradient in Pearl River Estuary: Implications for methane metabolism. Appl. Microbiol. Biotechnol. 2020, 104, 1331–1346. [Google Scholar] [CrossRef]
  7. Bertrand, J.C.; Almallah, M.; Acquaviva, M.; Mille, G. Biodegradation of hydrocarbons by an extremely halophilic archaeabacterium. Lett. Appl. Microbiol. 1990, 11, 260–263. [Google Scholar] [CrossRef]
  8. Mukherjee, A.; Chattopadhyay, D. Exploring environmental systems and processes through next-generation sequencing technologies: Insights into microbial response to petroleum contamination in key environments. Nucleus 2017, 60, 175–186. [Google Scholar] [CrossRef]
  9. Krzmarzick, M.J.; Taylor, D.K.; Fu, X.; McCutchan, A.L. Diversity and Niche of Archaea in Bioremediation. Archaea 2018, 2018, 3194108. [Google Scholar] [CrossRef] [Green Version]
  10. Kitts, C.L.; Cunningham, D.P.; Unkefer, P.J. Isolation of three hexahydro-1,3,5-trinitro-1,3,5-triazine-degrading species of the family Enterobacteriaceae from nitramine explosive-contaminated soil. Appl. Environ. Microbiol. 1994, 60, 4608–4711. [Google Scholar] [CrossRef] [PubMed] [Green Version]
  11. Pichtel, J. Distribution and Fate of Military Explosives and Propellants in Soil: A Review. Appl. Environ. Soil Sci. 2012, 2012, 617236. [Google Scholar] [CrossRef] [Green Version]
  12. Juhasz, A.L.; Naidu, R. Explosives: Fate, dynamics, and ecological impact in terrestrial and marine environments. Rev. Environ. Contam. Toxicol. 2007, 191, 163–215. [Google Scholar] [CrossRef]
  13. EPA 505-F-14-008. Hexahydro-1,3,5-trinitro-1,3,5 triazine (RDX) 2014, (January). Technical fact sheet-RDX. United States Environmental Protection Agency. Available online: https://www.epa.gov/sites/default/files/2014-03/documents/ffrrofactsheet_contaminant_rdx_january2014_final.pdf (accessed on 11 January 2022).
  14. Ramakrishnan, B.; Lueders, T.; Dunfield, P.F.; Conrad, R.; Friedrich, M.W. Archaeal community structures in rice soils from different geographical regions before and after initiation of methane production. FEMS Microbiol. Ecol. 2001, 37, 175–186. [Google Scholar] [CrossRef]
  15. Nicol, G.W.; Leininger, S.; Schleper, C.; Prosser, J.I. The influence of soil pH on the diversity, abundance and transcriptional activity of ammonia oxidizing archaea and bacteria. Environ. Microbiol. 2008, 10, 2966–2978. [Google Scholar] [CrossRef] [PubMed]
  16. Binks, P.R.; Nicklin, S.; Brouce, N.C. Degradation of hexahydro-I3, S-binitro-l,3, S-biazine (ROX) by Stenotrophomonas maltophilia PBI. Appl. Environ. Microbiol. 1995, 61, 1318–1322. [Google Scholar] [CrossRef] [Green Version]
  17. Bhushan, B.; Halasz, A.; Thiboutot, S.; Ampleman, G.; Hawari, J. Chemotaxis-mediated biodegradation of cyclic nitramine explosives RDX, HMX, and CL-20 by Clostridium sp. EDB2. Biochem. Biophys. Res. Commun. 2004, 316, 816–821. [Google Scholar] [CrossRef]
  18. Kanekar, P.; Dautpure, P.; Sarnaik, S. Biodegradation of nitro-explosives. Indian J. Exp. Biol. 2003, 41, 991–1001. [Google Scholar] [PubMed]
  19. Juck, D.; Driscoll, B.T.; Charles, T.C.; Greer, C.W. Effect of experimental contamination with the explosive hexahydro-1,3,5-trinitro-1,3,5-triazine on soil bacterial communities. FEMS Microbiol. Ecol. 2003, 43, 255–262. [Google Scholar] [CrossRef]
  20. Jayamani, I.; Manzella, M.P.; Cupples, A.M. RDX degradation potential in soils previously unexposed to RDX and the identification of RDX-degrading species in one agricultural soil using stable isotope probing. Water. Air. Soil Pollut. 2013, 224, 1745. [Google Scholar] [CrossRef]
  21. Jayamani, I.; Cupples, A.M. Stable isotope probing reveals the importance of Comamonas and Pseudomonadaceae in RDX degradation in samples from a Navy detonation site. Environ. Sci. Pollut. Res. Int. 2015, 22, 10340–10350. [Google Scholar] [CrossRef] [PubMed]
  22. Wang, D.; Boukhalfa, H.; Marina, O.; Ware, D.S.; Goering, T.J.; Sun, F.; Daligault, H.E.; Lo, C.C.; Vuyisich, M.; Starkenburg, S.R. Biostimulation and microbial community profiling reveal insights on RDX transformation in groundwater. Microbiol. Open 2016, 6, 423. [Google Scholar] [CrossRef] [PubMed]
  23. Lizbeth, D.S.; Natasha, D.R.; Katia, L.P.; Janet, K.H.; Zohre, K.; Arturo, M.D.; Konstantinos, T.K. Microbial Diversity in a Military Impacted Lagoon (Vieques, Puerto Rico) as Revealed by Metagenomics. bioRxiv 2018, 389379. [Google Scholar] [CrossRef]
  24. Limane, B.; Muter, O.; Juhanson, J.; Truu, M.; Truu, J.; Nolvak, H. Characterization of microbial community structure after application of different bioremediation approaches in tnt contaminated soil. In Proceedings of the 8th International Conference Environmental Engineering, Vilnius, Lithuania, 19–20 May 2011; pp. 188–194. [Google Scholar]
  25. Pal, Y.; Mayilraj, S.; Paul, M.; Schumann, P.; Krishnamurthi, S. Indiicoccus explosivorum gen. nov., sp. nov., isolated from an explosives waste contaminated site. Int. J. Syst. Evol. Microbiol. 2019, 69, 2555–2564. [Google Scholar] [CrossRef] [PubMed]
  26. Wang, H.; Bier, R.; Zgleszewski, L.; Peipoch, M.; Omondi, E.; Mukherjee, A.; Chen, F.; Zhang, C.; Kan, J. Distinct Distribution of Archaea from Soil to Freshwater to Estuary: Implications of Archaeal Composition and Function in Different Environments. Front. Microbiol. 2020, 11, 576661. [Google Scholar] [CrossRef] [PubMed]
  27. Baruah, T.C.; Barthakur, H.P. A Text Book of Soil Analysis; Vikas Publishing House Pvt Ltd.: New Delhi, India, 1997. [Google Scholar]
  28. AOAC; Cunniff, P. Official Methods of Analysis of AOAC International, 16th ed.; 4th Revision; AOAC: Rockville, MD, USA, 1998; Volume 1. [Google Scholar]
  29. US EPA. Method 8330, Nitroaromatics and Nitramines by High Performance Liquid Chromatography (HPLC) 2012, pp. 8330–8330. Available online: www.epa.gov/sw-846/pdfs/8330.pdf (accessed on 2 January 2022).
  30. Klindworth, A.; Pruesse, E.; Schweer, T.; Peplies, J.; Quast, C.; Horn, M.; Glöckner, F.O. Evaluation of general 16S ribosomal RNA gene PCR primers for classical and next-generation sequencing-based diversity studies. Nucleic Acids Res. 2013, 41. [Google Scholar] [CrossRef] [PubMed]
  31. Edgar, R.C. Search and clustering orders of magnitude faster than BLAST. Bioinformatics 2010, 26, 2460–2461. [Google Scholar] [CrossRef] [PubMed] [Green Version]
  32. Lan, Y.; Wang, Q.; Cole, J.R.; Rosen, G.L. Using the RDP classifier to predict taxonomic novelty and reduce the search space for finding novel organisms. PLoS ONE 2012, 7, e32491. [Google Scholar] [CrossRef] [Green Version]
  33. Huson, D.H.; Beier, S.; Flade, I.; Górska, A.; El-Hadidi, M.; Mitra, S.; Ruscheweyh, H.J.; Tappu, R. MEGAN Community Edition—Interactive exploration and analysis of large-scale microbiome sequencing data. PLoS Comput. Biol. 2016, 12, e1004957. [Google Scholar] [CrossRef] [PubMed] [Green Version]
  34. Hammer, O.; Harper, D.; Ryan, P. PAST: Paleontological Statistics Software Package for Education and Data Analysis. Palaeontol. Electron. 2001, 4, 1–9. [Google Scholar]
  35. Šmilauer, P.; Lepš, J. Multivariate Analysis of Ecological Data using CANOCO 5, 2nd ed.; Cambridge University Press: Cambridge, UK, 2014. [Google Scholar]
  36. Langille, M.G.I.; Zaneveld, J.; Caporaso, J.G.; McDonald, D.; Knights, D.; Reyes, J.A.; Clemente, J.C.; Burkepile, D.E.; Thurber, R.L.V.; Knight, R.; et al. Predictive functional profiling of microbial communities using 16S rRNA marker gene sequences. Nat. Biotech. 2013, 31, 814–821. [Google Scholar] [CrossRef]
  37. Caporaso, J.G.; Kuczynski, J.; Stombaugh, J.; Bittinger, K.; Bushman, F.D.; Costello, E.K.; Fierer, N.; Peña, A.G.; Goodrich, J.K.; Gordon, J.I.; et al. QIIME allows analysis of high-throughput community sequencing data. Nat. Methods 2010, 7, 335–336. [Google Scholar] [CrossRef] [Green Version]
  38. Afgan, E.; Baker, D.; Batut, B.; van den Beek, M.; Bouvier, D.; Cech, M.; Chilton, J.; Clements, D.; Coraor, N.; Grüning, B.A.; et al. The Galaxy platform for accessible, reproducible and collaborative biomedical analyses: 2018 update. Nucleic Acids Res. 2018, 46, W537–W544. [Google Scholar] [CrossRef] [PubMed] [Green Version]
  39. Parks, D.H.; Tyson, G.W.; Hugenholtz, P.; Beiko, R.G. STAMP: Statistical analysis of taxonomic and functional profiles. Bioinformatics 2014, 30, 3123–3124. [Google Scholar] [CrossRef] [Green Version]
  40. Fuller, M.E.; McClay, K.; Hawari, J.; Paquet, L.; Malone, T.E.; Fox, B.G.; Steffan, R.J. Transformation of RDX and other energetic compounds by xenobiotic reductases XenA and XenB. Appl. Microbiol. Biotechnol. 2009, 84, 535–544. [Google Scholar] [CrossRef] [PubMed] [Green Version]
  41. Fuller, M.E.; Perreault, N.; Hawari, J. Microaerophilic Degradation of Hexahydro-1,3,5-Trinitro-1,3,5-Triazine (RDX) by Three Rhodococcus Strains. Lett. Appl. Microbiol. 2010, 51, 313–318. [Google Scholar] [CrossRef] [PubMed] [Green Version]
  42. Cupples, A.M. RDX degrading microbial communities and the prediction of microorganisms responsible for RDX bioremediation. Int. Biodeterior. Biodegrad. 2013, 85, 260–270. [Google Scholar] [CrossRef]
  43. Jayamani, I.; Cupples, A.M. A comparative study of microbial communities in four soil slurries capable of RDX degradation using illumina sequencing. Biodegradation 2015, 26, 247–257. [Google Scholar] [CrossRef]
  44. Eberly, J.O.; Indest, K.J.; Hancock, D.E.; Jung, C.M.; Crocker, F.H. Metagenomic analysis of denitrifying wastewater enrichment cultures able to transform the explosive, 3-nitro-1,2,4-triazol-5-one (NTO). J. Ind. Microbiol. Biotechnol. 2016, 43, 795–805. [Google Scholar] [CrossRef]
  45. Fuller, M.E.; Koster van Groos, P.G.; Jarrett, M.; Kucharzyk, K.H.; Minard-Smith, A.; Heraty, L.J.; Sturchio, N.C. Application of a multiple lines of evidence approach to document natural attenuation of hexahydro-1,3,5-trinitro-1,3,5-triazine (RDX) in groundwater. Chemosphere 2020, 250, 126210. [Google Scholar] [CrossRef] [PubMed]
  46. US EPA. IRIS Toxicological Review of Hexahydro-1,3,5-Trinitro-1,3,5-Triazine (RDX); (Public Comment Draft); U.S. Environmental Protection Agency: Washington, DC, USA, 2015; EPA/635/R-15/034a. [Google Scholar]
  47. Pennington, J.C.; Bowen, R.; Brannon, J.M.; Zakikhani, M.; Harrelson, D.W.; Gunnison, D.; Mahannah, J.; Clarke, J.; Jenkins, T.F.; Gnewuch, S. Draft Protocol for Evaluating, Selecting, and Implementing Monitored Natural Attenuation at Explosives-Contaminated Sites; Tech. Rep. EL-99-10 U.S. Army Corps Eng.; Engineer Research and Development Center: Vicksburg, MS, USA, 1999. [Google Scholar]
  48. Glover, D.J.; Hoffsommer, J.C. Photolysis of RDX in Aqueous Solution with and Without Ozone; Rep. No. NSWC/WOL-TR-78-175 (AD-A080195); Naval Surface Warfare Center-White Oak: Silver Spring, MD, USA, 1979. [Google Scholar]
  49. Balakrishnan, V.K.; Halasz, A.; Hawari, J. Alkaline hydrolysis of the cyclic nitramine explosives RDX, HMX, and CL-20: New insights into degradation pathways obtained by the observation of novel intermediates. Environ. Sci. Technol. 2003, 37, 1838–1843. [Google Scholar] [CrossRef] [PubMed]
  50. Kalderis, D.; Juhasz, A.L.; Boopathy, R.; Comfort, S. Soils contaminated with explosives: Environmental fate and evaluation of state-of-the-art remediation processes (IUPAC technical report). Pure Appl. Chem. 2011, 83, 1407–1484. [Google Scholar] [CrossRef]
  51. Meyers, S.K.; Deng, S.; Basta, N.T.; Clarkson, W.W.; Wilber, G.G. Long-term explosive contamination in soil: Effects on soil microbial community and bioremediation. Soil Sediment Contam. 2007, 16, 61–77. [Google Scholar] [CrossRef]
  52. Mayer, F.; Müller, V. Adaptations of anaerobic archaea to life under extreme energy limitation. FEMS Microbiol. Rev. 2014, 38, 449–472. [Google Scholar] [CrossRef] [Green Version]
  53. Abadin, H.; Smith, C.; Ingerman, L.; Llados, F.T.; Barber, L.E.; Plewak, D.; Diamond, G.L. Toxicological Profile RDX; Agency for Toxic Substances and Disease Registry (US): Atlanta, GA, USA, 2012. [Google Scholar]
  54. Biller, S.J.; Mosier, A.C.; Wells, G.F.; Francis, C.A. Global biodiversity of aquatic ammonia-oxidizing archaea is partitioned by habitat. Front. Microbiol. 2012, 3, 252. [Google Scholar] [CrossRef] [Green Version]
  55. Reichenberger, E.R.; Rosen, G.; Hershberg, U.; Hershberg, R. Prokaryotic nucleotide composition is shaped by both phylogeny and the environment. Genome Biol. Evol. 2015, 7, 1380–1389. [Google Scholar] [CrossRef] [Green Version]
  56. Alves, R.J.E.; Minh, B.Q.; Urich, T.; Von Haeseler, A.; Schleper, C. Unifying the global phylogeny and environmental distribution of ammonia-oxidising archaea based on amoA genes. Nat. Commun. 2018, 9, 1517. [Google Scholar] [CrossRef] [Green Version]
  57. Louca, S.; Mazel, F.; Doebeli, M.; Parfrey, L.W. A census-based estimate of Earth’s bacterial and archaeal diversity. PLoS Biol. 2019, 17, e3000106. [Google Scholar] [CrossRef] [PubMed] [Green Version]
  58. Li, Y.X.; Rao, Y.Z.; Qi, Y.L.; Qu, Y.N.; Chen, Y.T.; Jiao, J.Y.; Shu, W.S.; Jiang, H.; Hedlund, B.P.; Hua, Z.S.; et al. Deciphering Symbiotic Interactions of ”Candidatus Aenigmarchaeota” with Inferred Horizontal Gene Transfers and Co-occurrence Networks. mSystems 2021, 6, e0060621. [Google Scholar] [CrossRef]
  59. Porat, I.; Vishnivetskaya, T.A.; Mosher, J.J.; Brandt, C.C.; Yang, Z.K.; Brooks, S.C.; Liang, L.; Drake, M.M.; Podar, M.; Brown, S.D.; et al. Characterization of archaeal community in contaminated and uncontaminated surface stream sediments. Microb. Ecol. 2010, 60, 784–795. [Google Scholar] [CrossRef] [Green Version]
  60. Boopathy, R.; Kulpa, C.F. Biotransformation of 2,4,6-trinitrotoluene (TNT) by a Methanococcus sp. (strain B) isolated from a lake sediment. Can. J. Microbiol. 1994, 40, 273–278. [Google Scholar] [CrossRef]
  61. Pester, M.; Schleper, C.; Wagner, M. The Thaumarchaeota: An emerging view of their phylogeny and ecophysiology. Curr. Opin. Microbiol. 2011, 14, 300–306. [Google Scholar] [CrossRef] [Green Version]
  62. Flemming, H.C.; Wuertz, S. Bacteria and archaea on Earth and their abundance in biofilms. Nat. Rev. Microbiol. 2019, 17, 247–260. [Google Scholar] [CrossRef]
  63. Gubry-Rangin, C.; Kratsch, C.; Williams, T.A.; McHardy, A.C.; Embley, T.M.; Prosser, J.I.; Macqueen, D.J. Coupling of diversification and pH adaptation during the evolution of terrestrial Thaumarchaeota. Proc. Natl. Acad. Sci. USA 2015, 112, 9370–9375. [Google Scholar] [CrossRef] [PubMed] [Green Version]
  64. Khan, M.I.; Lee, J.; Park, J. Microbial degradation and toxicity of hexahydro-1,3,5-trinitro-1,3,5-triazine. J. Microbiol. Biotechnol. 2012, 22, 1311–1323. [Google Scholar] [CrossRef] [Green Version]
  65. Das, R.; Kazy, S.K. Microbial diversity, community composition and metabolic potential in hydrocarbon contaminated oily sludge: Prospects for in situ bioremediation. Environ. Sci. Pollut. Res. Int. 2014, 21, 7369–7389. [Google Scholar] [CrossRef]
  66. Men, Y.; Han, P.; Helbling, D.E.; Jehmlich, N.; Herbold, C.; Gulde, R.; Onnis-Hayden, A.; Gu, A.Z.; Johnson, D.R.; Wagner, M.; et al. Biotransformation of two pharmaceuticals by the ammonia-oxidizing archaeon Nitrososphaeria gargensis. Environ. Sci. Technol. 2016, 50, 4682–4692. [Google Scholar] [CrossRef] [PubMed] [Green Version]
  67. Cebron, A.; Berthe, T.; Garnier, J. Nitrification and nitrifying bacteria in the Lower Seine River and Estuary (France). Appl. Env. Microbiol. 2003, 69, 7091–7100. [Google Scholar] [CrossRef] [PubMed] [Green Version]
  68. Shimane, Y.; Hatada, Y.; Minegishi, H.; Echigo, A.; Nagaoka, S.; Miyazaki, M.; Ohta, Y.; Maruyama, T.; Usami, R.; Grant, W.D.; et al. Salarchaeum japonicum gen. nov., sp. nov., an aerobic, extremely halophilic member of the Archaea isolated from commercial salt. Int. J. Syst. Evol. Microbiol. 2011, 61, 2266–2270. [Google Scholar] [CrossRef] [PubMed]
  69. Anton, B.P.; DasSarma, P.; Martinez, F.L.; DasSarma, S.L.; Al Madadha, M.; Roberts, R.J.; DasSarma, S. Genome Sequence of Salarchaeum sp. Strain JOR-1, an Extremely Halophilic Archaeon from the Dead Sea. Microbiol. Resour. Announc. 2020, 9, e01505-19. [Google Scholar] [CrossRef] [PubMed] [Green Version]
  70. Tapilatu, Y.H.; Grossi, V.; Acquaviva, M.; Militon, C.; Bertrand, J.C.; Cuny, P. Isolation of hydrocarbon-degrading extremely halophilic Archaea from an uncontaminated hypersaline pond (Camargue, France). Extremophiles 2010, 14, 225–231. [Google Scholar] [CrossRef]
  71. An, B.A.; Shen, Y.; Voordouw, J.; Voordouw, G. Halophilic methylotrophic methanogens may contribute to the high ammonium concentrations found in shale oil and shale gas reservoirs. Front. Energy Res. 2019, 7, 23. [Google Scholar] [CrossRef]
  72. Bae, H.S.; Morrison, E.; Chanton, J.P.; Ogram, A. Methanogens are major contributors to nitrogen fixation in soils of the Florida Everglades. Appl. Environ. Microbiol. 2018, 84, e02222-17. [Google Scholar] [CrossRef] [PubMed] [Green Version]
  73. Eaton, H.L.; De Lorme, M.; Chaney, R.L.; Craig, A.M. Ovine ruminal microbes are capable of biotransforming hexahydro-1,3,5-trinitro-1,3,5-triazine (RDX). Microb. Ecol. 2011, 62, 274–286. [Google Scholar] [CrossRef] [PubMed]
  74. Morris, B.E.L.; Henneberger, R.; Huber, H.; Moissl-Eichinger, C. Microbial syntrophy: Interaction for the common good. FEMS Microbiol. Rev. 2013, 37, 384–406. [Google Scholar] [CrossRef]
  75. Wegener, G.; Krukenberg, V.; Riedel, D.; Tegetmeyer, H.E.; Boetius, A. Intercellular wiring enables electron transfer between methanotrophic archaea and bacteria. Nature 2015, 526, 587–590. [Google Scholar] [CrossRef]
  76. Moissl-Eichinger, C.; Pausan, M.; Taffner, J.; Berg, G.; Bang, C.; Schmitz, R.A. Archaea are interactive components of complex microbiomes. Trends Microbiol. 2018, 26, 70–85. [Google Scholar] [CrossRef]
  77. Itoh, T.; Suzuki, K.; Nakase, T. Thermocladium modestius gen. nov., sp. nov., a new genus of rod-shaped, extremely thermophilic Crenarchaeote. Int. J. Syst. Bacteriol. 1998, 48, 879–887. [Google Scholar] [CrossRef] [Green Version]
  78. Muyzer, G.; Stams, A.J.M. The ecology and biotechnology of sulphate-reducing bacteria. Nat. Rev. Microbiol. 2008, 6, 441–454. [Google Scholar] [CrossRef]
  79. Cuadros-Orellana, S.; Pohlschröder, M.; Grossman, J.; Durrant, L.R. Biodegradation of aromatic compounds by a halophilic archaeon isolated from the dead sea. Chem. Eng. Trans. 2012, 27, 13–18. [Google Scholar] [CrossRef]
  80. Enzmann, F.; Mayer, F.; Rother, M.; Holtmann, D. Methanogens: Biochemical background and biotechnological applications. AMB Express 2018, 8, 1. [Google Scholar] [CrossRef]
  81. Merino, N.; Aronson, H.S.; Bojanova, D.P.; Feyhl-Buska, J.; Wong, M.L.; Zhang, S.; Giovannelli, D. Living at the Extremes: Extremophiles and the Limits of Life in a Planetary Context. Front. Microbiol. 2019, 10, 780. [Google Scholar] [CrossRef] [Green Version]
Figure 1. Dual bar chart represent phylum level distribution with levels of HMX, RDX and nitrate in samples collected from both sites. (*) represents data obtained from [26]. (--) represents data not available.
Biomolecules 12 00489 g001
Figure 2. Co-occurrence networks from SITE1, SITE2 and agricultural soil samples. The networks were based on archaeal OTUs. Green lines indicate positive co-occurrence. Image was constructed in MEGAN [33] using Jaccard correlation coefficient with an edge threshold of 70%.
Biomolecules 12 00489 g002
Figure 3. PCoA of samples at genus level using Weighted-Uniform-UniFrac distance. Triplot arrow represent the projection of genera for respective samples. Image was constructed in MEGAN [33].
Biomolecules 12 00489 g003
Figure 4. Correlation plot between samples from explosives contaminated (SITE1 and SITE2) and agricultural soil (C1, C2) at genus level. Correlation plot was based on Spearman rank correlation. Grey highlighted squares represent significance, p ≤ 0.005. Filled circles (size) represent correlation between the samples. Image was constructed in PAST software [30].
Biomolecules 12 00489 g004
Figure 5. Bubble plot representing genus level distribution in control (C1, C2) and explosives contaminated (NS1-PS9) samples. The scale represents the percentage at the genus level. Image was constructed in MEGAN [29] software.
Biomolecules 12 00489 g005
Figure 6. Canonical correspondence analysis (CCA) plot between environmental variables and phylum level diversity. Triplot represent environmental variables. Filled squares and triangles represent samples from SITE1 and 2, respectively. CCA plot was constructed based on bootstrap N:999, p = 0.043.
Biomolecules 12 00489 g006
Publisher’s Note: MDPI stays neutral with regard to jurisdictional claims in published maps and institutional affiliations.

