
Differences in Medium-Induced Conformational Plasticity Presumably Underlie Different Cytotoxic Activity of Ricin and Viscumin

 , , , ,
Abstract
: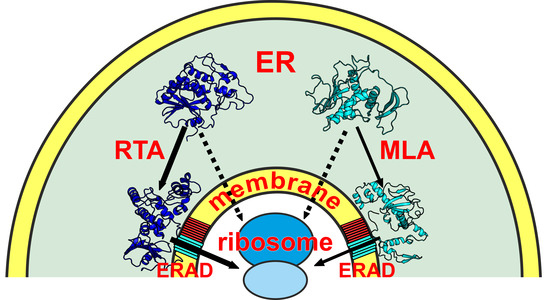
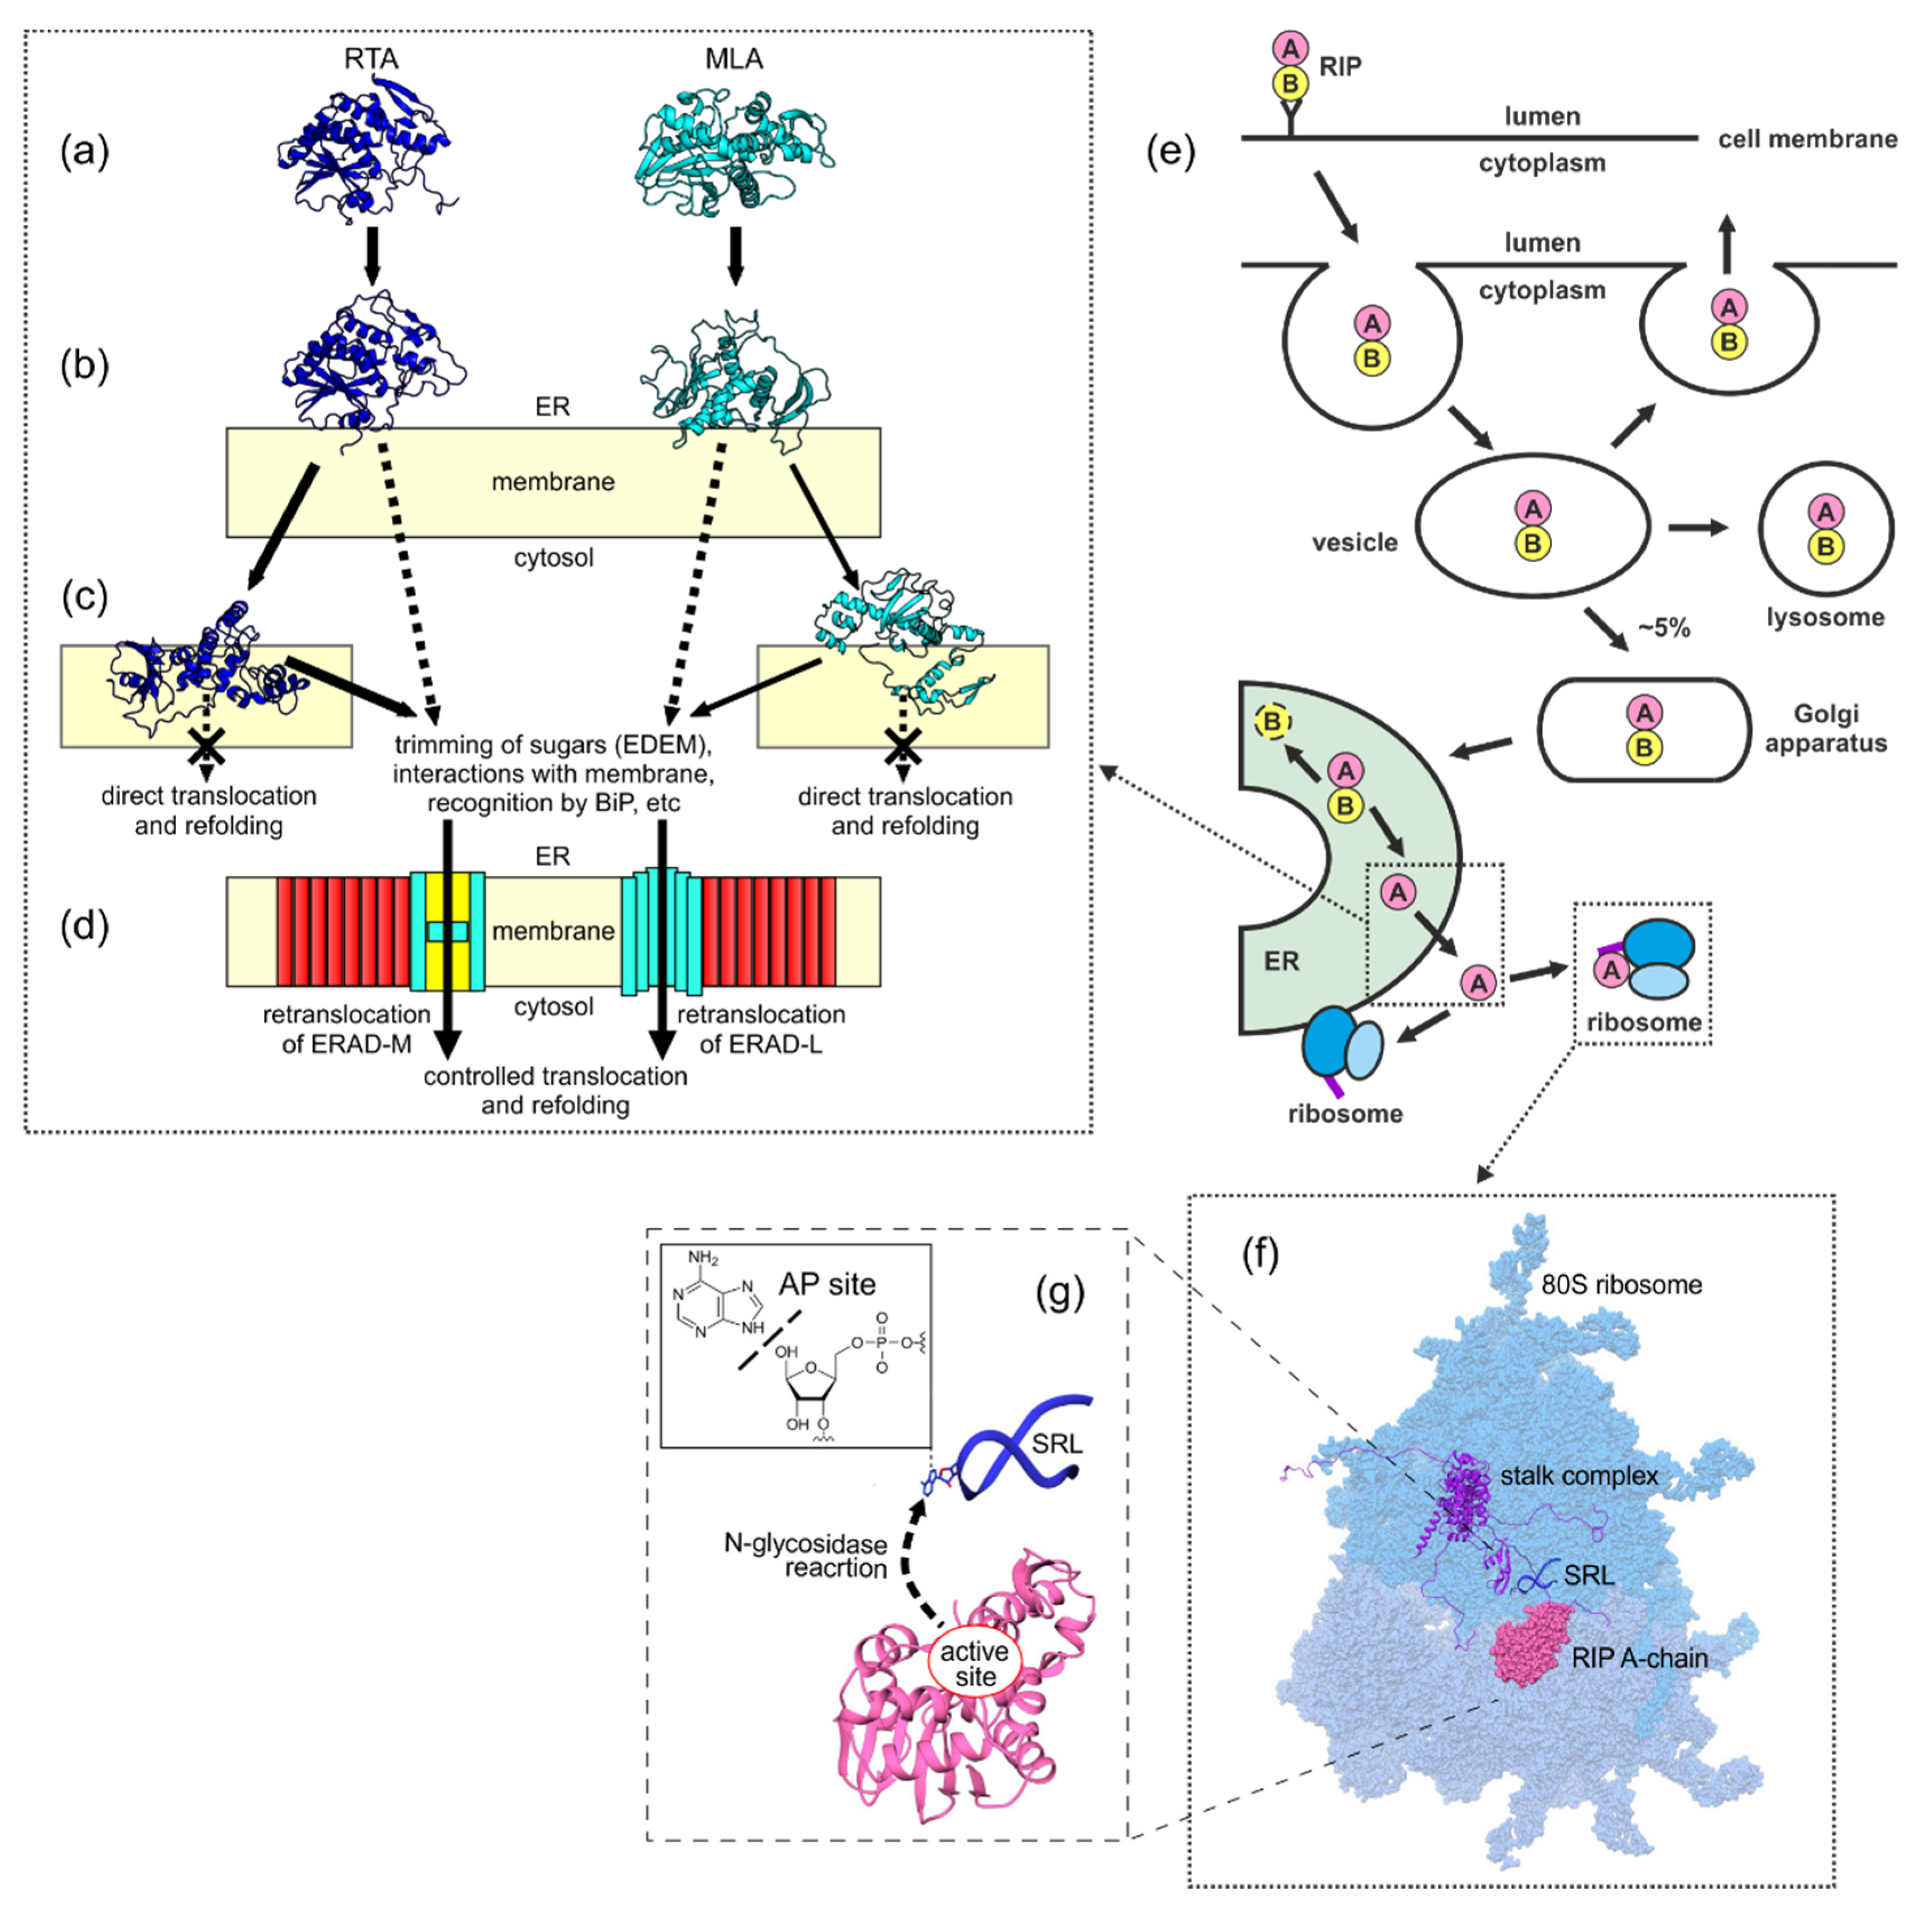
1. Introduction
- (1)
- How plastic are the structures of both proteins—how do they react to changes in the properties of the medium? The term plasticity in this case refers to the degree and speed of the structural rearrangements caused by the effects of the environment. To solve these problems, we performed atomistic molecular dynamics (MD) simulations of proteins in media of different polarity—in water, 8M urea (chosen as the standard denaturing solvent), and a chloroform/methanol mixture, which mimics the water/membrane interface.
- (2)
- What are the features of the structural and hydrophobic organization of partially and/or fully refolded states of proteins obtained via MD? To answer this question, we employed the original methods of in silico protein mapping and identification of the putative membrane binding sites. The latter were assessed through Monte Carlo (MC) simulations of RTA and MLA in the presence of the implicit membrane.
2. Materials and Methods
2.1. Reagents
2.2. Proteins and Conjugates Preparation
2.3. Cell Culturing and Cytotoxic Effect of Ricin and Viscumin
2.4. In-Cell ELISA Analysis of Ricin and Viscumin Binding on the Surface of HT-29 Cells
2.5. The Measurement of Ribosome Inactivation Degree by Ricin and Viscumin
2.6. All-Atom Molecular Dynamics
2.7. Monte Carlo Simulations with Implicit Membrane Model
2.8. Protein Surface Analysis
3. Results
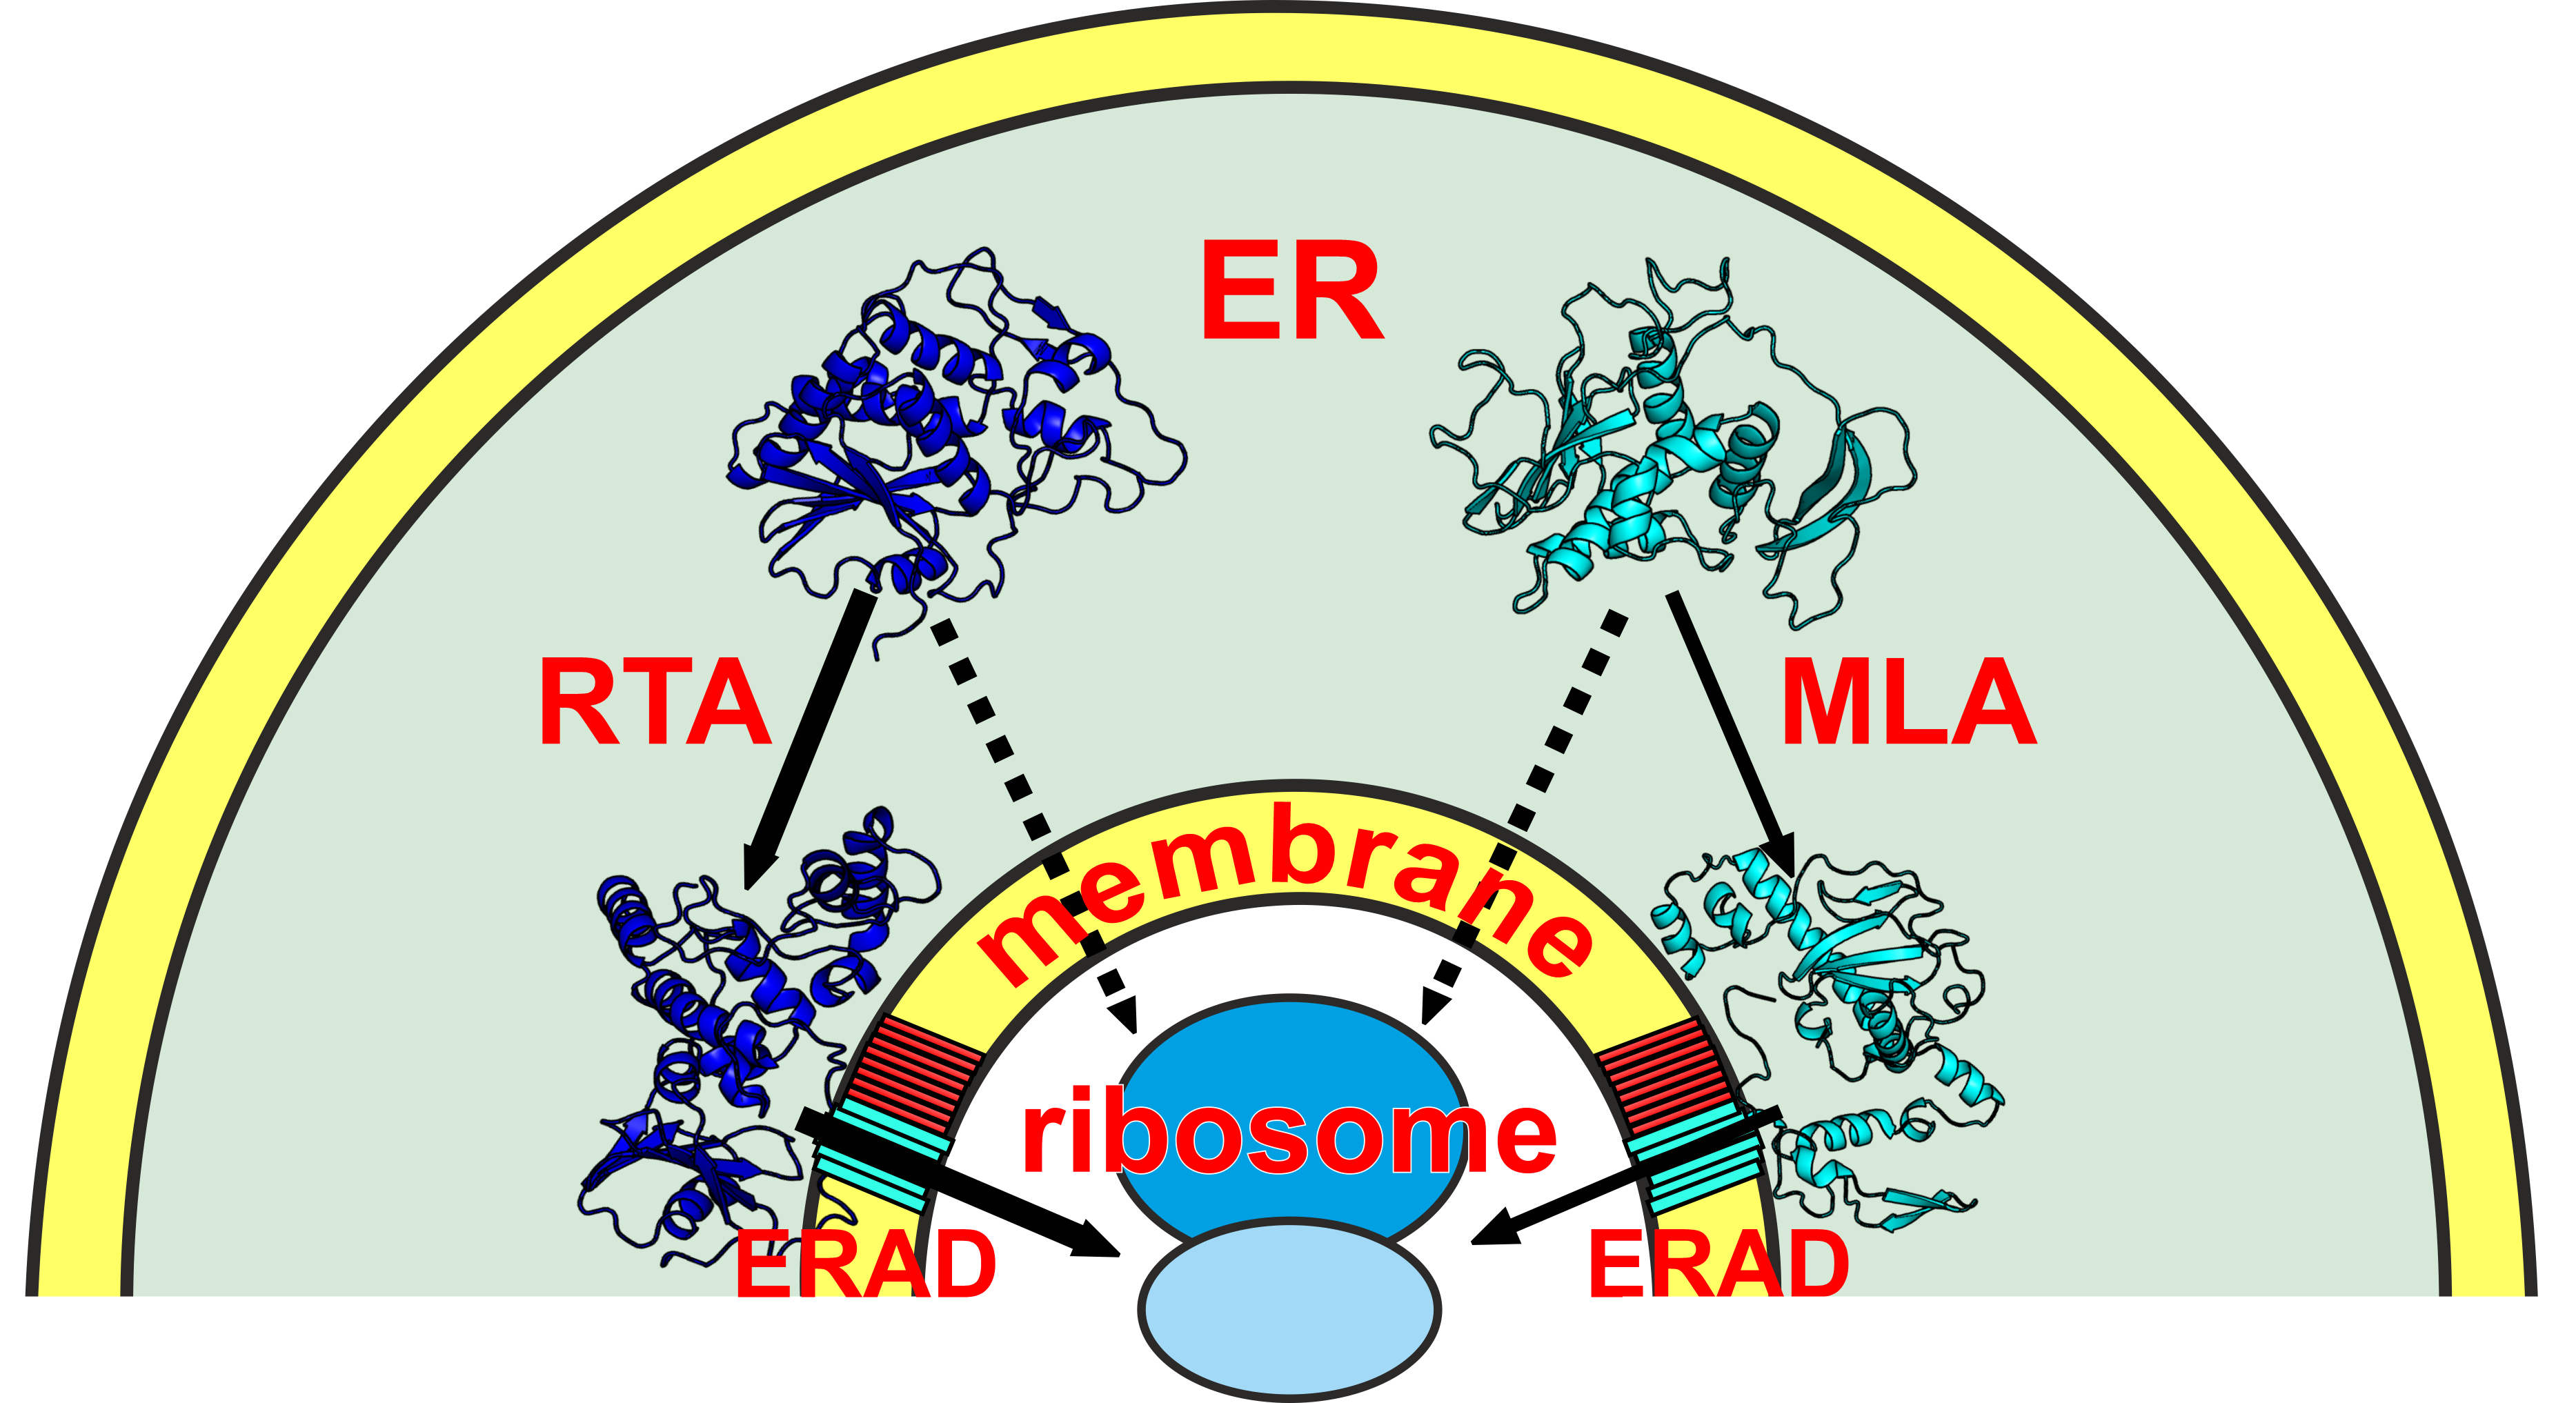
3.1. Comparison of the Cytotoxic Effect of Ricin and Viscumin on the Colorectal Adenocarcinoma HT29 Cell Line
3.2. Binding of Ricin and Viscumin to the Surface of HT29 Cells
3.3. Comparison of the Ribosome Inactivation Capability of RTA and MLA
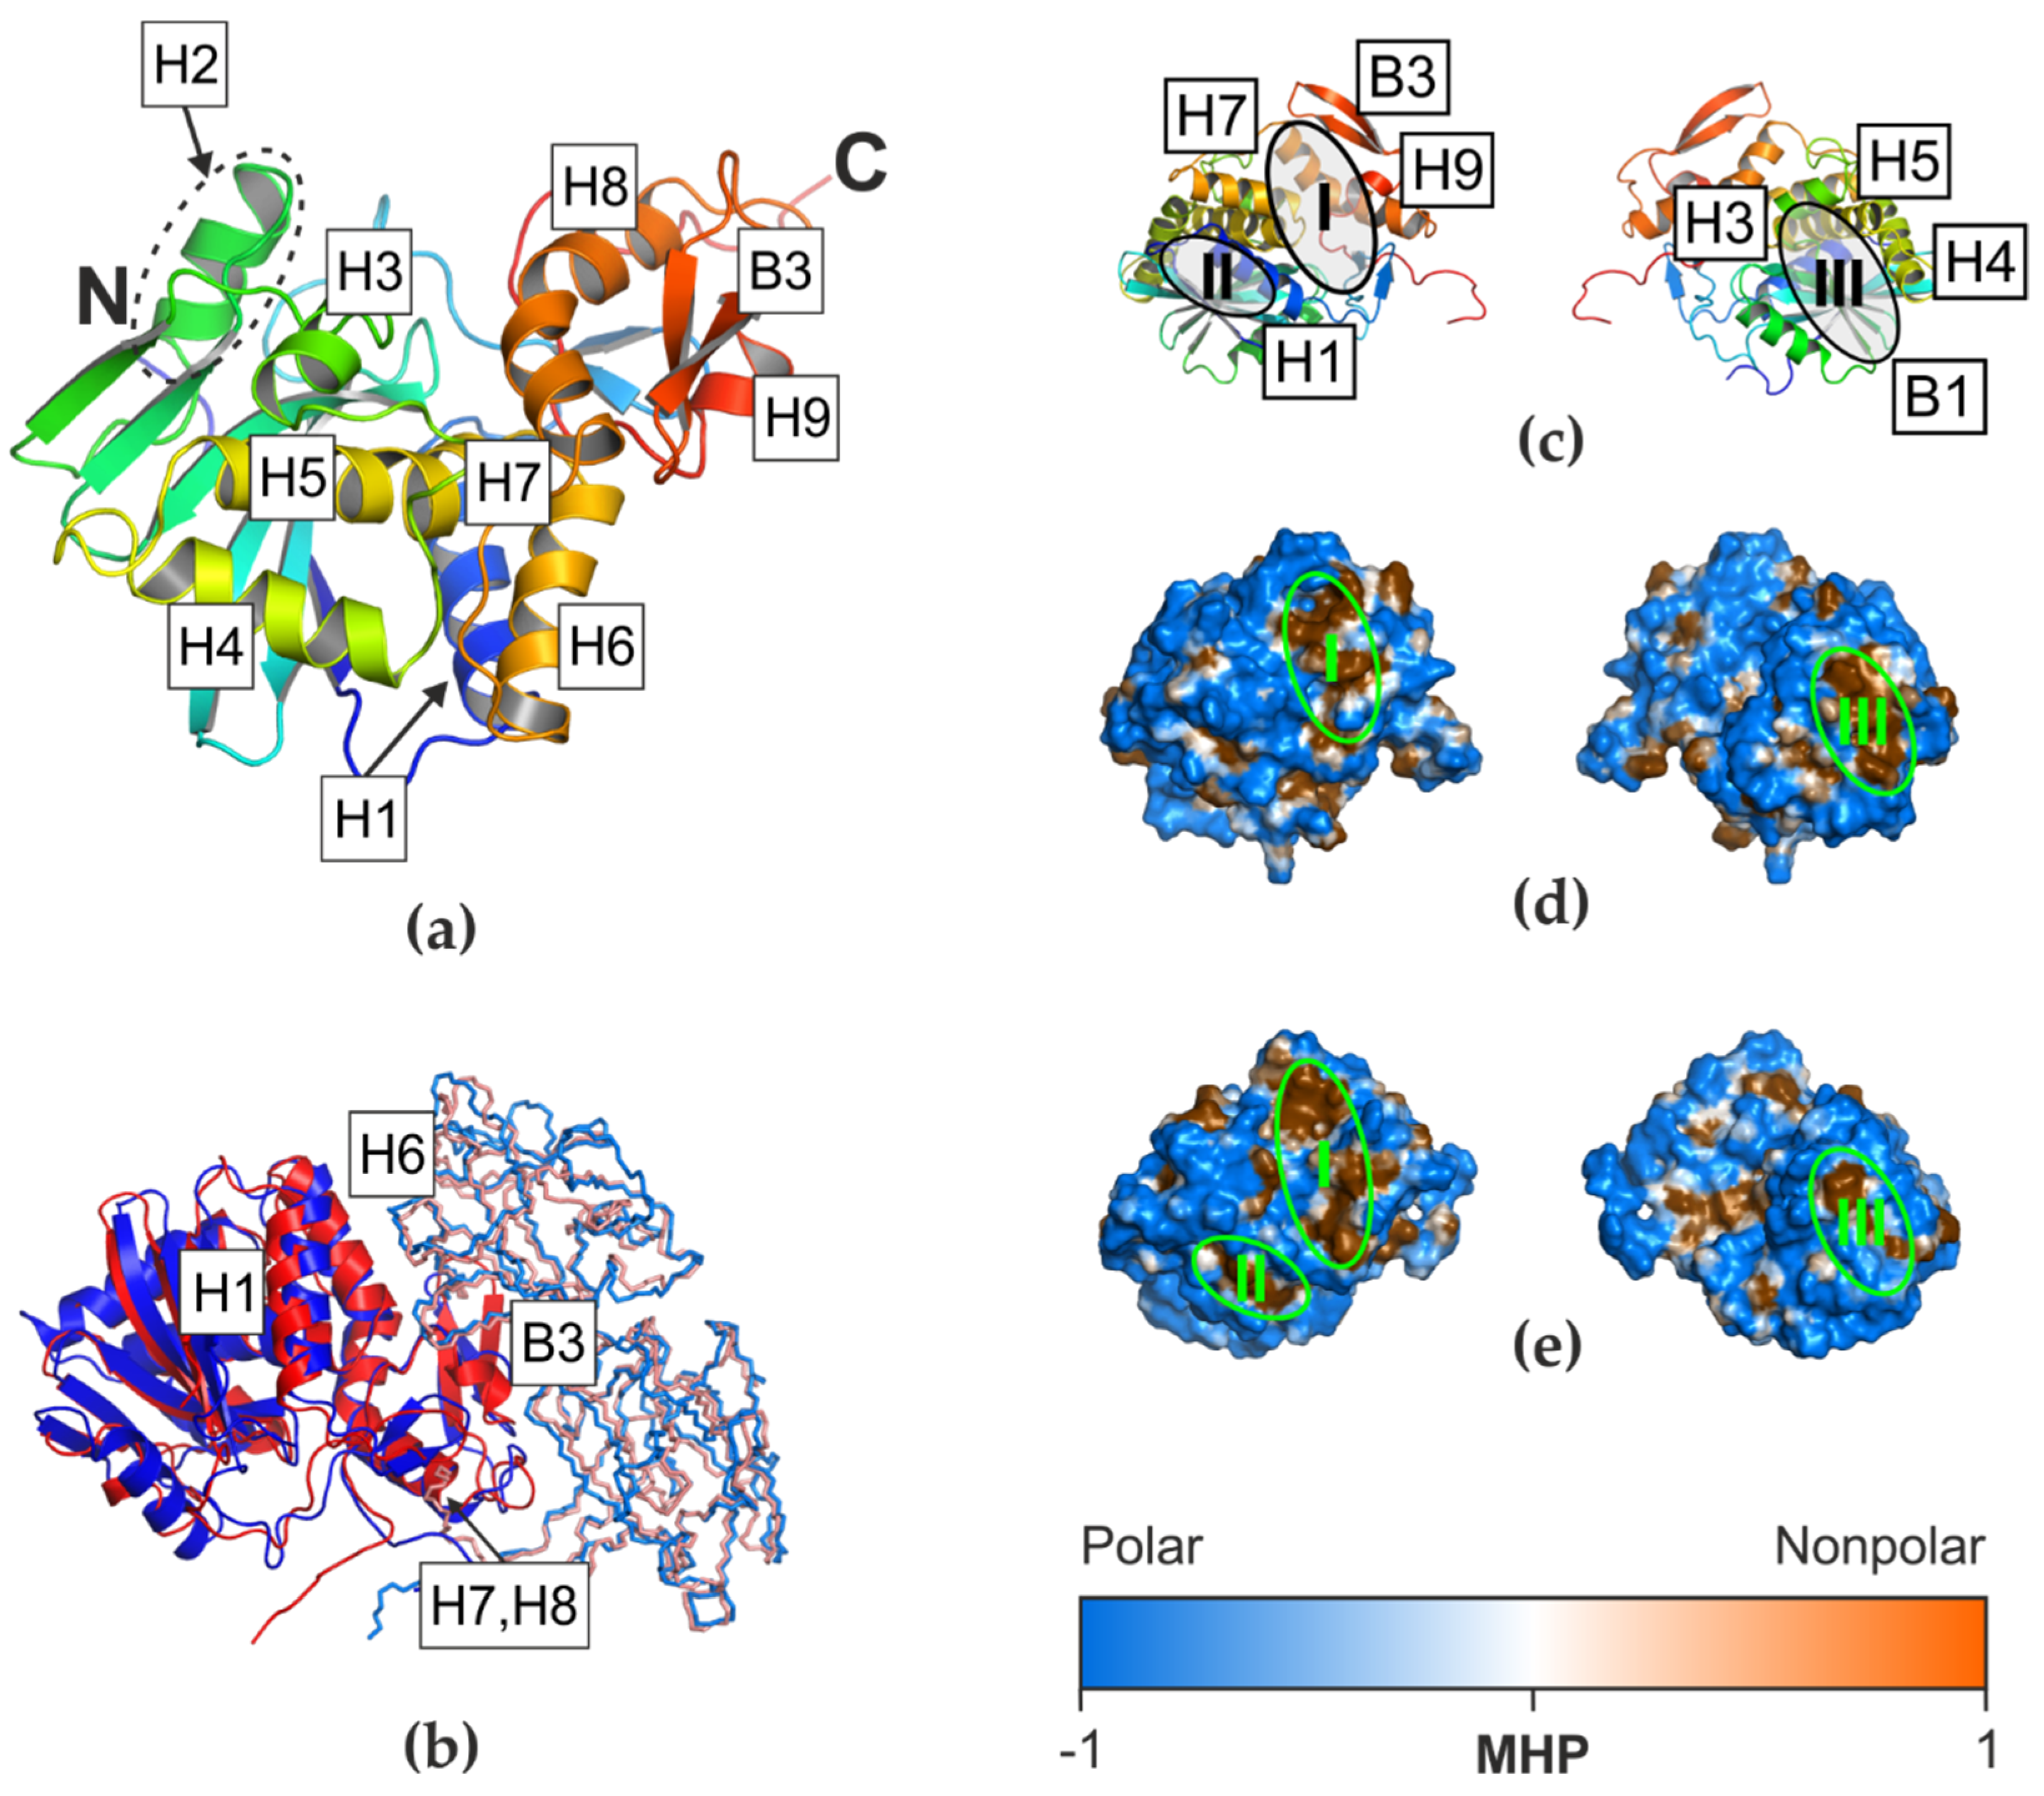
3.4. Structural Properties of RTA and MLA in the Disulfide-Linked AB-dimer
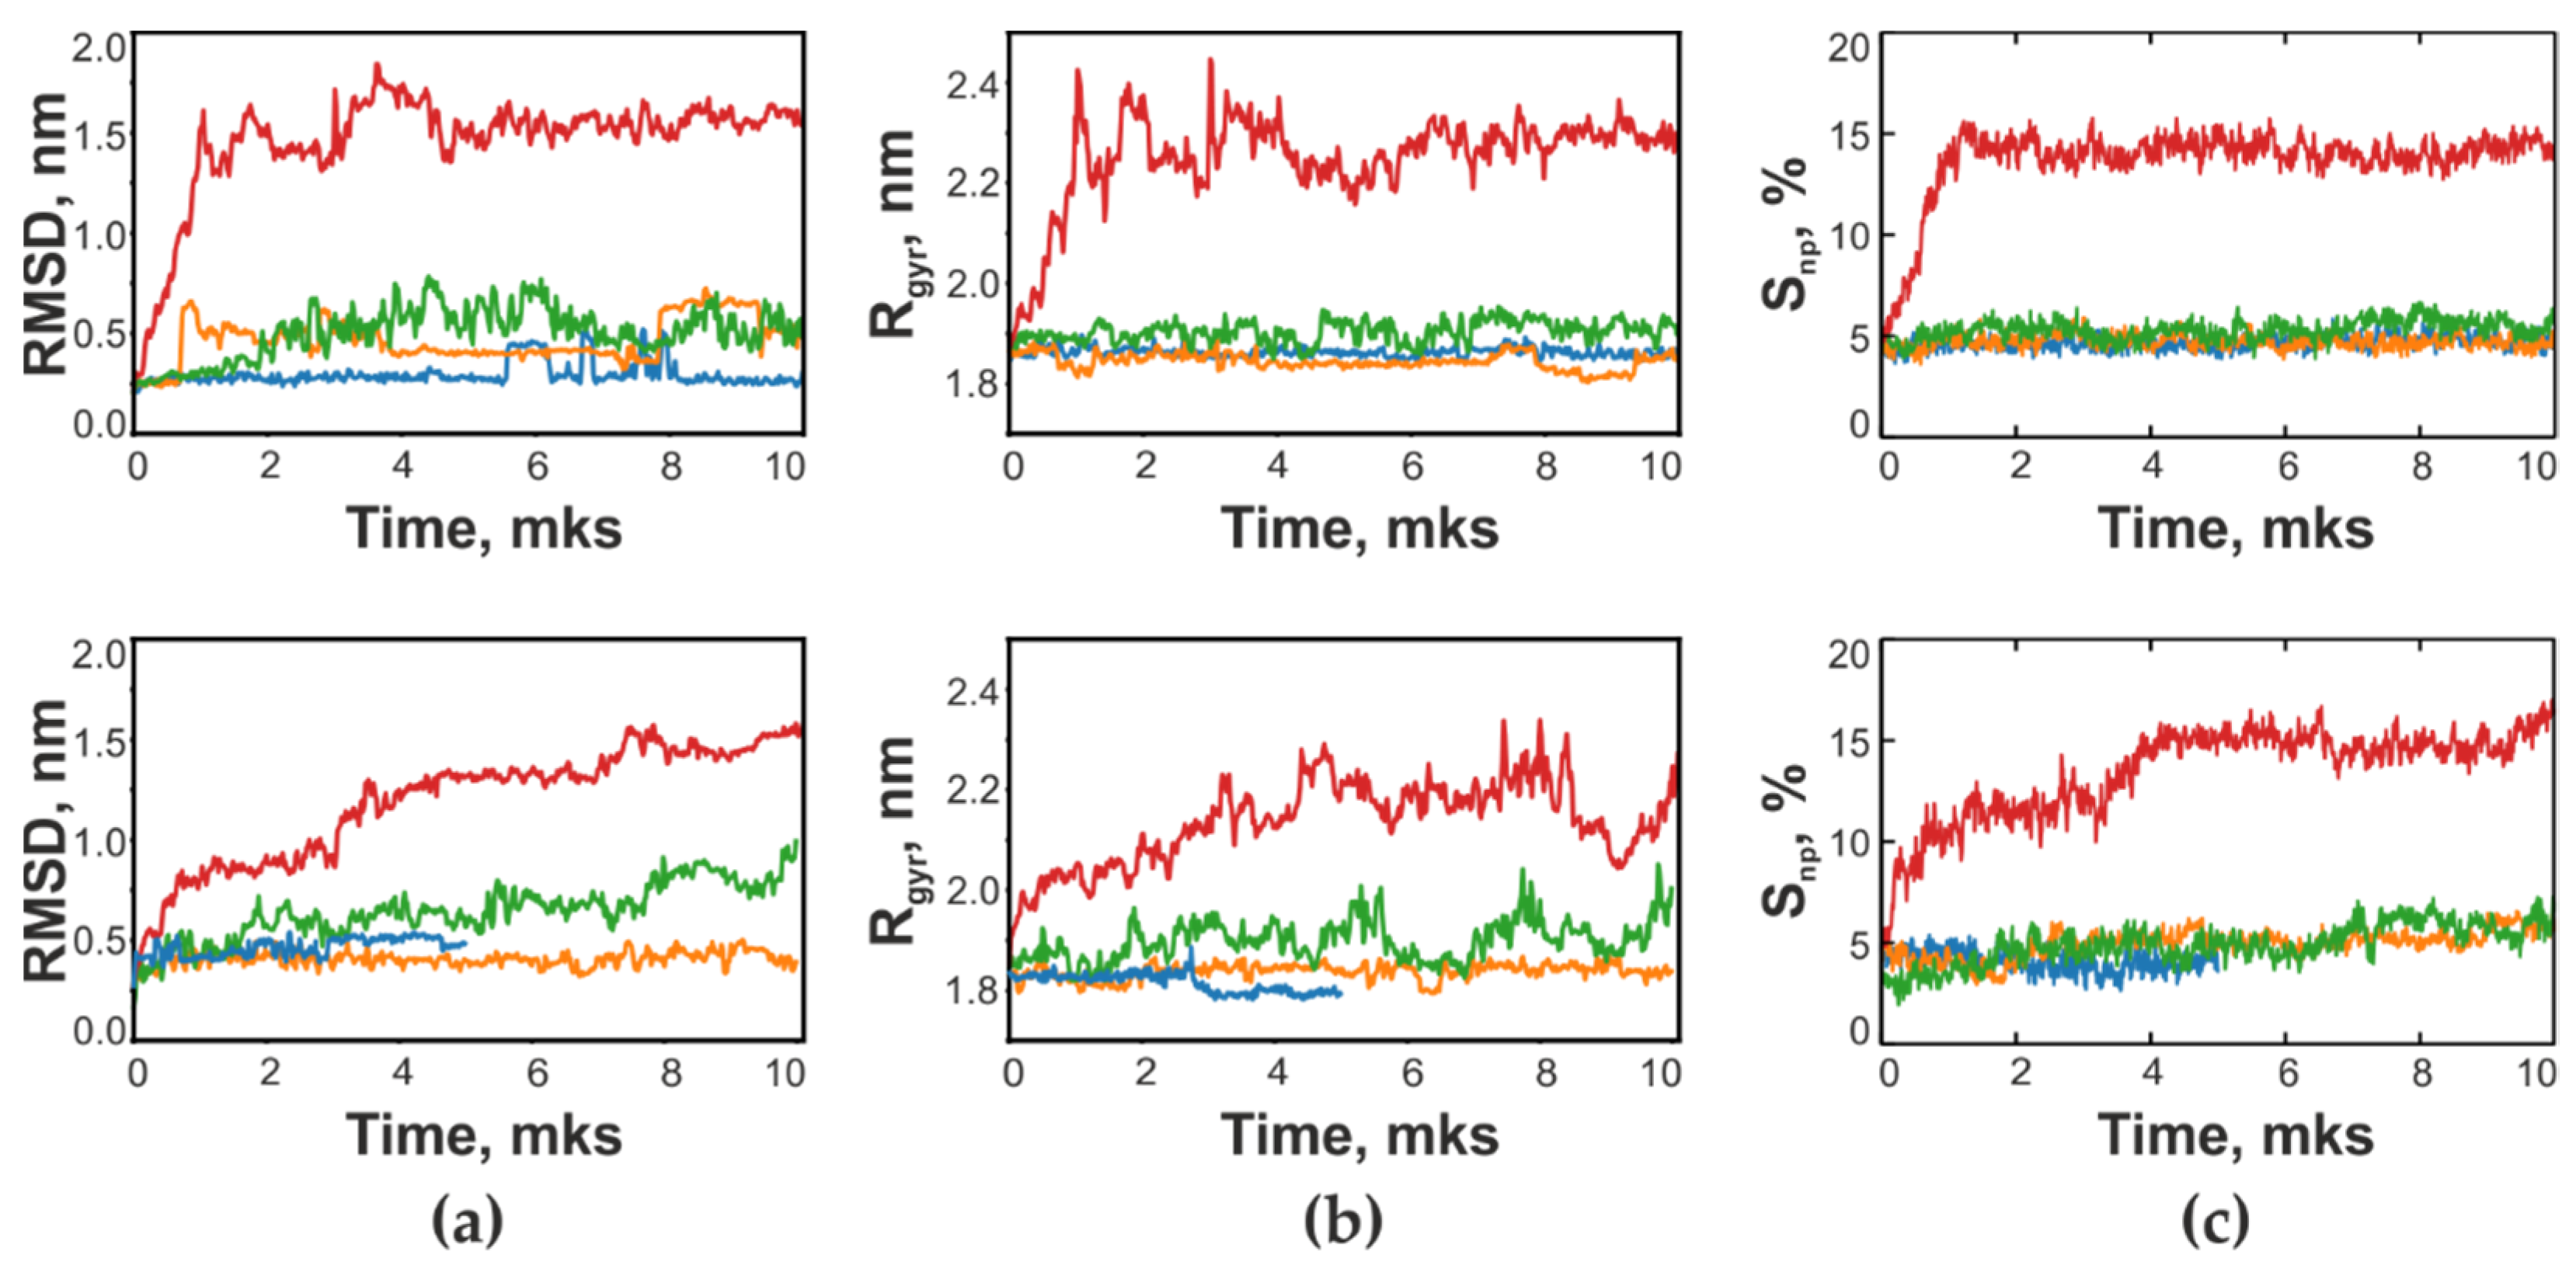
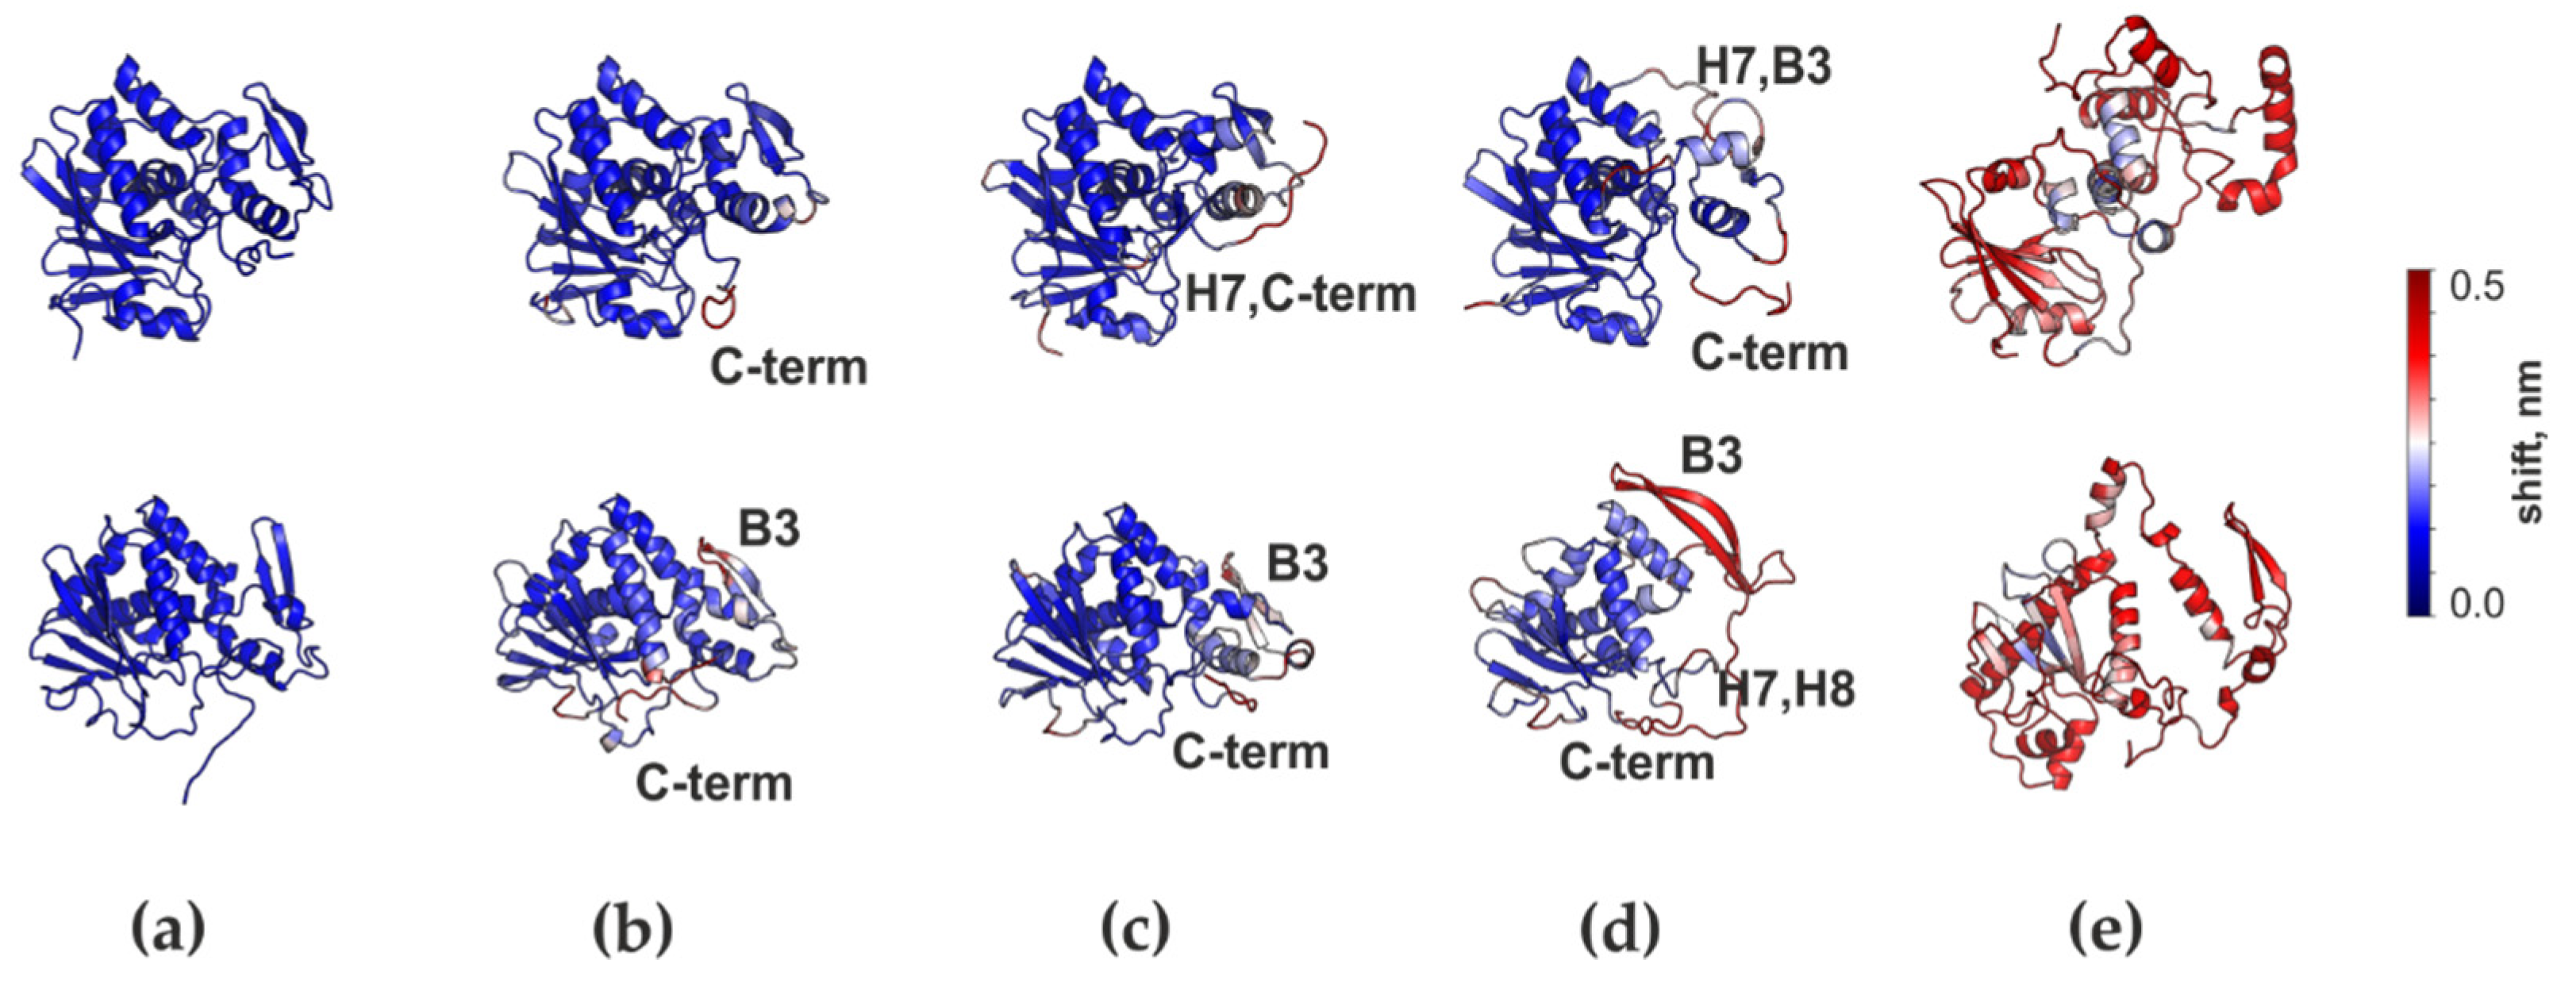
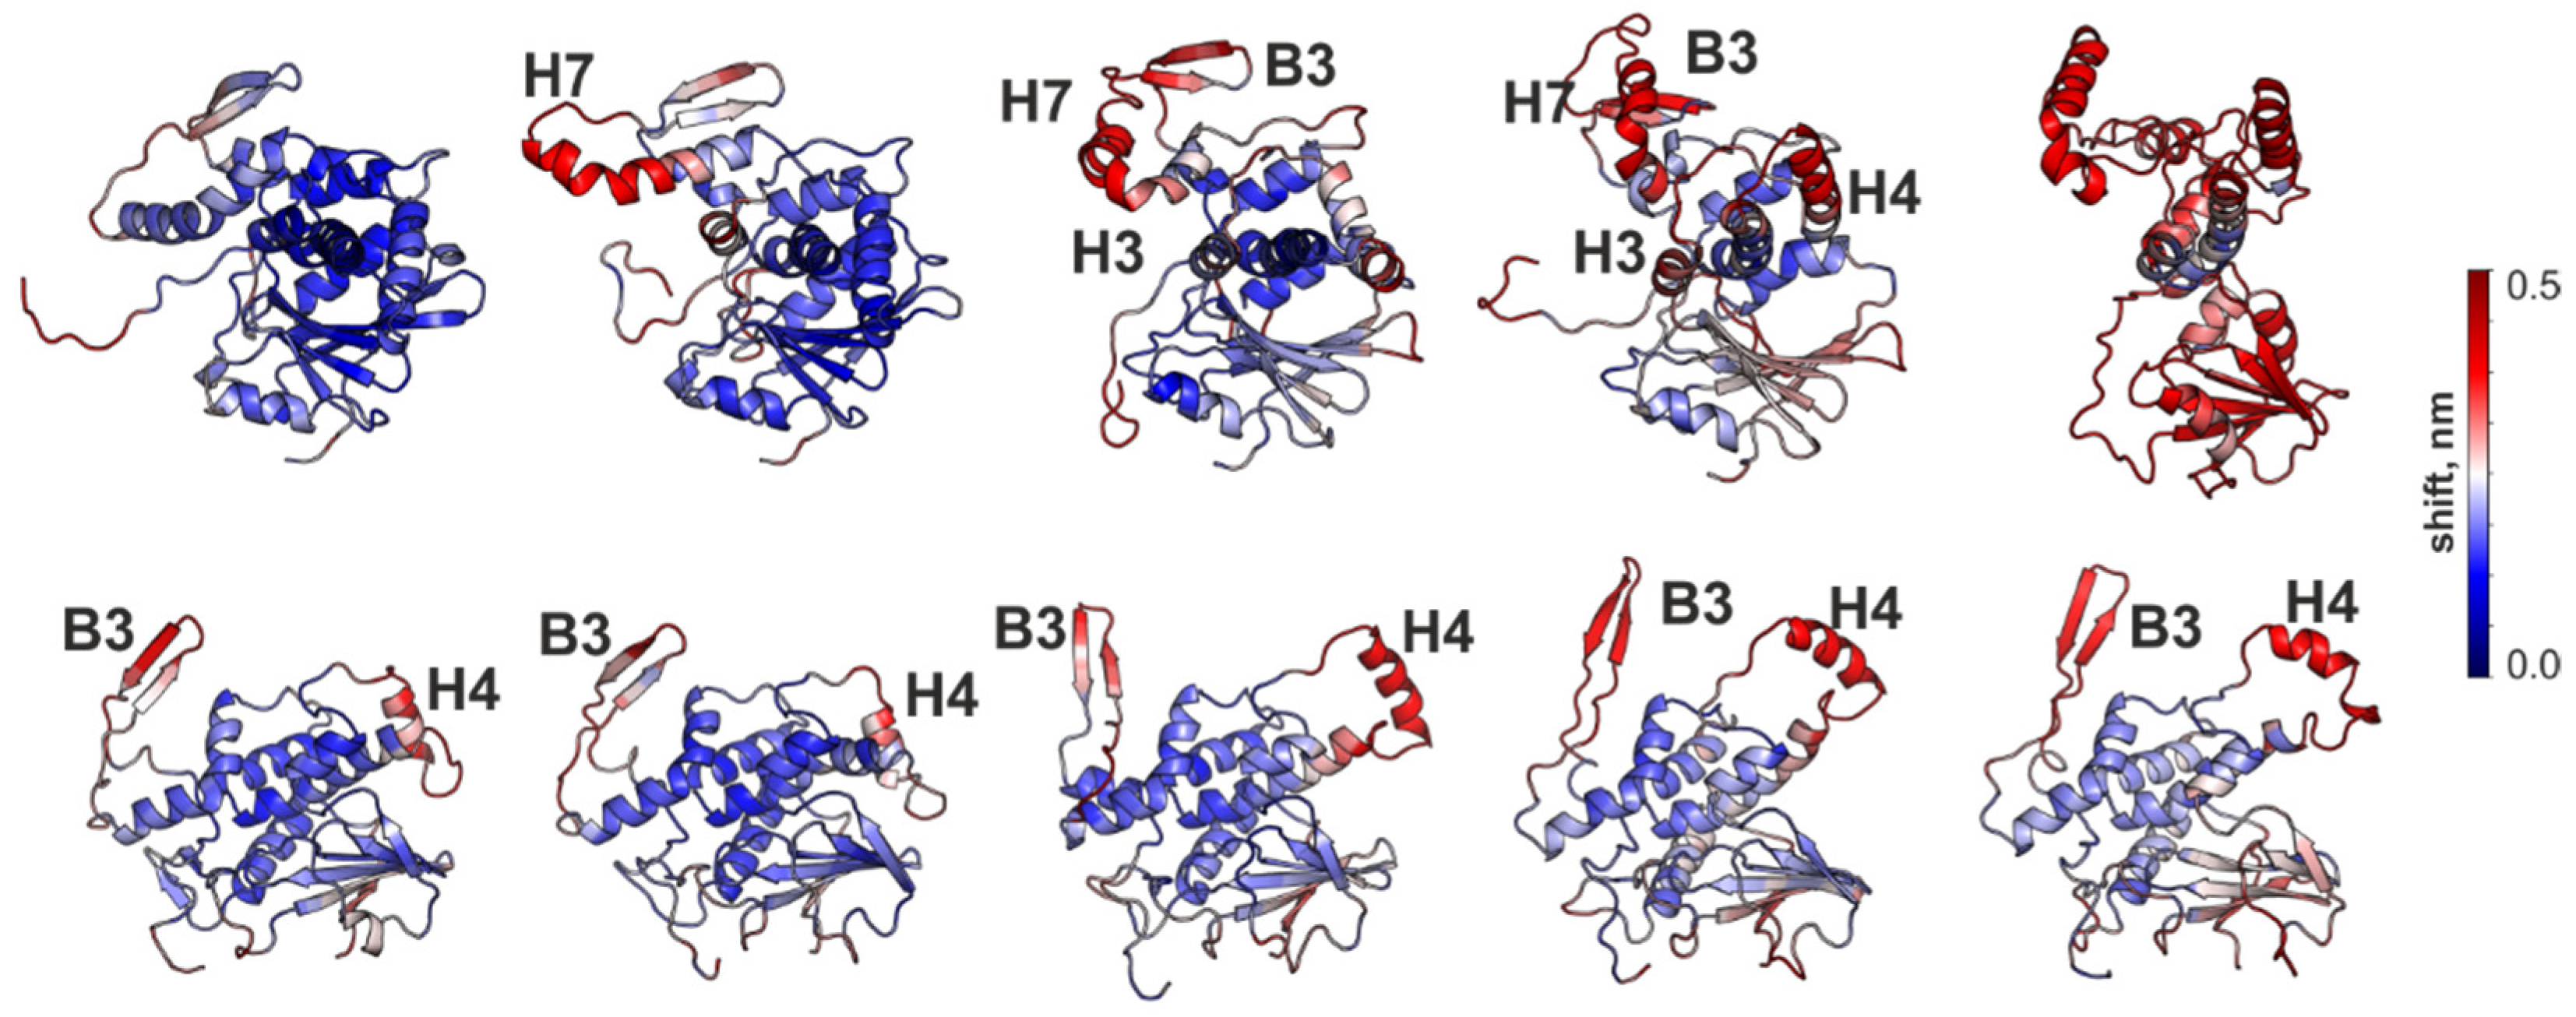
3.5. Conformational Behavior of RTA and MLA in Different Environments
3.6. Interaction of RTA and MLA Adapted to Different Environments with Implicit Membrane: Monte Carlo Simulations
3.6.1. Water-Adapted Structures
3.6.2. Urea/Water-Adapted Structures
3.6.3. Chloroform/Methanol-Adapted Structures
4. Discussion
5. Conclusions
Supplementary Materials
Author Contributions
Funding
Institutional Review Board Statement
Informed Consent Statement
Data Availability Statement
Acknowledgments
Conflicts of Interest
Abbreviations
| RIP | ribosome-inactivating protein |
| RTA | A subunit of ricin |
| RTB | B subunit of ricin |
| MLA | A subunit of viscumin |
| MLB | B subunit of viscumin |
| ER | endoplasmic reticulum |
| ERAD | ER-associated degradation quality control system |
| ERAD-L | ERAD pathway for proteins with misfolded domain localized in the ER lumen |
| ERAD-M | ERAD pathway for proteins with misfolded domain localized in the membrane |
| MD | molecular dynamics |
| MC | Monte Carlo |
| MHP | molecular hydrophobicity potential |
| RMSD | root mean square deviation |
References
- Thuenauer, R.; Müller, S.K.; Römer, W. Pathways of protein and lipid receptor-mediated transcytosis in drug delivery. Expert Opin. Drug Deliv. 2017, 14, 341–351. [Google Scholar] [CrossRef] [PubMed]
- Sandvig, K.; Kavaliauskiene, S.; Skotland, T. The Protein Toxins Ricin and Shiga Toxin as Tools to Explore Cellular Mechanisms of Internalization and Intracellular Transport. Toxins 2021, 13, 377. [Google Scholar] [CrossRef] [PubMed]
- Rutenber, E.; Katzin, B.J.; Ernst, S.; Collins, E.J.; Mlsna, D.; Ready, M.P.; Robertus, J.D. Crystallographic refinement of ricin to 2.5 A. Proteins 1991, 10, 240–250. [Google Scholar] [CrossRef] [PubMed]
- Rudolph, M.J.; Vance, D.J.; Cassidy, M.S.; Rong, Y.; Mantis, N.J. Structural Analysis of Single Domain Antibodies Bound to a Second Neutralizing Hot Spot on Ricin Toxin’s Enzymatic Subunit. J. Biol. Chem. 2017, 292, 872–883. [Google Scholar] [CrossRef] [Green Version]
- Weston, S.A.; Tucker, A.D.; Thatcher, D.R.; Derbyshire, D.J.; Pauptit, R.A. X-ray structure of recombinant ricin A-chain at 1.8 A resolution. J. Mol. Biol. 1994, 244, 410–422. [Google Scholar] [CrossRef]
- Endo, Y.; Tsurugi, K. The RNA N-glycosidase activity of ricin A-chain. The characteristics of the enzymatic activity of ricin A-chain with ribosomes and with rRNA. J. Biol. Chem. 1988, 263, 8735–8739. [Google Scholar] [CrossRef]
- Sperti, S.; Montanaro, L.; Mattioli, A.; Stirpe, F. Inhibition by ricin of protein synthesis in vitro: 60 S ribosomal subunit as the target of the toxin. Biochem. J. 1973, 136, 813–815. [Google Scholar] [CrossRef] [Green Version]
- Spooner, R.A.; Lord, J.M. Ricin trafficking in cells. Toxins 2015, 7, 49–65. [Google Scholar] [CrossRef] [Green Version]
- Spooner, R.A.; Lord, J.M. How ricin and Shiga toxin reach the cytosol of target cells: Retrotranslocation from the endoplasmic reticulum. Curr. Top. MicroBiol. Immunol. 2012, 357, 19–40. [Google Scholar] [CrossRef] [Green Version]
- Nowakowska-Gołacka, J.; Sominka, H.; Sowa-Rogozińska, N.; Słomińska-Wojewódzka, M. Toxins utilize the endoplasmic reticulum-associated protein degradation pathway in their intoxication process. Int. J. Mol. Sci. 2019, 20, 1307. [Google Scholar] [CrossRef] [Green Version]
- Li, S.; Spooner, R.A.; Allen, S.C.; Guise, C.P.; Ladds, G.; Schnöder, T.; Schmitt, M.J.; Lord, J.M.; Roberts, L.M. Folding-competent and folding-defective forms of ricin A chain have different fates after retrotranslocation from the endoplasmic reticulum. Mol. Biol. Cell. 2010, 21, 2543–2554. [Google Scholar] [CrossRef] [PubMed] [Green Version]
- Sokołowska, I.; Wälchli, S.; Węgrzyn, G.; Sandvig, K.; Słomińska-Wojewódzka, M. A single poInt. mutation in ricin A-chain increases toxin degradation and inhibits EDEM1-dependent ER retrotranslocation. BioChem. J. 2011, 436, 371–385. [Google Scholar] [CrossRef] [PubMed] [Green Version]
- Simpson, J.C.; Roberts, L.M.; Lord, J.M. Catalytic and cytotoxic activities of recombinant ricin A chain mutants with charged residues added at the carboxyl terminus. Protein Expr. Purif. 1995, 6, 665–670. [Google Scholar] [CrossRef] [PubMed]
- Bassik, M.C.; Kampmann, M.; Lebbink, R.J.; Wang, S.; Hein, M.Y.; Poser, I.; Weibezahn, J.; Horlbeck, M.A.; Chen, S.; Mann, M.; et al. A systematic mammalian genetic interaction map reveals pathways underlying ricin susceptibility. Cell 2013, 152, 909–922. [Google Scholar] [CrossRef] [Green Version]
- Hudson, T.H.; Grillo, F.G. Brefeldin-A enhancement of ricin A-chain immunotoxins and blockade of intact ricin, modeccin, and abrin. J. Biol. Chem. 1991, 266, 18586–18592. [Google Scholar] [CrossRef]
- Simpson, J.C.; Roberts, L.M.; Römisch, K.; Davey, J.; Wolf, D.H.; Lord, J.M. Ricin A chain utilises the endoplasmic reticulum-associated protein degradation pathway to enter the cytosol of yeast. FEBS Lett. 1999, 459, 80–84. [Google Scholar] [CrossRef] [Green Version]
- Volynsky, P.E.; Nolde, D.E.; Zakharova, G.S.; Palmer, R.A.; Tonevitsky, A.G.; Efremov, R.G. Specific refolding pathway of viscumin A chain in membrane-like medium reveals a possible mechanism of toxin entry into cell. Sci. Rep. 2019, 9, 413. [Google Scholar] [CrossRef]
- Stirpe, F.; Battelli, M.G. Ribosome-inactivating proteins: Progress and problems. Cell. Mol. Life Sci. 2006, 63, 1850–1866. [Google Scholar] [CrossRef]
- Sweeney, E.C.; Tonevitsky, A.G.; Palmer, R.A.; Niwa, H.; Pfueller, U.; Eck, J.; Lentzen, H.; Agapov, I.I.; Kirpichnikov, M.P. Mistletoe lectin I forms a double trefoil structure. FEBS Lett. 1998, 431, 367–370. [Google Scholar] [CrossRef] [Green Version]
- Lee, R.T.; Gabius, H.J.; Lee, Y.C. The sugar-combining area of the galactose-specific toxic lectin of mistletoe extends beyond the terminal sugar residue: Comparison with a homologous toxic lectin, ricin. Carbohydr. Res. 1994, 254, 269–276. [Google Scholar] [CrossRef]
- Tonevitsky, A.G.; Agapov, I.I.; Shamshiev, A.T.; Temyakov, D.E.; Pohl, P.; Kirpichnikov, M.P. Immunotoxins containing A-chain of mistletoe lectin I are more active than immunotoxins with ricin A-chain. FEBS Lett. 1996, 392, 166–168. [Google Scholar] [CrossRef] [Green Version]
- Maltseva, D.; Raygorodskaya, M.; Knyazev, E.; Zgoda, V.; Tikhonova, O.; Zaidi, S.; Nikulin, S.; Baranova, A.; Turchinovich, A.; Rodin, S.; et al. Knockdown of the α5 laminin chain affects differentiation of colorectal cancer cells and their sensitivity to chemotherapy. Biochimie 2020, 174, 107–116. [Google Scholar] [CrossRef] [PubMed]
- Moisenovich, M.; Tonevitsky, A.; Maljuchenko, N.; Kozlovskaya, N.; Agapov, I.; Volknandt, W.; Bereiter-Hahn, J. Endosomal ricin transport: Involvement of Rab4- and Rab5-positive compartments. HistoChem. Cell. Biol. 2004, 121, 429–439. [Google Scholar] [CrossRef] [PubMed]
- Ritz, C.; Baty, F.; Streibig, J.C.; Gerhard, D. Dose-response analysis using R. PLoS ONE 2015, 10, e0146021. [Google Scholar] [CrossRef] [PubMed] [Green Version]
- Khaustova, N.A.; Maltseva, D.V.; Oliveira-Ferrer, L.; Stürken, C.; Milde-Langosch, K.; Makarova, J.A.; Rodin, S.; Schumacher, U.; Tonevitsky, A.G. Selectin-independent adhesion during ovarian cancer metastasis. Biochimie 2017, 142, 197–206. [Google Scholar] [CrossRef] [PubMed]
- Endo, Y.; Tsurugi, K.; Franz, H. The site of action of the A-chain of mistletoe lectin I on eukaryotic ribosomes. The RNA N-glycosidase activity of the protein. FEBS Lett. 1988, 231, 378–380. [Google Scholar] [CrossRef] [Green Version]
- Melchior, W.B.; Tolleson, W.H. A functional quantitative polymerase chain reaction assay for ricin, Shiga toxin, and related ribosome-inactivating proteins. Anal. BioChem. 2010, 396, 204–211. [Google Scholar] [CrossRef]
- Webb, B.; Sali, A. Comparative Protein Structure Modeling Using MODELLER. Curr. Protoc. Bioinform. 2016, 54, 5.6.1–5.6.37. [Google Scholar] [CrossRef] [Green Version]
- Abraham, M.J.; Murtola, T.; Schulz, R.; Páll, S.; Smith, J.C.; Hess, B.; Lindahl, E. GROMACS: High performance molecular simulations through multi-level parallelism from laptops to supercomputers. SoftwareX 2015, 1, 19–25. [Google Scholar] [CrossRef] [Green Version]
- Efremov, R.G.; Nolde, D.E.; Vergoten, G.; Arseniev, A.S. A solvent model for simulations of peptides in bilayers. II. Membrane-spanning alpha-helices. Biophys. J. 1999, 76, 2460–2471. [Google Scholar] [CrossRef] [Green Version]
- Efremov, R.G.; Alix, A.J.P. Environmental Characteristics of Residues in Proteins: Three-Dimensional Molecular Hydrophobicity Potential Approach. J. Biomol. Struct. Dyn. 1993, 11, 483–507. [Google Scholar] [CrossRef]
- Tonevitsky, A.G.; Toptygin, A.Y.; Shamshiev, A.T.; Agapov, I.I.; Ershova, E.V.; Pfuller, U.; Pfuller, K. Comparison of properties of mistletoe lectin I A-chain and ricin B-chain conjugate with native toxins. FEBS Lett. 1993, 336, 100–102. [Google Scholar] [CrossRef] [Green Version]
- Luzio, J.P.; Jackman, M.R.; Ellis, J.A. Endocytic and transcytic pathways in Caco-2 cells. BioChem. Soc. Trans. 1992, 20, 717–719. [Google Scholar] [CrossRef] [Green Version]
- Eck, J.; Langer, M.; Möckel, B.; Baur, A.; Rothe, M.; Zinke, H.; Lentzen, H. Cloning of the mistletoe lectin gene and characterization of the recombinant A-chain. Eur. J. BioChem. 1999, 264, 775–784. [Google Scholar] [CrossRef]
- Moisenovich, M.; Tonevitsky, A.; Agapov, I.; Niwa, H.; Schewe, H.; Bereiter-Hahn, J. Differences in endocytosis and intracellular sorting of ricin and viscumin in 3T3 cells. Eur. J. Cell. Biol. 2002, 81, 529–538. [Google Scholar] [CrossRef]
- Agapov, I.I.; Tonevitsky, A.G.; Moysenovich, M.M.; Maluchenko, N.V.; Weyhenmeyer, R.; Kirpichnikov, M.P. Mistletoe lectin dissociates into catalytic and binding subunits before translocation across the membrane to the cytoplasm. FEBS Lett. 1999, 452, 211–214. [Google Scholar] [CrossRef] [Green Version]
- Agapov, I.I.; Tonevitsky, A.G.; Maluchenko, N.V.; Moisenovich, M.M.; Bulah, Y.S.; Kirpichnikov, M.P. Mistletoe lectin A-chain unfolds during the intracellular transport. FEBS Lett. 1999, 464, 63–66. [Google Scholar] [CrossRef] [Green Version]
- Teter, K. Toxin instability and its role in toxin translocation from the endoplasmic reticulum to the cytosol. Biomolecules 2013, 3, 997–1029. [Google Scholar] [CrossRef] [Green Version]
- Mayerhofer, P.U.; Cook, J.P.; Wahlman, J.; Pinheiro, T.T.; Moore, K.A.; Lord, J.M.; Johnson, A.E.; Roberts, L.M. Ricin A chain insertion into endoplasmic reticulum membranes is triggered by a temperature increase to 37 C. J. Biol. Chem. 2009, 284, 10232–10242. [Google Scholar] [CrossRef] [PubMed] [Green Version]
- Chakrabarti, A.; Chen, A.W.; Varner, J.D. A review of the mammalian unfolded protein response. Biotechnol. Bioeng. 2011, 108, 2777–2793. [Google Scholar] [CrossRef] [Green Version]
- Wu, X.; Rapoport, T.A. Mechanistic insights into ER-associated protein degradation. Curr. Opin. Cell. Biol. 2018, 53, 22–28. [Google Scholar] [CrossRef] [PubMed]
- Sowa-Rogozińska, N.; Sominka, H.; Nowakowska-Gołacka, J.; Sandvig, K.; Słomińska-Wojewódzka, M. Intracellular transport and cytotoxicity of the protein toxin ricin. Toxins 2019, 11, 350. [Google Scholar] [CrossRef] [PubMed] [Green Version]
- Anger, A.M.; Armache, J.P.; Berninghausen, O.; Habeck, M.; Subklewe, M.; Wilson, D.N.; Beckmann, R. Structures of the human and Drosophila 80S ribosome. Nature 2013, 497, 80–85. [Google Scholar] [CrossRef] [PubMed]


| qPCR Fragment | Primer Sequences | E * | PCR-Product, bp |
|---|---|---|---|
| MOD | F-5’-TGCCATGGTAATCCTGCTCAGTA R- 5’-TCTGAACCTGCGGTTCCTCT | 2.0 ± 0.2 | 45 |
| UNMOD | F-5’-TGCCATGGTAATCCTGCTCAGTA R-5’- TCTGAACCTGCGGTTCCACA | 1.87 ± 0.15 | 45 |
| CTRL | F-5’-GATGTCGGCTCTTCCTATCATTGT R-5’- CCAGCTCACGTTCCCTATTAGTG | 2.05 ± 0.2 | 81 |
| RIP | 1 × 10⁻⁹ M | 1 × 10⁻⁸ M | 1 × 10⁻⁷ M |
| Viscumin | 0 | 1 | 4 |
| Ricin | 26 | 68 | 85 |
| Toxin | Surface of Hydrophobic Clusters I/II/III/Total, nm2 | ||||
|---|---|---|---|---|---|
| dimer # | w310 | w340 | u340 | m340 | |
| RTA | 2.2/-/2.1/5.1 * | 2.6/-/2.7/7.8 | 2.7/-/2.7/7.6 | 3.3/-/2.6/9.3 | -/-/-/32.4 |
| MLA | 2.0/1.5/0.5/3.9 | 2.5/2.1/0.5/6.8 | 2.5/2.0/0.6/9.6 | 3.1/1.6/0.6/10.2 | -/-/-/29.8 |
Publisher’s Note: MDPI stays neutral with regard to jurisdictional claims in published maps and institutional affiliations. |
© 2022 by the authors. Licensee MDPI, Basel, Switzerland. This article is an open access article distributed under the terms and conditions of the Creative Commons Attribution (CC BY) license (https://creativecommons.org/licenses/by/4.0/).
Share and Cite
Volynsky, P.; Maltseva, D.; Tabakmakher, V.; Bocharov, E.V.; Raygorodskaya, M.; Zakharova, G.; Britikova, E.; Tonevitsky, A.; Efremov, R. Differences in Medium-Induced Conformational Plasticity Presumably Underlie Different Cytotoxic Activity of Ricin and Viscumin. Biomolecules 2022, 12, 295. https://doi.org/10.3390/biom12020295
Volynsky P, Maltseva D, Tabakmakher V, Bocharov EV, Raygorodskaya M, Zakharova G, Britikova E, Tonevitsky A, Efremov R. Differences in Medium-Induced Conformational Plasticity Presumably Underlie Different Cytotoxic Activity of Ricin and Viscumin. Biomolecules. 2022; 12(2):295. https://doi.org/10.3390/biom12020295
Chicago/Turabian StyleVolynsky, Pavel, Diana Maltseva, Valentin Tabakmakher, Eduard V. Bocharov, Maria Raygorodskaya, Galina Zakharova, Elena Britikova, Alexander Tonevitsky, and Roman Efremov. 2022. "Differences in Medium-Induced Conformational Plasticity Presumably Underlie Different Cytotoxic Activity of Ricin and Viscumin" Biomolecules 12, no. 2: 295. https://doi.org/10.3390/biom12020295