
Predicting the Assembly of the Transmembrane Domains of Viral Channel Forming Proteins and Peptide Drug Screening Using a Docking Approach


Abstract
:
1. Introduction
2. Materials and Methods
2.1. Secondary Structure Prediction Programs
2.2. Prediction of Ion Channel Assembly (PICA), Assembly and Docking
2.3. MD Simulations
2.4. Data Analysis
2.5. Hardware Software
3. Results
3.1. Handedness
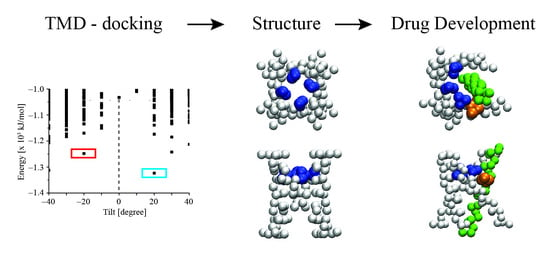
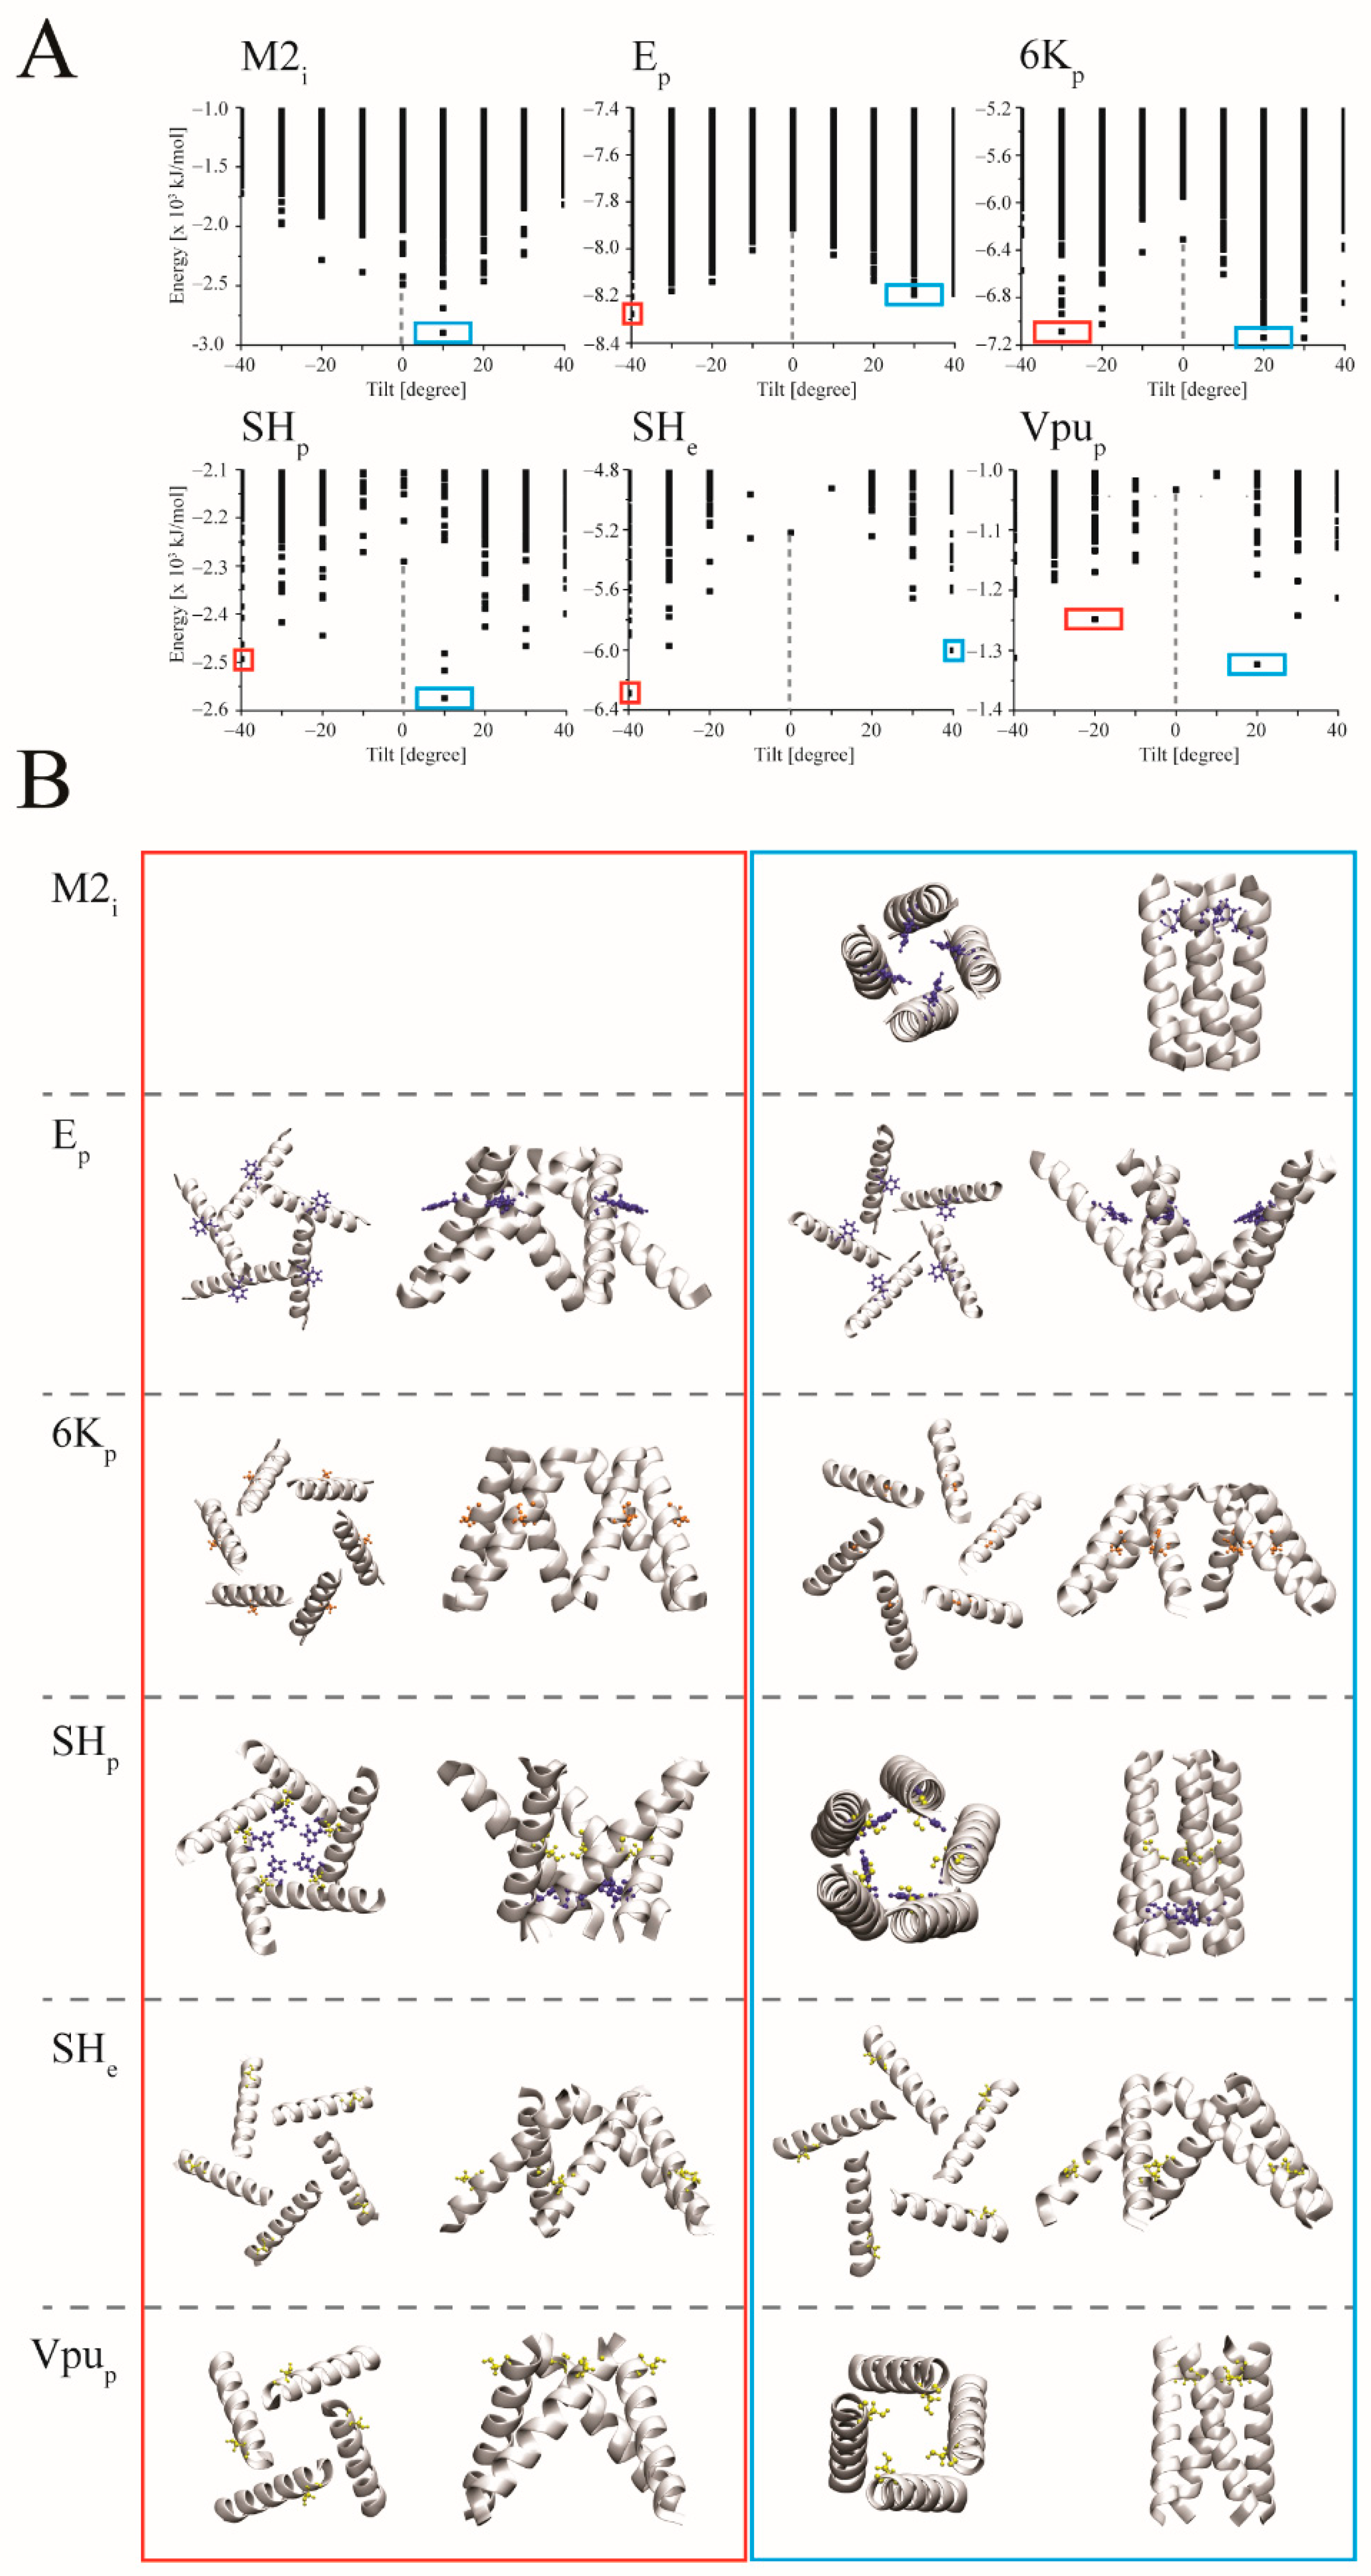
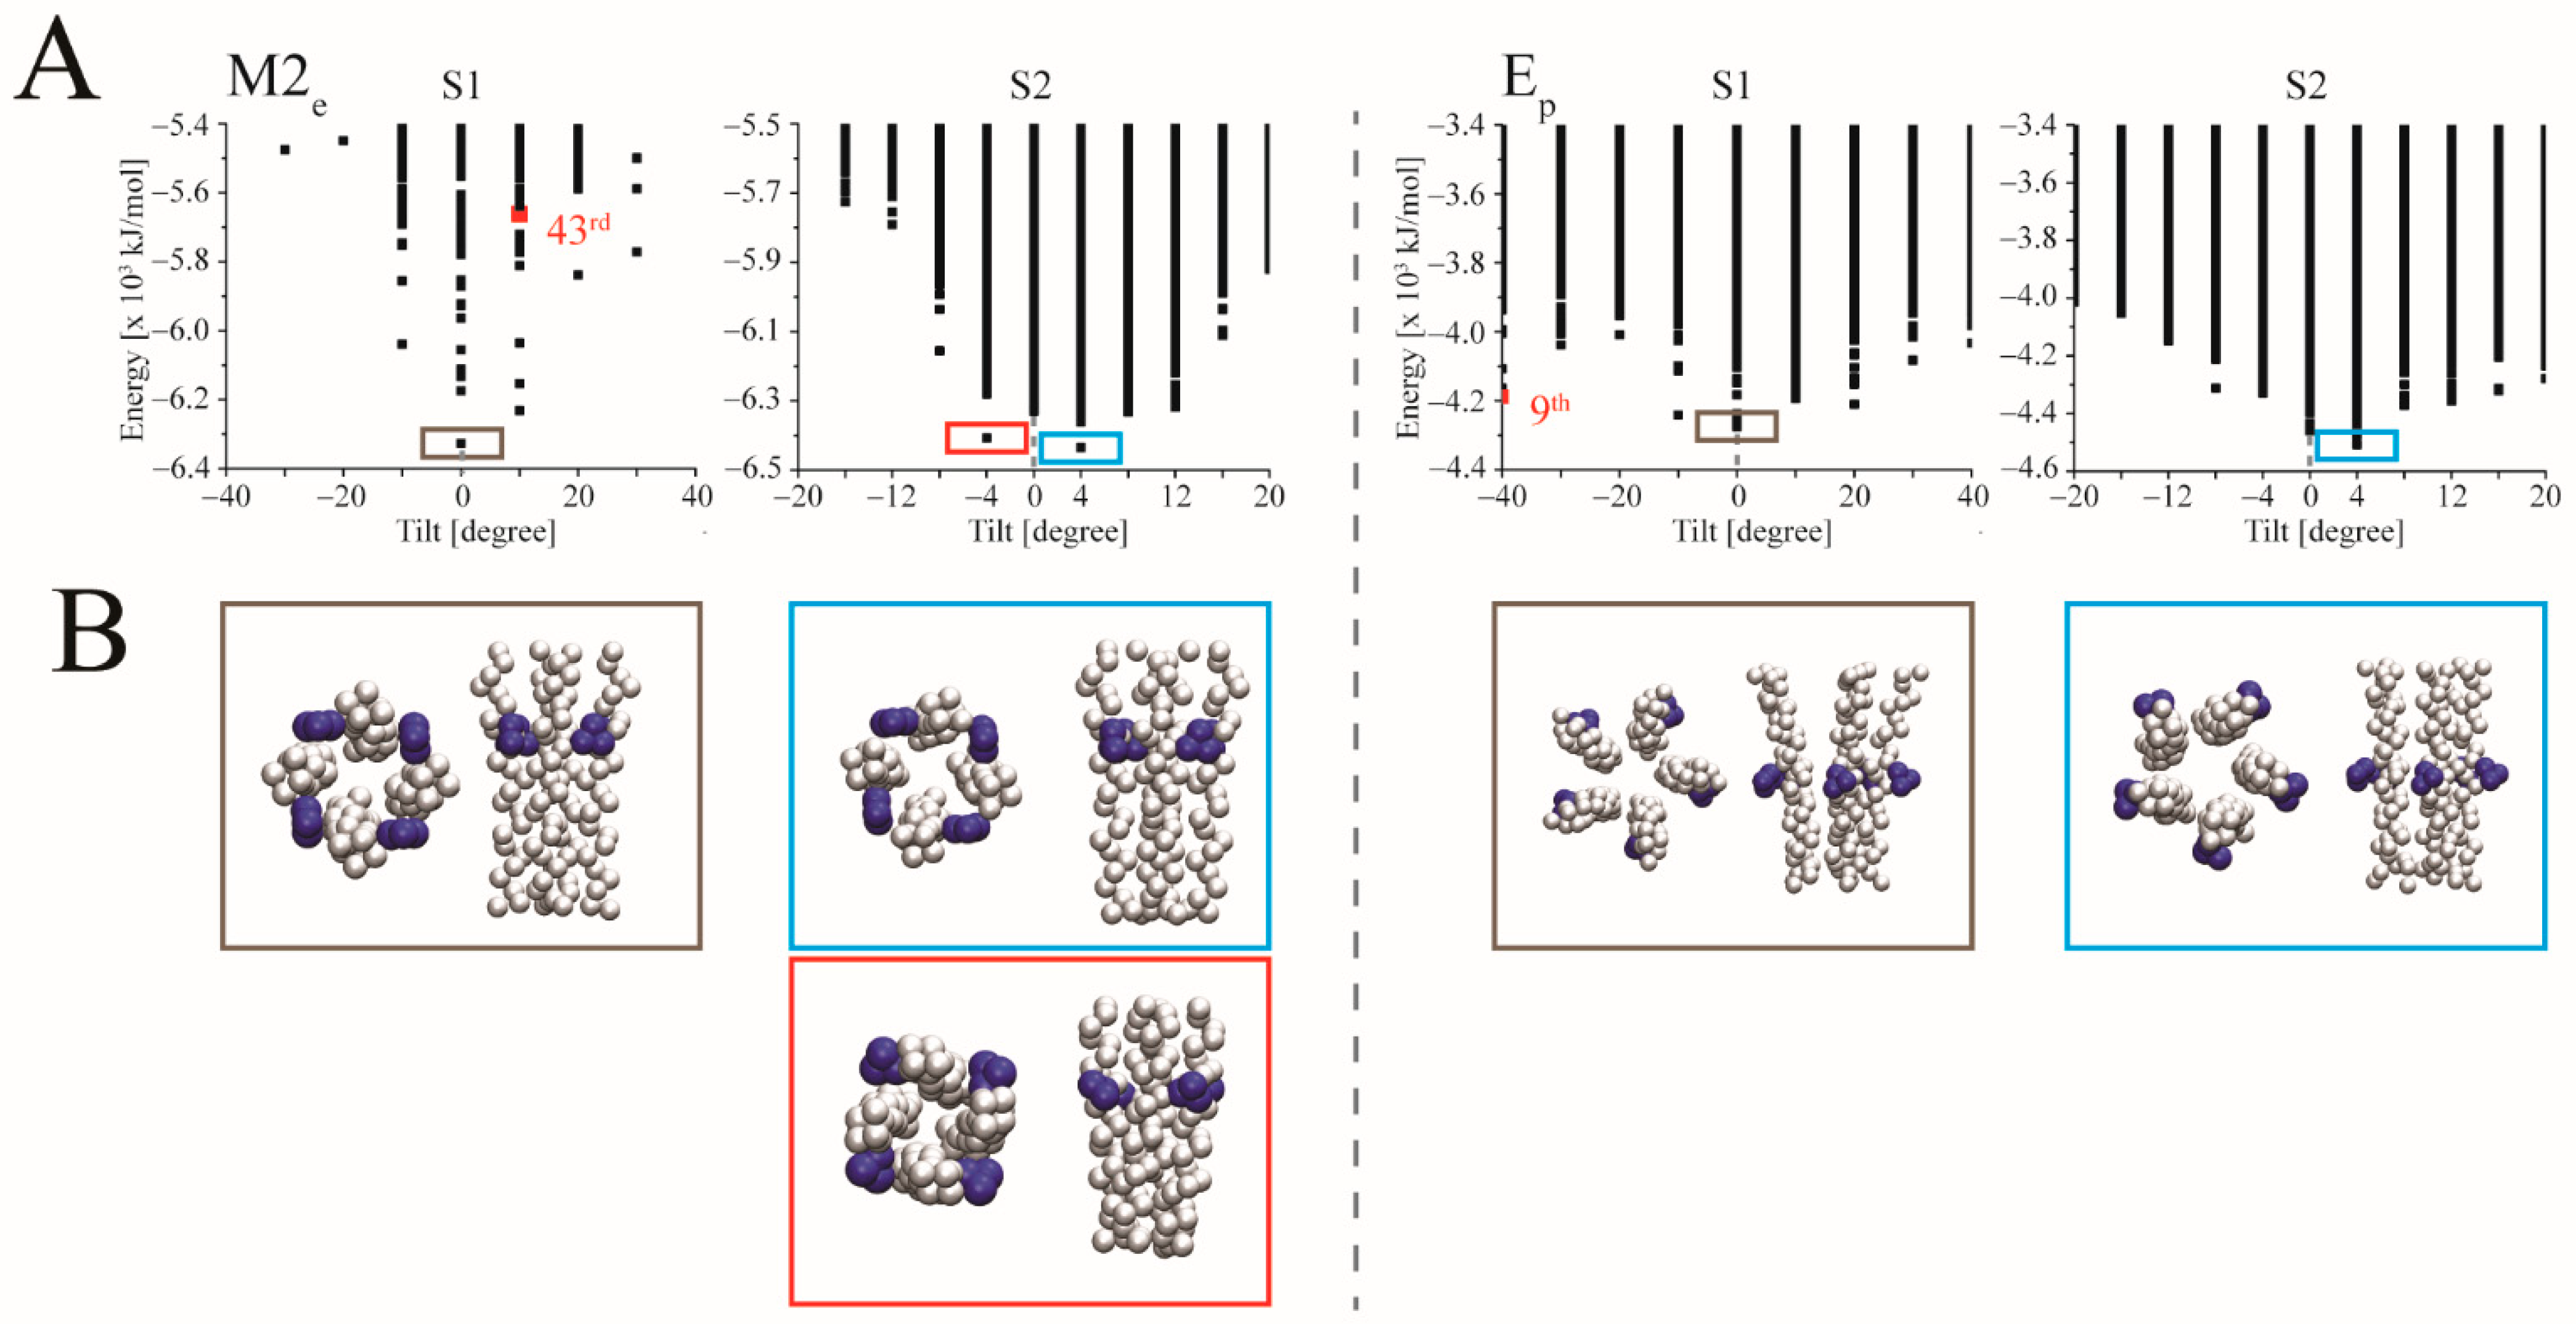
3.2. Docking
4. Discussion
4.1. Consideration on the Set-Up of the System
4.2. Handedness
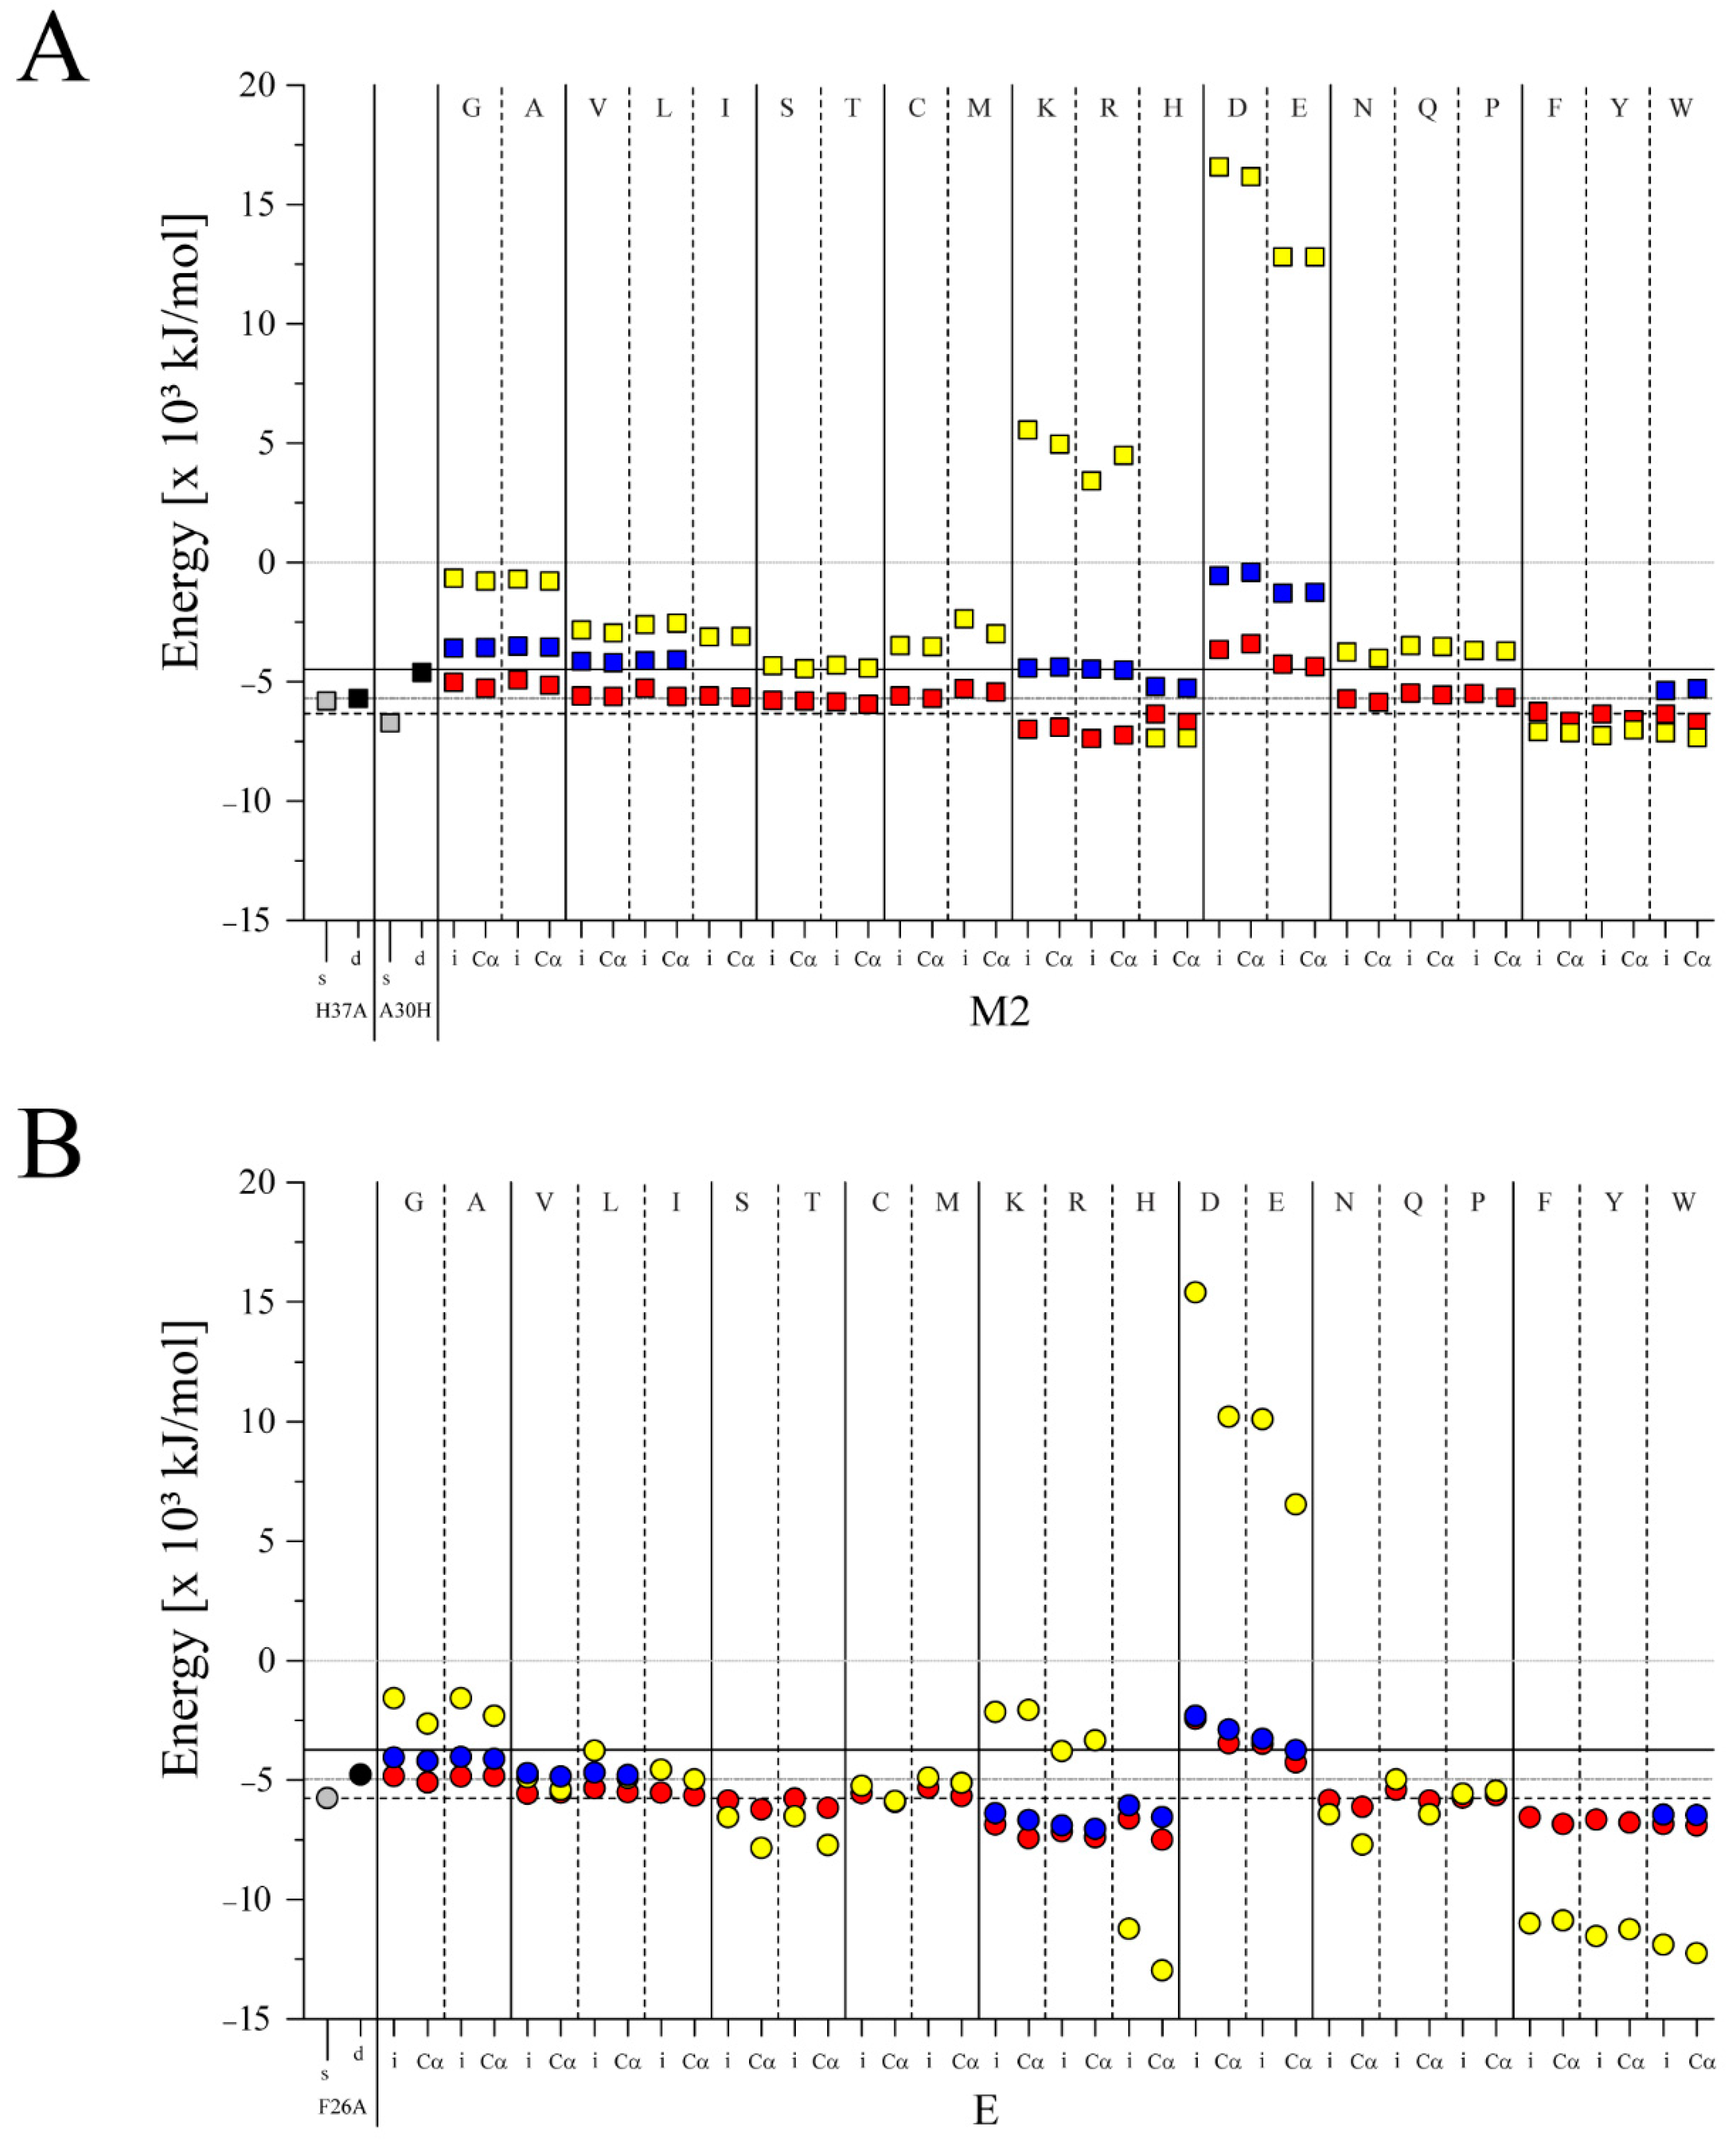
4.3. Ligand Docking
5. Conclusions
Supplementary Materials
Author Contributions
Funding
Institutional Review Board Statement
Informed Consent Statement
Acknowledgments
Conflicts of Interest
References
- Lehnert, U.; Xia, Y.; Royce, T.E.; Goh, C.-S.; Liu, Y.; Senes, A.; Yu, H.; Zhang, Z.L.; Engelman, D.M.; Gerstein, M. Computational analysis of membrane proteins: Genomic occurrence, structure prediction and helix interactions. Q. Rev. Biophys. 2004, 37, 121–146. [Google Scholar] [CrossRef] [PubMed]
- Yang, J.; Anishchenko, I.; Park, H.; Peng, Z.; Ovchinnikov, S.; Baker, D. Improved protein structure prediction using predicted interresidue orientations. Proc. Natl. Acad. Sci. USA 2020, 117, 1496–1503. [Google Scholar] [CrossRef] [PubMed]
- Qian, N.; Sejnowski, T.J. Predicting the secondary structure of globular proteins using neural network models. J. Mol. Biol. 1988, 202, 865–884. [Google Scholar] [CrossRef] [PubMed]
- Bokor, M.; Tantos, Á. Secondary Structures of Proteins: A Comparison of Models and Experimental Results. J. Proteome Res. 2021, 20, 1802–1808. [Google Scholar] [CrossRef]
- Wang, L.; Zhong, H.; Xue, Z.; Wang, Y. Improving the topology prediction of α-helical transmembrane proteins with deep transfer learning. Comput. Struct. Biotechnol. J. 2022, 20, 1993–2000. [Google Scholar]
- Baek, M.; DiMaio, F.; Anishchenko, I.; Dauparas, J.; Ovchinnikov, S.; Lee, G.R.; Wang, J.; Cong, Q.; Kinch, L.N.; Schaeffer, R.D.; et al. Accurate prediction of protein structures and interactions using a three-track neural network. Science 2021, 373, 871–876. [Google Scholar] [CrossRef]
- Jumper, J.; Evans, R.; Pritzel, A.; Green, T.; Figurnov, M.; Ronneberger, O.; Tunyasuvunakool, K.; Bates, R.; Žídek, A.; Potapenko, A.; et al. Highly accurate protein structure prediction with AlphaFold. Nature 2021, 596, 583–589. [Google Scholar] [CrossRef]
- Hegedűs, T.; Geisler, M.; Lukács, G.L.; Farkas, B. Ins and outs of AlphaFold2 transmembrane protein structure predictions. Cell. Mol. Life Sci. 2022, 79, 73. [Google Scholar] [CrossRef]
- Cerón-Carrasco, J.P. When Virtual Screening Yields Inactive Drugs: Dealing with False Theoretical Friends. Chem. Med. Chem. 2022, 17, e202200278. [Google Scholar] [CrossRef] [PubMed]
- Zev, S.; Raz, K.; Schwartz, R.; Tarabeh, R.; Gupta, P.K.; Major, D.T. Benchmarking the Ability of Common Docking Programs to Correctly Reproduce and Score Binding Modes in SARS-CoV-2 Protease Mpro. J. Chem. Inf. Model. 2021, 61, 2957–2966. [Google Scholar] [CrossRef]
- Laasch, N.; Kalita, M.M.; Griffin, S.; Fischer, W.B. Small molecule ligand docking to genotype specific bundle structures of hepatitis C virus (HCV) p7 protein. Comput. Biol. Chem. 2016, 64, 56–63. [Google Scholar] [CrossRef] [PubMed]
- Gaber, A.; Pavšič, M. Modeling and Structure Determination of Homo-Oligomeric Proteins: An Overview of Challenges and Current Approaches. Int. J. Mol. Sci. 2021, 22, 9081. [Google Scholar] [CrossRef]
- Cuthbertson, J.M.; Doyle, D.A.; Sansom, M.S.P. Transmembrane helix prediction: A comparative evaluation and analysis. Prot. Engin. Des. Sel. 2005, 18, 295–308. [Google Scholar] [CrossRef] [Green Version]
- Huang, T.-C.; Fischer, W.B. Sequence–function correlation of the transmembrane domains in NS4B of HCV using a computational approach. AMIS Biophys. 2021, 8, 165–181. [Google Scholar] [CrossRef]
- George, R.A.; Heringa, J. An analysis of protein domain linkers: Their classification and role in protein folding. Protein Eng. 2002, 15, 871–879. [Google Scholar] [CrossRef] [PubMed] [Green Version]
- Clarke, T.A.; Im, S.-C.; Bidwai, A.; Waskell, L. The role of the length and sequence of the linker domain of cytochrome b5 in stimulating cytochrome P450 2B4 catalysis. J. Biol. Chem. 2004, 279, 36809–36818. [Google Scholar] [CrossRef] [Green Version]
- Janoschke, M.; Zimmermann, M.; Brunauer, A.; Humble, R.; Junne, T.; Spiess, M. Efficient integration of transmembrane domains depends on the folding properties of the upstream sequences. Proc. Natl. Acad. Sci. USA 2021, 118, e2102675118. [Google Scholar] [CrossRef] [PubMed]
- Hu, Y.; Zhu, L.; Ma, C. Structural Roles for the Juxtamembrane Linker Region and Transmembrane Region of Synaptobrevin 2 in Membrane Fusion. Front. Cell Dev. Biol. 2021, 8, 609708. [Google Scholar] [CrossRef] [PubMed]
- Lang, S.M.; Nguyen, D.; Pfeffer, S.; Förster, F.; Helms, V.; Zimmermann, R. Functions and Mechanisms of the Human Ribosome-Translocon Complex. Subcell. Biochem. 2019, 93, 83–141. [Google Scholar] [PubMed]
- Cheng, Z.; Gilmore, R. Slow translocon gating causes cytosolic exposure of transmembrane and lumenal domains during membrane protein integration. Nature Struc. Biol. 2006, 13, 930–936. [Google Scholar] [CrossRef] [PubMed]
- Voorhees, R.M.; Fernández, I.S.; Scheres, S.H.W.; Hegde, R.S. Structure of the mammalian ribosome-Sec61 complex to 3.4 Å resolution. Cell 2014, 157, 1632–1643. [Google Scholar] [CrossRef]
- Gogala, M.; Becker, T.; Beatrix, B.; Armache, J.P.; Barrio-Garcia, C.; Berninghausen, O.; Beckmann, R. Structures of the Sec61 complex engaged in nascent peptide translocation or membrane insertion. Nature 2014, 506, 107–110. [Google Scholar] [CrossRef]
- Sadlish, H.; Pitonzo, D.; Johnson, A.E.; Skach, W.R. Sequential triage of transmembrane segments by Sec61α during biogenesis of a native multispanning membrane protein. Nature Struc. Mol. Biol. 2005, 12, 870–878. [Google Scholar] [CrossRef] [PubMed]
- Hurtley, S.M.; Helenius, A. Protein oligomerisation in the endoplasmic reticulum. Annu. Rev. Cell Biol. 1989, 5, 277–307. [Google Scholar] [CrossRef] [PubMed]
- Weisz, O.A.; Swift, A.M.; Machamer, C.E. Oligomerization of a membrane protein correlates with its retention in the Golgi complex. J. Cell Biol. 1993, 122, 1185–1196. [Google Scholar] [CrossRef]
- Meng, G.; Fronzes, R.; Chandran, V.; Remaut, H.; Waksman, G. Protein oligomerization in the bacterial outer membrane. Mol. Membr. Biol. 2009, 26, 136–145. [Google Scholar] [CrossRef]
- Walters, R.F.S.; DeGrado, W.F. Helix-packing motifs in membrane proteins. Proc. Natl. Acad. Sci. USA 2006, 203, 13658–13663. [Google Scholar] [CrossRef] [PubMed] [Green Version]
- Yin, H.; Slusky, J.S.; Berger, B.W.; Walters, R.S.; Vilaire, G.; Litvinov, R.I.; Lear, J.D.; Caputo, G.A.; Bennett, J.S.; DeGrado, W.F. Computational design of peptides that target transmembrane helices. Science 2007, 315, 1817–1823. [Google Scholar] [CrossRef] [Green Version]
- Surya, W.; Li, Y.; Torres, J. Structural model of the SARS coronavirus E channel in LMPG micelles. Biochim. Biophys. Acta 2018, 1860, 1309–1317. [Google Scholar] [CrossRef] [PubMed]
- OuYang, B.; Xie, S.; Berardi, M.J.; Zhao, X.; Dev, J.; Yu, W.; Sun, B.; Chou, J.J. Unusual architecture of the p7 channel from hepatitis C virus. Nature 2013, 498, 521–525. [Google Scholar] [CrossRef] [PubMed] [Green Version]
- Kern, D.M.; Sorum, B.; Mali, S.S.; Hoel, C.M.; Sridharan, S.; Remis, J.P.; Toso, D.B.; Kotecha, A.; Bautista, D.M.; Brohawn, S.G. Cryo-EM structure of SARS-CoV-2 ORF3a in lipid nanodiscs. Nat. Struct. Mol. Biol. 2021, 28, 573–582. [Google Scholar] [CrossRef] [PubMed]
- Patargias, G.; Zitzmann, N.; Dwek, R.; Fischer, W.B. Protein-protein interactions: Modeling the hepatitis C virus ion channel p7. J. Med. Chem. 2006, 49, 648–655. [Google Scholar] [CrossRef] [Green Version]
- Pinto, L.H.; Holsinger, L.J.; Lamb, R.A. Influenza virus M2 protein has ion channel activity. Cell 1992, 69, 517–528. [Google Scholar] [CrossRef] [PubMed]
- Wang, C.; Takeuchi, K.; Pinto, L.H.; Lamb, R.A. Ion channel activity of influenza A virus M2 protein: Characterization of the amantadine block. J. Virol. 1993, 67, 5585–5594. [Google Scholar] [CrossRef] [PubMed] [Green Version]
- van Damme, N.; Goff, D.; Katsura, C.; Jorgensen, R.L.; Mitchell, R.; Johnson, M.C.; Stephens, E.B.; Guatelli, J. The interferon-induced protein BST-2 restricts HIV-1 release and is downregulated from the cell surface by the viral Vpu protein. Cell Host Microbe 2008, 3, 245–252. [Google Scholar] [CrossRef] [Green Version]
- Neil, S.J.D.; Zang, T.; Bieniasz, P.D. Tetherin inhibits retrovirus release and is antagonized by HIV-1 Vpu. Nature 2008, 451, 425–431. [Google Scholar] [CrossRef] [PubMed] [Green Version]
- Nishimura, K.; Kim, S.; Zhang, L.; Cross, T.A. The closed state of a H+ channel helical bundle combining precise orientational and distance restraints from solid state NMR. Biochemistry 2002, 41, 13170–13177. [Google Scholar] [CrossRef] [PubMed]
- Dey, D.; Siddiqui, S.I.; Mamidi, P.; Ghosh, S.; Kumar, C.S.; Chattopadhyay, S.; Ghosh, S.; Banerjee, M. The effect of amantadine on an ion channel protein from Chikungunya virus. PLoS Negl. Trop. Dis. 2019, 13, e0007548. [Google Scholar] [CrossRef] [PubMed] [Green Version]
- Gan, S.-W.; Tan, E.; Lin, X.; Yu, D.; Wang, J.; Tan, G.M.-Y.; Vararattanavech, A.; Yeo, C.Y.; Soon, C.H.; Soong, T.W.; et al. The small hydrophobic protein of the human respiratory syncytial virus forms pentameric ion channels. J. Biol. Chem. 2012, 287, 24671–24689. [Google Scholar] [CrossRef] [PubMed] [Green Version]
- Park, S.H.; Mrse, A.A.; Nevzorov, A.A.; Mesleh, M.F.; Oblatt-Montal, M.; Montal, M.; Opella, S.J. Three-dimensional structure of the channel-forming trans-membrane domain of virus protein “u” (Vpu) from HIV-1. J. Mol. Biol. 2003, 333, 409–424. [Google Scholar] [CrossRef] [PubMed]
- Krüger, J.; Fischer, W.B. Assembly of viral membrane proteins. J. Chem. Theory Comput. 2009, 5, 2503–2513. [Google Scholar] [CrossRef] [PubMed]
- Duff, K.C.; Kelly, S.M.; Price, N.C.; Bradshaw, J.P. The secondary structure of influenza A M2 transmembrane domain. A circular dichroism study. FEBS Lett. 1992, 311, 256–258. [Google Scholar] [CrossRef] [PubMed] [Green Version]
- Kovacs, F.A.; Cross, T.A. Transmembrane four-helix bundle of influenza A M2 protein channel: Structural implications from helix tilt and orientation. Biophys. J. 1997, 73, 2511–2517. [Google Scholar] [CrossRef] [PubMed] [Green Version]
- Li, L.-H.; Hsu, H.-J.; Fischer, W.B. Qualitative computational bioanalytics: Assembly of viral channel-forming peptides around mono and divalent ions. Biochem. Biophys. Res. Commun. 2013, 442, 85–91. [Google Scholar] [CrossRef]
- Dobson, L.; Reményi, I.; Tusnády, G.E. CCTOP: A Consensus Constrained TOPology prediction web server. Nucleic Acids Res. 2015, 43, W408–W412. [Google Scholar] [CrossRef] [PubMed] [Green Version]
- Cserzö, M.; Wallin, E.; Simon, I.; Von Heijne, G.; Elofsson, A. Prediction of transmembrane alpha-helices in prokaryotic membrane proteins: The Dense Alignment Surface method. Protein Eng. 1997, 10, 673–676. [Google Scholar] [CrossRef] [Green Version]
- Cserzo, M.; Eisenhaber, F.; Eisenhaber, B.; Simon, I. TM or not TM: Transmembrane protein prediction with low false positive rate using DAS-TMfilter. Bioinformatics 2004, 20, 136–137. [Google Scholar] [CrossRef] [Green Version]
- Tusnády, G.E.; Simon, I. The HMMTOP transmembrane topology prediction server. Bioinformatics 2001, 17, 849–850. [Google Scholar] [CrossRef] [Green Version]
- Shen, H.; Chou, J.J. MemBrain: Improving the accuracy of predicting transmembrane helices. PLoS ONE 2008, 3, e2399. [Google Scholar] [CrossRef] [PubMed]
- Jones, D.T.; Taylor, W.R.; Thornton, J.M. A model recognition approach to the prediction of all-helical membrane protein structure and topology. Biochemistry 1994, 33, 3038–3049. [Google Scholar] [CrossRef]
- Jones, D.T. Improving the Accuracy of Transmembrane Protein Topology Prediction Using Evolutionary Information. Bioinformatics 2007, 23, 538–544. [Google Scholar] [CrossRef] [Green Version]
- Käll, L.; Krogh, A.; Sonnhammer, E.L.L. A combined transmembrane topology and signal peptide prediction method. J. Mol. Biol. 2004, 338, 1027–1036. [Google Scholar] [CrossRef]
- Daley, D.O.; Rapp, M.; Granseth, E.; Melén, K.; Drew, D.; von Heijne, G. Global Topology Analysis of the Escherichia coli Inner Membrane Proteome. Science 2005, 308, 1321–1323. [Google Scholar] [CrossRef] [Green Version]
- Viklund, H.; Elofsson, A. OCTOPUS: Improving topology prediction by two-track ANN-based preference scores and an extended topological grammar. Bioinformatics 2008, 24, 1662–1668. [Google Scholar] [CrossRef] [Green Version]
- Reynolds, S.M.; Käll, L.; Riffle, M.E.; Bilmes, J.A.; Noble, W.S. Transmembrane topology and signal peptide prediction using dynamic bayesian networks. PLoS Comput. Biol. 2008, 4, e1000213. [Google Scholar] [CrossRef] [PubMed] [Green Version]
- Käll, L.; Krogh, A.; Sonnhammer, E.L.L. An HMM Posterior Decoder for Sequence Feature Prediction That Includes Homology Information. Bioinformatics 2005, 21, i251–i257. [Google Scholar] [CrossRef]
- Viklund, H.; Elofsson, A. Best α-helical transmembrane protein topology predictions are achieved using hidden Markov models and evolutionary information. Protein Sci. 2004, 13, 1908–1917. [Google Scholar] [CrossRef] [PubMed]
- Peters, C.; Tsirigos, K.D.; Shu, N.; Elofsson, A. Improved Topology Prediction Using the Terminal Hydrophobic Helices Rule. Bioinformatics 2016, 32, 1158–1162. [Google Scholar] [CrossRef] [PubMed] [Green Version]
- Juretic, D.; Zoranic, L.; Zucic, D. Basic charge clusters and prediction of membrane protein topology. J. Chem. Inf. Comput. Sci. 2002, 42, 620–632. [Google Scholar] [CrossRef]
- Krogh, A.; Larsson, B.; von Heijne, G.; Sonnhammer, E.L.L. Predicting transmembrane protein topology with a hidden Markov model: Application to complete genomes. J. Mol. Biol. 2001, 305, 567–580. [Google Scholar] [CrossRef] [Green Version]
- Kahsay, R.Y.; Gao, G.; Liao, L. An improved hidden Markov model for transmembrane protein detection and topology prediction and its applications to complete genomes. Bioinformatics 2005, 21, 1853–1858. [Google Scholar] [CrossRef] [PubMed]
- Hofmann, K.; Stoffel, W. TMbase—A database of membrane spanning protein segments. Biol. Chem. Hoppe-Seyler 1993, 374, 166. [Google Scholar]
- Tsirigos, K.D.; Peters, C.J.; Shu, N.; Käll, L.; Elofsson, A. The TOPCONS web server for consensus prediction of membrane protein topology and signal peptides. Nucleic Acids Res. 2015, 43, W401–W407. [Google Scholar] [CrossRef] [PubMed]
- Buchan, D.W.A.; Jones, D.T. The PSIPRED Protein Analysis Workbench: 20 years on. Nucleic Acids Res. 2019, 47, W402–W407. [Google Scholar] [CrossRef] [Green Version]
- Monticelli, L.; Kandasamy, S.K.; Perioloe, X.; Larson, R.G.; Tieleman, D.P.; Marrink, S.J. The MARTINI coarse-grained force field: Extension to proteins. J. Chem. Theory Comput. 2008, 4, 819–834. [Google Scholar] [CrossRef]
- de Jong, D.H.; Singh, G.; Bennett, W.F.D.; Arnarez, C.; Wassenaar, T.A.; Schäfer, L.V.; Periole, X.; Tieleman, D.P.; Marrink, S.J. Improved parameters for the Martini coarse-grained protein force field. J. Comp. Theory Comput. 2013, 9, 687–697. [Google Scholar] [CrossRef]
- Cordomí, A.; Caltabiano, G.; Pardo, L. Membrane protein simulations using AMBER force field and Berger lipid parameters. J. Chem. Theory Comput. 2012, 8, 948–958. [Google Scholar] [CrossRef]
- Mirdita, M.; Schütze, K.; Moriwaki, Y.; Heo, L.; Ovchinnikov, S.; Steinegger, M. ColabFold: Making protein folding accessible to all. Nat. Methods 2022, 19, 679–682. [Google Scholar] [CrossRef]
- Baek, M.; Park, T.; Heo, L.; Park, C.; Seok, C. GalaxyHomomer: A web server for protein homo-oligomer structure prediction from a monomer sequence or structure. Nucleic Acids Res. 2017, 45, W320–W324. [Google Scholar] [CrossRef] [Green Version]
- McGuffin, L.J.; Adiyaman, R.; Maghrabi, A.H.A.; Shuid, A.N.; Brackenridge, D.A.; Nealon, J.O.; Philomina, L.S. IntFOLD: An integrated web resource for high performance protein structure and function prediction. Nucleic Acids Res. 2019, 47, W408–W413. [Google Scholar] [CrossRef]
- van Meer, G.; de Kroon, A.I.P.M. Lipid map of the mammalian cell. J. Cell Sci. 2011, 124, 5–8. [Google Scholar] [CrossRef] [PubMed] [Green Version]
- Evans, R.; O’Neill, M.; Pritzel, A.; Antropova, N.; Senior, A.; Green, T.; Žídek, A.; Bates, R.; Blackwell, S.; Yim, J.; et al. Protein complex prediction with AlphaFold-Multimer. bioRxiv 2021. [Google Scholar] [CrossRef]
- Mao, F.; Ni, W.; Xu, X.; Wang, H.; Wang, J.; Ji, M.; Li, J. Chemical Structure-Related Drug-Like Criteria of Global Approved Drugs. Molecules 2016, 21, 75. [Google Scholar] [CrossRef] [Green Version]
- Copolovici, D.M.; Langel, K.; Eriste, E.; Langel, Ü. Cell-penetrating peptides: Design, synthesis, and applications. ACS Nano 2014, 8, 1972–1994. [Google Scholar] [CrossRef]
- Patel, S.G.; Sayers, E.J.; He, L.; Narayan, R.; Williams, T.L.; Mills, E.M.; Allemann, R.K.; Luk, L.Y.P.; Jones, A.T.; Tsai, Y.-H. Cell-penetrating peptide sequence and modification dependent uptake and subcellular distribution of green florescent protein in different cell lines. Sci. Rep. 2019, 9, 6298. [Google Scholar] [CrossRef] [PubMed] [Green Version]
- de Jong, H.; Bonger, K.M.; Löwik, D.W.P.M. Activatable cell-penetrating peptides: 15 years of research. RSC Chem. Biol. 2020, 1, 192–203. [Google Scholar] [CrossRef] [PubMed]
- Xie, J.; Bi, Y.; Zhang, H.; Dong, S.; Teng, L.; Lee, R.J.; Yang, Z. Cell-Penetrating Peptides in Diagnosis and Treatment of Human Diseases: From Preclinical Research to Clinical Application. Front. Pharmacol. 2020, 11, 697. [Google Scholar] [CrossRef] [PubMed]


| Oligomer | AA | CG | AA-MD | |
|---|---|---|---|---|
| M2 | 4i | 1 * (1.29, L) [12.20] | 19 * (1.22, L) [6.36] | 4 * (1.66, L) [34.82] |
| 4e (L) [37.73 ± 0.24] | 1 * (0.42, L) [10.04] | 43 * (0.64, L) [13.29] | 20 * (1.56, L) [22.76] | |
| E | 5p | 53 * (0.45, R) [32.24] | 9 * (0.83, R) [53.51] | 51 * (1.87, R) [40.68] |
| 5e (R) [21.69 ± 8.05] | 12 * (2.67, R) [24.31] | 45 * (2.33, R) [21.63] | - | |
| 6Kp | 6 | 1 | 59 | 1 |
| SHp | 5 | 1 | 1 | 15 |
| SHe | 5 | 1 | 1 | 1 |
| Vpu32 | 4 | 7 | 2 | 244 |
| 5 | 3 | 1 | 145 | |
| 6 | 3 | 1 | 24 | |
| Vpu28 | 4 | 14 | 1 | 67 |
| 5 | 14 | 1 | 4 | |
| 6 | 15 | 2 | 15 | |
| Vpue | 4 | 6 | 1 | 41 |
| 5 | 19 | 1 | 2 | |
| 6 | 8 | 3 | 1 | |
| Vpup | 4 | 1 | 2 | 5 |
| 5 | 2 | 16 | 12 | |
| 6 | 2 | 1 | 2 |
| M2 | |||||
|---|---|---|---|---|---|
| Crystal Structure (L) [37.73 ± 0.24] | |||||
| Rank 1 | Rank 2 | Rank 3 | Rank 4 | Rank 5 | |
| PICA (M2e) | (1.29, L) [12.20] | (1.28, L) [12.11] | (1.30, L) [12.30] | (1.30, -) [3.99] | (1.35, -) [5.19] |
| CF | (1.34, L) [30.87 ± 11.76] | (1.33, L) [24.32 ± 0.06] | (0.41, L) [30.53 ± 1.68] | (0.34, L) [27.49 ± 1.04] | (1.61, -) [88.83 ± 51.20] |
| GH | (0.40, L) [28.15 ± 0.30] | (0.32, L) [33.68 ± 13.72] | (0.88, R) [5.52 ± 2.11] | (0.60, L) [26.69 ± 2.89] | (1.11, R) [27.42 ± 3.55] |
| E | |||||
| Crystal structure (R) [21.69 ± 8.05] | |||||
| PICA (Ee) | (0.98, R) [48.10] | (1.22, L) [43.51] | (1.26, R) [54.51] | (1.29, L) [47.94] | (1.62, L) [54.16] |
| Rank 53 (0.45, R) [32.24] | |||||
| CF | (1.51, L) [1.07 ± 0.36] | (1.49, R) [3.02 ± 0.48] | (1.38, L) [7.29 ± 0.32] | (1.50, R) [7.48 ± 3.72] | (1.62, R) [23.68 ± 7.25] |
| GH | (1. 14, L) [30.47 ± 1.44] | (1.11, L) [25.84 ± 5.63] | (1.56, R) [24.27 ± 1.55] | (0.72, R) [11.60 ± 2.53] | (0.62, R) [19.71 ± 0.86] |
Publisher’s Note: MDPI stays neutral with regard to jurisdictional claims in published maps and institutional affiliations. |
© 2022 by the authors. Licensee MDPI, Basel, Switzerland. This article is an open access article distributed under the terms and conditions of the Creative Commons Attribution (CC BY) license (https://creativecommons.org/licenses/by/4.0/).
Share and Cite
Huang, T.-C.; Fischer, W.B. Predicting the Assembly of the Transmembrane Domains of Viral Channel Forming Proteins and Peptide Drug Screening Using a Docking Approach. Biomolecules 2022, 12, 1844. https://doi.org/10.3390/biom12121844
Huang T-C, Fischer WB. Predicting the Assembly of the Transmembrane Domains of Viral Channel Forming Proteins and Peptide Drug Screening Using a Docking Approach. Biomolecules. 2022; 12(12):1844. https://doi.org/10.3390/biom12121844
Chicago/Turabian StyleHuang, Ta-Chou, and Wolfgang B. Fischer. 2022. "Predicting the Assembly of the Transmembrane Domains of Viral Channel Forming Proteins and Peptide Drug Screening Using a Docking Approach" Biomolecules 12, no. 12: 1844. https://doi.org/10.3390/biom12121844