
Cancer-Related Intracellular Signalling Pathways Activated by DOXorubicin/Cyclodextrin-Graphene-Based Nanomaterials

 ,
,  , , , and
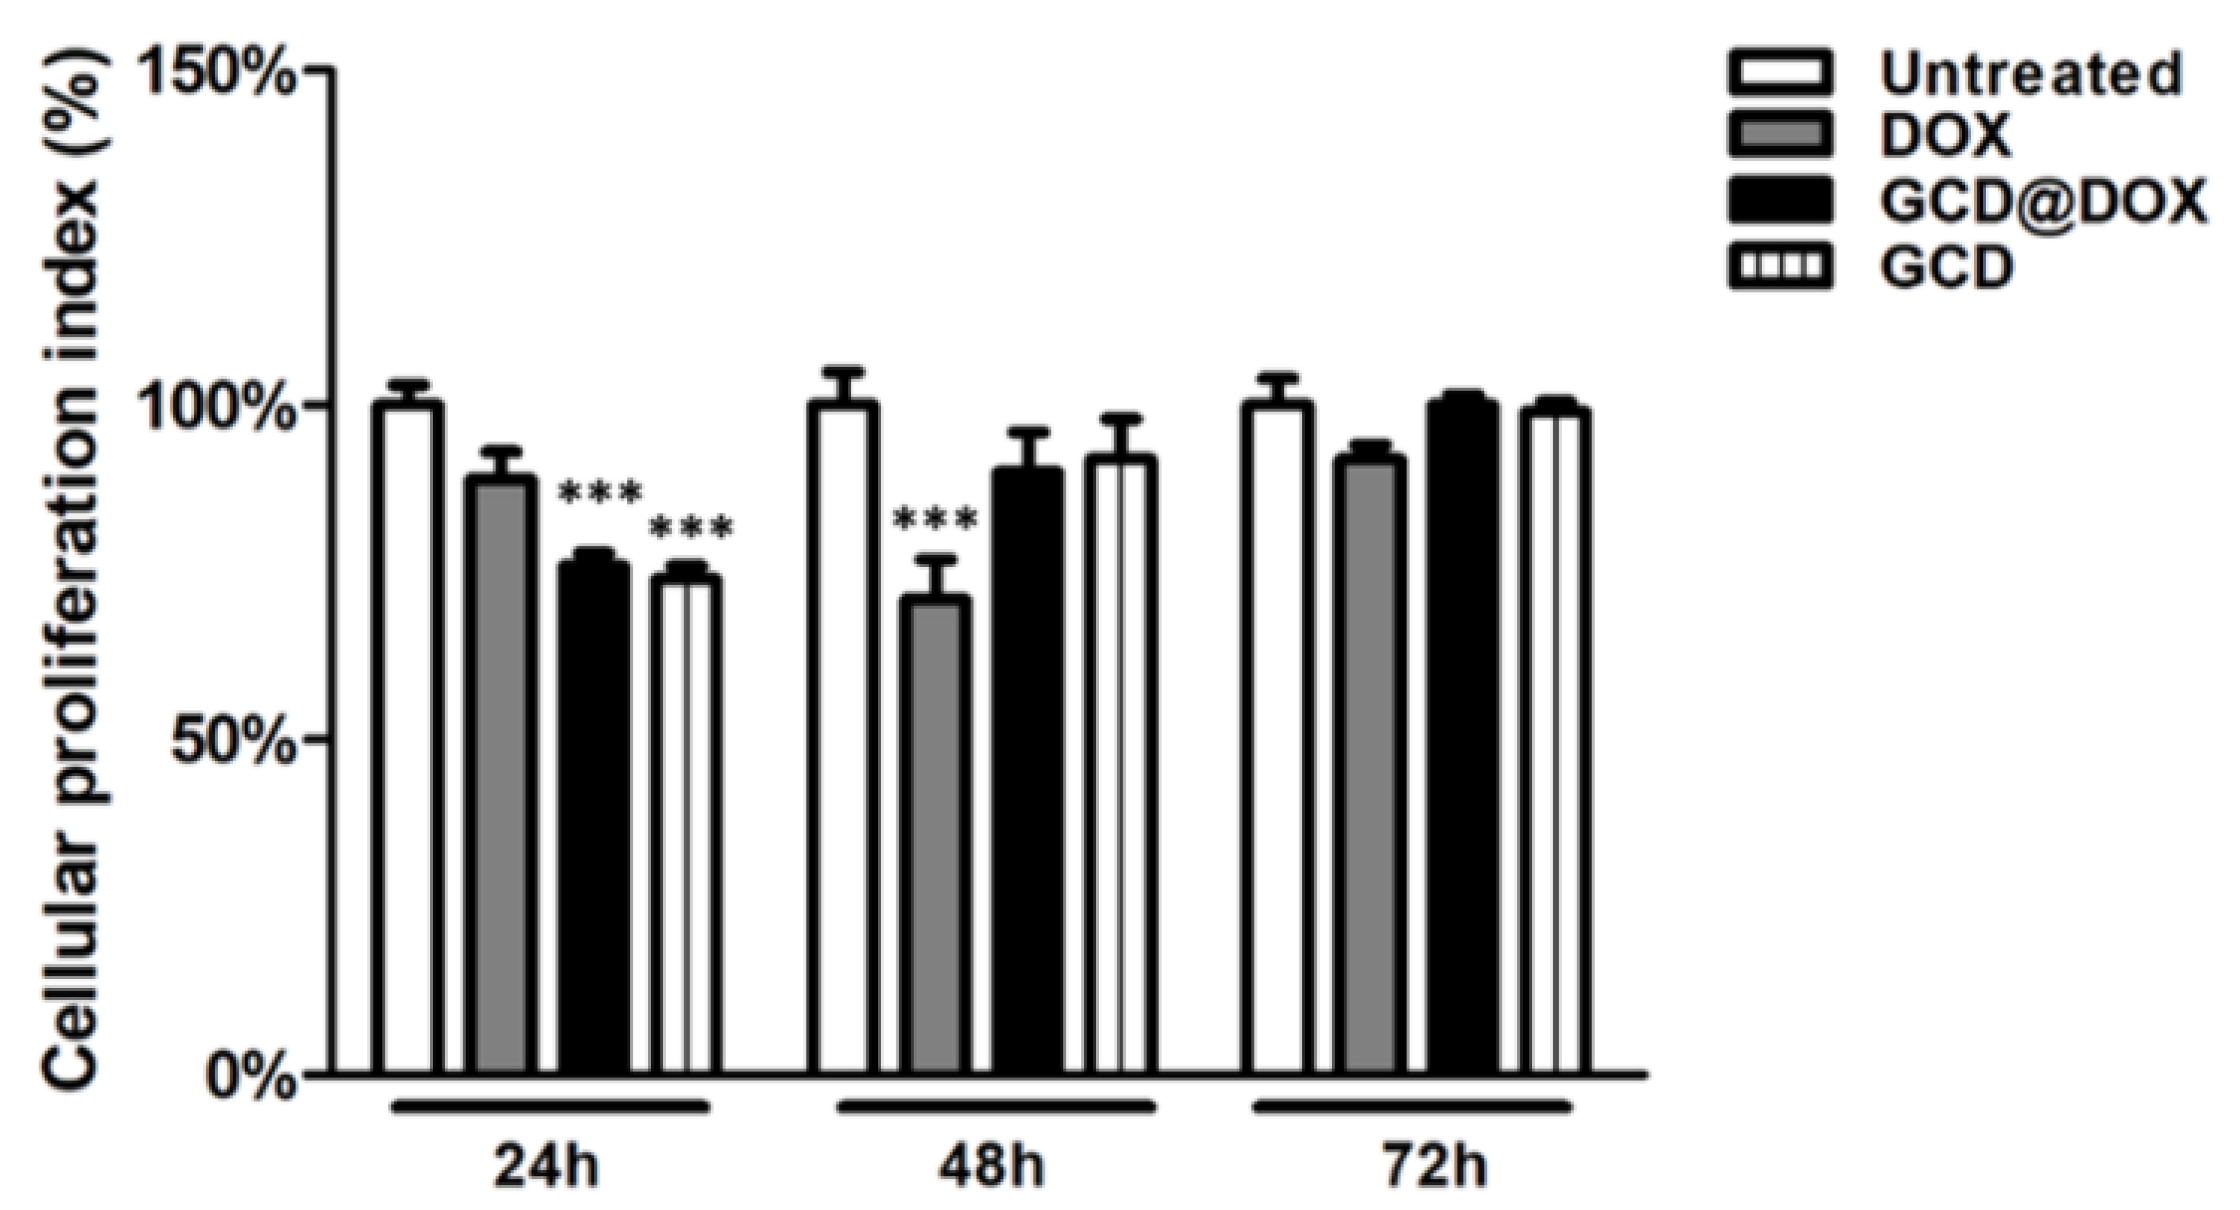
Abstract
:1. Introduction
2. Materials and Methods
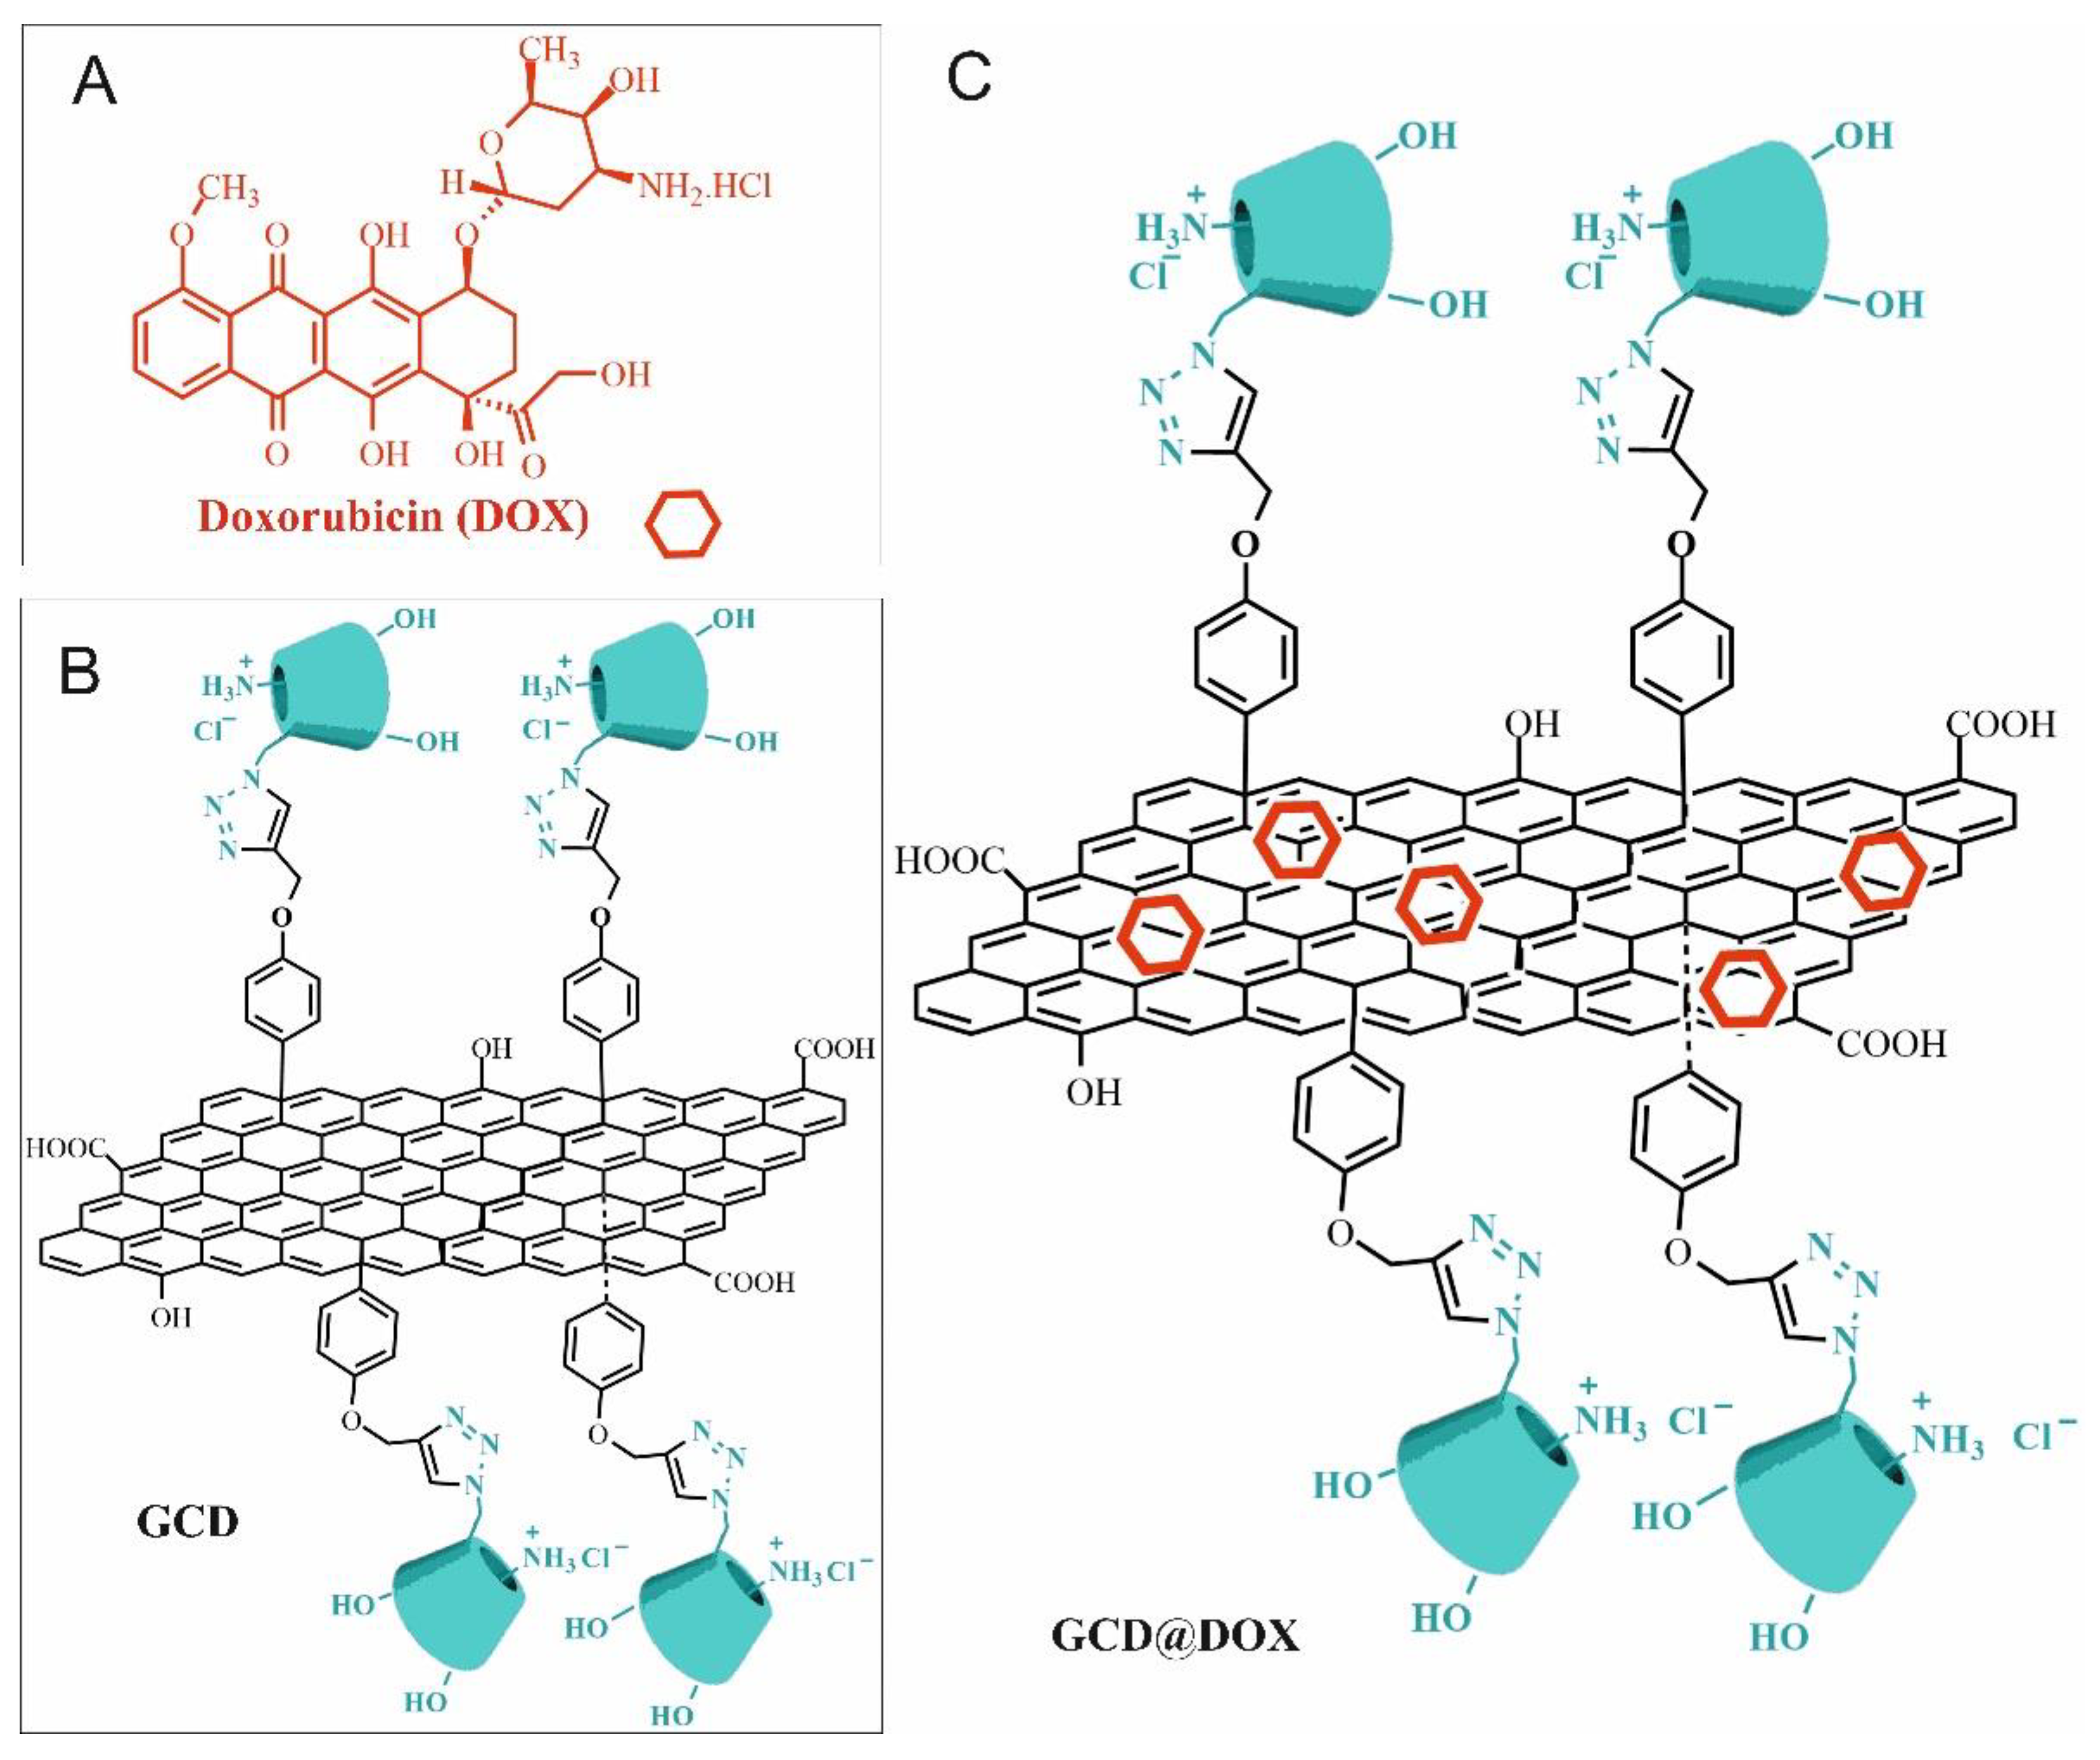
2.1. Synthesis of Drug-Loaded GCD
2.2. Cell Cultures
2.3. Antibodies
2.4. Protein Extractions and Immunoblot Analysis
2.5. Cell Viability Assay
2.6. Acridine Orange Assay
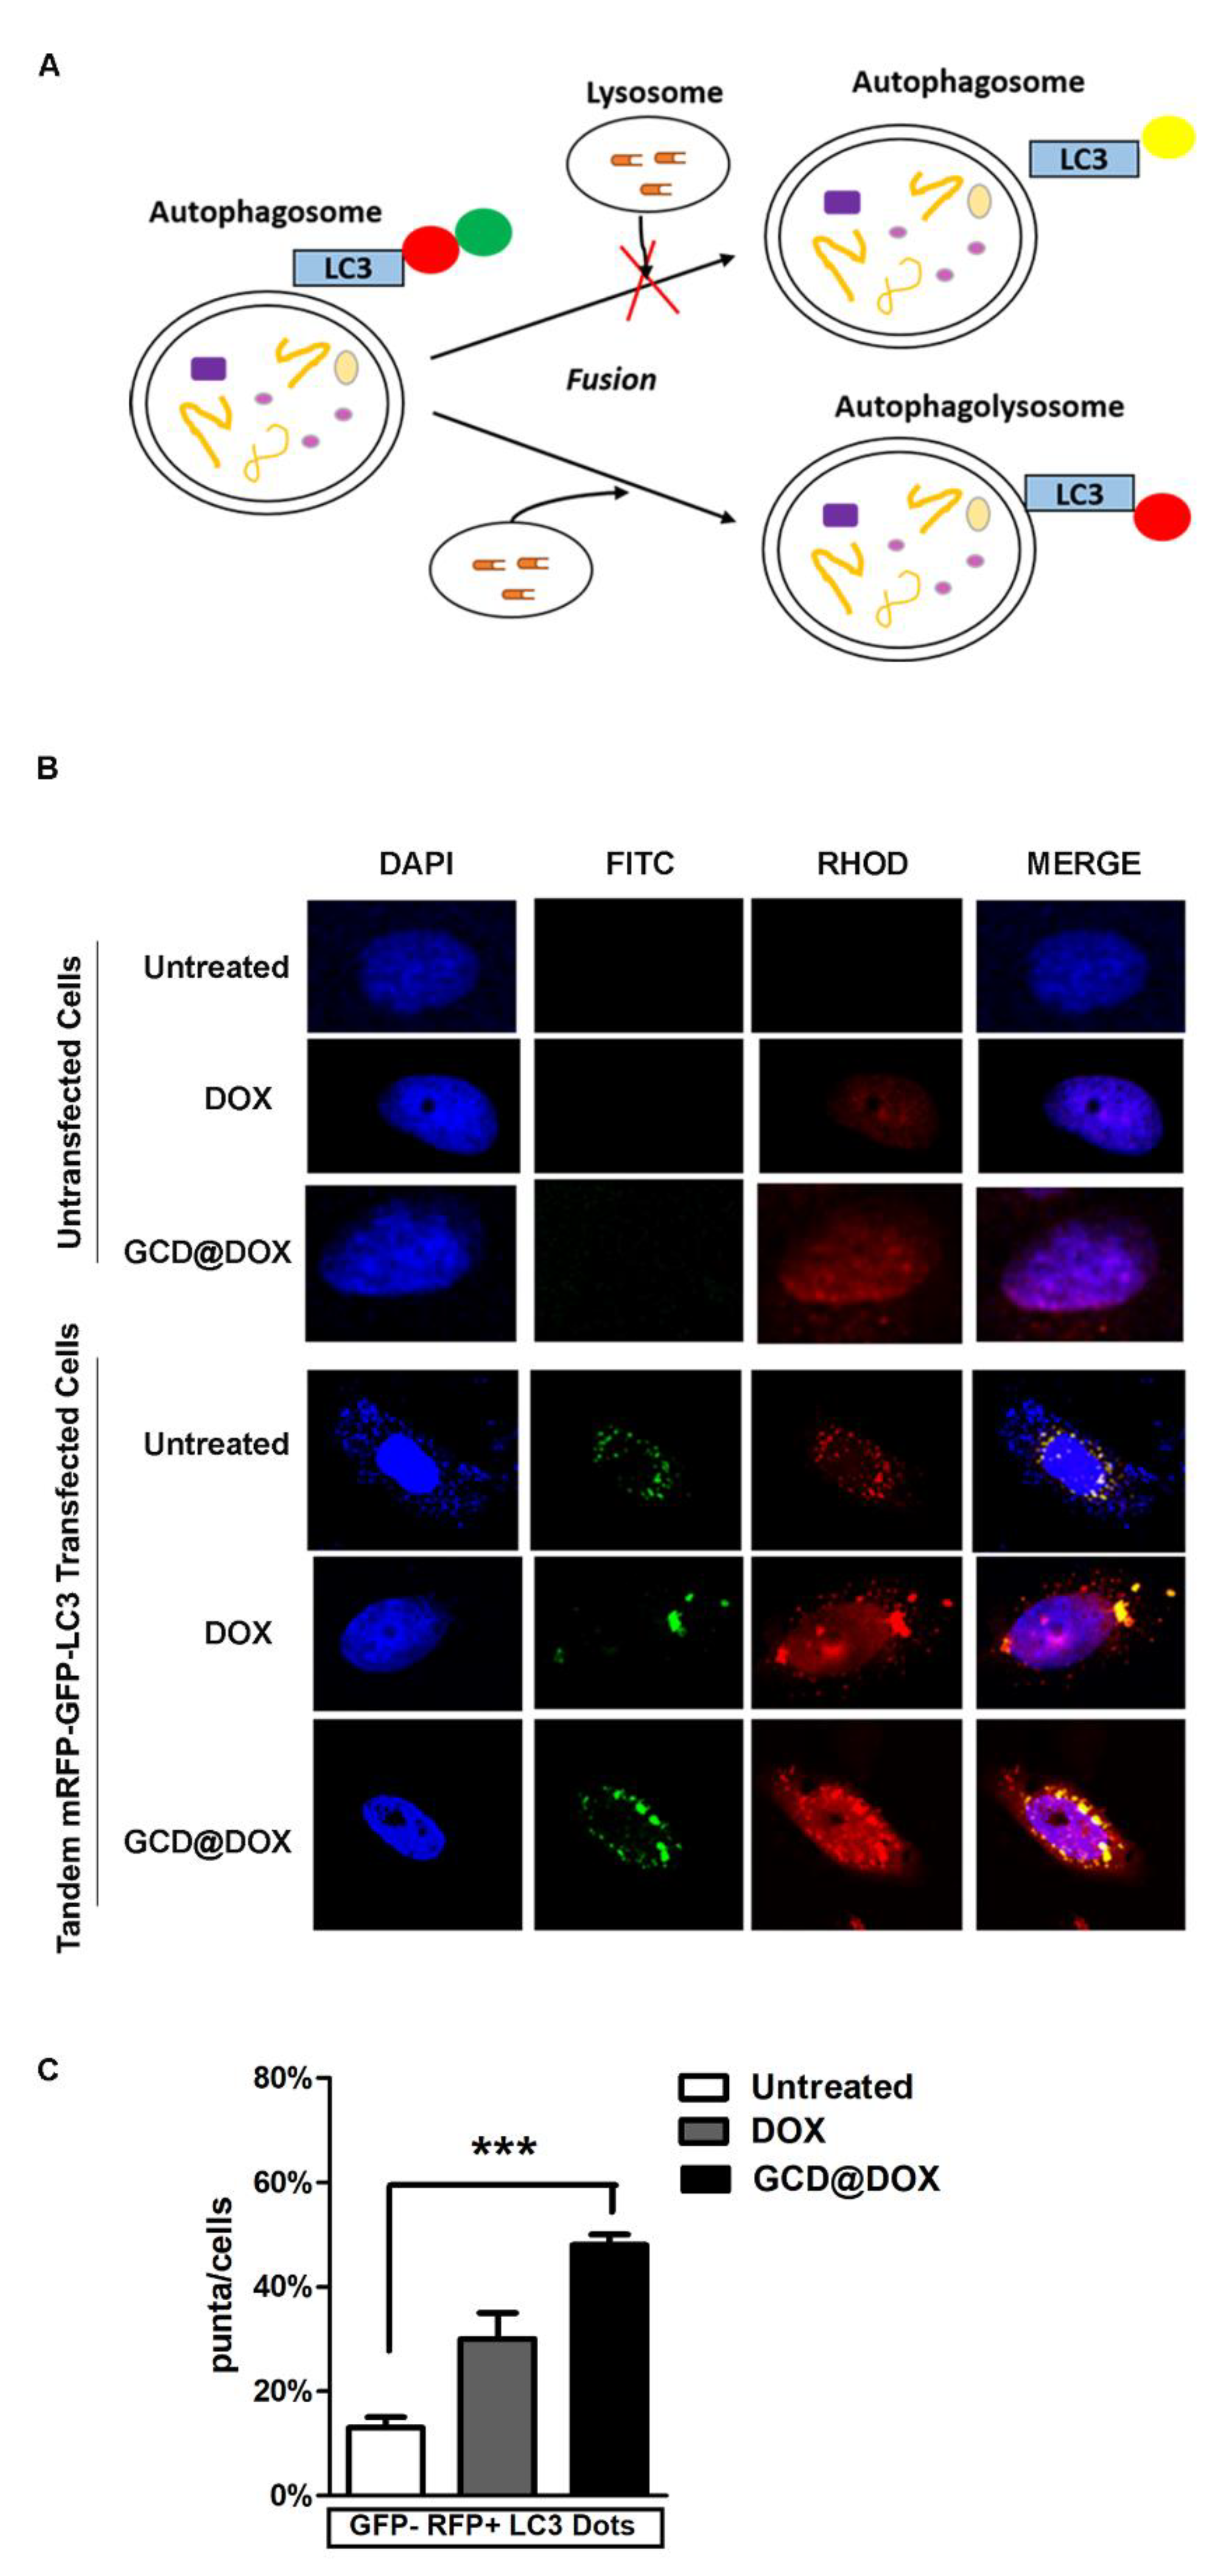
2.7. Evaluation of Autophagy by Tandem mRFP-GFP-LC3 and by LC3-I, LC3-II/SQSTM-p62 Autophagy-Related Protein Detection
3. Results
3.1. In Vitro Evaluation of DOX, GCD and GCD@DOX Biocompatibility
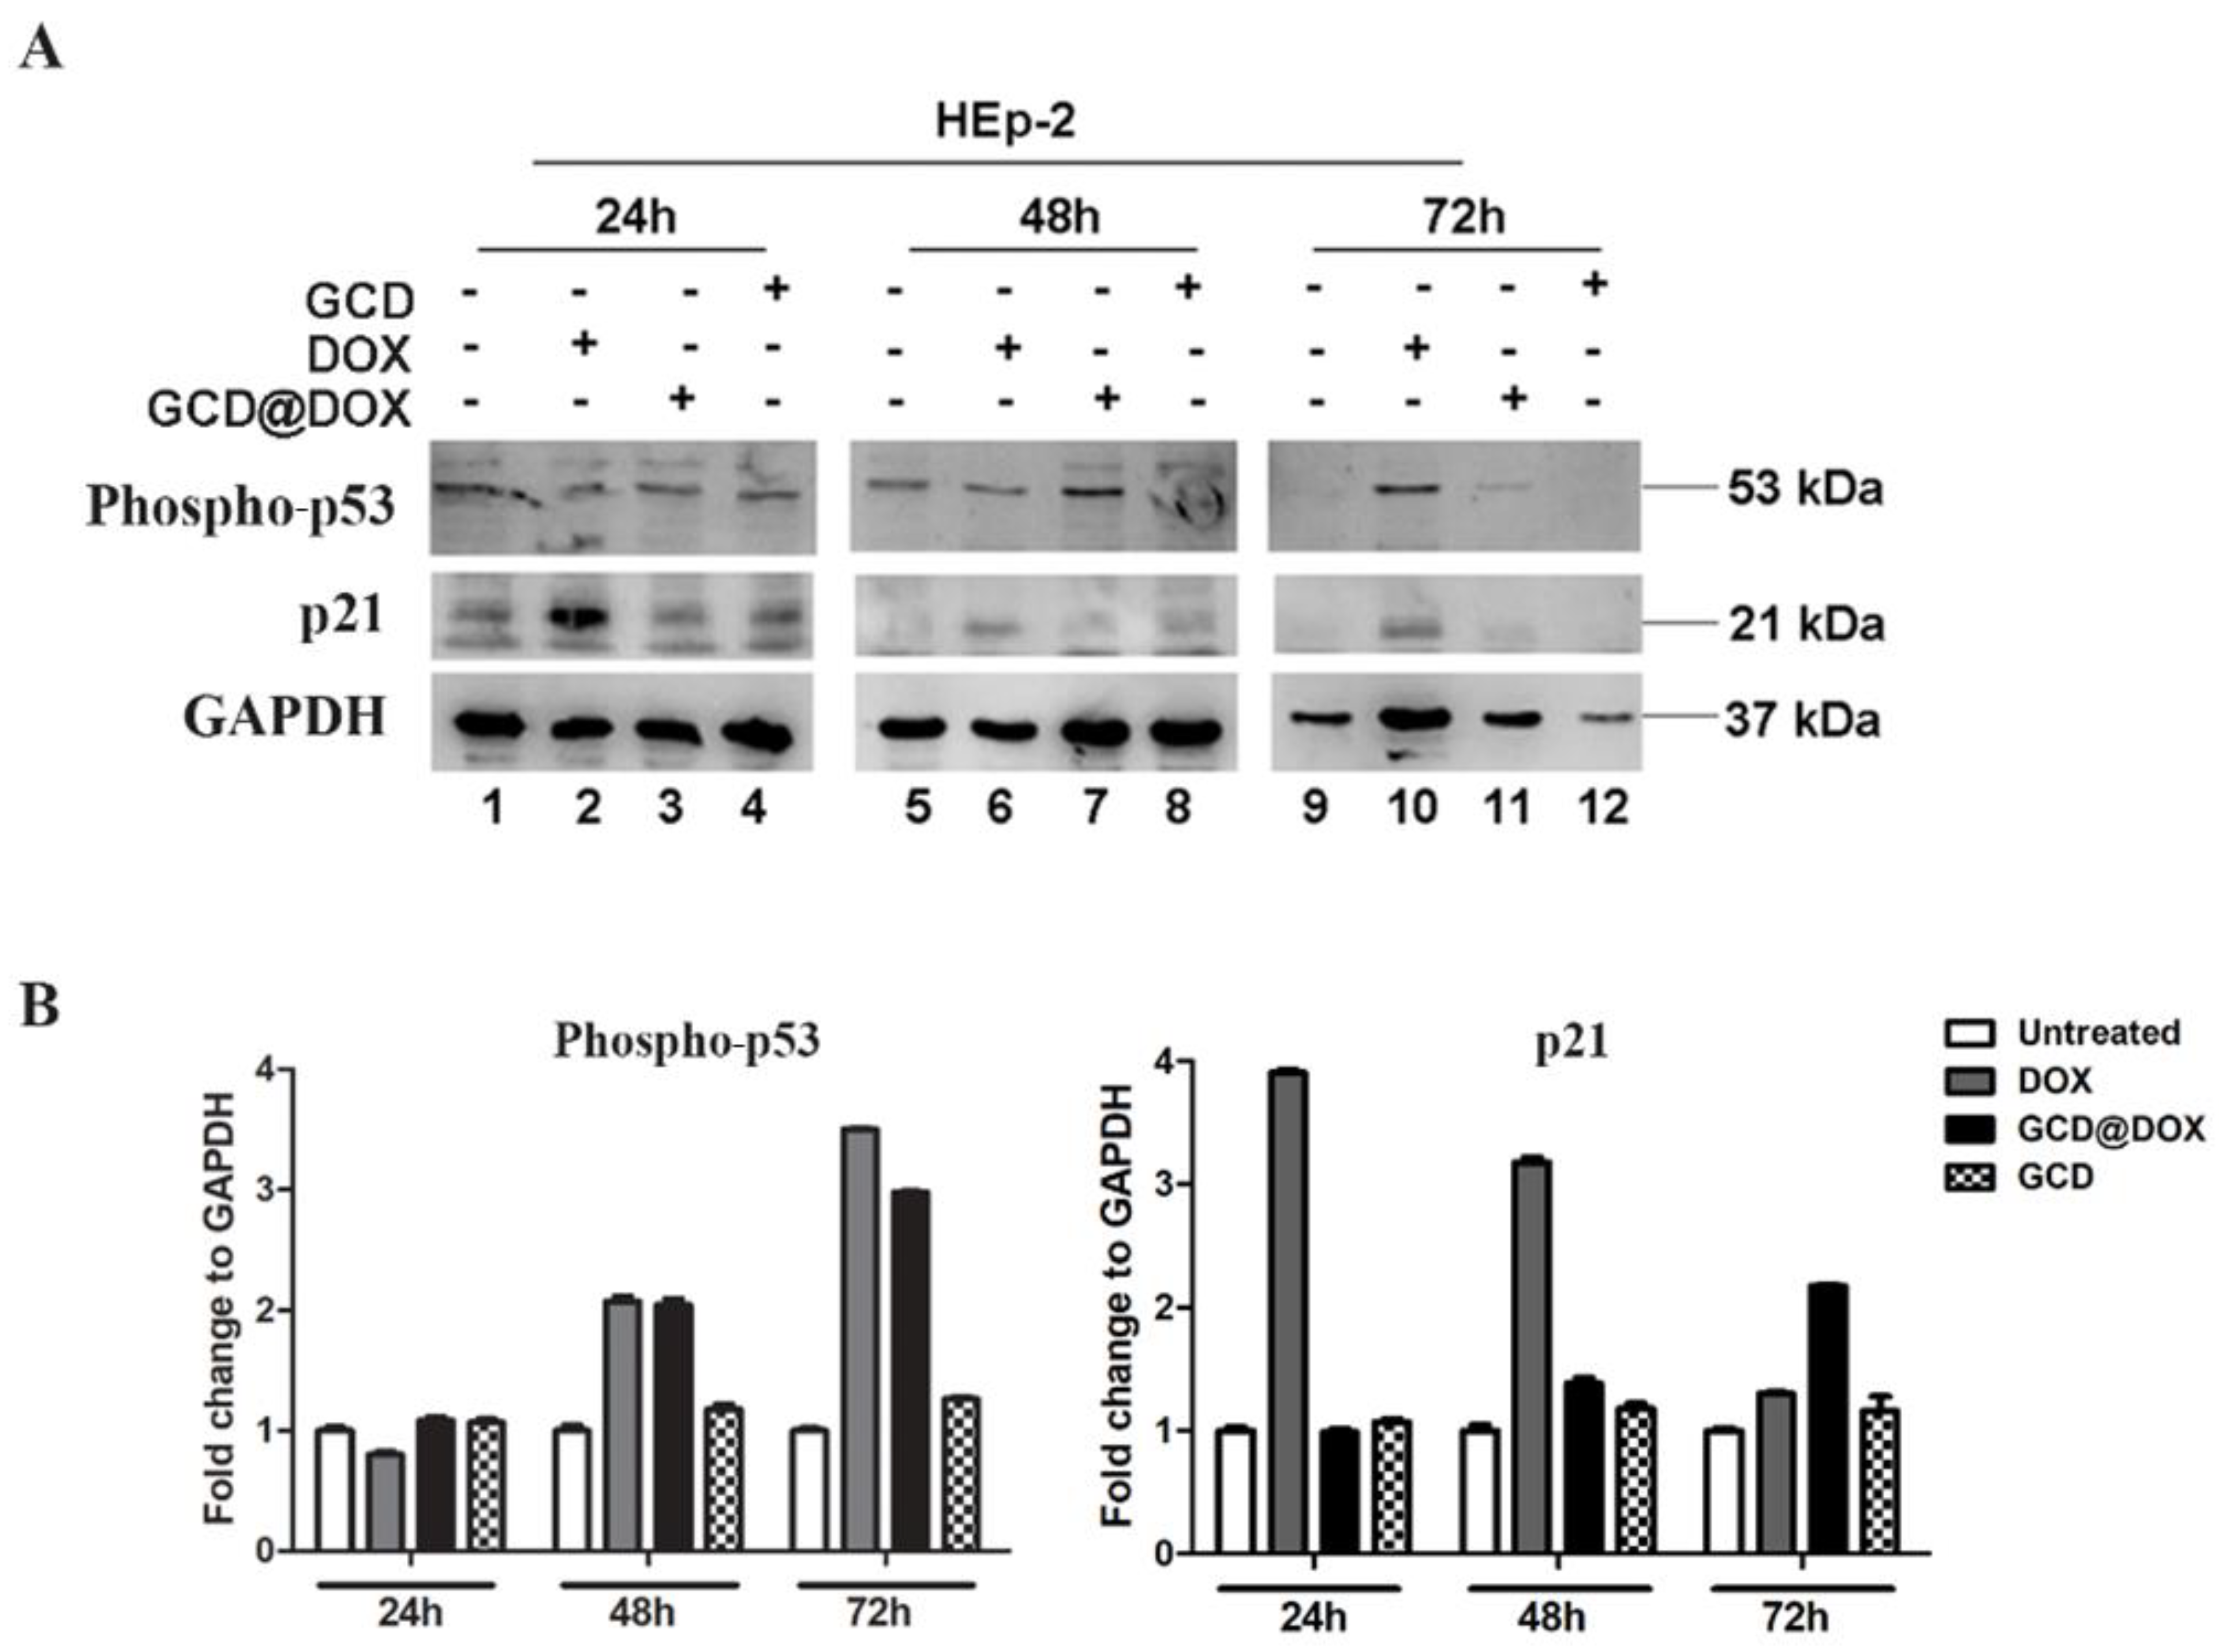
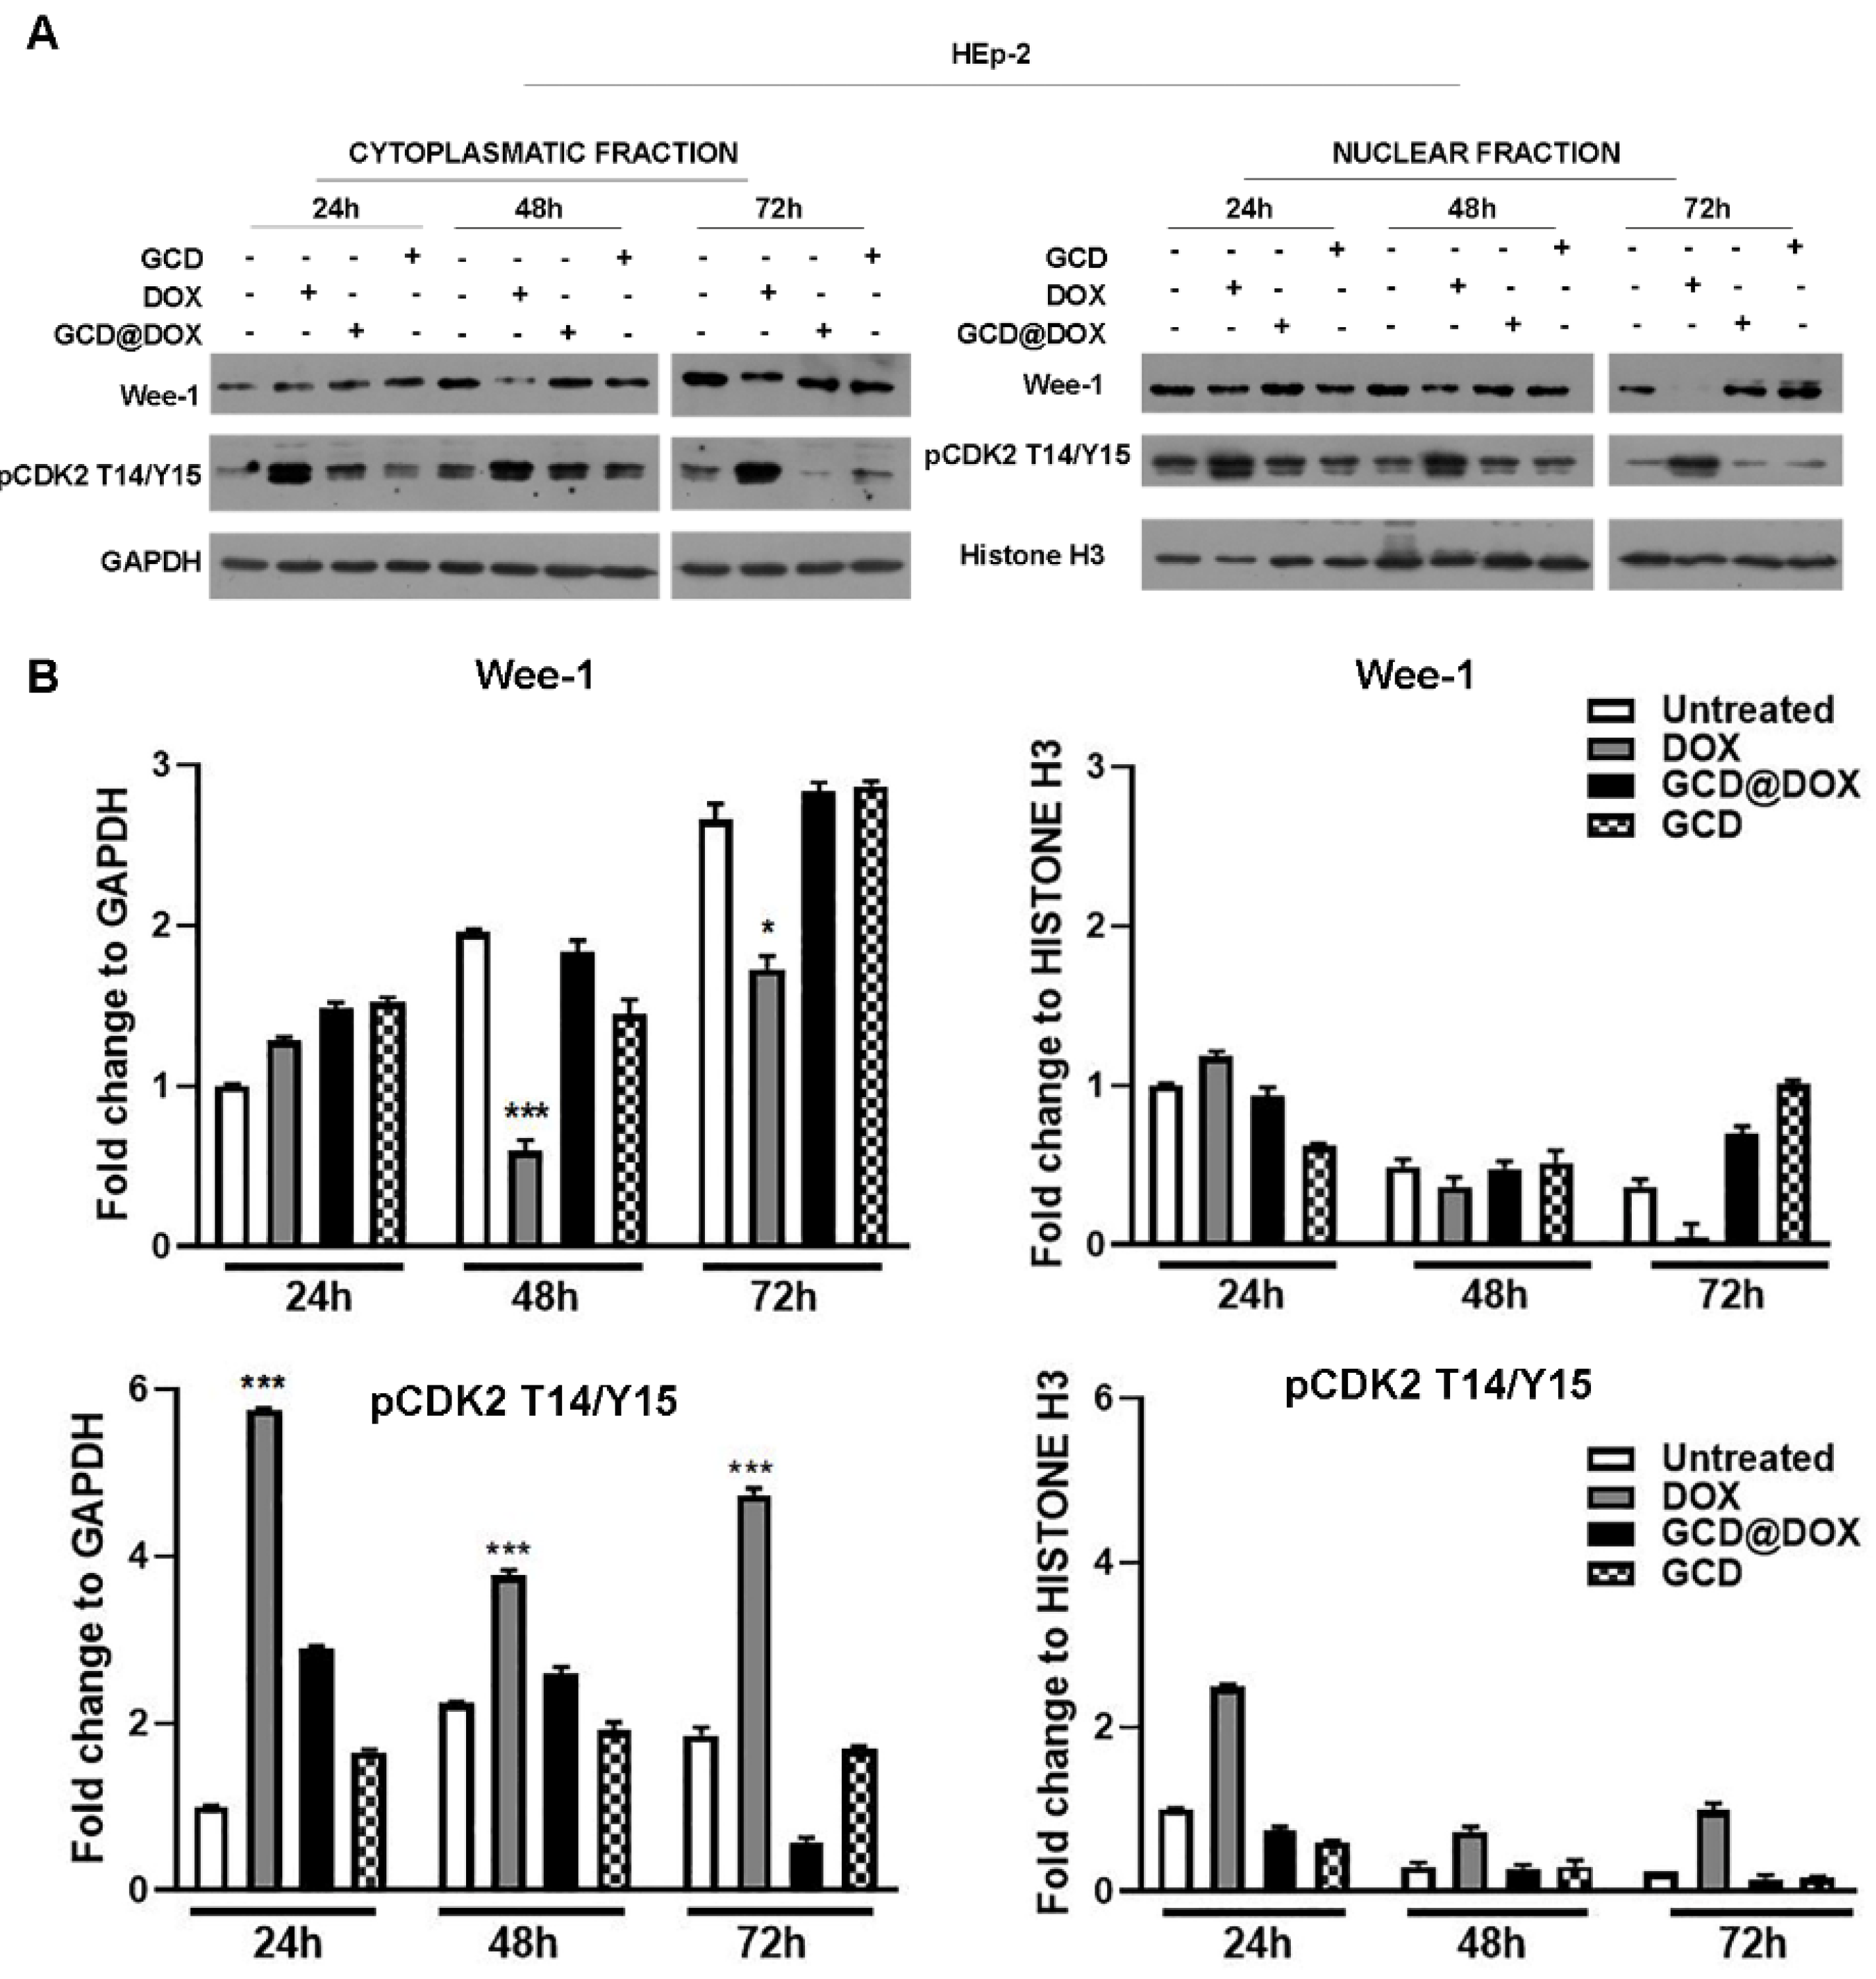
3.2. Investigation of p53 and Wee-1 Signalling Mediated by DOX, GCD and GCD@DOX Treatment
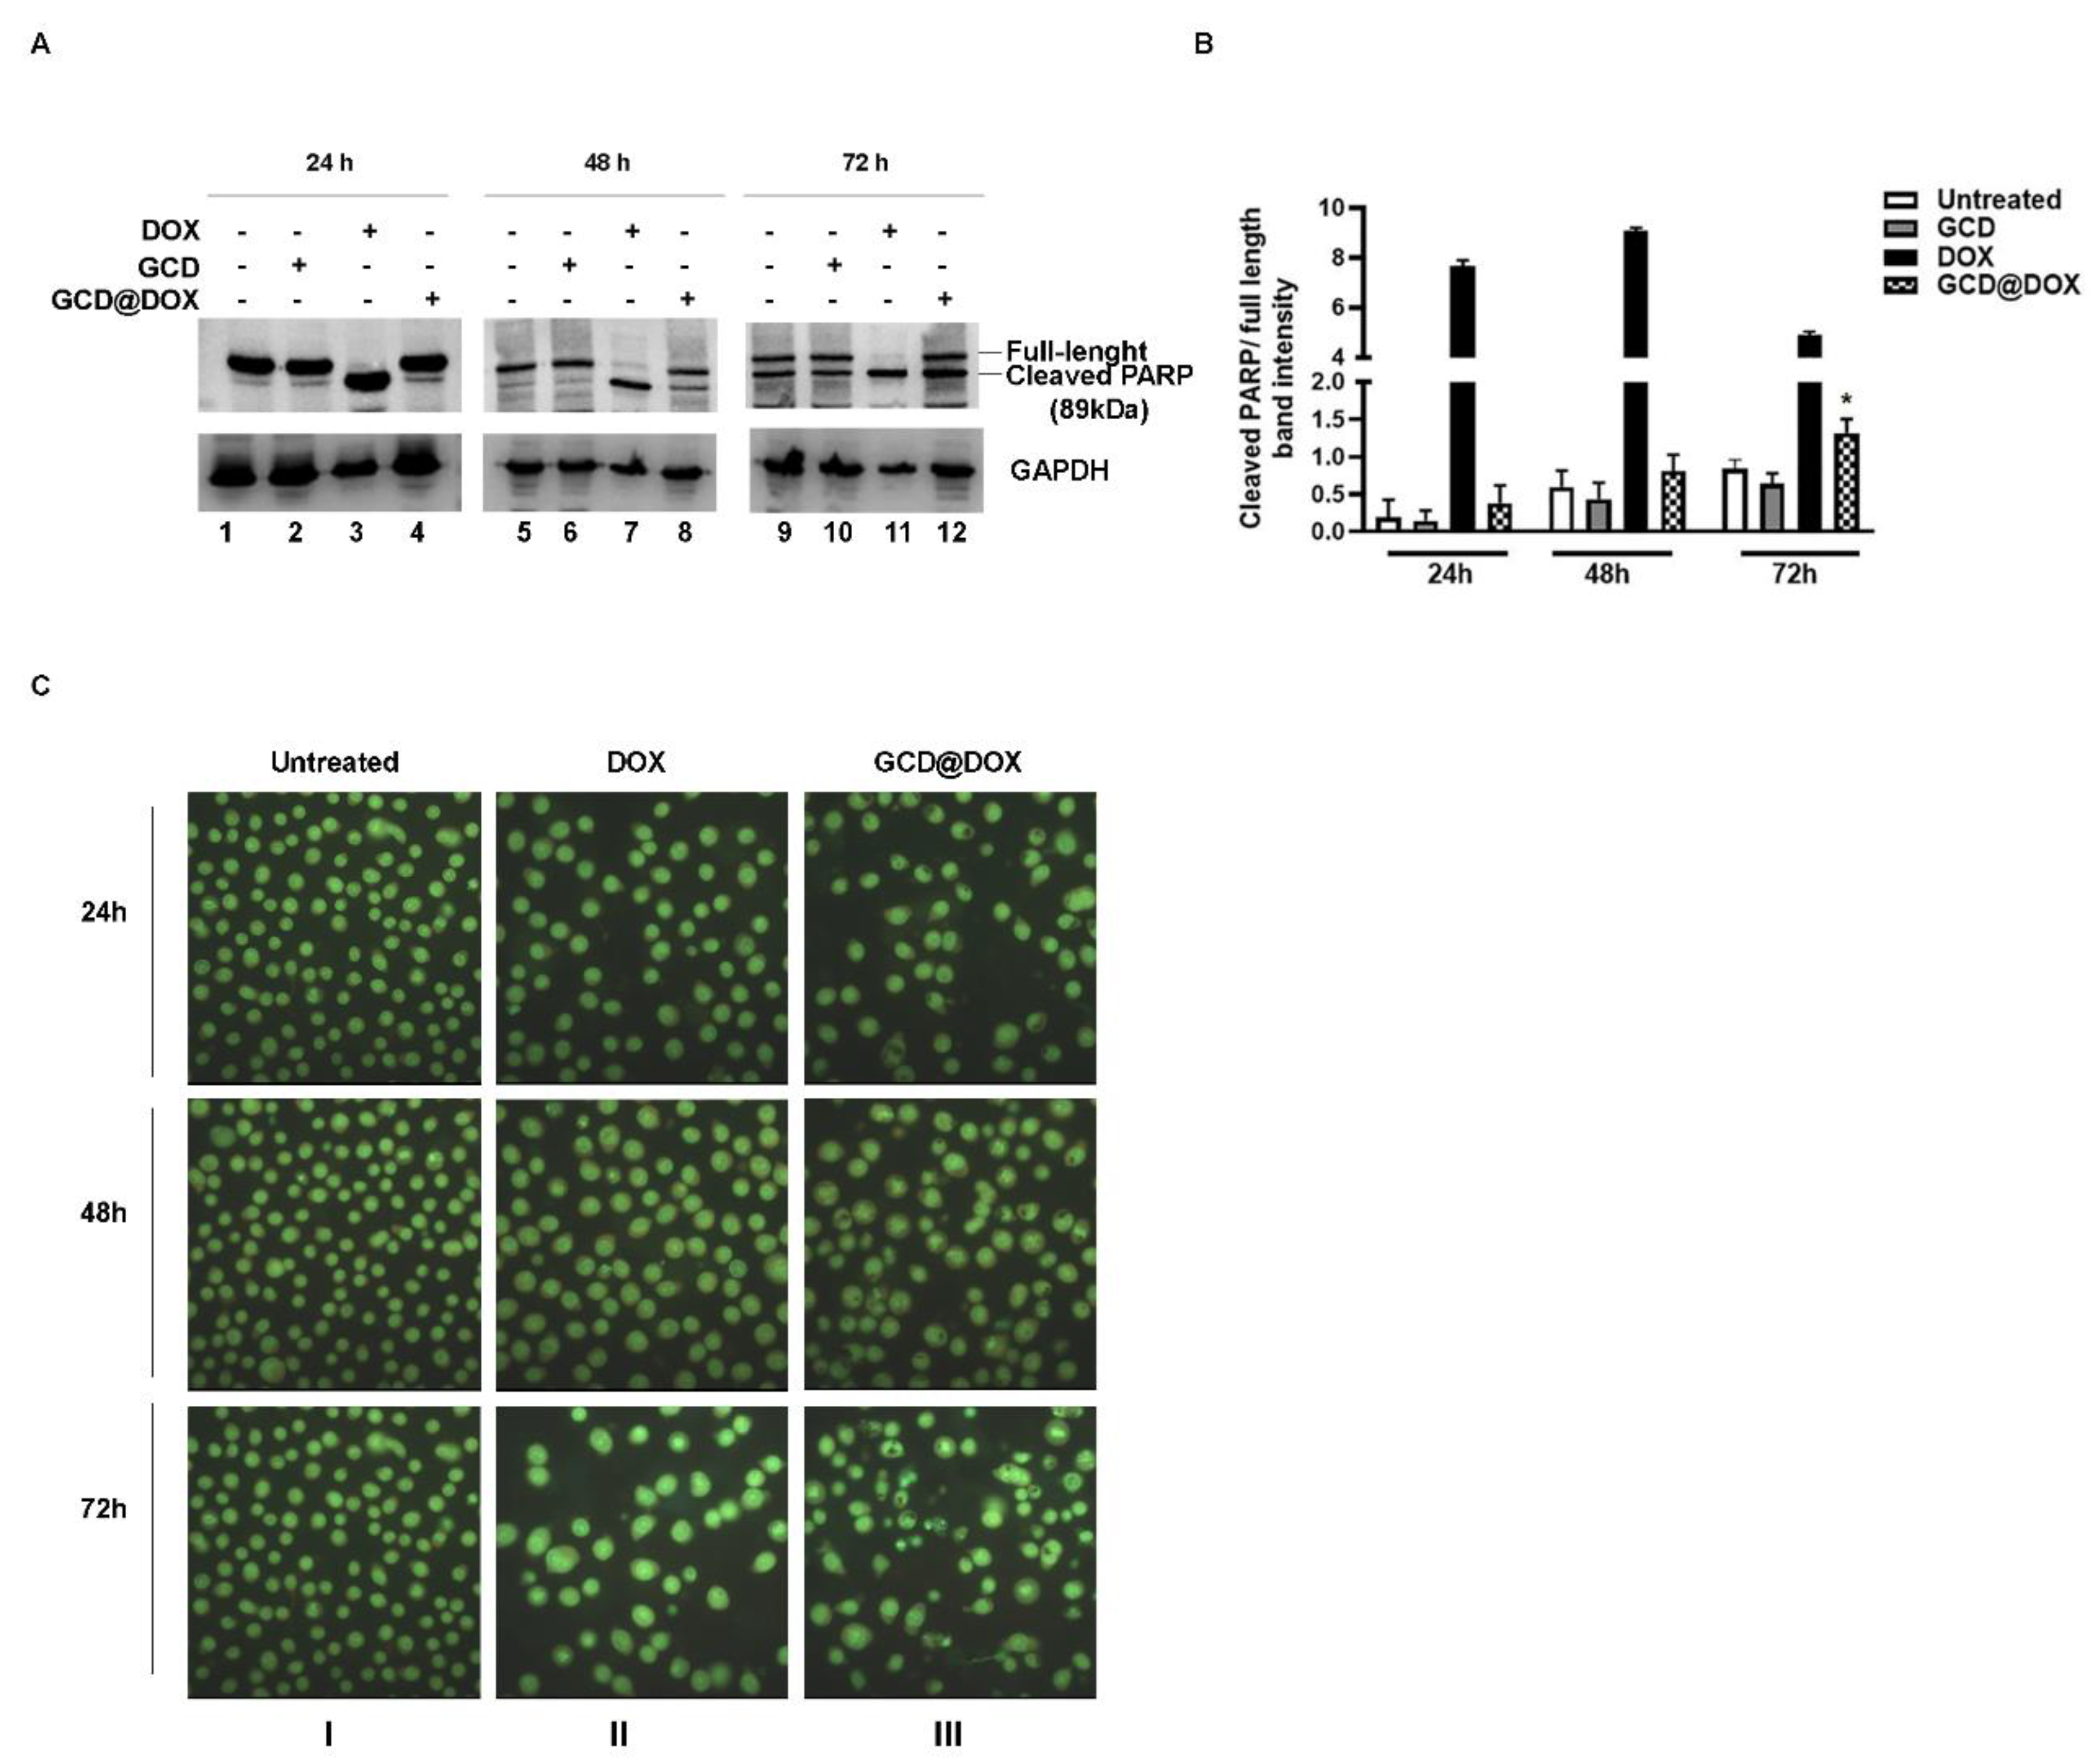
3.3. Programmed Cell Death in HEp-2 Cells following DOX, GCD and GCD@DOX Treatment
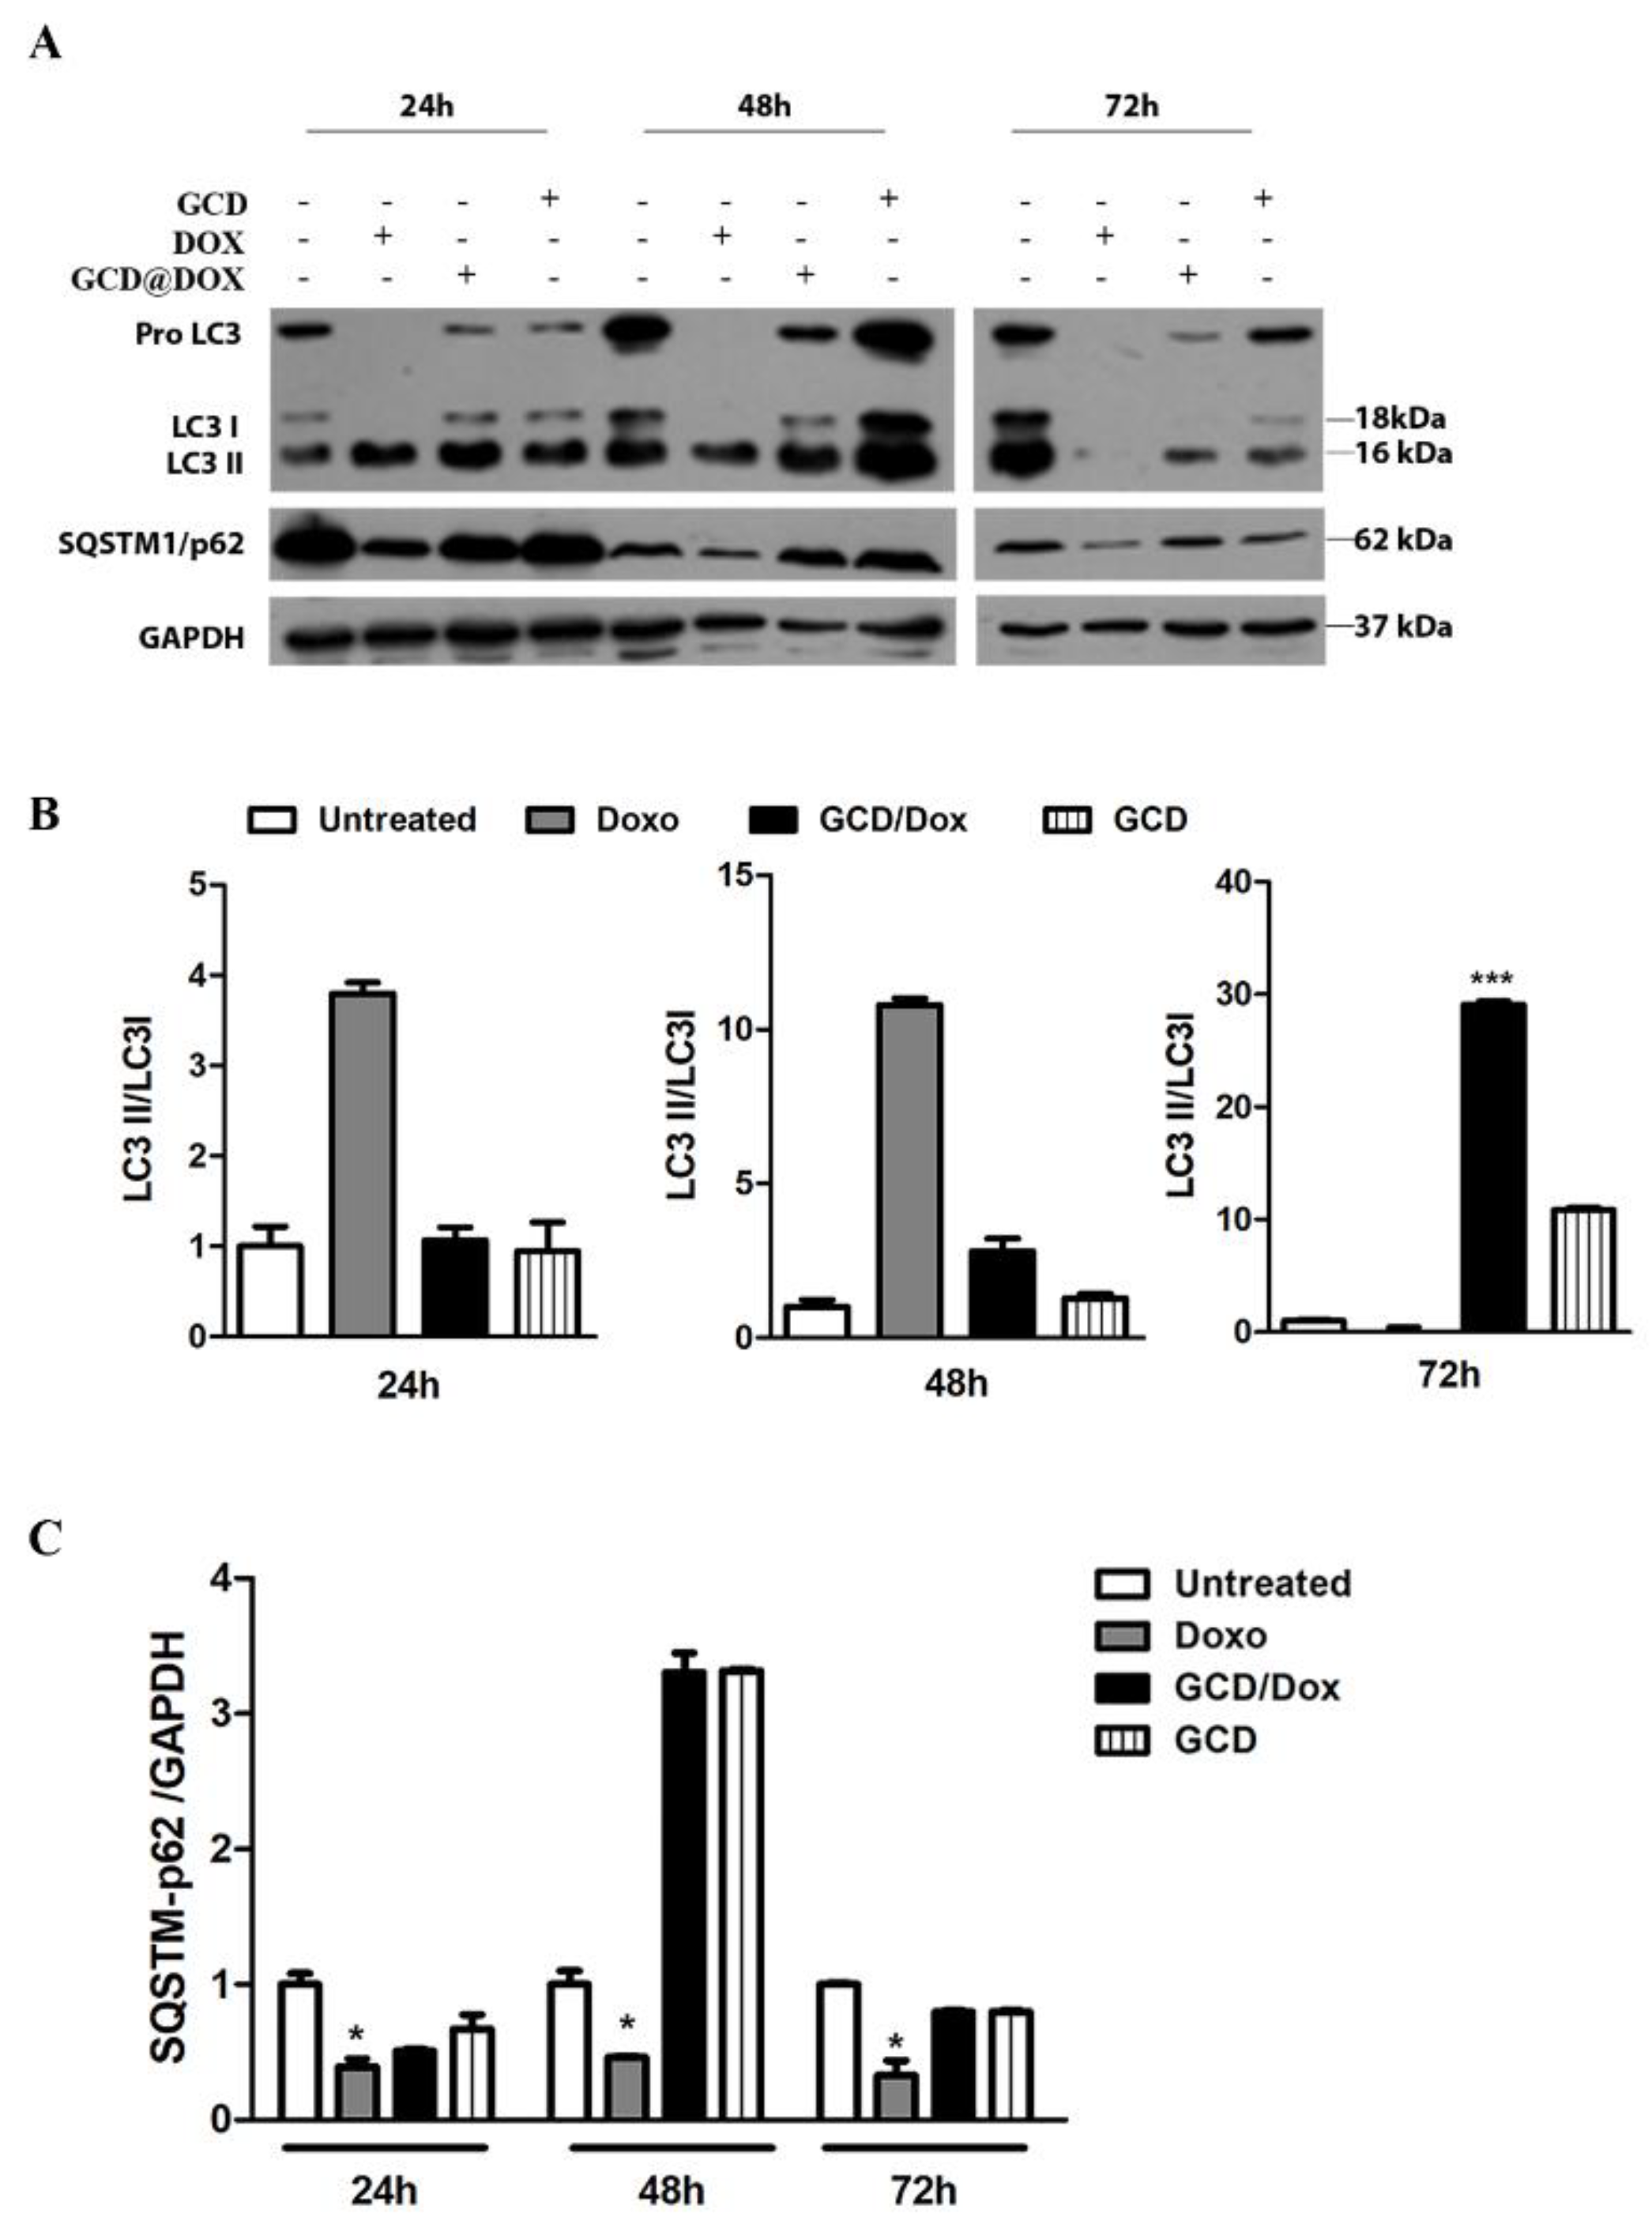
3.4. Monitoring of Autophagy following GCD@DOX and DOX Treatment
4. Discussion
5. Conclusions
Author Contributions
Funding
Institutional Review Board Statement
Informed Consent Statement
Data Availability Statement
Conflicts of Interest
References
- Hejmady, S.; Pradhan, R.; Alexander, A.; Agrawal, M.; Singhvi, G.; Gorain, B.; Tiwari, S.; Kesharwani, P.; Dubey, S.K. Recent Advances in Targeted Nanomedicine as Promising Antitumor Therapeutics. Drug Discov. Today 2020, 25, 2227–2244. [Google Scholar] [CrossRef] [PubMed]
- Thakkar, S.; Sharma, D.; Kalia, K.; Tekade, R.K. Tumor Microenvironment Targeted Nanotherapeutics for Cancer Therapy and Diagnosis: A Review. Acta Biomater. 2020, 101, 43–68. [Google Scholar] [CrossRef]
- Piperno, A.; Sciortino, M.T.; Giusto, E.; Montesi, M.; Panseri, S.; Scala, A. Recent Advances and Challenges in Gene Delivery Mediated by Polyester-Based Nanoparticles. Int. J. Nanomed. 2021, 16, 5981–6002. [Google Scholar] [CrossRef]
- Bahrami, B.; Hojjat-Farsangi, M.; Mohammadi, H.; Anvari, E.; Ghalamfarsa, G.; Yousefi, M.; Jadidi-Niaragh, F. Nanoparticles and Targeted Drug Delivery in Cancer Therapy. Immunol. Lett. 2017, 190, 64–83. [Google Scholar] [CrossRef]
- Montellano, A.; Da Ros, T.; Bianco, A.; Prato, M. Fullerene C₆₀ as a Multifunctional System for Drug and Gene Delivery. Nanoscale 2011, 5, 4035–4041. [Google Scholar] [CrossRef]
- Yang, K.; Zhang, S.; Zhang, G.; Sun, X.; Lee, S.T.; Liu, Z. Graphene in Mice: Ultrahigh In Vivo Tumor Uptake and Efficient Photothermal Therapy. Nano Lett. 2010, 10, 3318–3323. [Google Scholar] [CrossRef] [PubMed]
- Mazzaglia, A.; Scala, A.; Sortino, G.; Zagami, R.; Zhu, Y.; Sciortino, M.T.; Pennisi, R.; Pizzo, M.M.; Neri, G.; Grassi, G.; et al. Intracellular Trafficking and Therapeutic Outcome of Multiwalled Carbon Nanotubes Modified with Cyclodextrins and Polyethylenimine. Colloids Surf B Biointerfaces 2018, 163, 55–63. [Google Scholar] [CrossRef] [PubMed]
- Piperno, A.; Scala, A.; Mazzaglia, A.; Neri, G.; Pennisi, R.; Sciortino, M.T.; Grassi, G. Cellular Signaling Pathways Activated by Functional Graphene Nanomaterials. Int. J. Mol. Sci. 2018, 19, 3365. [Google Scholar] [CrossRef] [Green Version]
- Tadyszak, K.; Wychowaniec, J.K.; Litowczenko, J. Biomedical Applications of Graphene-Based Structures. Nanomaterials 2018, 8, 944. [Google Scholar] [CrossRef] [Green Version]
- Li, R.Q.; Ren, Y.; Liu, W.; Pan, W.; Xu, F.J.; Yang, M. MicroRNA-Mediated Silence of Onco-lncRNA MALAT1 in Different ESCC Cells via Ligand-Functionalized Hydroxyl-Rich Nanovectors. Nanoscale 2017, 16, 2521–2530. [Google Scholar] [CrossRef]
- Zakeri, A.; Kouhbanani, M.A.J.; Beheshtkhoo, N.; Beigi, V.; Mousavi, S.M.; Hashemi, S.A.R.; Karimi Zade, A.; Amani, A.M.; Savardashtaki, A.; Mirzaei, E.; et al. Polyethylenimine-Based Nanocarriers in Co-Delivery of Drug and Gene: A Developing Horizon. Nano Rev. Exp. 2018, 3, 1488497. [Google Scholar] [CrossRef] [PubMed] [Green Version]
- Barua, S.; Ramos, J.; Potta, T.; Taylor, D.; Huang, H.C.; Montanez, G.; Rege, K. Discovery of Cationic Polymers for Non-Viral Gene Delivery Using Combinatorial Approaches. Comb. Chem. High Throughput Screen. 2011, 14, 908–924. [Google Scholar] [CrossRef] [PubMed] [Green Version]
- Hasanzadeh, L.; Darroudi, M.; Ramezanian, N.; Zamani, P.; Aghaee-Bakhtiari, S.H.; Nourmohammadi, E.; Kazemi Oskuee, R. Polyethylenimine-Associated Cerium Oxide Nanoparticles: A Novel Promising Gene Delivery Vector. Life Sci. 2019, 232, 116661. [Google Scholar] [CrossRef] [PubMed]
- Kasprzak, A.; Poplawska, M. Recent Developments in the Synthesis and Applications of Graphene-Family Materials Functionalized with Cyclodextrins. Chem. Commun. (Camb.) 2018, 54, 8547–8562. [Google Scholar] [CrossRef] [PubMed]
- Neri, G.; Scala, A.; Barreca, F.; Fazio, E.; Mineo, P.G.; Mazzaglia, A.; Grassi, G.; Piperno, A. Engineering of Carbon Based Nanomaterials by Ring-Opening Reactions of a Reactive Azlactone Graphene Platform. Chem. Commun. (Camb.) 2015, 51, 4846–4849. [Google Scholar] [CrossRef]
- Neri, G.; Scala, A.; Fazio, E.; Mineo, P.G.; Rescifina, A.; Piperno, A.; Grassi, G. Repurposing of Oxazolone Chemistry: Gaining Access to Functionalized Graphene Nanosheets in a Top-Down Approach from Graphite. Chem. Sci. 2015, 6, 6961–6970. [Google Scholar] [CrossRef] [Green Version]
- Piperno, A.; Mazzaglia, A.; Scala, A.; Pennisi, R.; Zagami, R.; Neri, G.; Torcasio, S.M.; Rosmini, C.; Mineo, P.G.; Potara, M.; et al. Casting Light on Intracellular Tracking of a New Functional Graphene-Based MicroRNA Delivery System by FLIM and Raman Imaging. ACS Appl. Mater. Interfaces 2019, 11, 46101–46111. [Google Scholar] [CrossRef]
- Caccamo, D.; Currò, M.; Ientile, R.; Verderio, E.A.; Scala, A.; Mazzaglia, A.; Pennisi, R.; Musarra-Pizzo, M.; Zagami, R.; Neri, G.; et al. Intracellular Fate and Impact on Gene Expression of Doxorubicin/Cyclodextrin-Graphene Nanomaterials at Sub-Toxic Concentration. Int. J. Mol. Sci. 2020, 21, 4891. [Google Scholar] [CrossRef]
- Borandeh, S.; Abdolmaleki, A.; Abolmaali, S.S.; Tamaddon, A.M. Synthesis, Structural and In-Vitro Characterization of β-Cyclodextrin Grafted L-Phenylalanine Functionalized Graphene Oxide Nanocomposite: A Versatile Nanocarrier for pH-Sensitive Doxorubicin Delivery. Carbohydr. Polym. 2018, 201, 151–161. [Google Scholar] [CrossRef]
- Yang, X.; Zhang, X.; Liu, Z.; Ma, Y.; Huang, Y.; Chen, Y. High-Efficiency Loading and Controlled Release of Doxorubicin Hydrochloride on Graphene Oxide. J. Phys. Chem. C 2008, 112, 17554–17558. [Google Scholar] [CrossRef]
- Swiech, O.; Mieczkowska, A.; Chmurski, K.; Bilewicz, R. Intermolecular Interactions between Doxorubicin and β-Cyclodextrin 4-Methoxyphenol Conjugates. J. Phys. Chem. B. 2012, 116, 1765–1771. [Google Scholar] [CrossRef]
- Pennetta, C.; Floresta, G.; Graziano, A.C.E.; Cardile, V.; Rubino, L.; Galimberti, M.; Rescifina, A.; Barbera, V. Functionalization of Single and Multi-Walled Carbon Nanotubes with Polypropylene Glycol Decorated Pyrrole for the Development of Doxorubicin Nano-Conveyors for Cancer Drug Delivery. Nanomaterials 2020, 10, 1073. [Google Scholar] [CrossRef]
- Ou, L.; Lin, S.; Song, B.; Liu, J.; Lai, R.; Shao, L. The Mechanisms of Graphene-Based Materials-Induced Programmed Cell Death: A Review of Apoptosis, Autophagy, and Programmed Necrosis. Int. J. Nanomed. 2017, 12, 6633–6646. [Google Scholar] [CrossRef] [Green Version]
- Burnett, M.; Abuetabh, Y.; Wronski, A.; Shen, F.; Persad, S.; Leng, R.; Eisenstat, D.; Sergi, C. Graphene Oxide Nanoparticles Induce Apoptosis in Wild-Type and CRISPR/Cas9-IGF/IGFBP3 Knocked-Out Osteosarcoma Cells. J. Cancer 2020, 11, 5007–5023. [Google Scholar] [CrossRef] [PubMed]
- Zhang, Y.; Ali, S.F.; Dervishi, E.; Xu, Y.; Li, Z.; Casciano, D.; Biris, A.S. Cytotoxicity Effects of Graphene and Single-Wall Carbon Nanotubes in Neural Phaeochromocytoma-Derived PC12 Cells. ACS Nano 2010, 4, 3181–3186. [Google Scholar] [CrossRef] [PubMed]
- Yang, K.; Wan, J.; Zhang, S.; Zhang, Y.; Lee, S.T.; Liu, Z. In Vivo Pharmacokinetics, Long-Term Biodistribution, and Toxicology of PEGylated Graphene in Mice. ACS Nano 2011, 5, 516–522. [Google Scholar] [CrossRef] [PubMed]
- Kang, Y.; Liu, J.; Wu, J.; Yin, Q.; Liang, H.; Chen, A.; Shao, L. Graphene Oxide and Reduced Graphene Oxide Induced Neural Pheochromocytoma-Derived PC12 Cell Lines Apoptosis and Cell Cycle Alterations via the ERK Signaling Pathways. Int. J. Nanomed. 2017, 12, 5501–5510. [Google Scholar] [CrossRef] [Green Version]
- Mailänder, V.; Landfester, K. Interaction of Nanoparticles with Cells. Biomacromolecules 2009, 10, 2379–2400. [Google Scholar] [CrossRef]
- Ji, X.; Xu, B.; Yao, M.; Mao, Z.; Zhang, Y.; Xu, G.; Tang, Q.; Wang, X.; Xia, Y. Graphene Oxide Quantum Dots Disrupt Autophagic Flux by Inhibiting Lysosome Activity in GC-2 and TM4 Cell Lines. Toxicology 2018, 410, 169. [Google Scholar] [CrossRef]
- Zhang, B.; Wei, P.; Zhou, Z.; Wei, T. Interactions of Graphene with Mammalian Cells: Molecular Mechanisms and Biomedical Insights. Adv. Drug Deliv. Rev. 2016, 105, 145–162. [Google Scholar] [CrossRef] [Green Version]
- Colao, I.; Pennisi, R.; Venuti, A.; Nygårdas, M.; Heikkilä, O.; Hukkanen, V.; Sciortino, M.T. The ERK-1 Function Is Required for HSV-1-Mediated G1/S Progression in HEP-2 Cells and Contributes to Virus Growth. Sci. Rep. 2017, 7, 9176. [Google Scholar] [CrossRef] [Green Version]
- Mastino, A.; Sciortino, M.T.; Medici, M.A.; Perri, D.; Ammendolia, M.G.; Grelli, S.; Amici, C.; Pernice, A.; Guglielmino, S. Herpes Simplex Virus 2 Causes Apoptotic Infection in Monocytoid Cells. Cell Death Differ. 1997, 4, 629–638. [Google Scholar] [CrossRef] [Green Version]
- Kimura, S.; Noda, T.; Yoshimori, T. Dissection of the Autophagosome Maturation Process by a Novel Reporter Protein, Tandem Fluorescent-Tagged LC3. Autophagy 2007, 3, 452–460. [Google Scholar] [CrossRef] [PubMed] [Green Version]
- Matt, S.; Hofmann, T.G. The DNA Damage-Induced Cell Death Response: A Roadmap to Kill Cancer Cells. Cell Mol. Life Sci. 2016, 73, 2829–2850. [Google Scholar] [CrossRef] [PubMed]
- De Zio, D.; Cianfanelli, V.; Cecconi, F. New Insights into the Link between DNA Damage and Apoptosis. Antioxid. Redox Signal. 2013, 19, 559–571. [Google Scholar] [CrossRef] [Green Version]
- Williams, A.B.; Schumacher, B. p53 in the DNA-Damage-Repair Process. Cold Spring Harb. Perspect. Med. 2016, 6, a026070. [Google Scholar] [CrossRef] [Green Version]
- Wiman, K.G. p53 Talks to PARP: The Increasing Complexity of p53-Induced Cell Death. Cell Death Differ. 2013, 20, 1438–1439. [Google Scholar] [CrossRef] [Green Version]
- Michieli, P.; Chedid, M.; Lin, D.; Pierce, J.H.; Mercer, W.E.; Givol, D. Induction of WAF1/CIP1 by a p53-Independent Pathway. Cancer Res. 1994, 54, 3391–3395. [Google Scholar]
- Karimian, A.; Ahmadi, Y.; Yousefi, B. Multiple Functions of p21 in Cell Cycle, Apoptosis and Transcriptional Regulation After DNA Damage. DNA Repair (Amst.) 2016, 42, 63–71. [Google Scholar] [CrossRef] [PubMed]
- Barnum, K.J.; O’Connell, M.J. Cell Cycle Regulation by Checkpoints. Methods Mol. Biol. 2014, 1170, 29–40. [Google Scholar]
- Elbæk, C.R.; Petrosius, V.; Sørensen, C.S. WEE1 Kinase Limits CDK Activities to Safeguard DNA Replication and Mitotic Entry. Mutat. Res 2020, 819–820, 111694. [Google Scholar] [CrossRef] [PubMed]
- Watanabe, N.; Broome, M.; Hunter, T. Regulation of the Human WEE1Hu CDK Tyrosine 15-Kinase during the Cell Cycle. EMBO J. 1995, 14, 1878–1891. [Google Scholar] [CrossRef] [PubMed]
- Elmore, S. Apoptosis: A Review of Programmed Cell Death. Toxicol. Pathol. 2007, 35, 495–516. [Google Scholar] [CrossRef] [PubMed]
- Singh, R.; Letai, A.; Sarosiek, K. Regulation of Apoptosis in Health and Disease: The Balancing Act of BCL-2 Family Proteins. Nat. Rev. Mol. Cell Biol. 2019, 20, 175–193. [Google Scholar] [CrossRef]
- Goldar, S.; Khaniani, M.S.; Derakhshan, S.M.; Baradaran, B. Molecular Mechanisms of Apoptosis and Roles in Cancer Development and Treatment. Asian Pac. J. Cancer Prev. 2015, 16, 2129–2144. [Google Scholar] [CrossRef] [Green Version]
- Fan, T.J.; Han, L.H.; Cong, R.S.; Liang, J. Caspase Family Proteases and Apoptosis. Acta Biochim. Biophys. Sin. 2005, 37, 719–727. [Google Scholar] [CrossRef] [Green Version]
- Koh, D.W.; Dawson, T.M.; Dawson, V.L. Mediation of Cell Death by Poly(ADP-Ribose) Polymerase-1. Pharmacol. Res. 2005, 52, 5–14. [Google Scholar] [CrossRef]
- Byvaltsev, V.A.; Bardonova, L.A.; Onaka, N.R.; Polkin, R.A.; Ochkal, S.V.; Shepelev, V.V.; Aliyev, M.A.; Potapov, A.A. Acridine Orange: A Review of Novel Applications for Surgical Cancer Imaging and Therapy. Front. Oncol. 2019, 9, 925. [Google Scholar] [CrossRef]
- Parzych, K.R.; Klionsky, D.J. An Overview of Autophagy: Morphology, Mechanism, and Regulation. Antioxid. Redox Signal. 2014, 20, 460–473. [Google Scholar] [CrossRef] [Green Version]
- Pan, Y.Z.; Wang, X.; Bai, H.; Wang, C.B.; Zhang, Q.; Xi, R. Autophagy in Drug Resistance of the Multiple Myeloma Cell Line RPMI8226 to Doxorubicin. Genet. Mol. Res. 2015, 14, 5621–5629. [Google Scholar] [CrossRef]
- Ueno, T.; Komatsu, M. Monitoring Autophagy Flux and Activity: Principles and Applications. Bioessays 2020, 42, e2000122. [Google Scholar] [CrossRef]
- Glick, D.; Barth, S.; Macleod, K.F. Autophagy: Cellular and Molecular Mechanisms. J. Pathol. 2010, 221, 3–12. [Google Scholar] [CrossRef] [Green Version]
- Tanida, I.; Minematsu-Ikeguchi, N.; Ueno, T.; Kominami, E. Lysosomal Turnover, but Not a Cellular Level, of Endogenous LC3 Is a Marker for Autophagy. Autophagy 2005, 1, 84–91. [Google Scholar] [CrossRef] [Green Version]
- Zhou, C.; Zhong, W.; Zhou, J.; Sheng, F.; Fang, Z.; Wei, Y.; Chen, Y.; Deng, X.; Xia, B.; Lin, J. Monitoring autophagic flux by an improved tandem fluorescent-tagged LC3 (mTagRFP-mWasabi-LC3) reveals that high-dose rapamycin impairs autophagic flux in cancer cells. Autophagy 2012, 8, 1215–1226. [Google Scholar] [CrossRef] [Green Version]
- Sritharan, S.; Sivalingam, N. A Comprehensive Review on Time-Tested Anticancer Drug Doxorubicin. Life Sci. 2021, 278, 119527. [Google Scholar] [CrossRef]
- Dupont, N.; Orhon, I.; Bauvy, C.; Codogno, P. Autophagy and Autophagic Flux in Tumor Cells. Methods Enzymol. 2014, 543, 73–88. [Google Scholar]
- Shafei, A.; El-Bakly, W.; Sobhy, A.; Wagdy, O.; Reda, A.; Aboelenin, O.; Marzouk, A.; El Habak, K.; Mostafa, R.; Ali, M.A.; et al. A Review on the Efficacy and Toxicity of Different Doxorubicin Nanoparticles for Targeted Therapy in Metastatic Breast Cancer. Biomed. Pharmacother. 2017, 95, 1209–1218. [Google Scholar] [CrossRef]
- Zainal-Abidin, M.H.; Hayyan, M.; Ngoh, G.C.; Wong, W.F. Doxorubicin Loading on Functional Graphene as a Promising Nanocarrier Using Ternary Deep Eutectic Solvent Systems. ACS Omega 2020, 5, 1656–1668. [Google Scholar] [CrossRef] [PubMed]
- Barranco, S.C.; Gerner, E.W.; Burk, K.H.; Humphrey, R.M. Survival and Cell Kinetics Effects of Adriamycin on Mammalian Cells. Cancer Res. 1973, 33, 11–16. [Google Scholar] [PubMed]
- Davies, K.J.; Doroshow, J.H. Redox Cycling of Anthracyclines by Cardiac Mitochondria. I. Anthracycline Radical Formation by NADH Dehydrogenase. J. Biol. Chem. 1986, 261, 3060–3067. [Google Scholar] [CrossRef]
- Hanna, A.D.; Lam, A.; Tham, S.; Dulhunty, A.F.; Beard, N.A. Adverse Effects of Doxorubicin and Its Metabolic Product on Cardiac RyR2 and SERCA2A. Mol. Pharmacol. 2014, 86, 438–449. [Google Scholar] [CrossRef] [PubMed] [Green Version]
- Ryberg, M.; Nielsen, D.L.; Jensen, M.T.; Nielsen, G.; Andersen, P.K. Predictive Factors for the Severity of Congestive Heart Failure after an Epirubicin-Based Treatment for Metastatic Breast Cancer. J. Clin. Oncol. Conf. 2010, 28, 1124. [Google Scholar] [CrossRef]
- Andreopoulou, E.; Gaiotti, D.; Kim, E.; Volm, M.; Oratz, R.; Freedberg, R.; Downey, A.; Vogel, C.L.; Chia, S.; Muggia, F. Feasibility and Cardiac Safety of Pegylated Liposomal Doxorubicin Plus Trastuzumab in Heavily Pretreated Patients with Recurrent HER2—Overexpressing Metastatic Breast Cancer. Clin. Breast Cancer 2007, 7, 690–696. [Google Scholar] [CrossRef] [PubMed]
- Makwana, V.; Karanjia, J.; Haselhorst, T.; Anoopkumar-Dukie, S.; Rudrawar, S. Liposomal Doxorubicin as Targeted Delivery Platform: Current Trends in Surface Functionalization. Int. J. Pharm. 2021, 593, 120117. [Google Scholar] [CrossRef]
- Li, C.; Lai, C.; Qiu, Q.; Luo, X.; Hu, L.; Zheng, H.; Lu, Y.; Liu, M.; Zhang, H.; Liu, X.; et al. Dual-Ligand Modification of PEGylated Liposomes Used for Targeted Doxorubicin Delivery to Enhance Anticancer Efficacy. AAPS PharmSciTech 2019, 20, 188. [Google Scholar] [CrossRef] [PubMed]
- Hu, D.; Chen, L.; Qu, Y.; Peng, J.; Chu, B.; Shi, K.; Hao, Y.; Zhong, L.; Wang, M.; Qian, Z. Oxygen-Generating Hybrid Polymeric Nanoparticles with Encapsulated Doxorubicin and Chlorin e6 for Trimodal Imaging-Guided Combined Chemo-Photodynamic Therapy. Theranostics 2018, 8, 1558–1574. [Google Scholar] [CrossRef] [PubMed]
- Feroz, W.; Sheikh, A.M.A. Exploring the Multiple Roles of Guardian of the Genome: P53. Egypt J. Med. Hum. Genet. 2020, 21, 49. [Google Scholar] [CrossRef]
- Fischbach, A.; Krüger, A.; Hampp, S.; Assmann, G.; Rank, L.; Hufnagel, M.; Stöckl, M.T.; Fischer, J.M.F.; Veith, S.; Rossatti, P.; et al. The C-Terminal Domain of p53 Orchestrates the Interplay between Non-Covalent and Covalent Poly(ADP-Ribosyl)ation of p53 by PARP1. Nucleic Acids Res. 2018, 46, 804–822. [Google Scholar] [CrossRef] [Green Version]
- Hocsak, E.; Szabo, V.; Kalman, N.; Antus, C.; Cseh, A.; Sumegi, K.; Eros, K.; Hegedus, Z.; Gallyas, F., Jr.; Sumegi, B.; et al. PARP Inhibition Protects Mitochondria and Reduces ROS Production via PARP-1-ATF4-MKP-1-MAPK Retrograde Pathway. Free Radic. Biol. Med. 2017, 108, 770–784. [Google Scholar] [CrossRef]
- Cazzalini, O.; Dona, F.; Savio, M.; Tillhon, M.; Maccario, C.; Perucca, P.; Stivala, L.A.; Scovassi, A.I.; Prosperi, E. p21CDKN1A Participates in Base Excision Repair by Regulating the Activity of Poly(ADP-ribose) Polymerase-1. DNA Repair (Amst.) 2010, 9, 627–635. [Google Scholar] [CrossRef]
- Prosperi, E.; Scovassi, I.A. Dynamic Interaction between PARP-1, PCNA and p21waf1/cip1. In Madame Curie Bioscience Database [Internet]; Landes Bioscience: Austin, TX, USA, 2000–2013. Available online: https://www.ncbi.nlm.nih.gov/books/NBK6457 (accessed on 25 November 2021).
- Bains, O.S.; Szeitz, A.; Lubieniecka, J.M.; Cragg, G.E.; Grigliatti, T.A.; Riggs, K.W.; Reid, R.E. A Correlation between Cytotoxicity and Reductase-Mediated Metabolism in Cell Lines Treated with Doxorubicin and Daunorubicin. J. Pharmacol. Exp. Ther. 2013, 347, 375–387. [Google Scholar] [CrossRef]
- Duan, L.; Perez, R.E.; Davaadelger, B.; Dedkova, E.N.; Blatter, L.A.; Maki, C.G. p53-Regulated Autophagy Is Controlled by Glycolysis and Determines Cell Fate. Oncotarget 2015, 6, 23135–23156. [Google Scholar] [CrossRef] [Green Version]
- Mrakovcic, M.; Fröhlich, L.F. p53-Mediated Molecular Control of Autophagy in Tumor Cells. Biomolecules 2018, 8, 14. [Google Scholar] [CrossRef] [Green Version]
- Yonekawa, T.; Thorburn, A. Autophagy and Cell Death. Essays Biochem. 2013, 55, 105–117. [Google Scholar]
- D’Arcy, M.S. Cell Death: A Review of the Major Forms of Apoptosis, Necrosis and Autophagy. Cell Biol. Int. 2019, 43, 582–592. [Google Scholar] [CrossRef] [PubMed]
- Nishida, K.; Yamaguchi, O.; Otsu, K. Crosstalk between Autophagy and Apoptosis in Heart Disease. Circ. Res. 2008, 103, 343–351. [Google Scholar] [CrossRef]
- Jiang, P.; Mizushima, N. LC3- and p62-Based Biochemical Methods for the Analysis of Autophagy Progression in Mammalian Cells. Methods 2015, 75, 13–18. [Google Scholar] [CrossRef] [PubMed]
- Sui, X.; Chen, R.; Wang, Z.; Huang, Z.; Kong, N.; Zhang, M.; Han, W.; Lou, F.; Yang, J.; Zhang, Q.; et al. Autophagy and Chemotherapy Resistance: A Promising Therapeutic Target for Cancer Treatment. Cell Death Dis. 2013, 4, e838. [Google Scholar] [CrossRef] [PubMed]


Publisher’s Note: MDPI stays neutral with regard to jurisdictional claims in published maps and institutional affiliations. |
© 2022 by the authors. Licensee MDPI, Basel, Switzerland. This article is an open access article distributed under the terms and conditions of the Creative Commons Attribution (CC BY) license (https://creativecommons.org/licenses/by/4.0/).
Share and Cite
Pennisi, R.; Musarra-Pizzo, M.; Velletri, T.; Mazzaglia, A.; Neri, G.; Scala, A.; Piperno, A.; Sciortino, M.T. Cancer-Related Intracellular Signalling Pathways Activated by DOXorubicin/Cyclodextrin-Graphene-Based Nanomaterials. Biomolecules 2022, 12, 63. https://doi.org/10.3390/biom12010063
Pennisi R, Musarra-Pizzo M, Velletri T, Mazzaglia A, Neri G, Scala A, Piperno A, Sciortino MT. Cancer-Related Intracellular Signalling Pathways Activated by DOXorubicin/Cyclodextrin-Graphene-Based Nanomaterials. Biomolecules. 2022; 12(1):63. https://doi.org/10.3390/biom12010063
Chicago/Turabian StylePennisi, Rosamaria, Maria Musarra-Pizzo, Tania Velletri, Antonino Mazzaglia, Giulia Neri, Angela Scala, Anna Piperno, and Maria Teresa Sciortino. 2022. "Cancer-Related Intracellular Signalling Pathways Activated by DOXorubicin/Cyclodextrin-Graphene-Based Nanomaterials" Biomolecules 12, no. 1: 63. https://doi.org/10.3390/biom12010063