Article

Strontium Binding to α-Parvalbumin, a Canonical Calcium-Binding Protein of the “EF-Hand” Family

by
Alisa A. Vologzhannikova
1,
Marina P. Shevelyova
1,
Alexey S. Kazakov
1,
Andrey S. Sokolov
1,
Nadezhda I. Borisova
1,
Eugene A. Permyakov
1,
Nikoleta Kircheva
2,
Valya Nikolova
3,
Todor Dudev
3 and
Sergei E. Permyakov
1,*
1
Institute for Biological Instrumentation, Pushchino Scientific Center for Biological Research of the Russian Academy of Sciences, Pushchino, 142290 Moscow, Russia
2
Institute of Optical Materials and Technologies “Acad. J. Malinowski”, Bulgarian Academy of Sciences, 1113 Sofia, Bulgaria
3
Faculty of Chemistry and Pharmacy, Sofia University “St. Kl. Ohridski”, 1164 Sofia, Bulgaria
*
Author to whom correspondence should be addressed.
Biomolecules 2021, 11(8), 1158; https://doi.org/10.3390/biom11081158
Submission received: 14 July 2021 / Revised: 30 July 2021 / Accepted: 31 July 2021 / Published: 5 August 2021
(This article belongs to the Collection Advances in Metal Binding Proteins)

Abstract

:
Strontium salts are used for treatment of osteoporosis and bone cancer, but their impact on calcium-mediated physiological processes remains obscure. To explore Sr2+ interference with Ca2+ binding to proteins of the EF-hand family, we studied Sr2+/Ca2+ interaction with a canonical EF-hand protein, α-parvalbumin (α-PA). Evaluation of the equilibrium metal association constants for the active Ca2+ binding sites of recombinant human α-PA (‘CD’ and ‘EF’ sites) from fluorimetric titration experiments and isothermal titration calorimetry data gave 4 × 10⁹ M−1 and 4 × 10⁹ M−1 for Ca2+, and 2 × 10⁷ M−1 and 2 × 10⁶ M−1 for Sr2+. Inactivation of the EF site by homologous substitution of the Ca2+-coordinating Glu in position 12 of the EF-loop by Gln decreased Ca2+/Sr2+ affinity of the protein by an order of magnitude, whereas the analogous inactivation of the CD site induced much deeper suppression of the Ca2+/Sr2+ affinity. These results suggest that Sr2+ and Ca2+ bind to CD/EF sites of α-PA and the Ca2+/Sr2+ binding are sequential processes with the CD site being occupied first. Spectrofluorimetric Sr2+ titration of the Ca2+-loaded α-PA revealed presence of secondary Sr2+ binding site(s) with an apparent equilibrium association constant of 4 × 10⁵ M−1. Fourier-transform infrared spectroscopy data evidence that Ca2+/Sr2+-loaded forms of α-PA exhibit similar states of their COO groups. Near-UV circular dichroism (CD) data show that Ca2+/Sr2+ binding to α-PA induce similar changes in symmetry of microenvironment of its Phe residues. Far-UV CD experiments reveal that Ca2+/Sr2+ binding are accompanied by nearly identical changes in secondary structure of α-PA. Meanwhile, scanning calorimetry measurements show markedly lower Sr2+-induced increase in stability of tertiary structure of α-PA, compared to the Ca2+-induced effect. Theoretical modeling using Density Functional Theory computations with Polarizable Continuum Model calculations confirms that Ca2+-binding sites of α-PA are well protected against exchange of Ca2+ for Sr2+ regardless of coordination number of Sr2+, solvent exposure or rigidity of sites. The latter appears to be a key determinant of the Ca2+/Sr2+ selectivity. Overall, despite lowered affinity of α-PA to Sr2+, the latter competes with Ca2+ for the same EF-hands and induces similar structural rearrangements. The presence of a secondary Sr2+ binding site(s) could be a factor contributing to Sr2+ impact on the functional activity of proteins.

1. Introduction

Strontium, a non-biogenic element from group II of the periodic table, positioned under its biogenic congener, calcium, is clinically used as a therapeutic agent. It prevents the destruction of bones and contributes to their restoration [1,2,3,4,5,6,7]. Sr2+ salt of ranelic acid is a medication (under the names Protelos, Protos, Strontium ranelate Aristo) used for treatment of osteoporosis in postmenopausal women and very elderly patients. However, strontium ranelate has serious side effects: cardiovascular disorders (including myocardial infarction), venous thromboembolism, pulmonary embolism, nausea, diarrhea, headache and eczema. It is prescribed only as a second-line drug for treatment of postmenopausal osteoporosis when other drugs are unsuitable [4,8]. Furthermore, 89Sr chloride (half-life of 50.6 days) has been efficient in treatment of bone cancer patients [9], since strontium as a calcium mimetic accumulates at sites of enhanced osteogenesis [6], thereby exposing cancerous formations to radiation.
Strontium’s similarity to calcium is critical for its physiological action. Their ionic radii (for heptacoordinated metal) are 1.06 Å for Ca2+ and 1.21 Å for Sr2+ [10]. Ca2+ and Sr2+ are ‘hard’ cations with strong preference toward oxygen-containing ‘hard’ ligands. Both cations are characterized by flexible coordination/hydration spheres comprising six to nine ligands [11,12].
Although much information has been accumulated on the beneficial effects of Sr2+ on human health, the intimate mechanisms of its therapeutic action remain poorly understood. The widely accepted explanation of its curative effects postulates that Sr2+ is able to bind and activate the calcium-sensing receptor (CaSR), a representative of G protein-coupled receptors [1,2,3,4,6,8,13,14]. CaSR activation triggers a cascade of signaling events promoting both osteoclast apoptosis and osteoblast differentiation. Meanwhile, the abovementioned side effects suggest that Sr2+ has other targets in human body, likely related to calcium homeostasis. Therefore, it is of particular importance to study interactions of Sr2+ with Ca2+-binding proteins, which could be attacked by Sr2+, to elucidate the competition between the cations. This knowledge is of importance for exploring the pathways of 90Sr propagation in human body (with a half-life 28.8 years), as it is a substantial component of radioactive waste from nuclear reactors.
The largest family of eukaryotic Ca2+-binding proteins is the EF-hand superfamily [15]. EF-hand proteins contain typically paired EF-hand motifs, which represent a 12-residue Ca2+-coordinating loop flanked by α-helices (‘helix-loop-helix’ motif, see the [1] PDOC00018 entry of PROSITE). Among the hundreds of known EF-hand proteins, parvalbumin (PA) serves a reference point, since it was the first EF-hand protein whose structure was solved [16]. PA is a 10–12 kDa globular α-helical protein of vertebrates, consisting of three EF-hand domains, two of which (CD and EF) bind Ca2+/Mg2+ with the highest affinity among EF-hand proteins (reviewed in [17,18,19]). Equilibrium Ca2+ association constants of PA measured at room temperatures lie in the range of 108 to 1010 M−1, while the respective equilibrium Mg2+ binding constants are within the 103 to 105 M−1 range [19]. Several studies suggest a sequential mechanism of Ca2+/Mg2+ binding to PA [18,19]. The CD site seems to be filled by Ca2+ first, followed by filling of the EF site. Meanwhile, the data on Sr2+ affinity of PA and the mechanism of Sr2+ binding have not been reported to date, to the best of our knowledge. Therefore, in the present work we focus on the Sr2+/Ca2+-binding properties of recombinant human α-PA, and seek to address the following intriguing questions: (1) To what extent are the Ca2+-binding sites of PA prone to Sr2+ binding? (2) What are the key factors governing the competition between Ca2+/Sr2+ in PA? (3) Do secondary Sr2+-binding sites, differing from CD and EF sites, exist in PA? The results obtained help elucidate the intimate mechanisms of metal selectivity in PA and to reveal its thermodynamic determinants.

2. Materials and Methods

2.1. Materials

Ultra-grade HEPES (N-(2-hydroxyethyl)piperazine-N′-(2-ethanesulfonic acid)) and H3BO3 were from Sigma-Aldrich Co. (St. Louis, CA, USA) and Fluka (Munich, Germany), respectively. Biochemical grade Tris (tris(hydroxymethyl)aminomethane) and ultra-grade TCA (trichloroacetic acid) were purchased from Panreac AppliChem (Darmstadt, Germany). Calcium chloride standard solution was from Fluka (Munich, Germany). Strontium chloride standard solution, ultra-grade KOH and EDTA (ethylenediaminetetraacetic acid) acid were from Sigma–Aldrich Co. (St. Louis, CA, USA). Standard solutions of EDTA potassium salt was prepared as described in [20]. TOYOPEARL SuperQ-650M was purchased from Tosoh Bioscience (Griesheim, Germany). HiPrep 26/60 Sephacryl S-100 HR was from GE Healthcare (Chicago, IL, USA). Sephadex G-25 was a product of Pharmacia LKB (Uppsala, Sweden). A molecular mass marker for SDS-PAGE was a product of Thermo Scientific (Waltham, MA, USA). d-10-camphorsulfonic acid was from JASCO, Inc. (Tokyo, Japan). Other chemicals were reagent grade or higher. All buffers and other solutions were prepared using ultrapure water (Millipore Simplicity 185 system). Plastics or quartz ware were used instead of glassware, to avoid contamination of protein samples with Ca2+. SnakeSkin dialysis tubing (3.5 kDa MWCO) from Thermo Scientific (Waltham, MA, USA) was used.

2.2. Expression and Purification of Human α-PA

Human α-PA gene (Swiss-Prot entry P20472) was obtained from DNASU Plasmid Repository (https://dnasu.org/DNASU/, (accessed on 14 July 2021)), clone HsCD00301153, and cloned into the pET11a vector between the NdeI and BamHI restriction sites. The plasmid was transformed into E. coli strain BL21 (DE3). rWT α-PA (recombinant wild-type α isoform parvalbumin) was expressed and purified according to [21] with the following modifications. The cells were lysed using a French press (IBI RAS, Pushchino, Russia) and centrifuged at 30,000× g for 30 min at 4 °C; 1 mM CaCl2 was added to the supernatant and the solution was kept at 80 °C for 3 min, cooled using ice-water bath and centrifuged at 15,500× g for 30 min at 4 °C. The supernatant was dialyzed against distilled water at 4 °C, followed by dialysis against 10 mM Tris-HCl, pH 8.5 buffer. The dialyzed solution was passed through TOYOPEARL SuperQ-650M column (0.9 cm × 7.5 cm) equilibrated with the same buffer. PA was eluted with a linear gradient of NaCl (75 mL of 0 mM NaCl to 75 mL of 100 mM NaCl); the elution rate was 1 mL/min. The fractions containing PA were joined, precipitated by 3% TCA, incubated at 4 °C for 10 min and centrifuged at 5000× g for 10 min at 4 °C. The pellet was resuspended in 50 mM Tris-HCl pH 8.0 buffer and passed through HiPrep 26/60 Sephacryl S-100 HR gel filtration column equilibrated with 10 mM Tris-HCl pH 7.5 buffer (flow rate of 1 mL/min). The fractions with PA were collected, exhaustively dialyzed against distilled water at 4 °C, freeze-dried and stored at −18 °C. The yield was 40–60 mg of PA per liter of cell culture.
Site-directed mutagenesis of human α-PA was carried out according to [22]. The resulting PA mutants with inactivated EF-loops, PA-CD and PA-EF, caused by the substitutions E63Q and E102Q, respectively, were expressed and purified similarly to rWT α-PA.
The purified PA samples were homogeneous as judged from native and SDS-PAGE (sodium dodecyl sulfate polyacrylamide gel electrophoresis). Their UV absorption and fluorescence spectra were characteristic for Phe residues, since human α-PA lacks Trp/Tyr residues. PA concentrations were estimated spectrophotometrically using the ε259nm values derived from the molar extinction coefficient at 205 nm, and were estimated according to [23] as 1585 M−1cm−1 for rWT α-PA, 1672 M−1cm−1 for PA-CD and 1359 M−1cm−1 for PA-EF, respectively.

2.3. Removal of Metal Ions from PA Samples

The contaminating Ca2+/Mg2+ ions were removed from PA by precipitation of the protein by TCA [24], followed by gel-filtration according to [25] using Sephadex G-25 column equilibrated with a respective buffer.

2.4. Fluorescence Measurements

Fluorescence emission spectra were measured using a Cary Eclipse spectrofluorimeter (Varian, Inc., Palo Alto, CA, USA) equipped with a Peltier-controlled cell holder. Quartz cells with pathlengths of 10 mm were used. Protein concentrations were 1–19 µM. Buffer conditions: 10 mM HEPES-KOH, pH 8.1. Fluorescence of Phe residues of PA was excited at 259 nm.

2.5. Fluorimetric Evaluation of Ca2+/Sr2+ Affinity of PA

The metal affinity of PA at 20 °C was estimated from spectrofluorimetric titration of the metal-depleted protein (1–19 µM) with a Ca2+/Sr2+ standard stock solution, followed in some cases by a titration of the metal-loaded protein with EDTA standard solution. Buffer conditions: 10 mM HEPES–KOH, pH 8.1. Fluorescence intensities were corrected for the dilution effect via division of the experimental values by a factor of (1–10−Dexc), where Dexc is the protein absorption at the excitation wavelength.
The experimental data for Ca2+ binding to rWT α-PA were approximated by the sequential metal binding scheme, previously shown to be valid for various PAs [19,26,27,28]:
KMe1
Protein + Me2+ ↔ Protein•Me2+
KMe2
Protein•Me2+ + Me2+ ↔ Me2+•Protein•Me2+,
where Me2+ denotes the metal ion; KMe1 and KMe2 are equilibrium metal association constants for the two active EF-hands of the protein.
Upon use of EDTA, the competition between protein and EDTA for metal ions was taken into account:
KEDTA
EDTA + Me2+ ↔ EDTA•Me2+
The Ca2+/Sr2+ association constants of EDTA, KEDTA, were calculated according to [29].
In the case of Ca2+ binding to rWT α-PA, the data were globally fitted according to the schemes (1) and (2) using FluoTitr v.1.42 software (IBI RAS, Pushchino, Russia), implementing the nonlinear regression algorithm by Marquardt [30]. KMe1, KMe2 and specific fluorescence intensities of the possible protein states were used as fitting parameters. The accuracy of the KMe1 and KMe2 estimates was about ±1/4 orders of their magnitudes.
In some cases the same approach was applied, but using the single site metal binding scheme:
KMe
Protein + Me2+ ↔ Protein•Me2+
where Me2+ denotes metal ion, KMe is an equilibrium metal association constant.

2.6. ITC Measurements

ITC (isothermal titration calorimetry) studies were carried out at 20 °C using Nano ITC calorimeter (TA Instruments, New Castle, DE, USA). The reference cell was filled with deionized water. The reaction cell contained 1000 μL of 97 μM PA in 10 mM HEPES-KOH pH 8.1 buffer. The PA solution was titrated by 2.52 μL aliquots of 3.6 mM SrCl2 in the same buffer: 37 injections with a 200 s interval between the injections. The injection syringe was rotated at 280 rpm during the titration and pre-equilibration. The ITC data were fitted by the sequential metal binding scheme (1) using FluoTitr v.1.42 software (IBI RAS, Pushchino, Russia), implementing the nonlinear regression algorithm by Marquardt [30]. KMe1, KMe2 and specific enthalpies of the possible protein states were used as fitting parameters.

2.7. FTIR Spectroscopy Measurements

Transmission FTIR spectroscopy (Fourier-transform infrared spectroscopy) spectra of PA (3 mM) were measured at 20 °C using Nicolet 6700 spectrometer (Thermo Scientific), equipped with a MCT detector cooled by liquid N2. The measurements were performed in a CaF2 cell with a pathlength of 4 µm in 10 mM H3BO3-KOH pH 9.0 buffer, either without metal ions or in the presence of 10 mM CaCl2/SrCl2. Apo-α-PA (metal-free form of α-PA) was prepared using combination of the TCA protein precipitation method [24] and Sephadex G-25 gel-filtration method [25]. Resolution was 2 cm−1; 256 spectra were averaged and the averaged spectrum of the buffer was subtracted. The difference spectrum was smoothed by the FFT algorithm with a window of 20 points and 0.02593 cutoff frequency; its second derivative was calculated using OriginPro v.9.0 software (OriginLab Corp., Northampton, MA, USA).

2.8. Circular Dichroism Measurements

CD spectra of PA were measured at 20 °C with a J-810 spectropolarimeter (JASCO, Inc., Tokyo, Japan) equipped with a Peltier-controlled cell holder. The instrument was calibrated with an aqueous solution of d-10-camphorsulfonic acid according to the manufacturer’s instruction. The cell compartment was purged with N2. Cells with pathlengths of 10 mm and 1.00 mm were used for near- and far-UV regions, respectively. Protein concentrations were 6.2–7.5 and 126–129 µM for far- and near-UV regions, respectively. Buffer conditions: 10 mM H3BO3-KOH, pH 9.0, 1 mM EDTA or 1 mM SrCl2/CaCl2. Bandwidth was 2 nm, with an average time of 1–2 s and an accumulation of 3. Buffer contribution was subtracted from PA spectra. Estimates of protein secondary structure contents were carried out using the CDPro software package [31]. The experimental data in the 195–240 nm range were treated by SELCON3, CDSSTR and CONTIN algorithms, using SDP48 and SMP56 reference protein sets. The final secondary structure fractions represented averaged values.

2.9. Scanning Calorimetry Measurements

DSC (differential scanning calorimetry) studies were carried out using a DASM-4M differential scanning microcalorimeter (IBI RAS, Pushchino, Russia) at a heating rate of 0.86 K/min and an excess pressure of 3 bar. PA concentrations were 1.2–1.8 mg/mL. Buffer conditions: 10 mM H3BO3-KOH, pH 9.0, 1 mM SrCl2/CaCl2 or without additions. The measurements and calculations of protein specific heat capacity (Cp) were performed as described in [27]. The specific heat capacity of the fully unfolded protein was estimated according to [32]. The temperature dependence of Cp was analyzed according to the cooperative two-state model:
n∙N ↔ n∙D
where N and D denote native and denatured protein states, respectively, and n is a number of protein molecules involved into transition. The experimental data were fitted by the equations derived earlier [33] using OriginPro v.9.0 software (OriginLab Corp., Northampton, MA, USA). The heat capacity change accompanying the thermal transition (ΔCp) was supposed to be independent of temperature. ΔCp, mid-transition temperature (T0), enthalpy of protein denaturation at temperature T0 (ΔH0) and n were used as fitting parameters.

2.10. Models Used in Theoretical Calculations

The models of Ca2+/Sr2+-loaded CD and EF sites of PA were built based on the high-resolution X-ray structure of Ca2+-bound pike β-PA (PDB entry 1PAL; resolution 1.65 Å) [34]. The metal ion and its first-shell ligands (Asp51, Asp53, Glu59, Glu62, Ser55 and Phe57backbone for the CD site; Asp90, Asp92, Asp94, Met96backbone, Glu101 and Water246 for the EF site) were incised from the protein structure and capped at the Cα atoms with a methyl group. Thus, the side chains of Asp, Glu and Ser were represented by CH3CH2COO, CH3CH2CH2COO and CH3CH2OH, respectively, while the metal-coordinating backbone peptide group was modeled by N-methylacetamide (CH3CONHCH3). The side chains of Glu62 (CD site) and Glu101 (EF site) bind Ca2+ in a bidentate fashion, whereas the rest of carboxylic residues coordinate the metal monodentately. The coordination number of Ca2+ in the both sites was seven. The resulting Ca2+-bound constructs were subjected to geometry optimization (see below). Ca2+ of the optimized structures was replaced by Sr2+ and the resulting Sr2+-containing constructs were fully optimized. Additionally, the metal-binding sites were modified (see Section 3) and accordingly optimized to access the role of several factors (ligand mutations or increased coordination number of Sr2+) in the site metal selectivity.
The competition between Sr2+ and Ca2+ can be expressed in terms of the change in Gibbs free energy upon replacement of the cognate Ca2+ cation bound to the site by Sr2+:
[Sr2+-aq] + [Ca2+-protein] → [Sr2+-protein] + [Ca2+-aq]
where [Ca2+/Sr2+-protein] and [Ca2+/Sr2+-aq] represent the metal cation bound to protein ligands within the binding pocket and the unbound metal, respectively. A positive free energy change for Equation (5) implies a Ca2+-selective site, whereas a negative value suggests a Sr2+-selective one.

2.11. DFT/PCM Calculations (Density Functional Theory/Polarizable Continuum Model)

The M06-2X method [35] in combination with Pople’s triple zeta 6-311++G(d,p) basis set for C, H, N, O and Cα atoms and the SDD basis set/effective core potential for Sr2+ was employed in the calculations. This theoretical method/basis set has been thoroughly calibrated/validated in previous publications with respect to available experimental data and has proven to be dependable, since it can properly reproduce the geometry of a series of representative metal structures [36] as well as the free energies of metal substitution in acetate, imidazole and glycine complexes [37]. Furthermore, it was additionally validated here with respect to experimentally determined free energies of Sr2+ Ca2+ exchange in metal-oxalate complexes (see below).
Each metal-loaded binding site was optimized in the gas phase by employing the Gaussian 09 software package [38]. Electronic energies, Eel, were computed for each optimized complex. Subsequent frequency calculations were performed at the same M06-2X/6-311++G(d,p)//SDD level of theory, and no imaginary frequency was found for any of the structures studied. The frequencies were scaled by an empirical factor of 0.983 [39] and employed to calculate the thermal energies, Eth, including zero-point energy and entropies, S. The differences (i.e., ΔEel, ΔEth and ΔS) between the products and reactants in Equation (5) were used to evaluate the metal exchange Gibbs free energy in the gas phase at T = 298.15 K, ΔG1, according to the equation:
ΔG1 = ΔEel1 + ΔEth1 − TΔS1
The basis set superposition error for Equation (5) was found to be negligible [40], and therefore was not considered in the present calculations.
Metal-binding sites are located in cavities/clefts of proteins with dielectric properties that are different from those of the bulk water [41] but similar to those of the low-polarity solvents [42]. Therefore, condensed-phase evaluations were performed in solvents mimicking the dielectric properties of buried and solvent-exposed binding sites, diethyl ether (dielectric constant ε = 4) and propanonitrile (ε = 29), respectively. Solvation effects were taken into consideration by using the solvation model based on density (SMD) scheme [43], as implemented in the Gaussian 09 software. The optimized structure of each metal construct in the gas phase was subjected to single point calculations in the respective solvent at the M06-2X/6-311++G(d,p)//SDD level of theory. The difference between the gas-phase and SMD energies was used to compute the solvation free energy, ΔGsolvε, of each complex. The incoming Sr2+ and outgoing Ca2+ ions were considered to be in a bulk aqueous environment (ε = 78) outside the binding pocket. Accordingly, their experimentally evaluated hydration free energies of −329.8 and −359.7 kcal/mol, respectively [44], were employed in the calculations. The free energy of cation exchange in a protein cavity characterized by an effective dielectric constant ε was evaluated as follows:
ΔGε = ΔG1 + ΔGsolvε ([Sr2+-protein]) − ΔGsolvε ([Ca2+-protein]) − ΔGsolv78 ([Sr2+-aq]) + ΔGsolv78 ([Ca2+-aq])

2.12. Validation of Calculations

The theoretical method and calculation protocol employed here were validated with respect to experimental data on Sr2+ → Ca2+ substitution in metal complexes. Experimentally measured stability constants of Ca2+ and Sr2+ oxalate complexes [45] were used to evaluate the free energy of metal exchange in a water environment:
[Sr2+-aq ]+ [Ca2+(H2O)5(C2O42-)]0 → [Sr2+(H2O)5(C2O42-)]0 + [Ca2+-aq]
Note that the two metals were bound bidentately to the oxalate anion and characterized by a coordination number of 7. The theoretically evaluated free energy of metal substitution of 1.4 kcal/mol was in very good agreement with the experimental estimate of 0.6 kcal/mol.

3. Results

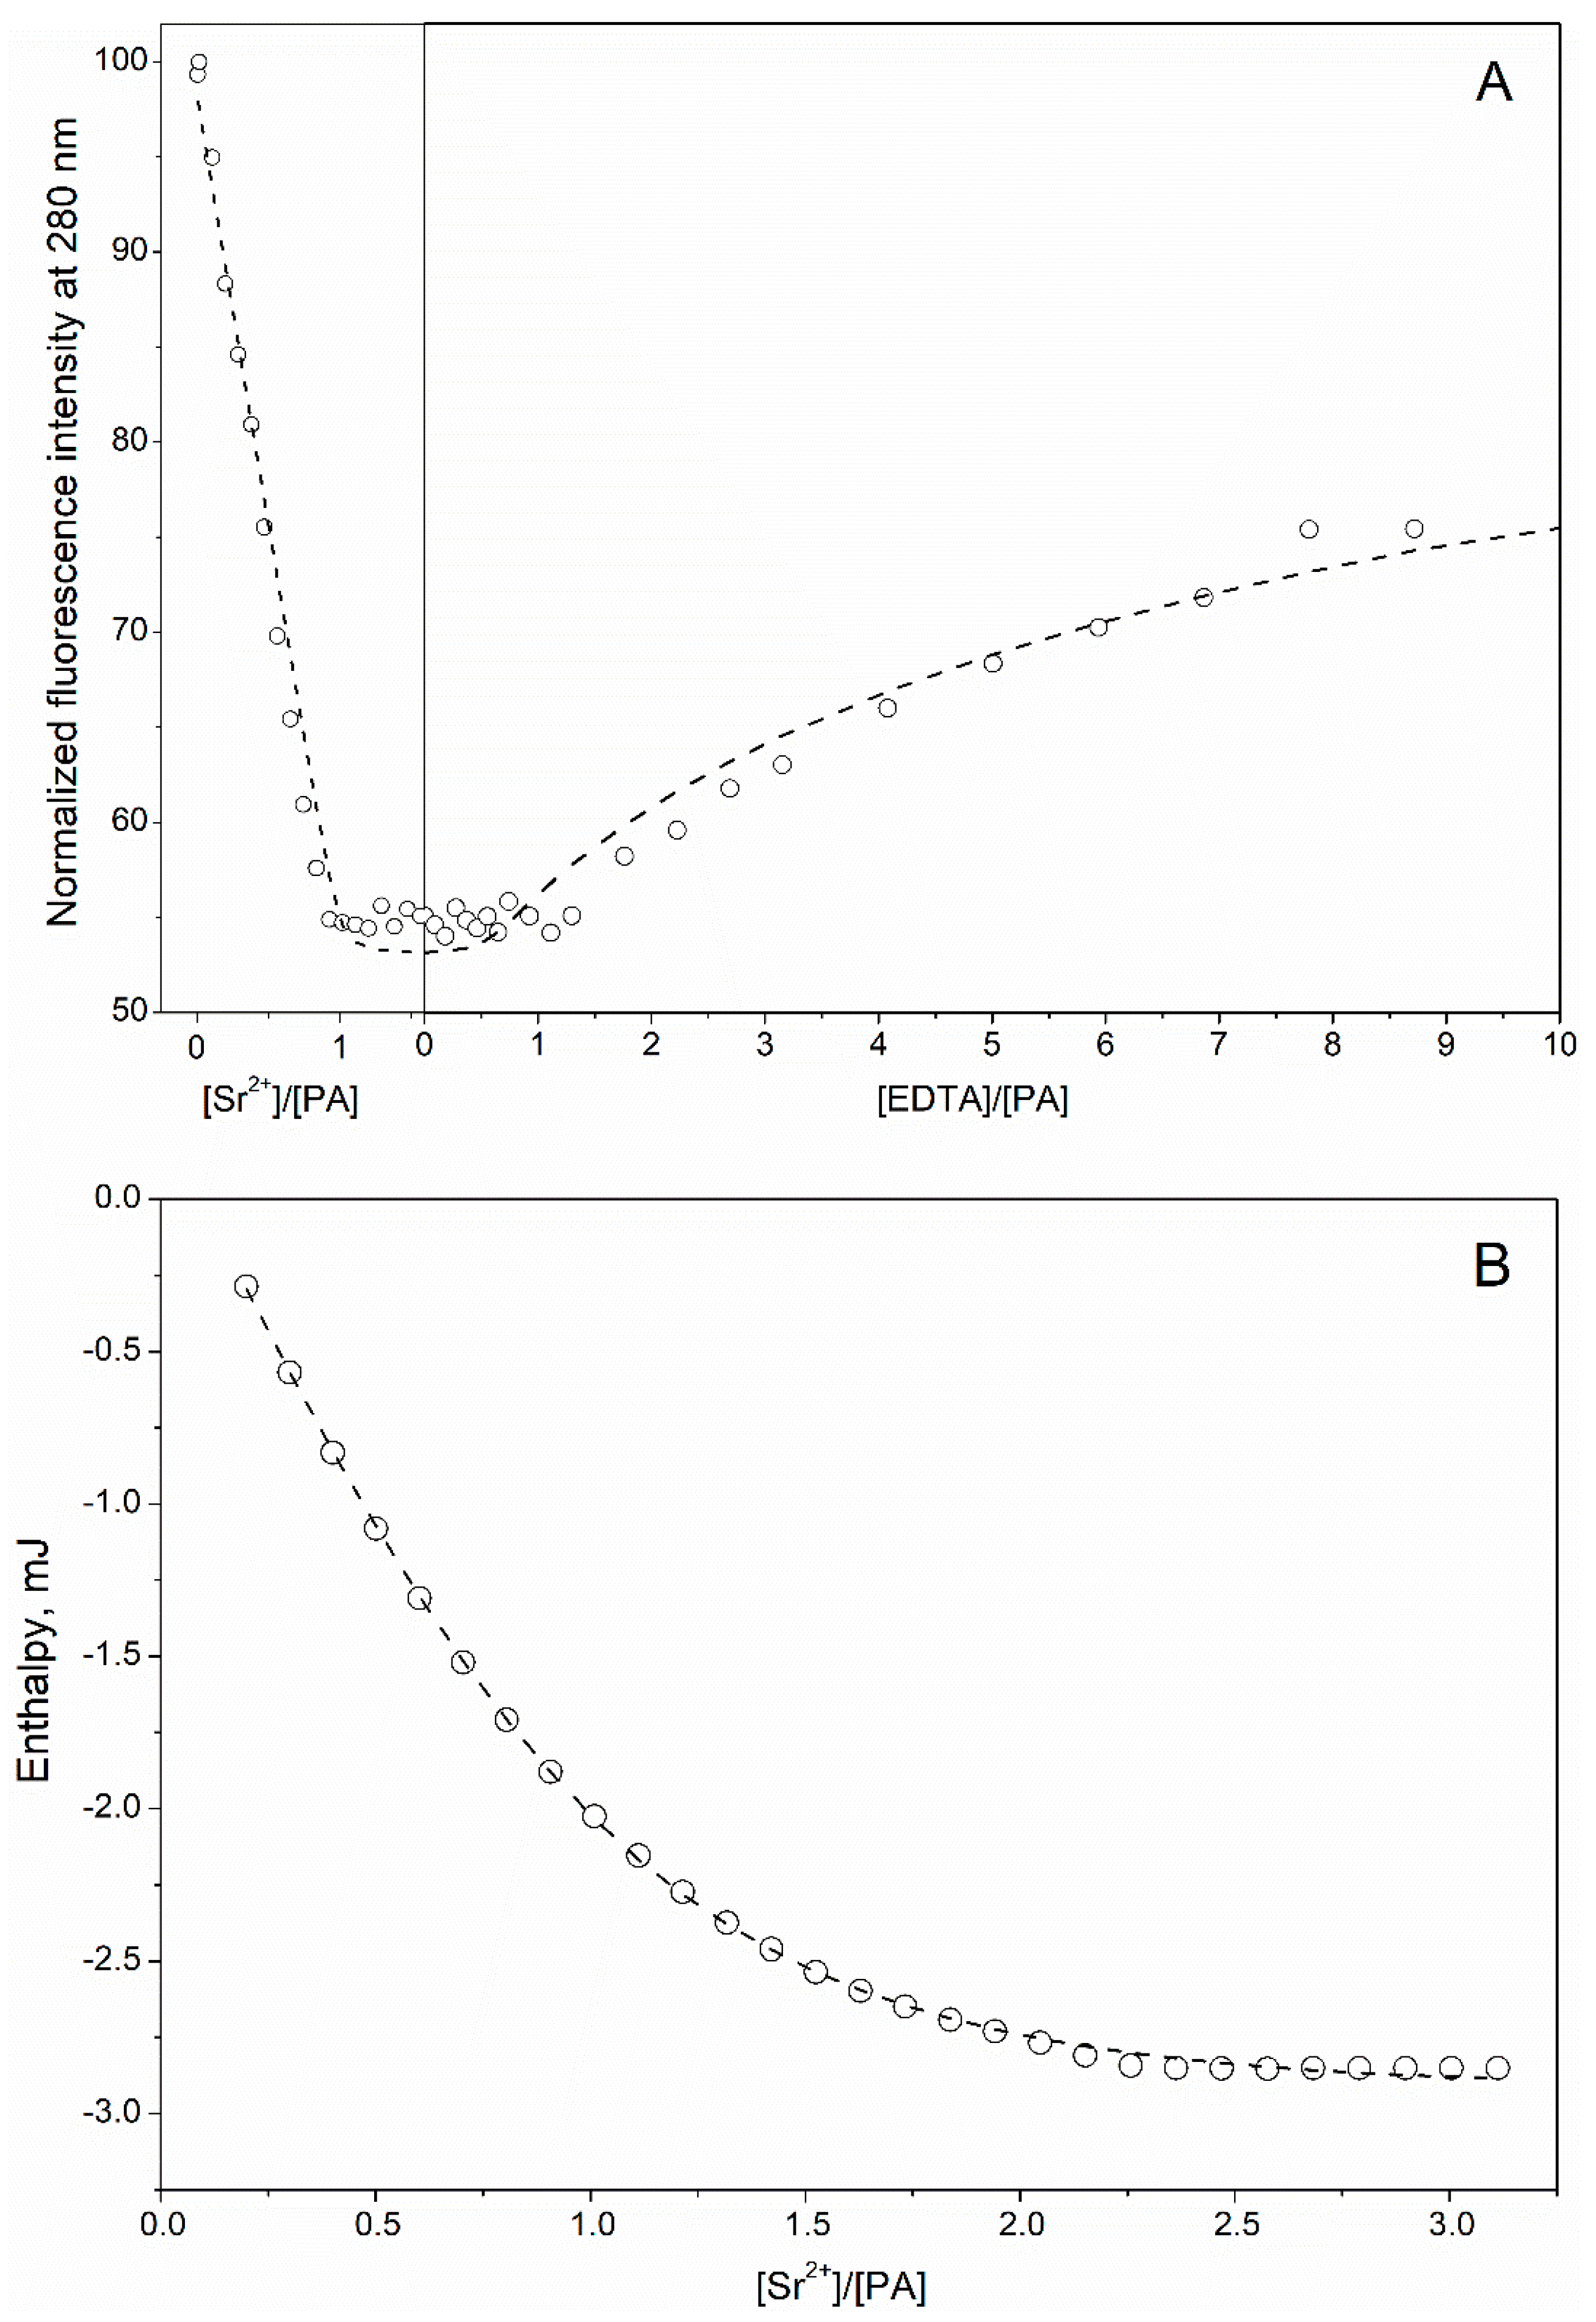
3.1. Ca2+/Sr2+-Binding Properties of Human α-Parvalbumin

The recombinant wild-type human α-parvalbumin (rWT α-PA) was expressed in E. coli strain BL21(DE3), isolated and purified to homogeneity mainly according to [21], with some modifications. Since rWT α-PA lacks W/Y residues, but possesses nine Phe residues, we monitored the Ca2+-binding process via Phe fluorescence (Figure 1A). Addition of Ca2+ to apo-α-PA was accompanied by a decrease in fluorescence intensity of PA up to a Ca2+ to PA molar ratio of 2, followed by a plateau. The further addition of EDTA, a strong Ca2+ chelator, inverted the effect. Thus, Phe fluorescence of rWT α-PA revealed the binding of two Ca2+ ions per protein molecule.
Impairment of the Ca2+-binding loop in the EF domain of α-PA (EF site) by the homologous E102Q substitution in 12th position of the loop (PA-EF mutant) caused a decline in the stoichiometry of Ca2+ binding to PA down to 1:1, and facilitated Ca2+ removal via EDTA (Figure 1B). Meanwhile, the analogous damage of the Ca2+-binding loop in the CD domain of α-PA (CD site) via E63Q substitution (PA-CD mutant) induced a drastic decrease in apparent Ca2+ affinity of the protein and failure to achieve the fluorescence intensity characteristic of the Ca2+-loaded state (Figure 1C). Hence, we may presume the CD site is critical for maintenance of Ca2+ affinity of the protein, while the EF site is less significant. Overall, these experiments provide evidence that binding Ca2+ ions to α-PA is a sequential process, with the CD site being occupied first. Indeed, the fluorescence titration data for rWT α-PA were successfully described within the sequential metal binding scheme (1), considering a competition between the protein and EDTA for Ca2+ (scheme (2)), as shown in Figure 1A and Table 1. The data for PA-EF and PA-CD mutants were approximated by the single site metal binding scheme (3) (Figure 1B,C; Table 1). The inactivation of the EF site suppressed Ca2+ affinity of the CD site by an order of magnitude, while the impairment of the CD site caused a dramatic drop in the effective Ca2+ affinity of the protein by five orders of magnitude.
Spectrofluorimetric titration of rWT α-PA by Sr2+ (Figure 2A) revealed quenching of Phe fluorescence down to the level observed upon addition of Ca2+ (Figure 1A), followed by a plateau at Sr2+ to a PA molar ratio above 1, and a reversal of the effect upon addition of EDTA. The description of the data by the single site metal binding scheme (3), considering the competition between the protein and EDTA for Sr2+ (Equation (2)) shows (Figure 2A and Table 1) that Sr2+ affinity of α-PA was two orders of magnitude lower compared to that for Ca2+. Meanwhile, the titration of rWT α-PA by Sr2+ monitored by ITC clearly demonstrates that the Sr2+-induced thermal effects extended up to Sr2+ and a PA molar ratio of 2 (Figure 2B). Approximation of the ITC data by the sequential metal binding scheme (1) gave two equilibrium Sr2+ association constants (Table 1), one of which was equivalent to the estimate from the fluorimetric titration, while the other was an order of magnitude lower. Hence, Phe fluorescence of rWT α-PA appears to be insensitive to binding of the second Sr2+ ion.
Impairment of CD/EF sites of α-PA was accompanied by Sr2+-induced fluorescence changes closely resembling those observed upon the Ca2+ titrations (Figure 3). While the damage of the EF site suppressed Sr2+ affinity of α-PA by an order of magnitude (Table 1), the impairment of the CD site lowered apparent Sr2+ affinity of the protein by 1.5 orders of magnitude and resulted in an inability to achieve the fluorescence intensity inherent to its Sr2+-loaded form. These results provide evidence that Sr2+ binds to CD/EF sites of rWT α-PA, confirming a pivotal role of the CD site for maintenance of Sr2+ affinity of the protein, and indicating the sequential mechanism of the Sr2+ binding, with the CD site being loaded first.

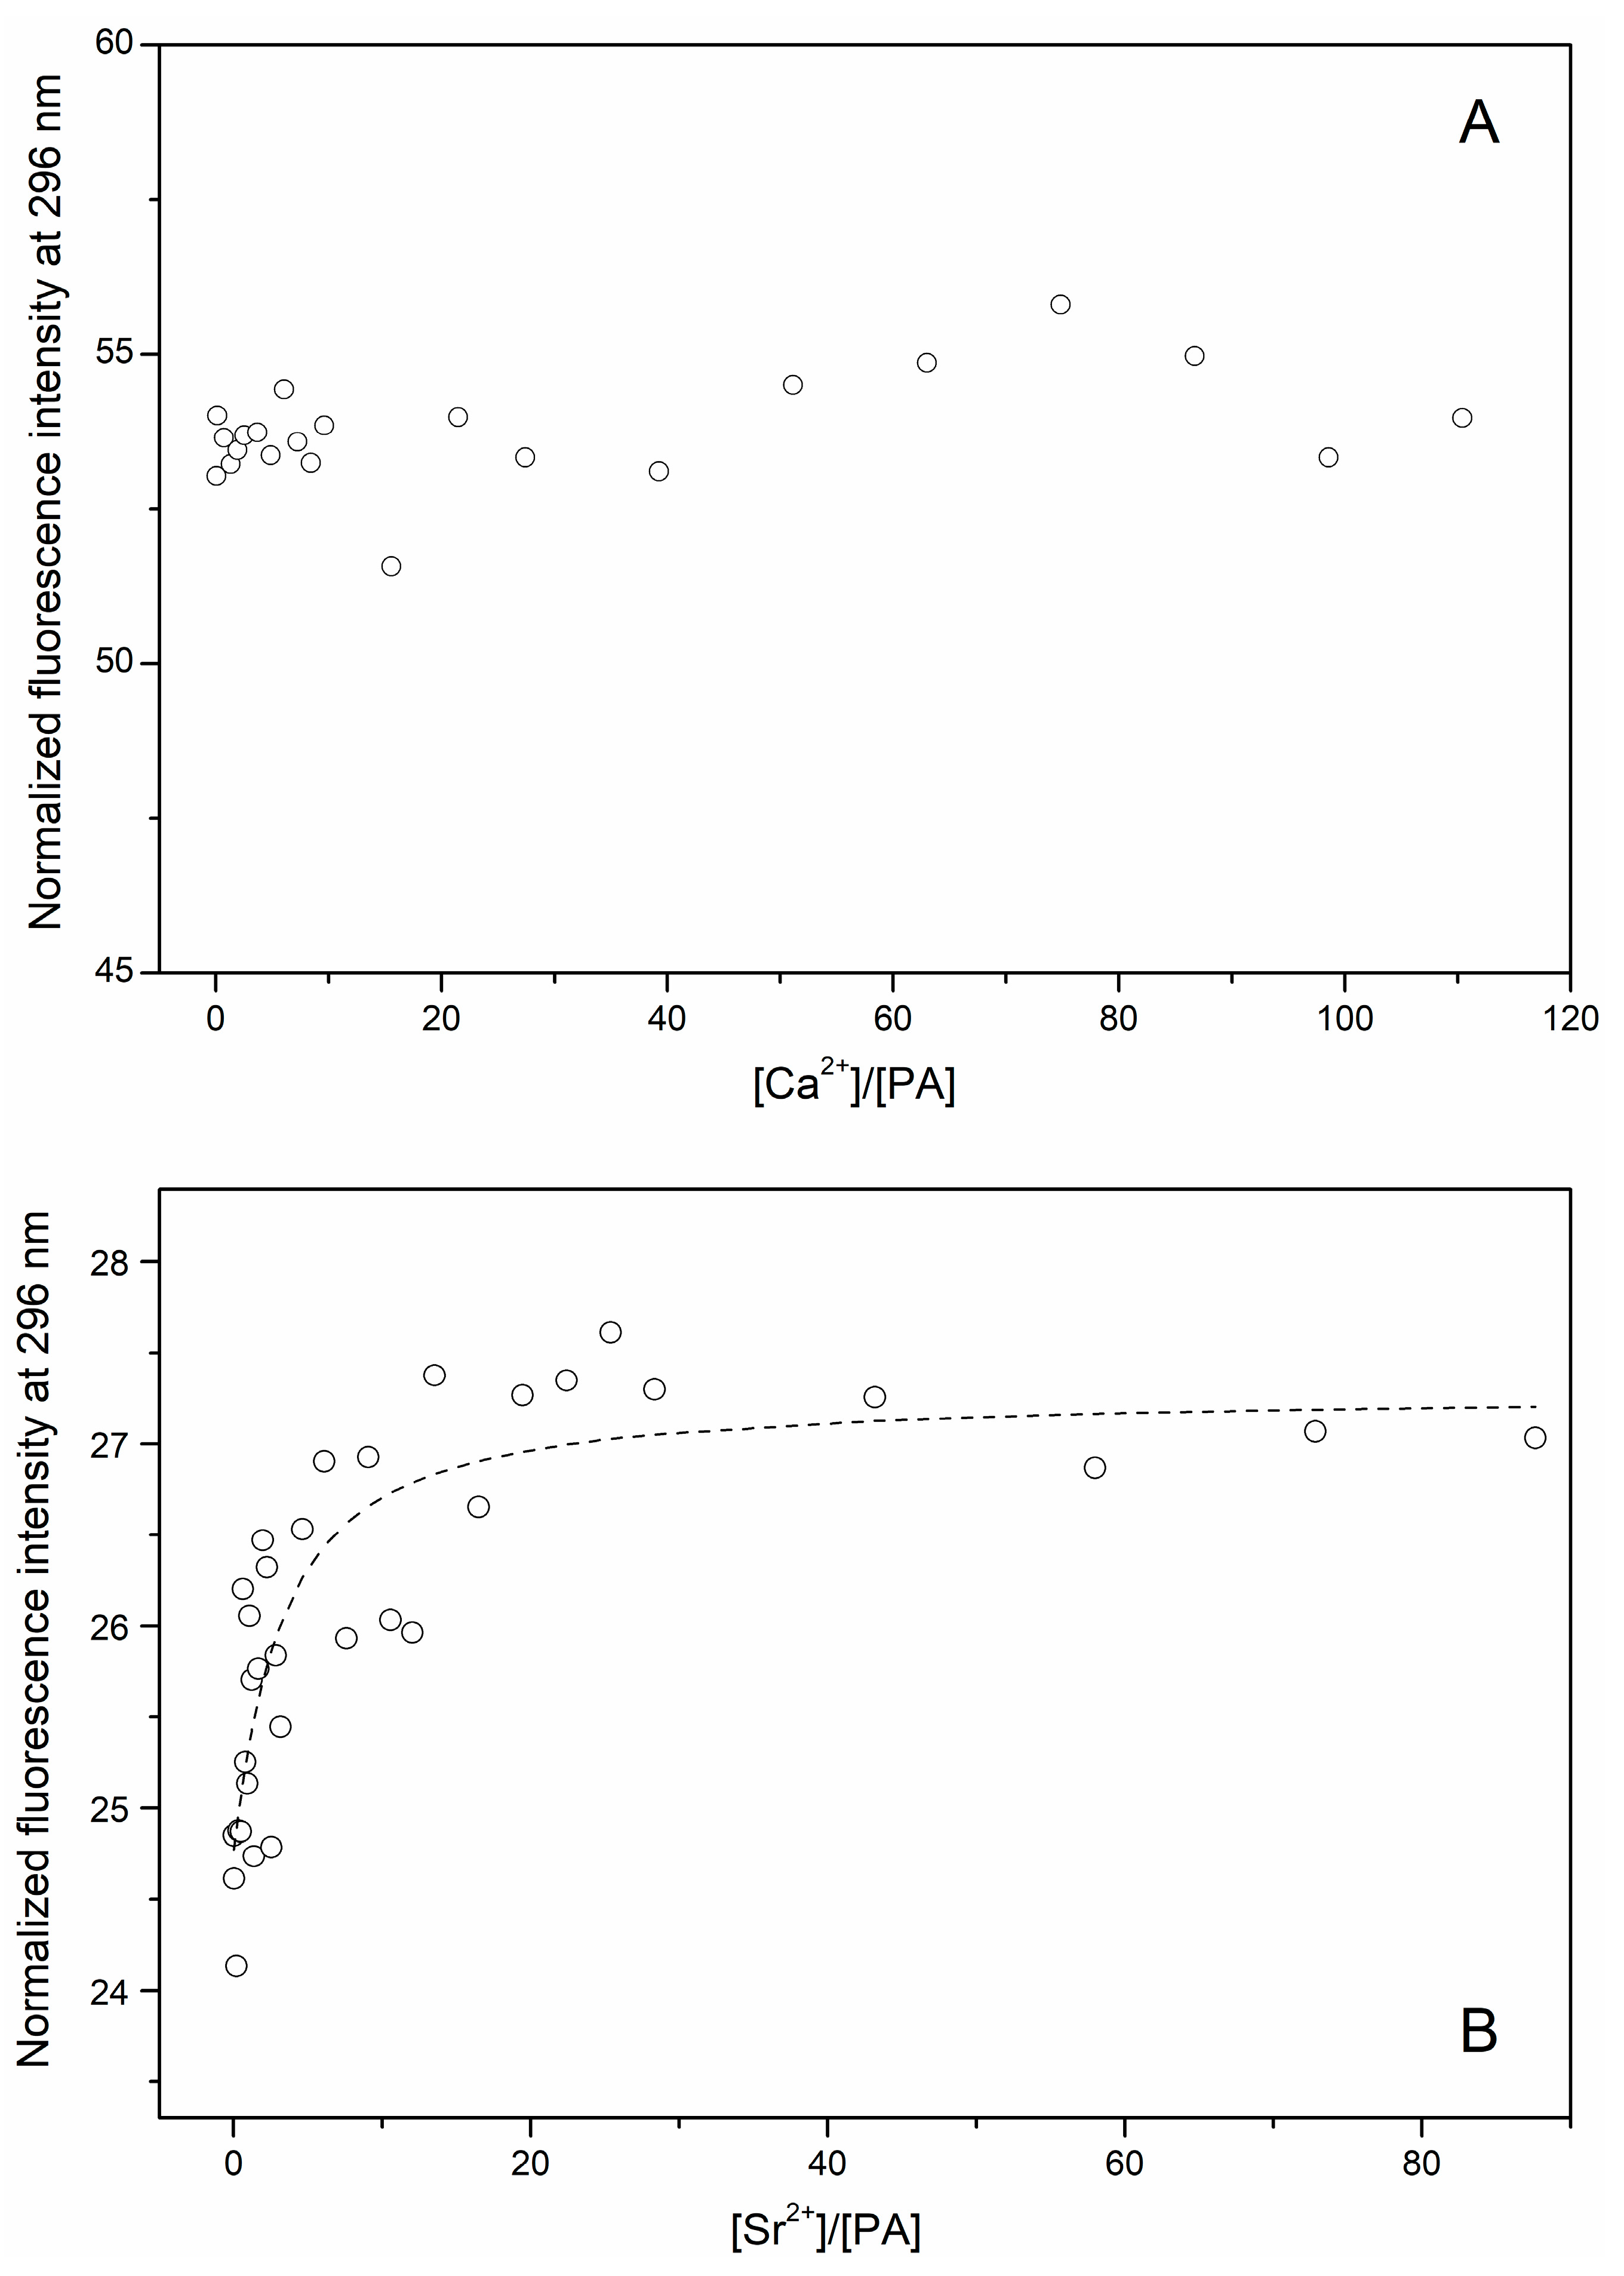
3.2. Secondary Sr2+-Binding Site(s) of Human α-Parvalbumin

Spectrofluorimetric titration of the Sr2+-loaded (100 μM Sr2+) rWT α-PA (12 μM) by Ca2+ up to 1 mM did not reveal noticeable effects (Figure 4A), and reflects nearly identical fluorescence parameters of the Sr2+/Ca2+-loaded proteins states. Meantime, spectrofluorimetric titration of the Ca2+-loaded (100 μM CaCl2) α-PA (1 μM) by Sr2+ up to a Sr2+ to Ca2+ molar ratio of 1:1 induced about a 10% increase in Phe fluorescence intensity (Figure 4B), which indicates the filling of a secondary Sr2+-binding site(s). An evaluation of the effective equilibrium Sr2+ association constant using single site metal binding scheme (3) gave ca. 4 × 10⁵ M−1.

3.3. Comparison of Structural Peculiarities of Sr2+/Ca2+-Loaded States of α-PA

Second-derivative FTIR spectroscopy spectrum of apo-α-PA exhibited some differences from those for the Sr2+/Ca2+-loaded protein at 20 °C (Figure 5). The bands centered around 1660 and 1550 cm−1 corresponded to Amide I and Amide II bands of peptide group, respectively, which overlap with contributions of protein side chains [46]. The FTIR spectroscopy second-derivative spectra of Ca2+- and Sr2+-loaded α-PA states were close to each other, suggesting similarity of their secondary and tertiary structures. The symmetric vibrations of protein COO groups located in the 1392–1425 cm−1 region [46] were similar for Ca2+/Sr2+-loaded α-PA forms, indicating similar states of their COO groups.
Loading of rWT α-PA with Sr2+/Ca2+ gave rise to near-equivalent decreases in molar ellipticity in the near-UV region (Figure 6A), indicating equal metal-induced increases in symmetry of microenvironments among the Phe residues. Similarly, Sr2+/Ca2+ association resulted in equal declines in molar ellipticity in the far-UV region (Figure 6B), indicating equivalent changes in the secondary structure of the protein. Analysis of the far-UV CD spectra using CDPro software [31] showed that Sr2+/Ca2+ binding increases α-helice content of α-PA from 30.6% up to 48–50% (Table 2). Overall, the CD results were in accord with the FTIR spectroscopy data (Figure 5).
Apo-α-PA exhibited a lack of a well-defined heat sorption peak within the temperature region from 20–120 °C, and its heat capacity approached that calculated for the fully unfolded protein (Figure 7), indicating the absence of a rigid tertiary structure, as previously demonstrated for pike α/β-PA (α/β isoform of parvalbumin) and coho salmon β-PA [20,26]. The heat sorption curve for Ca2+-loaded α-PA (1 mM CaCl2) reveals two superimposed heat sorption peaks at temperatures above 90 °C (Figure 7) similar to those found for Ca2+-saturated pike β-PA [33], which suggests the existence of two thermodynamic domains. In accordance with lowered Sr2+ affinity of α-PA relative to its affinity to Ca2+, the Sr2+-induced stabilization of the tertiary structure of the protein was less pronounced: Sr2+ binding gave rise to the appearance of a single heat sorption peak at 86 °C, which is well described within the cooperative two-state model (4) (Table 3).

3.4. Molecular Modeling

The fully optimized models of Ca2+/Sr2+-loaded CD and EF sites of PA are shown in Figure 8. Both metals were heptacoordinated, the glutamates in positions 62 (CD site) and 101 (EF site) bind Ca2+/Sr2+ in a bidentate mode, while the other carboxylic groups coordinated the metals in a monodentate manner, as observed in the X-ray structure 1PAL. The positive values of free energy changed upon substitution of Ca2+ for Sr2+ (ΔGε in Figure 8), confirming that Sr2+ binds more weakly to the both sites of PA than does Ca2+, in accord with the experimental observations (see Table 1). Notably, the free energies of metal exchange for the CD site were smaller than those for the EF site (1.2/1.6 versus 4.1/2.3 kcal/mol, respectively), which was in line with the experimental finding that the difference in Ca2+/Sr2+ affinities of the CD site (Ka equals 4 × 10⁹ for Ca2+ and 2 × 10⁷ M−1 for Sr2+) is smaller than that for the EF site (Ka equals 4 × 10⁹ for Ca2+ and 2 × 10⁶ M−1 for Sr2+). Furthermore, the theoretical results indicate that the metal competition for the CD site was slightly affected by changes in the dielectric constant (similar ΔG4 and ΔG29 values for buried and solvent-exposed binding sites, respectively; Figure 8A), whereas a decrease in the dielectric constant enhanced EF site protection against Sr2+ attack (ΔG4 exceeds ΔG29 in Figure 8B).
The abovementioned results were predicted for the fully optimized metal complexes, suggesting a certain flexibility of the CD/EF site to allow the incoming Sr2+ to affect the coordination geometry. How will the metal competition be affected in the case of a ‘rigid’ binding site? To answer this question, we substituted Ca2+ ions in the fully optimized sites with Sr2+, followed by single point calculations. The increase in the resultant free energies (shown in parentheses in Figure 8) provides evidence that the ‘rigid’ binding pocket favors its selectivity towards Ca2+. Note that EF-hand motifs are known to possess relatively stiff/inflexible structures that promote Ca2+ binding and increase selectivity towards Ca2+ [48].
Being bulkier compared to Ca2+, Sr2+ ions can accommodate more ligands in their first coordination sphere. To study the effect of an increased coordination number of Sr2+ on its competition with Ca2+ for the EF site of PA, we modeled a Sr2+ complex with this site where Sr2+ was 8-coordinated at the expense of an extra bond donated by either a bidentate aspartate (Figure 9A) or an additional water molecule (Figure 9B). The increase in the resultant free energies relative to the values for the heptacoordinated Sr2+ (Figure 8B) implies that in both cases the increase in coordination number of Sr2+ to 8 was unfavorable for competition with Ca2+.
The substitution of the bidenatate anionic Glu at position 12 of the EF-loop of PA for a monodentate neutral Gln decreased affinities of the binding site to Ca2+ and Sr2+ (Table 1). The data presented in Figure 10 suggest that despite the mutation-induced decrease in the metal affinity of the EF site, its metal selectivity did not suffer, since the ΔG values for PA-EF (3.1/3.3 kcal/mol; Figure 10) overlap with the values for the wild-type PA (4.1/2.3 kcal/mol; Figure 8B).

4. Discussion

Rhyner et al. [21] studied Ca2+ binding to recombinant human α-PA and its mutants with inactivated CD and EF sites, but came to essentially different conclusions. While inactivation of the CD site did not affect Ca2+ affinity of the EF site, corruption of the EF site decreased Ca2+ affinity of the CD site. One of the factors, able to explain the discrepancy between our results and those obtained by Rhyner et al. could be use of different solvent conditions. For instance, it seems that elevated K+ level (150 mM KCl) was used by Rhyner et al. K+ ions are known to bind EF-hands of PA [49] and thereby interfere with other ionic equilibria. This suggestion can explain the Ca2+ association constants found by Rhyner et al. that were two orders of magnitude lower (2.3 × 10⁷ M−1).
The marked sensitivity of Sr2+ association with human α-PA to the amino acid substitutions inactivating its CD/EF sites (Figure 2 and Figure 3) gives evidence that the both EF-hands represent primary Sr2+-binding sites of the protein. Furthermore, the experiments with PA-CD and PA-EF mutants (Figure 1 and Figure 3) indicate that Sr2+/Ca2+ binding follows the same sequential mechanism of filling of the EF-hands, with the CD site being filled first. The sequential mechanism has been reported for other EF-hand proteins, including recoverin [50], Neuronal calcium sensor-1 [51], Calcium- and integrin-binding protein [52] and caldendrin [53]. Meanwhile, α-PA binds Sr2+ ions two to three orders of magnitude weaker than Ca2+ ions (Table 1). This result was intuitively expected, since the higher radius of Sr2+ compared to that for Ca2+ (1.18/1.21 Å versus 1.0/1.06 Å [10]) results in lower charge density of the metal and could geometrically prevent Sr2+ from filling the Ca2+-binding sites. The more sophisticated theoretical estimates fully confirm these predictions (Figure 8 and Figure 9), revealing that CD/EF sites of PA are well protected against the exchange of Ca2+ for Sr2+ regardless of coordination number of Sr2+, solvent exposure and rigidity of the sites. The lowered Sr2+ affinity compared to that for Ca2+ seems to be inherent to other EF-hand (calmodulin [54]) and non-EF-hand Ca2+-binding proteins, as exemplified by bovine α-lactalbumin [55].
Magnesium, another element from group II of Periodic table but positioned above calcium, has a much lower ionic radius compared to that for Ca2+: 0.72 Å versus 1.18 Å. Similarly to Sr2+, affinity of PAs for Mg2+ is several orders of magnitude lower than that for Ca2+ [19]. Thus, EF-hands of PA are selective towards calcium ions, which appears to be a consequence of inflexible structure of EF-hands that favors Ca2+ binding and their selectivity towards Ca2+ [48].
Contrary to Mg2+, which typically induces structural rearrangements resembling those observed upon Ca2+ binding but less pronounced (reviewed in [17]), Sr2+ binding to human rWT α-PA was accompanied by structural rearrangements unexpectedly close to those observed in response to Ca2+, as evidenced by the intensity of Phe fluorescence emission (Figure 1A and Figure 2A), FTIR spectroscopy data (Figure 5), near-UV molar ellipticity (Figure 6A), and far-UV CD data (Figure 6B, Table 2). A drastic difference between the Mg2+/Sr2+-induced effects could arise due to difference in coordination numbers of the metals: the smaller Mg2+ is typically characterized by six-coordinate geometry [34,56], while Sr2+ and Ca2+ are heptacoordinated (Figure 8). Nevertheless, Sr2+/Ca2+-loaded α-PA states differ from each other in stability of tertiary structure (Figure 7, Table 3). The Ca2+-loaded α-PA has two cooperative thermal transitions corresponding to the thermal unfolding of two thermodynamic domains, while the Sr2+-bound protein exhibits a single thermal transition corresponding to melting of a single cooperative domain. The difference in thermal behavior of Ca2+/Sr2+-loaded α-PA states likely reflects lowered Sr2+ affinity of the protein, which is insufficient for stabilization of the thermally induced intermediate state [33].
Despite similarities in coordination numbers of Ca2+ and Sr2+ and respectively similar structural consequences of their binding to α-PA, we have revealed a secondary site selective towards Sr2+, evidently different from primary Ca2+-binding sites of the protein (Figure 4B). Filling of the secondary site(s) with Sr2+ affects the microenvironment of the emitting Phe residues, inducing fluorescence intensity changes opposite to those observed upon filling of the primary sites with Sr2+/Ca2+. Since such secondary Sr2+-binding sites escape from competition with Ca2+, they represent the most direct way to interfere with the functioning of EF-hand proteins and, possibly, other proteins. Considering the multitude of functions performed by Ca2+-binding proteins, the structural alterations induced by filling of their Sr2+-selective sites may rationalize the variety of the side effects of strontium ranelate accompanying osteoporosis treatment (see Section 1).

5. Conclusions

The comparative experimental study of Sr2+/Ca2+ binding to recombinant human α-PA and its mutants with inactivated EF-loops have shown that both metals follow the same sequential mechanism of filling CD/EF sites, but Sr2+ affinity of the protein is 2–3 orders of magnitude lower relative to that of Ca2+. The latter effect is fully supported by theoretical predictions, which proved to be robust to level of solvent exposure and rigidity of the metal sites, and varying coordination numbers of Sr2+. Sr2+/Ca2+ binding to α-PA results in strikingly similar protein structures (likely owing to identical coordination numbers of the metals) that differ in stability of tertiary structure due to differences in Sr2+/Ca2+ affinities. The secondary Sr2+-selective site we discovered points to an opportunity for Sr2+ and its radioactive counterpart 90Sr2+ to affect functional activity of proteins without competition with Ca2+ for the same sites.

Author Contributions

Conceptualization, E.A.P., T.D. and S.E.P.; methodology, S.E.P. and T.D.; software, S.E.P.; validation, A.A.V., S.E.P. and T.D.; formal analysis, A.A.V., M.P.S., A.S.K., N.K. and V.N.; investigation, A.A.V., M.P.S., A.S.K., A.S.S., N.I.B., N.K. and V.N.; data curation, E.A.P., T.D. and S.E.P.; writing—original draft preparation, E.A.P. and A.A.V.; writing—review and editing, E.A.P. and S.E.P.; visualization, A.A.V., A.S.K., N.K., V.N. and T.D.; supervision, S.E.P. and T.D.; project administration, S.E.P.; funding acquisition, T.D. and S.E.P. All authors have read and agreed to the published version of the manuscript.

Funding

The experimental studies were funded by a grant to S.E.P. from the Russian Foundation for Basic Research, grant number 19-54-18014. The theoretical studies were funded by the Bilateral Bulgaria-Russia Science Cooperation Program KP-06-Russia/30-2019 (N.K., V.N. and T.D.). The calculations were partly performed owing to access to e-infrastructure of the NCHDC-part of the Bulgarian National Roadmap for RIs, with the financial support from the grant #D01-387/18.12.2020.

Institutional Review Board Statement

Not applicable.

Informed Consent Statement

Not applicable.

Data Availability Statement

Not applicable.

Conflicts of Interest

The authors declare no conflict of interest.

References

  1. Cabrera, W.E.; Schrooten, I.; De Broe, M.E.; D′Haese, P.C. Strontium and bone. J. Bone Miner. Res. 1999, 14, 661–668. [Google Scholar] [CrossRef]
  2. Cianferotti, L.; Gomes, A.R.; Fabbri, S.; Tanini, A.; Brandi, M.L. The calcium-sensing receptor in bone metabolism: From bench to bedside and back. Osteoporos. Int. 2015, 26, 2055–2071. [Google Scholar] [CrossRef] [PubMed]
  3. Marie, P.J.; Ammann, P.; Boivin, G.; Rey, C. Mechanisms of action and therapeutic potential of strontium in bone. Calcif. Tissue Int. 2001, 69, 121–129. [Google Scholar] [CrossRef] [PubMed]
  4. Pilmane, M.; Salma-Ancane, K.; Loca, D.; Locs, J.; Berzina-Cimdina, L. Strontium and strontium ranelate: Historical review of some of their functions. Mater. Sci. Eng. C Mater. Biol. Appl. 2017, 78, 1222–1230. [Google Scholar] [CrossRef]
  5. Geng, Y.; Mosyak, L.; Kurinov, I.; Zuo, H.; Sturchler, E.; Cheng, T.C.; Subramanyam, P.; Brown, A.P.; Brennan, S.C.; Mun, H.C.; et al. Structural mechanism of ligand activation in human calcium-sensing receptor. Elife 2016, 5, e13662. [Google Scholar] [CrossRef] [PubMed]
  6. Nielsen, S.P. The biological role of strontium. Bone 2004, 35, 583–588. [Google Scholar] [CrossRef]
  7. Kolodziejska, B.; Stepien, N.; Kolmas, J. The Influence of Strontium on Bone Tissue Metabolism and Its Application in Osteoporosis Treatment. Int. J. Mol. Sci. 2021, 22, 6564. [Google Scholar] [CrossRef]
  8. Diepenhorst, N.A.; Leach, K.; Keller, A.N.; Rueda, P.; Cook, A.E.; Pierce, T.L.; Nowell, C.; Pastoureau, P.; Sabatini, M.; Summers, R.J.; et al. Divergent effects of strontium and calcium-sensing receptor positive allosteric modulators (calcimimetics) on human osteoclast activity. Br. J. Pharmacol. 2018, 175, 4095–4108. [Google Scholar] [CrossRef] [Green Version]
  9. Kraeber-Bodere, F.; Campion, L.; Rousseau, C.; Bourdin, S.; Chatal, J.F.; Resche, I. Treatment of bone metastases of prostate cancer with strontium-89 chloride: Efficacy in relation to the degree of bone involvement. Eur. J. Nucl. Med. 2000, 27, 1487–1493. [Google Scholar] [CrossRef]
  10. Shannon, R.D. Revised Effective Ionic Radii and Systematic Studies of Interatomic Distances in Halides and Chalcogenides. Acta Crystallogr. 1976, A32, 751–767. [Google Scholar] [CrossRef]
  11. Dudev, M.; Wang, J.; Dudev, T.; Lim, C. Factors Governing the Metal Coordination Number in Metal Complexes from Cambridge Structural Database Analysis. J. Phys. Chem. 2006, B110, 1889–1895. [Google Scholar] [CrossRef] [PubMed]
  12. Hofer, T.S.; Randolf, B.R.; Rode, B.M. Sr(II) in Water: A Labile Hydrate with a Highly Mobile Structure. J. Phys. Chem. 2006, 110, 20409–20417. [Google Scholar] [CrossRef]
  13. Saidak, Z.; Marie, P.J. Strontium signaling: Molecular mechanisms and therapeutic implications in osteoporosis. Pharmacol. Ther. 2012, 136, 216–226. [Google Scholar] [CrossRef] [PubMed]
  14. Brown, E.M. Is the calcium receptor a molecular target for the actions of strontium on bone ? Osteoporos. Int. 2003, 14, 25–34. [Google Scholar] [CrossRef]
  15. Encyclopedia of metalloproteins; Springer: New York, NY, USA, 2013.
  16. Nockolds, C.E.; Kretsinger, R.H.; Coffee, C.J.; Bradshaw, R.A. Structure of a calcium-binding carp myogen. Proc. Natl. Acad. Sci. USA 1972, 69, 581–584. [Google Scholar] [CrossRef] [Green Version]
  17. Permyakov, E.A.; Kretsinger, R.H. Calcium Binding Proteins; A John Wiley & Sons, Inc.: New Jersey, NJ, USA, 2011. [Google Scholar]
  18. Permyakov, E.A.; Uversky, V.N.; Permyakov, S.E. Parvalbumin as a pleomorphic protein. Curr. Protein Pept. Sci. 2016, 18, 780–794. [Google Scholar] [CrossRef] [PubMed]
  19. Permyakov, E.A. Parvalbumin; Nova Science Publishers, Inc.: New York, NY, USA, 2006. [Google Scholar]
  20. Vologzhannikova, A.A.; Khorn, P.A.; Kazakov, A.S.; Ismailov, R.G.; Sokolov, A.S.; Uversky, V.N.; Permyakov, E.A. In search for globally disordered apo-parvalbumins: Case of parvalbumin β-1 from coho salmon. Cell Calcium 2017, 67, 53–640. [Google Scholar] [CrossRef] [PubMed]
  21. Rhyner, J.A.; Durussel, I.; Cox, J.A.; Ilg, E.C.; Schafer, B.W.; Heizmann, C.W. Human recombinant alpha-parvalbumin and nine mutants with individually inactivated calcium- and magnesium-binding sites: Biochemical and immunological properties. Biochim. Biophys. Acta 1996, 1313, 179–186. [Google Scholar] [CrossRef] [Green Version]
  22. Laible, M.; Boonrod, K. Homemade site directed mutagenesis of whole plasmids. J. Vis. Exp. 2009, 11, 1135. [Google Scholar] [CrossRef] [Green Version]
  23. Narita, K. Isolation of acetylpeptide from enzymic digests of TMV-protein. Biochim. Biophys. Acta 1958, 28, 184–191. [Google Scholar] [CrossRef]
  24. Schwaller, B. The use of transgenic mouse models to reveal the functions of Ca(2+) buffer proteins in excitable cells. Biochim. Biophys. Acta 2012, 1820, 1294–1303. [Google Scholar] [CrossRef]
  25. Blum, H.E.; Lehky, P.; Kohler, L.; Stein, E.A.; Fischer, E.H. Comparative properties of vertebrate parvalbumins. J. Biol. Chem. 1977, 252, 2834–2838. [Google Scholar] [CrossRef]
  26. Permyakov, S.E.; Bakunts, A.G.; Denesyuk, A.I.; Knyazeva, E.L.; Uversky, V.N.; Permyakov, E.A. Apo-parvalbumin as an intrinsically disordered protein. Proteins 2008, 72, 822–836. [Google Scholar] [CrossRef]
  27. Permyakov, S.E.; Vologzhannikova, A.A.; Emelyanenko, V.I.; Knyazeva, E.L.; Kazakov, A.S.; Lapteva, Y.S.; Permyakova, M.E.; Zhadan, A.P.; Permyakov, E.A. The impact of alpha-N-acetylation on structural and functional status of parvalbumin. Cell Calcium 2012, 52, 366–376. [Google Scholar] [CrossRef]
  28. Permyakov, E.A.; Ostrovsky, A.V.; Kalinichenko, L.P. Stopped-flow kinetic studies of Ca(II) and Mg(II) dissociation in cod parvalbumin and bovine alpha-lactalbumin. Biophys. Chem. 1987, 28, 225–233. [Google Scholar] [CrossRef]
  29. Schwarzenbach, G.; Flaschka, H. Die Komplexometrische Titration; Ferdinand Enke Verlag: Stuttgart, Germany, 1965. [Google Scholar]
  30. Marquardt, D.W. An algorithm for least-squares estimation of nonlinear parameters. J. Soc. Indust. Appl. Math. 1963, 11, 431–441. [Google Scholar] [CrossRef]
  31. Sreerama, N.; Venyaminov, S.Y.; Woody, R.W. Estimation of protein secondary structure from circular dichroism spectra: Inclusion of denatured proteins with native proteins in the analysis. Anal. Biochem. 2000, 287, 243–251. [Google Scholar] [CrossRef] [Green Version]
  32. Makhatadze, G.I.; Privalov, P.L. Heat capacity of proteins. I. Partial molar heat capacity of individual amino acid residues in aqueous solution: Hydration effect. J. Mol. Biol. 1990, 213, 375–384. [Google Scholar] [CrossRef]
  33. Permyakov, S.E.; Bakunts, A.G.; Permyakova, M.E.; Denesyuk, A.I.; Uversky, V.N.; Permyakov, E.A. Metal-controlled interdomain cooperativity in parvalbumins. Cell Calcium 2009, 46, 163–175. [Google Scholar] [CrossRef] [Green Version]
  34. Declercq, J.P.; Tinant, B.; Parello, J.; Rambaud, J. Ionic interactions with parvalbumins. Crystal structure determination of pike 4.10 parvalbumin in four different ionic environments. J. Mol. Biol. 1991, 220, 1017–1039. [Google Scholar] [CrossRef]
  35. Zhao, Y.; Truhlar, D.G. The M06 suite of density functionals for main group thermochemistry, thermochemical kinetics, noncovalent interactions, excited states, and transition elements: Two new functionals and systematic testing of four M06-class functionals and 12 other functionals. Theor. Chem. Acc. 2006, 120, 215–241. [Google Scholar]
  36. Dudev, T.; Cheshmedzhieva, D.; Doudeva, L. Competition between abiogenic Al3+ and native Mg2+, Fe2+ and Zn2+ ions in protein binding sites: Implications for aluminum toxicity. J. Mol. Modeling 2018, 24, 55. [Google Scholar] [CrossRef]
  37. Dudev, T.; Nikolova, V. Determinants of Fe2+ over M2+ (M = Mg, Mn, Zn) Selectivity in Non-Heme Iron Proteins. Inorg. Chem. 2016, 55, 12644–12650. [Google Scholar] [CrossRef] [PubMed] [Green Version]
  38. Gaussian 09; Revision A.02; Gaussian, Inc.: Wallingford, CT, USA, 2016.
  39. Zheng, J.; Truhlar, D.G. Including Torsional Anharmonicity in Canonical and Microcanonical Reaction Path Calculations. J. Chem. Theory Comput. 2013, 9, 2875–2881. [Google Scholar] [CrossRef]
  40. Dudev, T.; Lim, C. Determinants of K+ vs Na+ Selectivity in potassium channels. J. Am. Chem. Soc. 2009, 131, 8092–8101. [Google Scholar] [CrossRef]
  41. Ambjørn, M.; Ejlerskov, P.; Liu, Y.; Lees, M.; Jäättelä, M.; Issazadeh-Navikas, S. IFNB1/interferon-β-induced autophagy in MCF-7 breast cancer cells counteracts its proapoptotic function. Autophagy 2013, 9, 287–302. [Google Scholar] [CrossRef] [PubMed] [Green Version]
  42. Mertz, E.L.; Krishtalik, L.I. Low dielectric response in enzyme active site. Proc. Natl. Acad. Sci. USA 2000, 97, 2081–2086. [Google Scholar] [CrossRef] [Green Version]
  43. Marenich, A.V.; Cramer, C.J.; Truhlar, D.G. Universal solvation model based on solute electron density and on a continuum model of the solvent defined by the bulk dielectric constant and atomic surface tensions. J. Phys. Chem. 2009, 113, 6378–6396. [Google Scholar] [CrossRef]
  44. Marcus, Y. Thermodynamics of solvation of ions. 5. Gibbs free energy of hydration at 298.15 K. J. Chem. Soc. Faraday Trans. 1991, 87, 2995–2999. [Google Scholar] [CrossRef]
  45. Smith, R.M.; Martell, A.E. Critical stability constants, enthalpies and entropies for the formation of metal complexes of aminopolycarboxylic acids and carboxylic acids. Sci. Total Environ. 1987, 64, 125–147. [Google Scholar] [CrossRef]
  46. Barth, A. The infrared absorption of amino acid side chains. Prog. Biophys. Mol. Biol. 2000, 74, 141–173. [Google Scholar] [CrossRef]
  47. Permyakov, S.E. Differential scanning microcalorimetry of intrinsically disordered proteins. Methods Mol. Biol. 2012, 896, 283–296. [Google Scholar] [CrossRef]
  48. Dudev, T.; Lim, C. Calcium Ion Selectivity in Biological Systems. In Encyclopedia of Metalloproteins; Uversky, V.N., Kretsinger, R.H., Permyakov, E.A., Eds.; Springer Science: New York, NY, USA, 2013; pp. 478–484. [Google Scholar]
  49. Permyakov, E.A.; Kalinichenko, L.P.; Medvedkin, V.N.; Burstein, E.A.; Gerday, C. Sodium and potassium binding to parvalbumins measured by means of intrinsic protein fluorescence. Biochim. Biophys. Acta 1983, 749, 185–191. [Google Scholar] [CrossRef]
  50. Permyakov, S.E.; Cherskaya, A.M.; Senin, I.I.; Zargarov, A.A.; Shulga-Morskoy, S.V.; Alekseev, A.M.; Zinchenko, D.V.; Lipkin, V.M.; Philippov, P.P.; Uversky, V.N.; et al. Effects of mutations in the calcium-binding sites of recoverin on its calcium affinity: Evidence for successive filling of the calcium binding sites. Protein Eng. 2000, 13, 783–790. [Google Scholar] [CrossRef] [PubMed]
  51. Chandra, K.; Ramakrishnan, V.; Sharma, Y.; Chary, K.V. N-terminal myristoylation alters the calcium binding pathways in neuronal calcium sensor-1. J. Biol. Inorg. Chem. 2011, 16, 81–95. [Google Scholar] [CrossRef] [PubMed]
  52. Yamniuk, A.P.; Nguyen, L.T.; Hoang, T.T.; Vogel, H.J. Metal ion binding properties and conformational states of calcium- and integrin-binding protein. Biochemistry 2004, 43, 2558–2568. [Google Scholar] [CrossRef] [PubMed]
  53. Kiran, U.; Regur, P.; Kreutz, M.R.; Sharma, Y.; Chakraborty, A. Intermotif Communication Induces Hierarchical Ca(2+) Filling of Caldendrin. Biochemistry 2017, 56, 2467–2476. [Google Scholar] [CrossRef]
  54. Shirran, S.L.; Barran, P.E. The use of ESI-MS to probe the binding of divalent cations to calmodulin. J. Am. Soc. Mass. Spectrom. 2009, 20, 1159–1171. [Google Scholar] [CrossRef]
  55. Schaer, J.J.; Milos, M.; Cox, J.A. Thermodynamics of the binding of calcium and strontium to bovine alpha-lactalbumin. FEBS Lett. 1985, 190, 77–80. [Google Scholar] [CrossRef] [Green Version]
  56. Blancuzzi, Y.; Padilla, A.; Parello, J.; Cave, A. Symmetrical rearrangement of the cation-binding sites of parvalbumin upon Ca2+/Mg2+ exchange. A study by 1H 2D NMR. Biochemistry 1993, 32, 1302–1309. [Google Scholar] [CrossRef]
Figure 1. Spectrofluorimetric titrations of rWT α-PA (A) and its mutant forms, PA-EF (B) and PA-CD (C) via Ca2+/EDTA at 20 °C (10 mM HEPES-KOH, pH 8.1). Protein concentration is 12–17 μM. Fluorescence was excited at 259 nm. The points are experimental. (A) The curve is fit according to the sequential metal binding scheme (1), considering a competition between the protein and EDTA for Ca2+ (scheme (2)). (B,C) The curve is a fit within the single site metal binding scheme (3). The competition between the protein and EDTA for Ca2+ is taken into account for PA-EF.
Biomolecules 11 01158 g001
Figure 2. The interaction of Sr2+ with rWT α-PA at 20 °C, followed by Phe fluorescence (A) and ITC (B) (10 mM HEPES-KOH pH 8.1). The points are experimental. (A) Protein concentration is 19 μM. Fluorescence was excited at 259 nm. The data are approximated by the single site metal binding scheme (3), considering a competition between the protein and EDTA for Sr2+ (scheme (2)). (B) Protein concentration is 97 μM. The curve is a fit according to the sequential metal binding scheme (1).
Biomolecules 11 01158 g002
Figure 3. The interaction of Sr2+/Ca2+ with PA-EF (A) and PA-CD (B) at 20 °C, followed by Phe fluorescence (10 mM HEPES-KOH pH 8.1). Protein concentration is 14–19 μM. Fluorescence was excited at 259 nm. The points are experimental. The curves are approximated by the single site metal binding scheme (3). In the case of PA-EF, the competition between the protein and EDTA for metal ions (scheme (2)) is taken into account.
Biomolecules 11 01158 g003
Figure 4. Spectrofluorimetric study of competition between Sr2+ and Ca2+ for rWT α-PA at 20 °C (10 mM HEPES-KOH, pH 8.1). Fluorescence was excited at 259 nm. (A) Titration of metal-depleted α-PA (12 μM) by Ca2+ in the presence of 100 μM SrCl2. (B) Titration of α-PA (1 μM) by Sr2+ in the presence of 100 μM CaCl2.
Biomolecules 11 01158 g004
Figure 5. Second-derivative FTIR spectroscopy spectra of apo- and Sr2+/Ca2+-loaded (10 mM) α-PA (3 mM) at 20 °C (10 mM H3BO3-KOH, pH 9.0).
Biomolecules 11 01158 g005
Figure 6. Near- (A) and far-UV (B) CD spectra for apo- and Sr2+/Ca2+-loaded states of rWT α-PA at 20 °C (10 mM H3BO3-KOH, pH 9.0, 1 mM EDTA or 1 mM SrCl2/CaCl2). Protein concentration was 6.2–7.5 and 126–129 µM for far- and near-UV regions, respectively.
Biomolecules 11 01158 g006
Figure 7. Temperature dependencies of specific heat capacities of metal-depleted and Sr2+/Ca2+-bound states of rWT α-PA, derived from DSC data according to [47]. Protein concentration is 1.2–1.8 mg/mL. Buffer conditions: 10 mM H3BO3-KOH pH 9.0, 1 mM SrCl2/CaCl2 or without additions. Heating rate is 0.86 K/min. The data for the Sr2+-loaded form were analyzed according to the cooperative two-state model (4). The theoretical curve is shown in light grey. The dotted curve corresponds to the specific heat capacity of the fully unfolded α-PA, calculated according to [32].
Biomolecules 11 01158 g007
Figure 8. The optimized structures of Ca2+/Sr2+-loaded CD (A) and EF (B) sites of PA, and free energies of metal exchange (in kcal/mol). The free energies evaluated for ‘rigid’ Ca2+-binding sites are given in parentheses. Metal coordination number is indicated in parentheses in the complex name.
Biomolecules 11 01158 g008
Figure 9. The optimized structures of Ca2+/Sr2+-loaded EF site of PA with 8-coordinated Sr2+, and free energies of metal exchange (in kcal/mol). Sr2+ acquires an additional bond at the expense of either bidentate Asp binding (A) or an additional water molecule (B). Metal coordination number is indicated in parentheses in the complex name.
Biomolecules 11 01158 g009
Figure 10. The optimized structures of Ca2+/Sr2+-loaded EF site of PA-EF, and free energies of metal exchange (in kcal/mol). Metal coordination number is indicated in parentheses in the complex name.
Biomolecules 11 01158 g010
Table 1. The equilibrium Ca2+/Sr2+ association constants for rWT α-PA and its mutant forms at 20 °C, evaluated from the intrinsic fluorescence and ITC data, shown in Figure 1, Figure 2 and Figure 3 (10 mM HEPES-KOH, pH 8.1).
Ca2+
ProteinFluorimetric titrations
K1, M−1K2, M−1
rWT4 × 1094 × 109
PA-CD5 × 104
PA-EF4 × 108
Sr2+
ProteinFluorimetric titrations/ITC
K1, M−1K2, M−1
rWT3 × 107/(2 × 107 and 2 × 10⁶)
PA-CD1 × 106
PA-EF2 × 106
Table 2. The secondary structure fractions estimated for rWT α-PA at 20 °C from the CD data shown in Figure 6, using CDPro software [31].
Protein Stateα-Helices, %β-Sheets, %Turns, %Random Coil, %
apo30.6 ± 0.217.6 ± 0.319.6 ± 0.331.50 ± 0.10
Sr2+50.1 ± 0.27.4 ± 0.315.5 ± 0.326.80 ± 0.10
Ca2+48.2 ± 0.28.6 ± 0.315.7 ± 0.327.30 ± 0.10
Table 3. Thermodynamic parameters of thermal denaturation of Sr2+-loaded α-PA estimated from the DSC data shown in Figure 6 according to the cooperative two-state model (4): mid-transition temperature (T0), enthalpy of protein denaturation at temperature T0H0), heat capacity change accompanying the transition (ΔCp) and number of molecules involved into transition (n).
T0, °CΔH0, J/gΔCp, J/(g·K)n
86.037.50.400.81
Publisher’s Note: MDPI stays neutral with regard to jurisdictional claims in published maps and institutional affiliations.

