
Shorter Chain Triglycerides Are Negatively Associated with Symptom Improvement in Schizophrenia

 ,
, 
Abstract
:1. Introduction
2. Materials and Methods
2.1. Patients and Sample Collection
2.2. Lipid Extraction and Lipidomics Measurements
2.3. Lipidomics Data Processing
2.4. Statistical Analysis
3. Results
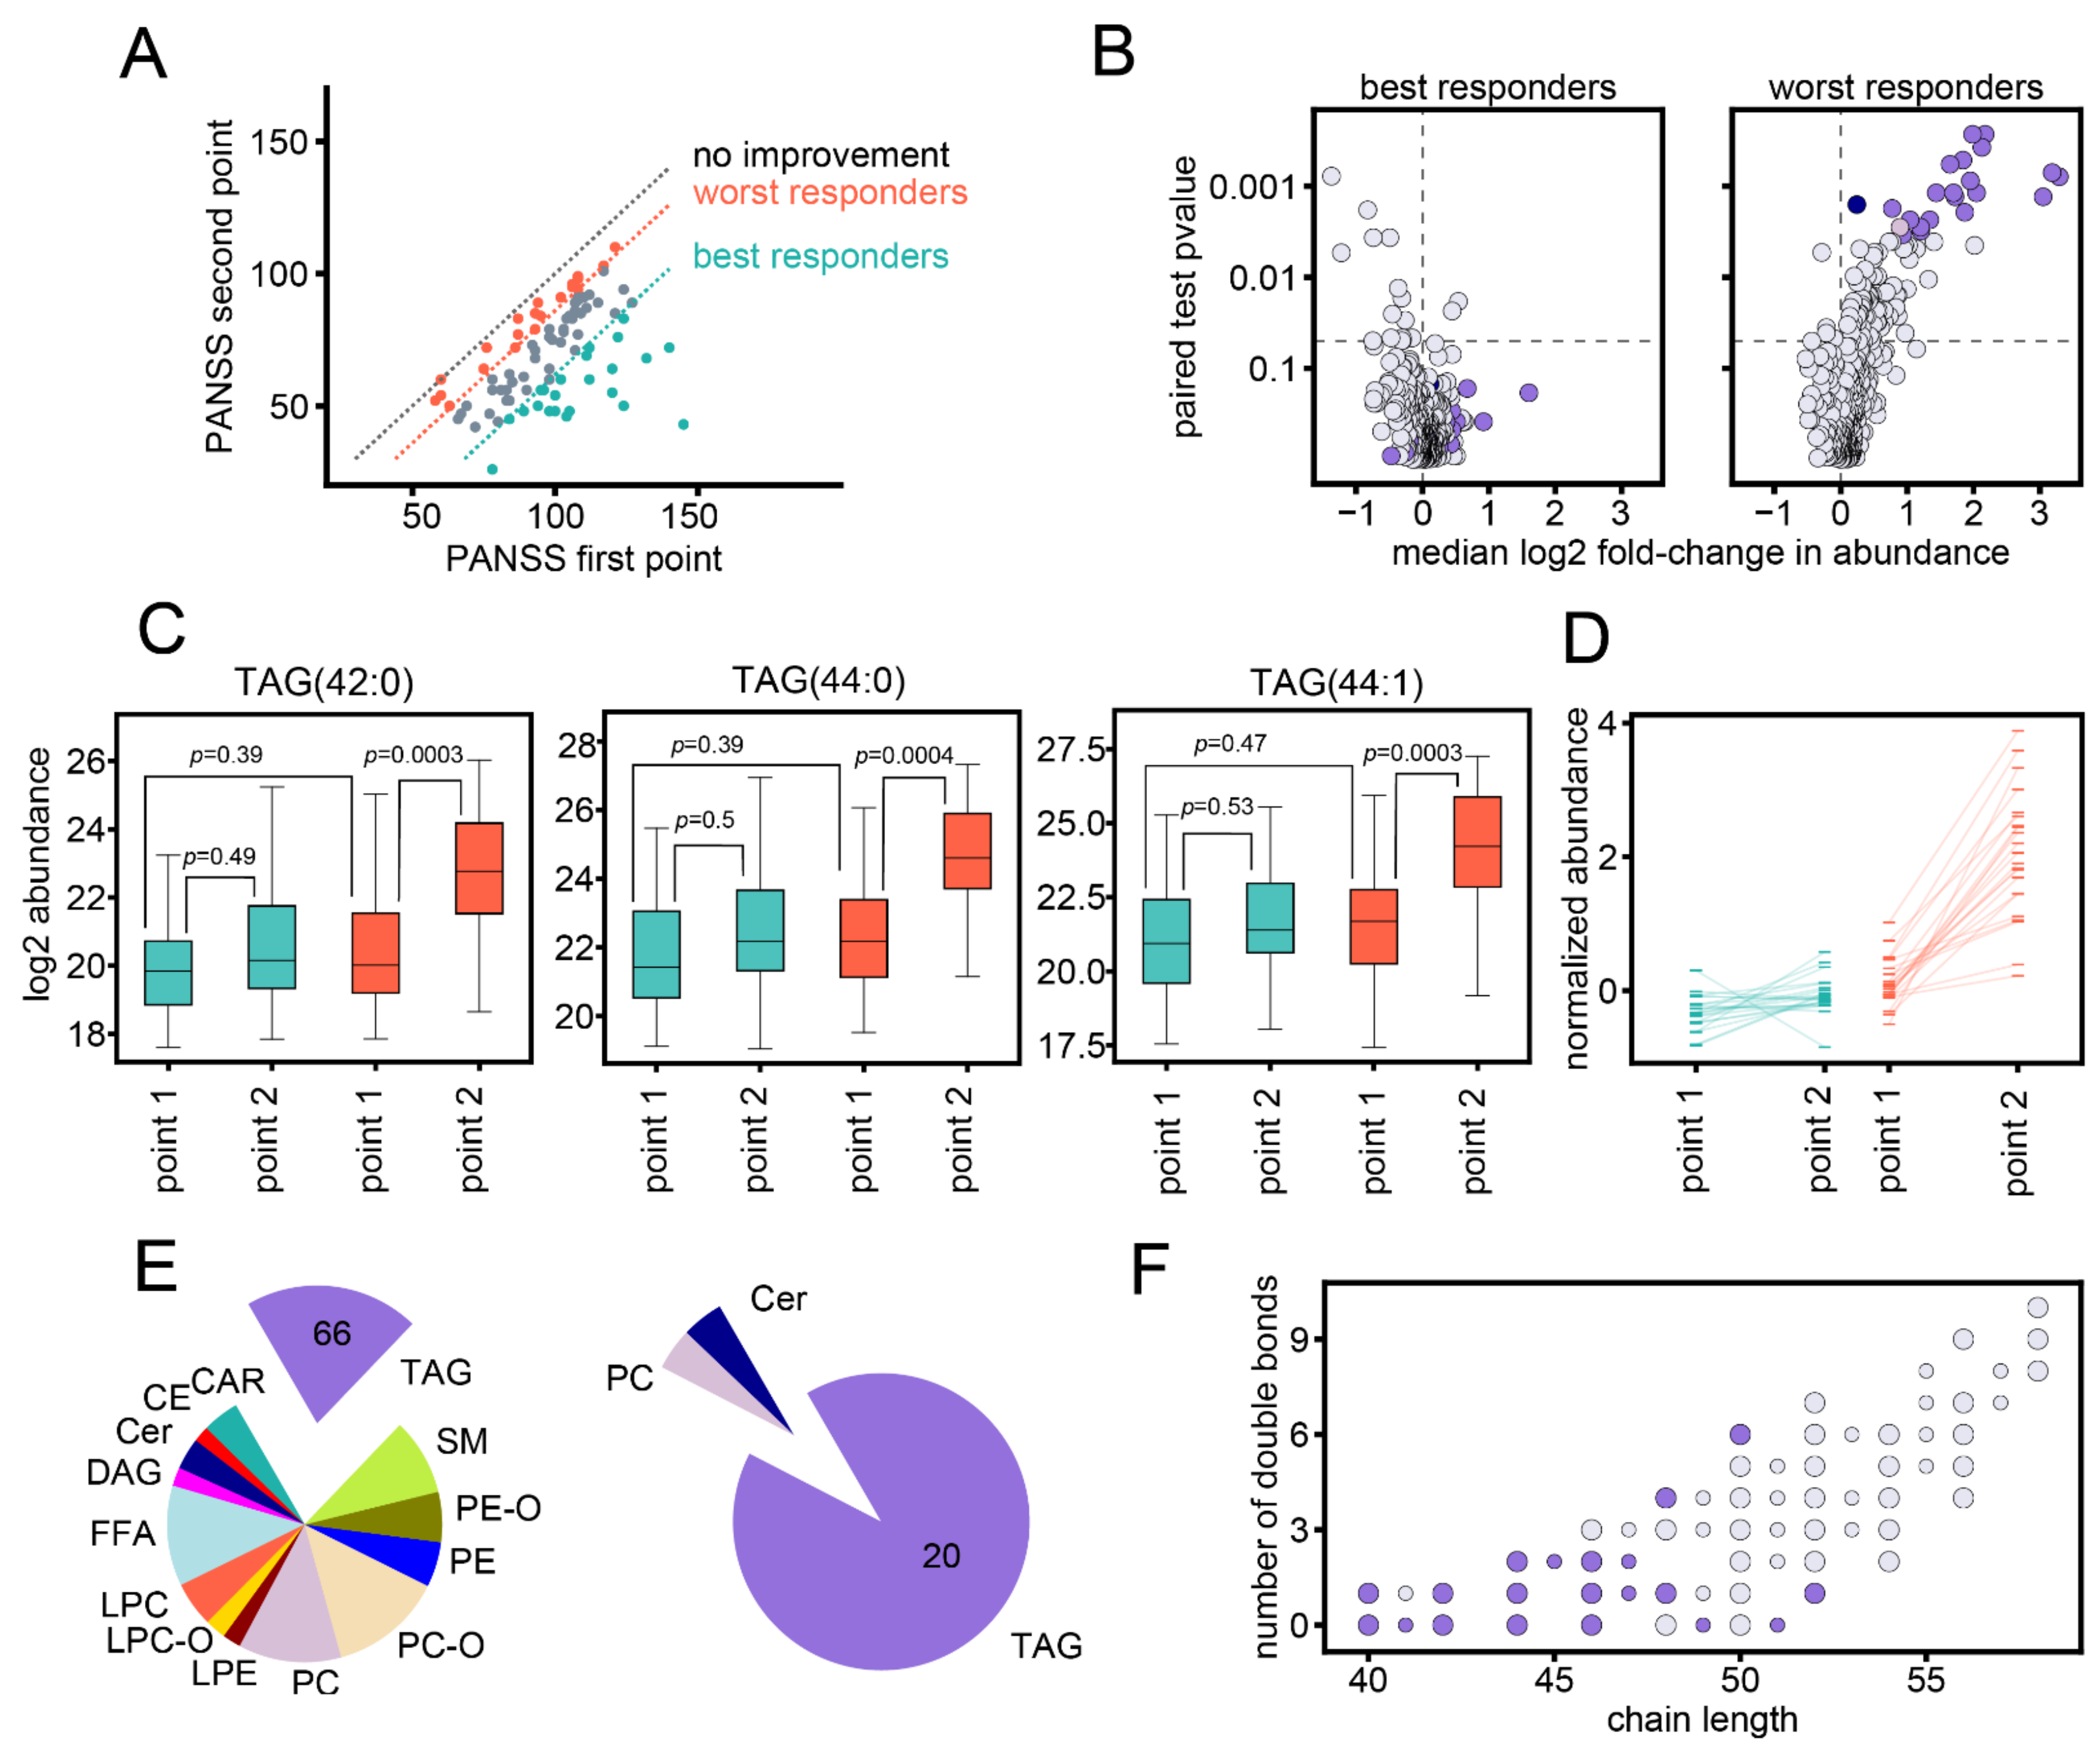
3.1. Study Setup
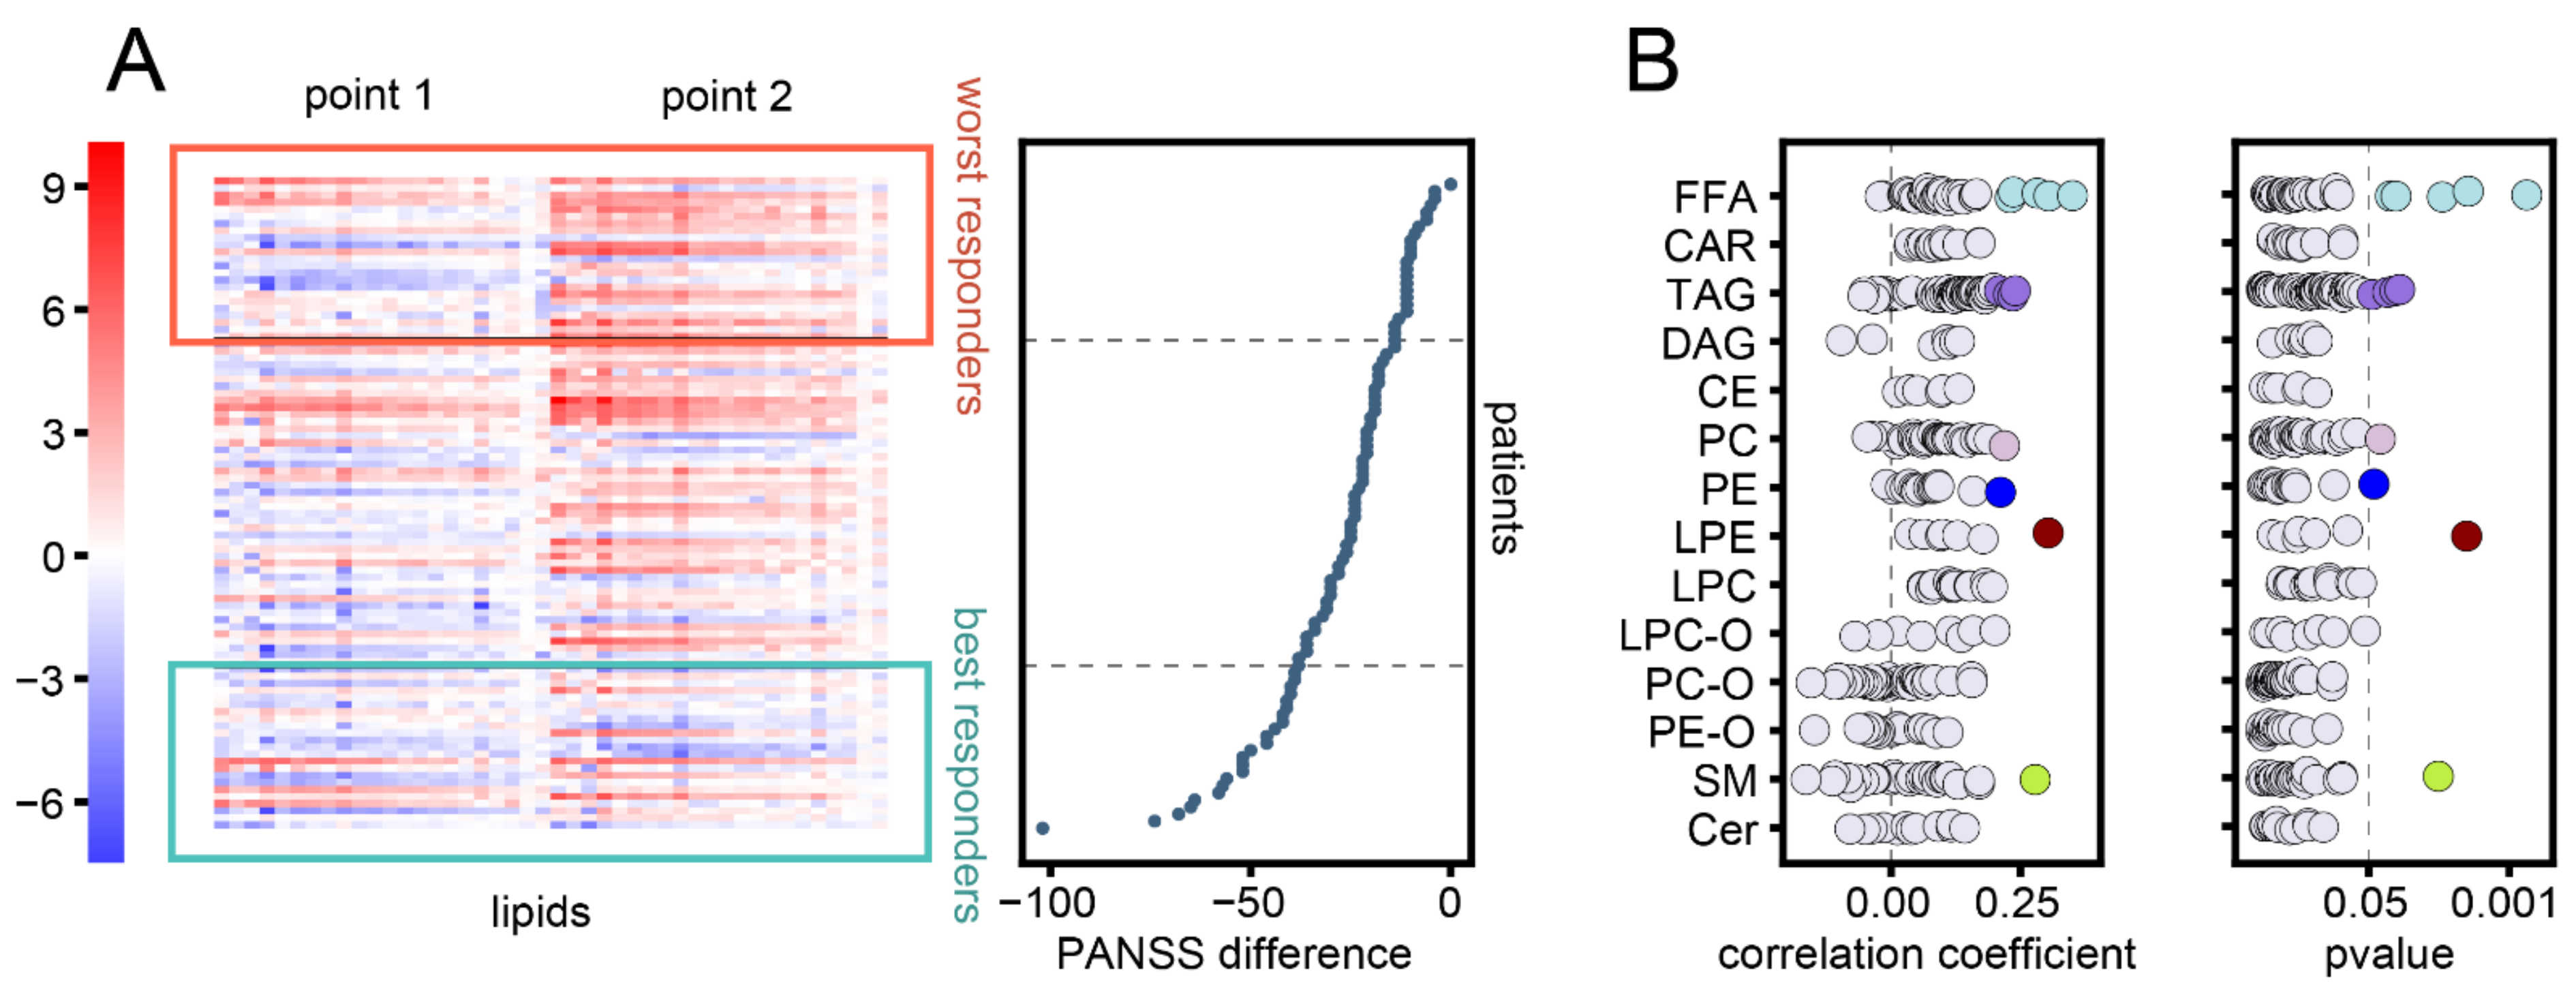
3.2. Association between Changes in Lipid Abundances and Symptom Improvement
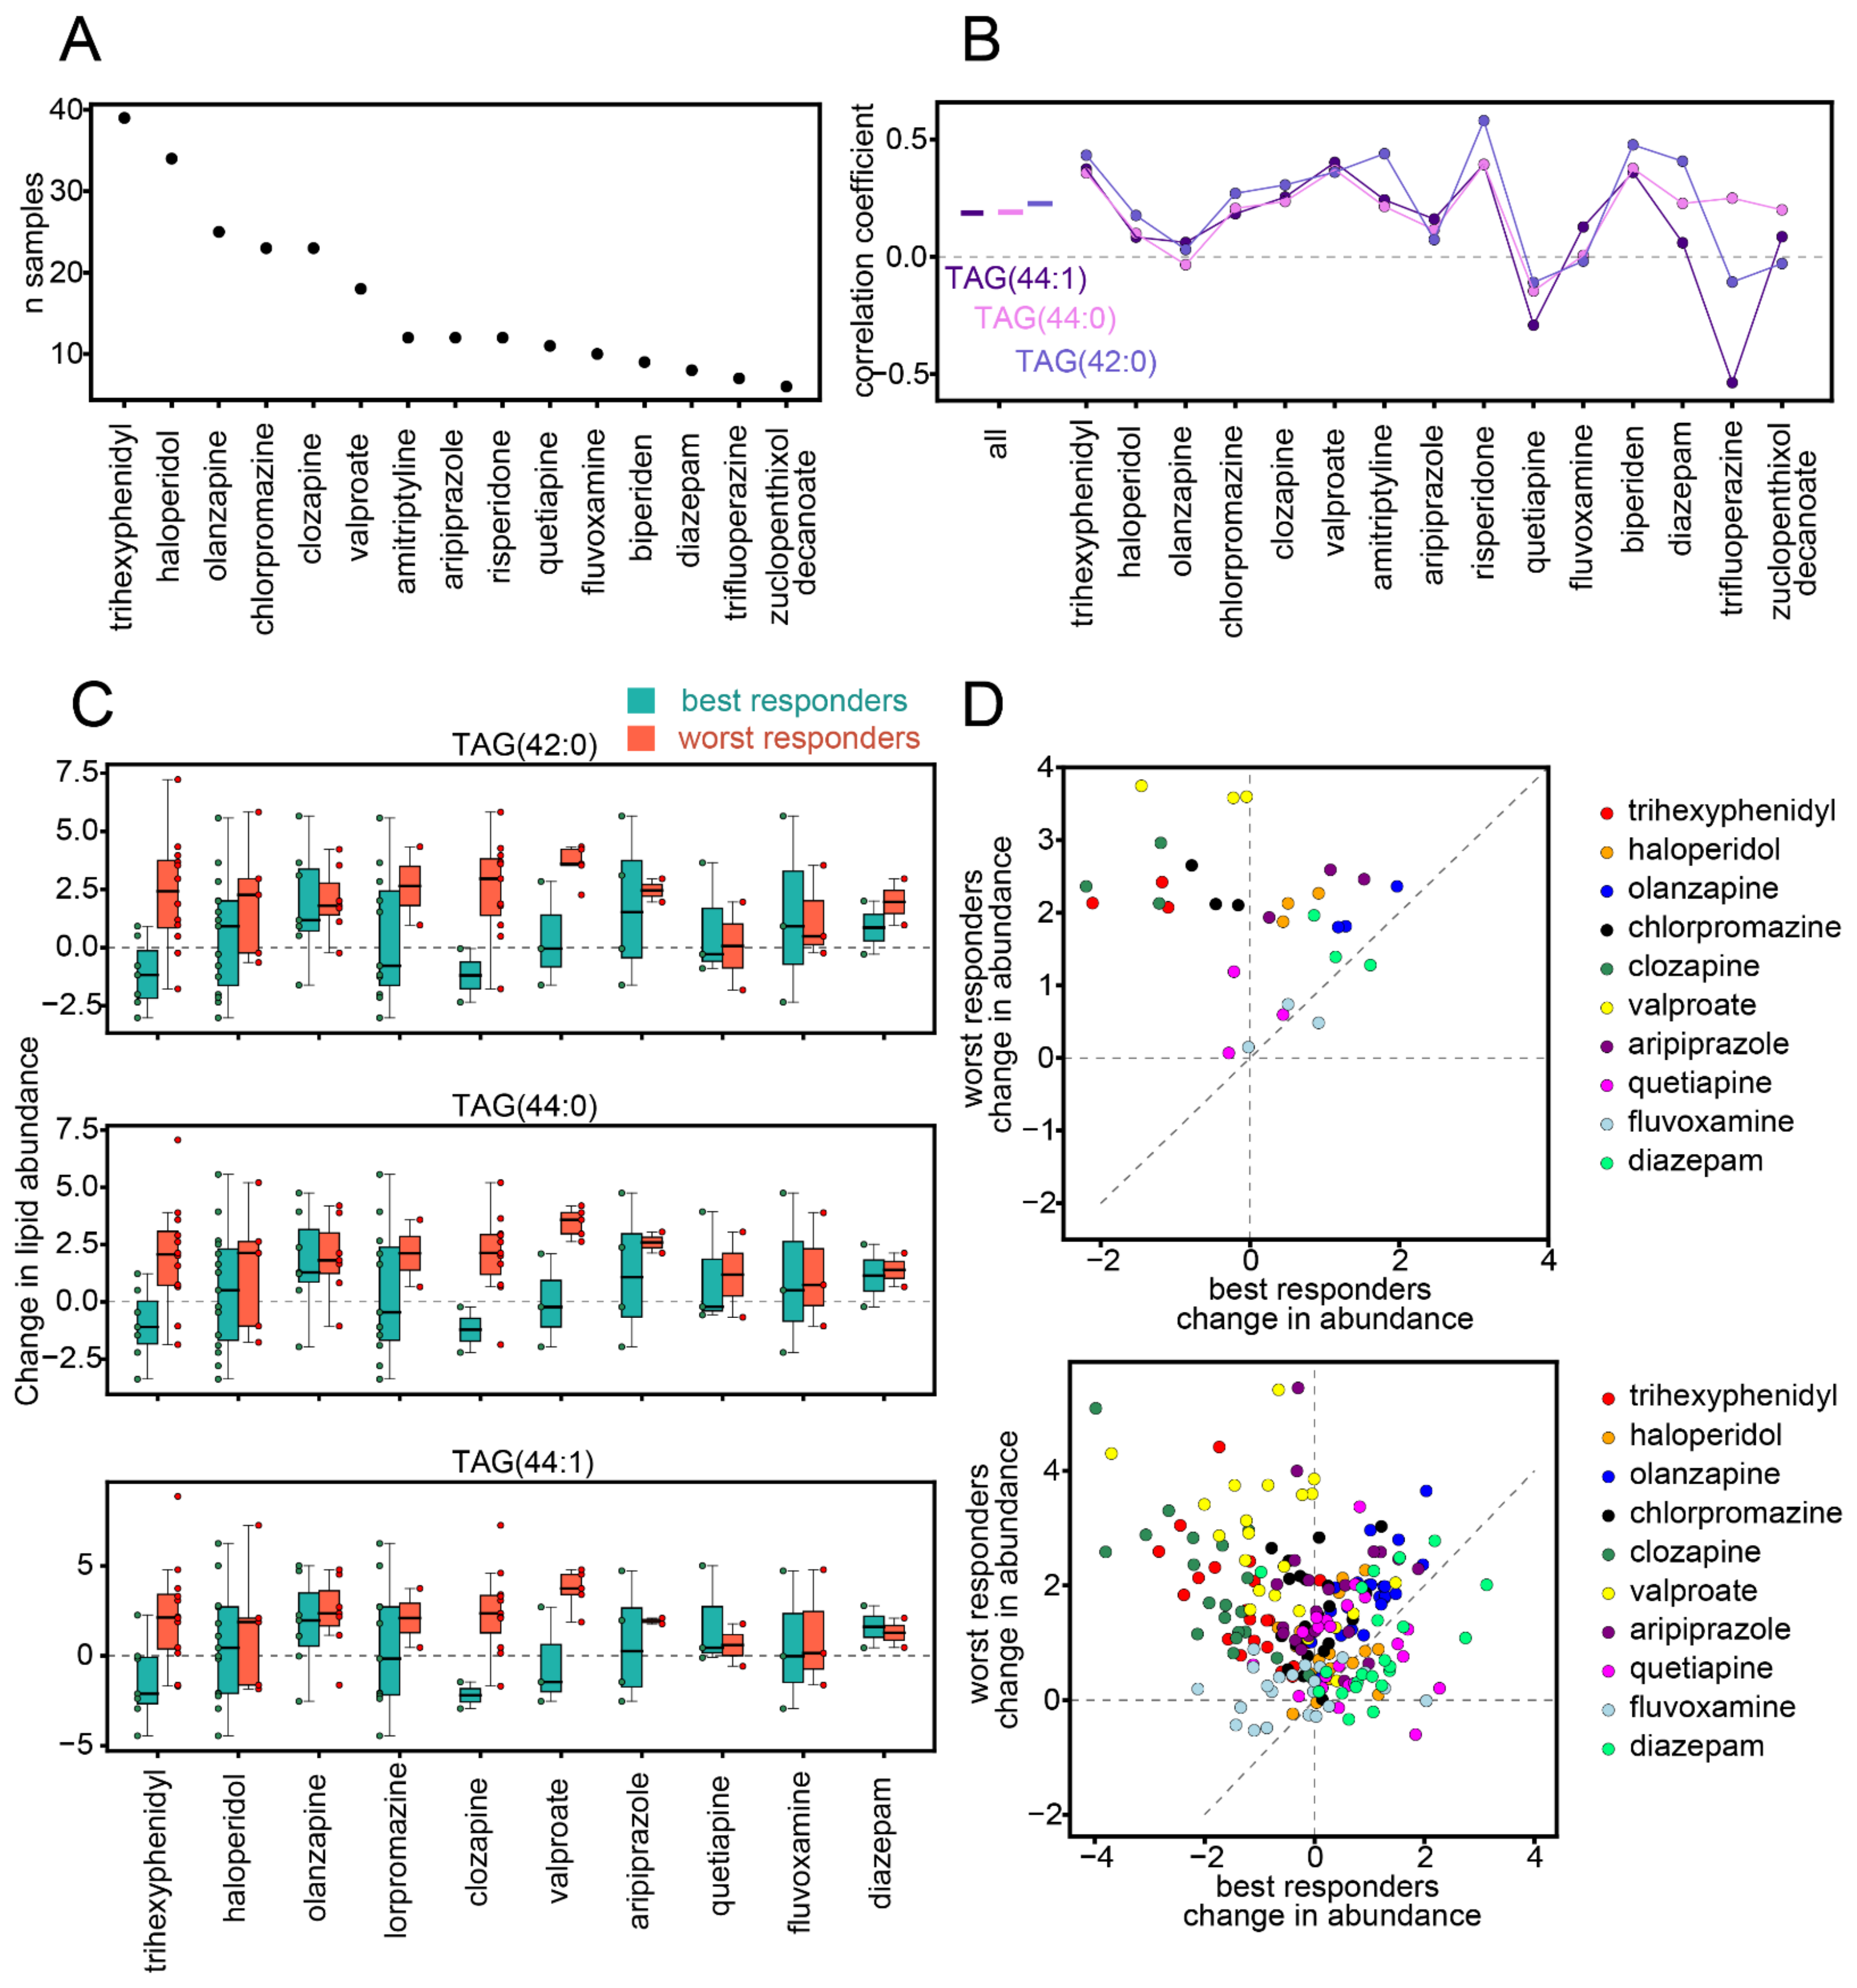
3.3. Influence of Medication
3.4. Influence of Sex and Age
3.5. Lipid Profiles at First Time Point
4. Discussion
Supplementary Materials
Author Contributions
Funding
Institutional Review Board Statement
Informed Consent Statement
Data Availability Statement
Acknowledgments
Conflicts of Interest
Abbreviations
| DAG | diacylglycerol |
| TAG | triacylglycerol |
| FFA | free fatty acid |
| CAR | acylcarnitine |
| CE | cholesteryl ester |
| PC | phosphatidylcholine |
| PC-O | plasmanyl-/plasmenyl-phosphatidylcholine |
| LPC | lysophosphatidylcholine |
| LPC-O | lyso- plasmanyl-/plasmenyl- phosphatidylcholine |
| PE | phosphatidylethanolamine |
| PE-O | plasmanyl-/plasmenyl- phosphatidylethanolamine |
| LPE | lysophosphatidylethanolamine |
| Cer | ceramide |
| SM | sphingomyelin |
References
- McCutcheon, R.A.; Pillinger, T.; Mizuno, Y.; Montgomery, A.; Pandian, H.; Vano, L.; Marques, T.R.; Howes, O.D. The efficacy and heterogeneity of antipsychotic response in schizophrenia: A meta-analysis. Mol. Psychiatry 2019, 1–11. [Google Scholar] [CrossRef] [PubMed]
- Potkin, S.G.; Kane, J.M.; Correll, C.U.; Lindenmayer, J.P.; Agid, O.; Marder, S.R.; Olfson, M.; Howes, O.D. The neurobiology of treatment-resistant schizophrenia: Paths to antipsychotic resistance and a roadmap for future research. NPJ Schizophr. 2020, 6, 1–10. [Google Scholar] [CrossRef] [PubMed]
- Fond, G.; d’Albis, M.A.; Jamain, S.; Tamouza, R.; Arango, C. The promise of biological markers for treatment response in first-episode psychosis: A systematic review. Schizophr. Bull. 2015, 41, 559–573. [Google Scholar] [CrossRef] [PubMed]
- Wenk, M.R. The emerging field of lipidomics. Nat. Rev. Drug Discov. 2005, 4, 594–610. [Google Scholar] [CrossRef] [PubMed]
- O’Donnell, V.B.; Ekroos, K.; Liebisch, G.; Wakelam, M. Lipidomics: Current state of the art in a fast moving field. Wiley Interdiscip. Rev. Syst. Biol. Med. 2020, 12, e1466. [Google Scholar] [CrossRef] [PubMed]
- Piomelli, D.; Astarita, G.; Rapaka, R. A neuroscientist’s guide to lipidomics. Nat. Rev. Neurosci. 2007, 8, 743–754. [Google Scholar] [CrossRef] [PubMed]
- Lauwers, E.; Goodchild, R.; Verstreken, P. Membrane Lipids in Presynaptic Function and Disease. Neuron 2016, 90, 11–25. [Google Scholar] [CrossRef] [Green Version]
- Cao, B.; Wang, D.; Pan, Z.; Brietzke, E.; McIntyre, R.S.; Musial, N.; Mansur, R.B.; Subramanieapillai, M.; Zeng, J.; Huang, N.; et al. Characterizing acyl-carnitine biosignatures for schizophrenia: A longitudinal pre- and post-treatment study. Transl. Psychiatry 2019, 9, 1–13. [Google Scholar] [CrossRef] [Green Version]
- Wood, P.L.; Unfried, G.; Whitehead, W.; Phillipps, A.; Wood, J.A. Dysfunctional plasmalogen dynamics in the plasma and platelets of patients with schizophrenia. Schizophr. Res. 2015, 161, 506–510. [Google Scholar] [CrossRef]
- Kriisa, K.; Leppik, L.; Balõtšev, R.; Ottas, A.; Soomets, U.; Koido, K.; Volke, V.; Innos, J.; Haring, L.; Vasar, E.; et al. Profiling of acylcarnitines in first episode psychosis before and after antipsychotic treatment. J. Proteome Res. 2017, 1, 3558–3566. [Google Scholar] [CrossRef]
- Leppik, L.; Parksepp, M.; Janno, S.; Koido, K.; Haring, L.; Vasar, E.; Zilmer, M. Profiling of lipidomics before and after antipsychotic treatment in first-episode psychosis. Eur. Arch. Psychiatry Clin. Neurosci. 2020, 270, 59–70. [Google Scholar] [CrossRef]
- Yan, L.; Zhou, J.; Wang, D.; Si, D.; Liu, Y.; Zhong, L.; Yin, Y. Unbiased lipidomic profiling reveals metabolomic changes during the onset and antipsychotics treatment of schizophrenia disease. Metabolomics 2018, 14, 1–13. [Google Scholar] [CrossRef]
- Wang, D.; Cheng, S.L.; Fei, Q.; Gu, H.; Raftery, D.; Cao, B.; Sun, X.; Yan, J.; Zhang, C.; Wang, J. Metabolic profiling identifies phospholipids as potential serum biomarkers for schizophrenia. Psychiatry Res. 2019, 272, 18–29. [Google Scholar] [CrossRef]
- Wang, D.; Sun, X.; Maziade, M.; Mao, W.; Zhang, C.; Wang, J.; Cao, B. Characterising phospholipids and free fatty acids in patients with schizophrenia: A case-control study. World J. Biol. Psychiatry 2020, 1–14. [Google Scholar] [CrossRef]
- Cao, B.; Wang, D.; Pan, Z.; McIntyre, R.S.; Brietzke, E.; Subramanieapillai, M.; Nozari, Y.; Wang, J. Metabolic profiling for water-soluble metabolites in patients with schizophrenia and healthy controls in a Chinese population: A case-control study. World J. Biol. Psychiatry 2020, 21, 357–367. [Google Scholar] [CrossRef]
- He, Y.; Yu, Z.; Giegling, I.; Xie, L.; Hartmann, A.M.; Prehn, C.; Adamski, J.; Kahn, R.; Li, Y.; Illig, T.; et al. Schizophrenia shows a unique metabolomics signature in plasma. Transl. Psychiatry 2012, 2, e149. [Google Scholar] [CrossRef] [Green Version]
- Brunkhorst-Kanaan, N.; Klatt-Schreiner, K.; Hackel, J.; Schröter, K.; Trautmann, S.; Hahnefeld, L.; Wicker, S.; Reif, A.; Thomas, D.; Geisslinger, G.; et al. Targeted lipidomics reveal derangement of ceramides in major depression and bipolar disorder. Metabolis 2019, 95, 65–76. [Google Scholar] [CrossRef]
- Gracia-Garcia, P.; Rao, V.; Haughey, N.J.; Ratnam Banduru, V.V.; Smith, G.; Rosenberg, P.B.; Lobo, A.; Lyketsos, C.G.; Mielke, M.M. Elevated plasma ceramides in depression. J. Neuropsychiatry Clin. Neurosci. 2011, 23, 215–218. [Google Scholar] [CrossRef]
- Liu, X.; Li, J.; Zheng, P.; Zhao, X.; Zhou, C.; Hu, C.; Hou, X.; Wang, H.; Xie, P.; Xu, G. Plasma lipidomics reveals potential lipid markers of major depressive disorder. Anal. Bioanal. Chem. 2016, 408, 6497–6507. [Google Scholar] [CrossRef]
- Liu, X.; Zheng, P.; Zhao, X.; Zhang, Y.; Hu, C.; Li, J.; Zhao, J.; Zhou, J.; Xie, P.; Xu, G. Discovery and validation of plasma biomarkers for major depressive disorder classification based on liquid chromatography-mass spectrometry. J. Proteome Res. 2015, 14, 2322–2330. [Google Scholar] [CrossRef]
- Demirkan, A.; Isaacs, A.; Ugocsai, P.; Liebisch, G.; Struchalin, M.; Rudan, I.; Wilson, J.F.; Pramstaller, P.P.; Gyllensten, U.; Campbell, H.; et al. Plasma phosphatidylcholine and sphingomyelin concentrations are associated with depression and anxiety symptoms in a Dutch family-based lipidomics study. J. Psychiatr. Res. 2013, 47, 357–362. [Google Scholar] [CrossRef]
- Cai, H.; Cao, T.; Li, N.; Fang, P.; Xu, P.; Wu, X.; Zhang, B.; Xiang, D. Quantitative monitoring of a panel of stress-induced biomarkers in human plasma by liquid chromatography-tandem mass spectrometry: An application in a comparative study between depressive patients and healthy subjects. Anal. Bioanal. Chem. 2019, 411, 5765–5777. [Google Scholar] [CrossRef]
- Kim, E.Y.; Lee, J.W.; Lee, M.Y.; Kim, S.H.; Mok, H.J.; Ha, K.; Ahn, Y.M.; Kim, K.P. Serum lipidomic analysis for the discovery of biomarkers for major depressive disorder in drug-free patients. Psychiatry Res. 2018, 265, 174–182. [Google Scholar] [CrossRef]
- Kaddurah-Daouk, R.; McEvoy, J.; Baillie, R.; Zhu, H.; Yao, J.K.; Nimgaonkar, V.L.; Buckley, P.F.; Keshavan, M.S.; Georgiades, A.; Nasrallah, H.A. Impaired plasmalogens in patients with schizophrenia. Psychiatry Res. 2012, 198, 347–352. [Google Scholar] [CrossRef]
- Cao, B.; Jin, M.; Brietzke, E.; McIntyre, R.S.; Wang, D.; Rosenblat, J.D.; Ragguett, R.M.; Zhang, C.; Sun, X.; Rong, C.; et al. Serum metabolic profiling using small molecular water-soluble metabolites in individuals with schizophrenia: A longitudinal study using a pre–post-treatment design. Psychiatry Clin. Neurosci. 2019, 73, 100–108. [Google Scholar] [CrossRef] [Green Version]
- Cuturic, M.; Abramson, R.K.; Breen, R.J.; Edwards, A.C.; Levy, E.E. Comparison of serum carnitine levels and clinical correlates between outpatients and acutely hospitalised individuals with bipolar disorder and schizophrenia: A cross-sectional study. World J. Biol. Psychiatry 2016, 17, 475–479. [Google Scholar] [CrossRef]
- Knowles, E.E.; Huynh, K.; Meikle, P.J.; Göring, H.H.H.; Olvera, R.L.; Mathias, S.R.; Duggirala, R.; Almasy, L.; Blangero, J.; Curran, J.E.; et al. The lipidome in major depressive disorder: Shared genetic influence for ether-phosphatidylcholines, a plasma-based phenotype related to inflammation, and disease risk. Eur. Psychiatry 2017, 43, 44–50. [Google Scholar] [CrossRef] [PubMed]
- Dinoff, A.; Herrmann, N.; Lanctôt, K.L. Ceramides and depression: A systematic review. J. Affect. Disord. 2017, 213, 35–43. [Google Scholar] [CrossRef] [PubMed]
- Wong, M.W.K.; Braidy, N.; Pickford, R.; Vafaee, F.; Crawford, J.; Muenchhoff, J.; Schofield, P.; Attia, J.; Brodaty, H.; Sachdev, P.; et al. Plasma lipidome variation during the second half of the human lifespan is associated with age and sex but minimally with BMI. PLoS ONE 2019, 14, e0214141. [Google Scholar] [CrossRef] [PubMed] [Green Version]
- Beyene, H.B.; Olshansky, G.; Smith, A.A.T.; Giles, C.; Huynh, K.; Cinel, M.; Mellett, N.A.; Cadby, G.; Hung, J.; Hui, J.; et al. High-coverage plasma lipidomics reveals novel sex-specific lipidomic fingerprints of age and BMI: Evidence from two large population cohort studies. PLoS Biol. 2020, 18, e3000870. [Google Scholar] [CrossRef] [PubMed]
- Chen, Y.L.; Chen, K.P.; Chiu, C.C.; Tai, M.H.; Lung, F.W. Early predictors of poor treatment response in patients with schizophrenia treated with atypical antipsychotics. BMC Psychiatry 2018, 18, 1–8. [Google Scholar] [CrossRef] [Green Version]
- De Almeida, V.; Alexandrino, G.L.; Aquino, A.; Gomes, A.F.; Murgu, M.; Dobrowolny, H.; Guest, P.C.; Steiner, J.; Martins-de-Souza, D. Changes in the blood plasma lipidome associated with effective or poor response to atypical antipsychotic treatments in schizophrenia patients. Prog. Neuro Psychopharmacol. Biol. Psychiatry 2020, 101, 109945. [Google Scholar] [CrossRef]
- Tessier, C.; Sweers, K.; Frajerman, A.; Bergaoui, H.; Ferreri, F.; Delva, C.; Lapidus, N.; Lamaziere, A.; Roiser, J.P.; De Hert, M.; et al. Membrane lipidomics in schizophrenia patients: A correlational study with clinical and cognitive manifestations. Transl. Psychiatry 2016, 6, e906. [Google Scholar] [CrossRef] [Green Version]
- Kay, S.R.; Fiszbein, A.; Opler, L.A. The positive and negative syndrome scale (PANSS) for schizophrenia. Schizophr. Bull. 1987, 13, 261. [Google Scholar] [CrossRef]
- Smith, C.A.; Want, E.J.; O’Maille, G.; Abagyan, R.; Siuzdak, G. XCMS: Processing mass spectrometry data for metabolite profiling using nonlinear peak alignment, matching, and identification. Anal. Chem. 2006, 78, 779–787. [Google Scholar] [CrossRef]
- Burla, B.; Arita, M.; Arita, M.; Bendt, A.K.; Cazenave-Gassiot, A.; Dennis, E.A.; Ekroos, K.; Han, X.; Ikeda, K.; Liebisch, G.; et al. MS-based lipidomics of human blood plasma: A community-initiated position paper to develop accepted guidelines. J. Lipid Res. 2018, 59, 2001–2017. [Google Scholar] [CrossRef] [Green Version]
- Szymanski, S.; Lieberman, J.A.; Alvir, J.M.; Mayerhoff, D.; Loebel, A.; Geisler, S.; Chakos, M.; Koreen, A.; Jody, D.; Kane, J.; et al. Gender differences in onset of illness, treatment response, course, and biologic indexes in first-episode schizophrenic patients. Am. J. Psychiatry 1995, 152(5), 698–703. [Google Scholar] [CrossRef]
- Zhang, X.Y.; Xiu, M.H.; De Yang, F.; Haile, C.N.; Kosten, T.A.; Kosten, T.R. Gender differences in never-medicated first-episode schizophrenia and medicated chronic schizophrenia patients. J. Clin. Psychiatry 2012, 73, 1025–1033. [Google Scholar] [CrossRef]
- Kim, D.D.; Barr, A.M.; Fredrikson, D.H.; Honer, W.G.; Procyshyn, R.M. Association between Serum Lipids and Antipsychotic Response in Schizophrenia. Curr. Neuropharmacol. 2019, 17, 852–860. [Google Scholar] [CrossRef]
- Suvitaival, T.; Mantere, O.; Kieseppä, T.; Mattila, I.; Pöhö, P.; Hyötyläinen, T.; Suvisaari, J.; Orešič, M. Serum metabolite profile associates with the development of metabolic co-morbidities in first-episode psychosis. Transl. Psychiatry 2016, 6, e951. [Google Scholar] [CrossRef]
- Rhee, E.P.; Cheng, S.; Larson, M.G.; Walford, G.A.; Lewis, G.D.; McCabe, E.; Yang, E.; Farrell, L.; Fox, C.S.; O’Donnell, C.J.; et al. Lipid profiling identifies a triacylglycerol signature of insulin resistance and improves diabetes prediction in humans. J. Clin. Investig. 2011, 121, 1402–1411. [Google Scholar] [CrossRef] [Green Version]
- Orešič, M.; Hyötyläinen, T.; Kotronen, A.; Gopalacharyulu, P.; Nygren, H.; Arola, J.; Castillo, S.; Mattila, I.; Hakkarainen, A.; Borra, R.J.; et al. Prediction of non-alcoholic fatty-liver disease and liver fat content by serum molecular lipids. Diabetologia 2013, 56, 2266–2274. [Google Scholar] [CrossRef] [Green Version]
- Li, R.; Zhang, Y.; Zhu, W.; Ding, C.; Dai, W.; Su, X.; Dai, W.; Xiao, J.; Xing, Z.; Huang, X. Effects of olanzapine treatment on lipid profiles in patients with schizophrenia: A systematic review and meta-analysis. Sci. Rep. 2020, 10, 1–14. [Google Scholar] [CrossRef]
- Meyer, J.M.; Koro, C.E. The effects of antipsychotic therapy on serum lipids: A comprehensive review. Schizophr. Res. 2004, 70, 1–17. [Google Scholar] [CrossRef]
- Mitchell, A.J.; Vancampfort, D.; Sweers, K.; Van Winkel, R.; Yu, W.; De Hert, M. Prevalence of metabolic syndrome and metabolic abnormalities in schizophrenia and related disorders-a systematic review and meta-analysis. Schizophr. Bull. 2013, 39, 306–318. [Google Scholar] [CrossRef] [Green Version]
- Penninx, B.W.J.H.; Lange, S.M.M. Metabolic syndrome in psychiatric patients: Overview, mechanisms, and implications. Dialogues Clin. Neurosci. 2018, 20, 63. [Google Scholar] [CrossRef]
- Hert, M.D.; Dekker, J.M.; Wood, D.; Kahl, K.G.; Möller, H.J. Cardiovascular disease and diabetes in people with severe mental illness position statement from the European Psychiatric Association (EPA), supported by the European Association for the Study of Diabetes (EASD) and the European Society of Cardiology ESC. Eur. Psychiatry 2009, 2, 49–59. [Google Scholar]
- Sartorius, N. Depression and diabetes. Dialogues Clin. Neurosci. 2018, 20, 47. [Google Scholar] [CrossRef]
- Zhang, J.P.; Lencz, T.; Zhang, R.X.; Nitta, M.; Maayan, L.; John, M.; Robinson, D.G.; Fleischhacker, W.W.; Kahn, R.S.; Ophoff, R.A.; et al. Pharmacogenetic Associations of Antipsychotic Drug-Related Weight Gain: A Systematic Review and Meta-analysis. Schizophr. Bull. 2016, 42, 1418–1437. [Google Scholar] [CrossRef] [Green Version]


Publisher’s Note: MDPI stays neutral with regard to jurisdictional claims in published maps and institutional affiliations. |
© 2021 by the authors. Licensee MDPI, Basel, Switzerland. This article is an open access article distributed under the terms and conditions of the Creative Commons Attribution (CC BY) license (https://creativecommons.org/licenses/by/4.0/).
Share and Cite
Tkachev, A.; Stekolshchikova, E.; Anikanov, N.; Zozulya, S.; Barkhatova, A.; Klyushnik, T.; Petrova, D. Shorter Chain Triglycerides Are Negatively Associated with Symptom Improvement in Schizophrenia. Biomolecules 2021, 11, 720. https://doi.org/10.3390/biom11050720
Tkachev A, Stekolshchikova E, Anikanov N, Zozulya S, Barkhatova A, Klyushnik T, Petrova D. Shorter Chain Triglycerides Are Negatively Associated with Symptom Improvement in Schizophrenia. Biomolecules. 2021; 11(5):720. https://doi.org/10.3390/biom11050720
Chicago/Turabian StyleTkachev, Anna, Elena Stekolshchikova, Nickolay Anikanov, Svetlana Zozulya, Aleksandra Barkhatova, Tatiana Klyushnik, and Daria Petrova. 2021. "Shorter Chain Triglycerides Are Negatively Associated with Symptom Improvement in Schizophrenia" Biomolecules 11, no. 5: 720. https://doi.org/10.3390/biom11050720