Article

MRAP2 Interaction with Melanocortin-4 Receptor in SnakeHead (Channa argus)

1
Key Laboratory of Sichuan Province for Fish Conservation and Utilization in the Upper Reaches of the Yangtze River, Neijiang Normal University, Neijiang 641100, China
2
College of Life Science, Neijiang Normal University, Neijiang 641100, China
3
BGI Education Center, University of Chinese Academy of Sciences, Shenzhen 518083, China
4
Department of Anatomy, Physiology and Pharmacology, College of Veterinary Medicine, Auburn University, Auburn, AL 36849, USA
*
Authors to whom correspondence should be addressed.
These authors contributed equally.
Biomolecules 2021, 11(3), 481; https://doi.org/10.3390/biom11030481
Submission received: 26 January 2021 / Revised: 11 March 2021 / Accepted: 19 March 2021 / Published: 23 March 2021
(This article belongs to the Special Issue Molecular Mechanisms of Compartmentalized GPCR Signaling)

Abstract

:
The melanocortin-4 receptor (MC4R) plays an important role in the regulation of food intake and energy expenditure. Melanocortin-2 receptor accessory protein 2 (MRAP2) modulates trafficking, ligand binding, and signaling of MC4R. The Northern snakehead (Channa argus) is an economically important freshwater fish native to East Asia. To explore potential interaction between snakehead MC4R and MRAP2, herein we cloned snakehead mc4r and mrap2. The snakehead mc4r consisted of a 984 bp open reading frame encoding a protein of 327 amino acids, while snakehead mrap2 contained a 693 bp open reading frame encoding a protein of 230 amino acids. Synteny analysis indicated that mc4r was highly conserved with similar gene arrangement, while mrap2 contained two isoforms in teleost with different gene orders. Snakehead mc4r was primarily expressed in the brain, whereas mrap2 was expressed in the brain and intestine. Snakehead mc4r and mrap2 expression was modulated by fasting and refeeding. Further pharmacological experiments showed that the cloned snakehead MC4R was functional, capable of binding to peptide agonists and increasing intracellular cAMP production in a dose-dependent manner. Snakehead MC4R exhibited high constitutive activity. MRAP2 significantly decreased basal and agonist-stimulated cAMP signaling. These findings suggest that snakehead MC4R might be involved in energy balance regulation by interacting with MRAP2. Further studies are needed to elucidate MC4R in regulating diverse physiological processes in snakehead.

1. Introduction

The melanocortin-4 receptor (MC4R), a Family A G protein-coupled receptor (GPCR), plays a central role in energy homeostasis regulation in mammals [1,2]. It consists of the hallmark seven transmembrane domains (TMDs) connected by alternating extracellular and intracellular loops, with an extracellular N-terminus and intracellular C-terminus [3]. Since the human MC4R (hMC4R) was first cloned in 1993 by degenerate PCR [3], extensive studies have been done to elucidate the potential physiological and pathophysiological relevance of this receptor. Cone and colleagues showed that MC4R is highly expressed in neuroendocrine and autonomic control circuits in the brain [4]. In 1997, it was discovered that modulation of MC4R activation or genetic inactivation exerts a profound influence on food intake and energy expenditure [5,6,7]. Subsequent studies found that mutations in MC4R and common genetic variation near MC4R lead to a dominant form of obesity and insulin resistance [8,9,10,11]. Moreover, several studies suggested that MC4R is also involved in modulating the reproductive function of animals [12,13,14].
Activation of neurons expressing pro-opiomelanocortin (POMC) decreases food intake, whereas activation of neurons expressing neuropeptide-Y (NPY) and agouti-related peptide (AgRP) increases food intake [2]. MC4R mediates the agonist signal provided by the POMC-derived peptide α-melanocyte stimulating hormone (α-MSH), and the antagonist signal provided by AgRP [1,15]. After ligand binding, MC4R is primarily coupled to Gs, which stimulates adenylyl cyclase activity and increases intracellular cAMP level. This classical Gs-cAMP signaling pathway is required for regulation of energy balance, thermogenesis, and glucose metabolism [16]. Moreover, the pharmacological properties of MC4R are modulated by melanocortin-2 receptor accessory proteins (MRAPs) [17,18].
MRAP family consists of two members, MRAP1 and MRAP2. These two small single transmembrane proteins have been identified to be involved in the regulation of MCR functions as MRAP1 is responsible for the formation of a functional MC2R, and MRAP2 is relevant for the regulation of energy balance [19]. Nonsynonymous MRAP2 variants have been detected in obese patients, but not in normal weight controls in a meta-analysis [20], and Mrap2-deletion leads to obesity in mice [21]. One important mechanism is that MRAP2 exerts its effects on energy homeostasis through action on the MC4R. For classical Gs-cAMP signaling pathway, MRAP2 does not affect basal activity, but decreases agonist-stimulated cAMP production in human (h) MC4R [22], while MRAP2 suppresses basal signaling, but increases agonist-stimulated maximal response in mouse MC4R [21]. MRAP2 also enhances MC4R-mediated cAMP production in feline [23]. An in vivo experiment showed that MRAP2 potentiates mouse MC4R activation in regulating energy homeostasis at baseline conditions in paraventricular nucleus (PVN) MC4R-expressing neurons [24].
MC4R has been investigated in several non-mammalian vertebrates including ectotherm fish, such as goldfish [25], rainbow trout [26], spotted scat [27], grass carp [28], ricefield eel [29], orange-spotted grouper [30], and topmouth culter [31]. Similar to mammalian MC4Rs, teleost MC4R is also involved in regulating food intake and maintaining energy balance. In barfin flounder, food deprivation induces significantly higher mc4r expression in the liver [32], and the same phenomenon was observed in the brain of Ya-fish [33]. Meanwhile, intracerebroventricular administration of MC4R agonist melanotan II inhibits food intake, whereas intracerebroventricular injection of selective MC4R antagonist HS024 stimulates food intake in goldfish [25]. In addition, nonsynonymous mutations in cavefish mc4r were found to play an important role in adapting to nutrient-poor condition [34].
MRAP2 and its modulatory role on MC4R have also been studied in several fishes. Different from mammals, some teleosts, such as zebrafish and topmouth culter, possess two isoforms of MRAP2 [35,36,37], while other lower vertebrates including tilapia, sea lamprey, and grouper, have only one [30,38,39], suggesting that the phylogenetic process in fish may be more complex than in mammals. In addition, MRAP2 has different effects on MC4R expression, ligand binding, and signaling in different fishes. In sea lamprey, MRAP2 interacts with MCRa and MCRb, reducing their expressions on the cell surface, but increases α-MSH-induced signaling of receptors [38]. In tilapia, MRAP2 decreases both cell surface expression and ligand-stimulated signaling at the Gs-cAMP pathway [39]. In grouper, both basal and agonist-stimulated Gs-cAMP signaling of MC4R is decreased by MRAP2 [30]. In zebrafish, MRAP2a decreases α-MSH binding affinity, whereas MRAP2b enhances ligand sensitivity of MC4R [35]. In topmouth culter, MRAP2a increases the maximal binding (Bmax) and decreases agonist-induced cAMP, but MRAP2b does not affect Bmax and agonist-stimulated cAMP [31]. Therefore, more studies about interactions between MRAP2 and MC4R are worth pursuing.
The northern snakehead (Channa argus) belongs to the family Channidae and the order Perciformes, and is an economically important freshwater fish native to East Asia [40]. Although the annual production has reached 510,000 tons per year in China, the genetic degradation caused by inbreeding of C. argus cultivation has led to higher susceptibility to diseases in recent years [41]. As MC4R is functionally related to growth and reproduction in fish, studies on MC4R will undoubtedly be helpful for understanding the growth traits of C. argus and might also be of benefit for future breeding projects. We herein investigated the molecular cloning, tissue distribution, pharmacological characteristics of caMC4R and its regulation by caMRAP2, and a potential role in food intake regulation.

2. Materials and Methods

2.1. Fish Sampling

The northern snakehead, weight (71.3 ± 5.6 g) used in this study, were obtained from Neijiang Fish Farm (Neijiang, China) and transported to the experimental aquarium at the College of Life Sciences of Neijiang Normal University. The fish were kept in 100 L tanks under natural light-dark conditions (12 L/12 D) with a constant flow of filtered water and water temperature maintained at 18–20 °C. The fish were fed with fish meat (5–8% of body weight) at 19:00 every day. Fish were acclimated for 2 weeks before the experiment, showing a normal feeding pattern during this acclimation period.
Following acclimation, six fish were randomly selected for cloning and tissue distribution studies. The fish were anesthetized on ice and sacrificed by decapitation. Tissue samples including adipose, brain, eye, gill, gonad (ovary), heart, intestine, kidney, liver, muscle, and spleen, were collected and frozen in liquid nitrogen immediately. For a short-term food deprivation experiment, fish were sampled at 19:00 (after feeding, 0 h), 22:00 (3 h), 01:00 (6h), 07:00 (12 h), and 19:00 (24 h). Six fish were selected from each group, and their brains were sampled and stored. For a long-term food deprivation experiment, fish were assigned to 4 experimental tanks (with 20 fish per tank, 2 tanks of fish were fed, and the other 2 tanks were unfed) for two weeks. Five fish were chosen, and their brains were sampled from each group. Subsequently, the fasted group was refed and sampled. All samples were kept at −80 °C until further analysis.
All animal experiments were performed with the approval of the Neijiang Normal University Animal Care and Use Committee and in full compliance with its ethics guidelines.

2.2. Ligands and Plasmids

NDP-MSH was purchased from Peptides International (Louisville, KY, USA), α- and β-MSHs were purchased from Pi Proteomics (Huntsville, AL, USA), and ACTH (1–24) was purchased from Phoenix Pharmaceuticals (Burlingame, CA, USA). Both [125I]-NDP-MSH and [125I]-cAMP were iodinated in our lab using chloramine T method [42,43]. The N-terminal c-myc-tagged hMC4R subcloned into pcDNA3.1 vector was prepared as described in our previous study [44]. The coding sequences of snakehead MC4R and MRAP2 were commercially synthesized and subcloned into pcDNA3.1 vector by GenScript (Piscataway, NJ, USA) to generate the plasmids used for transfection.

2.3. Molecular Cloning of Snakehead mc4r and mrap2 Genes

Protein similarity-based blast was performed to search the target genes in the snakehead genome and transcriptome databases [41], using zebrafish mc4r, mrap2a, and mrap2b as references. After searching, we obtained the genomic and transcriptomic sequences of the snakehead mc4r and mrap2 (single copy, showing close relationship with zebrafish mrap2b) genes. Two pairs of primers were designed to validate the two sequences, respectively. Total RNA was isolated from the whole brain with the Trizol reagent (Invitrogen, Carlsbad, CA, USA) according to manufacturer’s protocol, and 1 μg of the RNA was reverse transcribed to cDNA using Super ScriptTM II RT reverse transcriptase (Takara, Dalian, China). The basic cycling conditions of the PCR were set as follows: A denaturing stage at 94 °C for 30 s, gene-specific annealing temperature for 45 s and an elongation stage at 72 °C for 60 s, a total of 34 cycles. The PCR products were purified from agarose gel using the Universal DNA Purification Kit (TIANGEN, Beijing, China), and then cloned into the pMD-19T vector (TaKaRa). The inserts were sequenced at BGI (Beijing, China), and the primers used to validate mc4r and mrap2 genes were listed in Table S1.

2.4. Sequence Analysis and Data Processing

The coding sequences (CDS) were determined using online software ORF finder (https://www.ncbi.nlm.nih.gov/gorf/gorf.html), and then the putative protein sequences were translated with Primer Premier 5.0 software. Moreover, the Bioedit software was used to determine the isoelectric point (PI), the online tool TMHMM Server v. 2.0 (http://www.cbs.dtu.dk/services/TMHMM-2.0/) was used to identify the transmembrane domain, and the Expasy (http://www.expasy.org/tools/) was used to predict glycosylation and phosphorylation sites. Furthermore, multiple sequence alignments were done as described in our previous work [45], and the predicted secondary structure of snakehead MC4R was drawn according to two related studies [2,34]. Additionally, three dimensional structures of several vertebrate MC4Rs were predicted with an online tool SWISS-MODEL (https://www.swissmodel.expasy.org/) using human MC4R as reference [46]. Finally, a comparative genomic survey was performed to investigate the gene synteny of MC4R and MRAP2 in vertebrates as described previously [47,48], based on a series of representative animal genomes.

2.5. Phylogenetic Analysis

The predicted snakehead MC4R and MRAP2 protein sequences together with those of other vertebrates were aligned by CLUSTAL X2.1, respectively. The aligned protein datasets were used to construct the phylogenetic tree with Neighbor-Joining approach using Mega 6.0 software [49]. The best-fitting model was calculated by MrmodelTest 2.0 [50] and ProtTest 2.4 [51], and the JTT + G model was selected as the best model after evaluation. The phylogenetic trees were redrawn using Figtree software. The robustness of the tree topology was assessed by nonparametric bootstrap analysis with 1000 resampling replicates. IDs of the protein sequences used in present study are shown in Tables S2 and S3.

2.6. Quantitative Real-Time PCR

Extraction of total RNA from fish tissues and first strand cDNA synthesis were performed as described above. Then, real-time PCR was used to detect the mRNA expressions of mc4r and mrap2 with LightCycler Real-Time system. Reverse transcription product was used for real-time PCR in a final volume of 10 μL. The end products of PCR were verified with the melting curves that showing a single peak specific for the target gene. The relative expression levels were calculated according to the method described previously [52], and tubα1 was used as reference gene. Primers used to amplify mc4r, mrap2, and tubα1 are shown in Table S1. Values are expressed as means ± SEM (n = 6).

2.7. Cell Culture and Transfection

Human Embryonic Kidney (HEK) 293T cells, purchased from American Type Culture Collection (Manassas, VA, USA), were cultured in Dulbecco’s Modified Eagle’s medium (DMEM) (Invitrogen) containing 10% newborn calf serum (PAA Laboratories, Etobicoke, ON, Canada), 10 mM HEPES, 0.25 μg/mL of amphotericin B, 50 μg/mL of gentamicin, 100 IU/mL of penicillin, and 100 μg/mL of streptomycin at 37 °C in a 5% CO2-humidified atmosphere. The cells were plated into 6-well or 24-well plates (Corning, NY, USA) pre-coated with 0.1% gelatin and transfected or co-transfected when cells reached at ~70% confluence using calcium phosphate precipitation method [53].

2.8. Flow Cytometry Assay

To investigate the effect of snakehead MRAP2 on the cell surface and total expression levels of MC4R, cells were plated into 6-well plates and transfected with snakehead MC4R and MRAP2 plasmids in four ratios (1:0, 1:1, 1:3, and 1:5). Then, cells were incubated with mouse anti-myc 9E10 monoclonal antibody (Developmental Studies Hybridoma Bank, The University of Iowa, Iowa City, IA, USA) diluted 1:40 and Alexa Fluor 488-labeled goat anti-mouse antibody (Invitrogen) diluted 1:2000 for 1 h, respectively. Flow cytometry was carried out, and C6 Accuri Cytometer (Accuri Cytometers, Ann Arbor, MI, USA) was applied to collect fluorescence signals. The expression level of caMC4R (caMC4R fluorescence − pcDNA3.1 fluorescence) from 1:0 (caMC4R/caMRAP2) group was set as 100%, and the expression levels of other groups were calculated as a percentage of 1:0 group [54].

2.9. Ligand Binding Assays

To assess the ligand binding properties of the caMC4R, four ligands (NDP-MSH, ACTH (1–24), α-MSH, β-MSH) were used. Forty-eight hours after transfection, HEK293T cells were washed twice with warm DMEM containing 1 mg/mL bovine serum albumin (BSA, EMD Millipore Corporation, Billerica, MA, USA) (DMEM/BSA). To study the effects of caMRAP2 on the binding property of caMC4R, two ligands (α-MSH and ACTH (1–24)) were used. Forty-eight hours after transfection, HEK293T cells co-transfected with caMC4R and caMRAP2 at four ratios (1:0, 1:1, 1:3, and 1:5) were washed twice with warm DMEM/BSA. After 1-h incubation with ligands, the competitive binding reaction was terminated by washing cells twice with cold Hank’s balanced salt solution containing 1 mg/mL BSA on ice. The cells were lysed with 0.5 M NaOH, collected with cotton swabs, and radioactivity detected with gamma counter (Cobra II Auto-Gamma, Packard Bioscience, Frankfurt, Germany).

2.10. cAMP Assays

Forty-eight hours after transfection, HEK293T cells were washed twice with warm DMEM/BSA and then incubated with DMEM/BSA containing 0.5 mM isobutylmethylxanthine (Sigma–Aldrich, St. Louis, MO, USA) at 37 °C for another 15 min. Then, different concentrations of NDP-MSH, ACTH (1–24), α-MSH, or β-MSH were added to make the final concentration of ligands ranging from 10−12 to 10−6 M for NDP-MSH and ACTH (1–24) or from 10−11 to 10−5 M for α-MSH and β-MSH. After an hour’s incubation at 37 °C, the reaction was terminated on ice and the intracellular cAMP was collected by adding 0.5 M perchloric acid containing 180 μg/mL theophylline (Sigma–Aldrich) and 0.72 M KOH/0.6 M KHCO3 into each well. The cAMP levels were measured by radioimmunoassay (RIA) [43].
To investigate the potential effect of caMRAP2 on caMC4R signaling, two ratios of caMC4R and caMRAP2 (1:0 and 1:5) were applied to co-transfect cells, and two ligands, α-MSH and ACTH (1–24), were used. To explore the dose-dependent effect of caMRAP2 on the maximal response (Rmax) of cAMP levels to α-MSH and ACTH (1–24) stimulation, cells were co-transfected with caMC4R and caMRAP2 in four ratios (1:0, 1:1, 1:3, and 1:5). To study the constitutive activity of Gs cAMP, cells were transfected with different concentrations caMC4R plasmid (0, 0.007, 0.015, 0.030, 0.060, 0.125, and 0.250 μg/μL).

2.11. Statistical Analysis

All data were expressed as the mean ± SEM. Statistical analysis of gene expression was performed with SPSS 19.0 software. Significant differences were calculated using one-way analysis of variance (ANOVA), followed by the post hoc test (least significant difference test and Duncan’s multiple range test), after confirming for data normality and homogeneity of variances. GraphPad Prism 6.0 software (San Diego, CA, USA) was used to calculate the parameters of ligand binding and cAMP signaling assays including Bmax, IC50, Rmax, and EC50. The significance of differences in ligand binding and signaling between caMC4R and hMC4R were determined by Student’s t-test. Parameters in flow cytometry, ligand binding, and cAMP of caMC4R regulated by MRAP2s were analyzed for significance of differences by one-way ANOVA.

3. Results

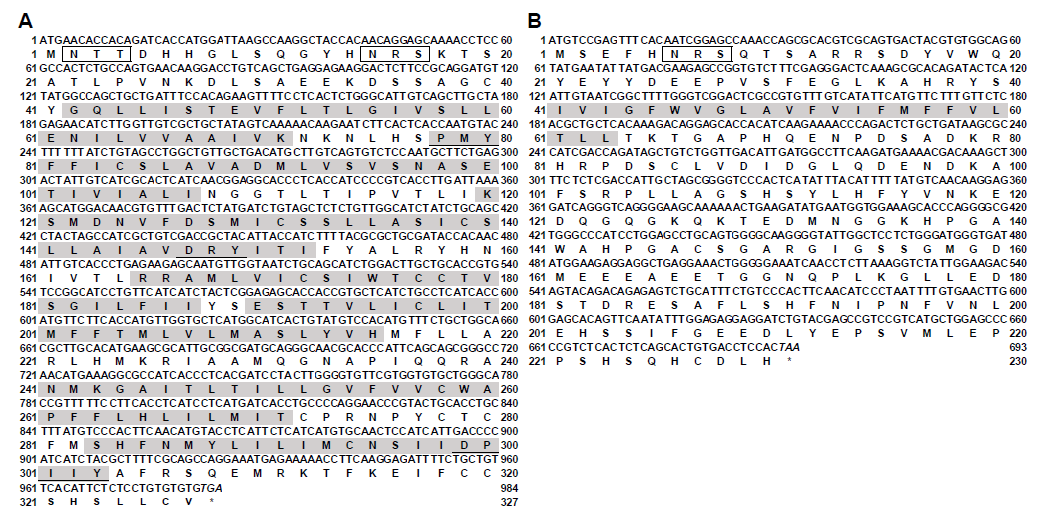
3.1. Molecular Cloning of Snakehead mc4r and mrap2 Genes

The cDNA sequence of snakehead mc4r was 1515 bp in length, and contained a 984 bp open reading frame (ORF) encoding a putative 327-amino acid protein, and has been deposited into the GenBank database (accession number KU728167) (Figure 1A).
Similar to other teleost mc4r, the coding region of the snakehead mc4r was intronless. Potential glycosylation and phosphorylation sites were found in N- and C-termini, respectively (Figure 1A and Figure S1A). In addition, cysteine residues at positions 40, 84, 131, 178, 197, 258, 272, 278, 280, and 319 were highly conserved in all vertebrate MC4Rs (Figure S1A). Alignment showed the deduced amino acid sequence of snakehead MC4R was 66% and 93% identical to human and seabass MC4Rs, respectively (Figure S1A). The sequence identity was unevenly distributed, with the N-terminal extracellular domain displaying the lowest identity to other MC4Rs, including seabass MC4R (Figure S1A).
The ORF of snakehead mrap2 was 693 bp long, encoding a protein of 230 amino acids (Figure 1B), and has been deposited into the GenBank database (accession number MW118677). Consistent with other teleost MRAP2s, snakehead MRAP2 possessed a glycosylation site in the N-terminus, a conserved motif (LKAHKYS) crucial for the formation of antiparallel homodimer, a single TMD, and a conserved motif (NIPNFVN) in C-terminus (Figure 1B and Figure S2), with a calculated PI and molecular weight of 4.73 and 25.79 kDa, respectively. Snakehead MRAP2 showed 40.0% and 38.3% similarity with its homologs from human and chicken, and shared 42.7%, 37.5%, 55.0%, and 77.5% identity with zebrafish (MRAP2a and MRAP2b), pufferfish, and grouper MRAP2s (Figure S2).

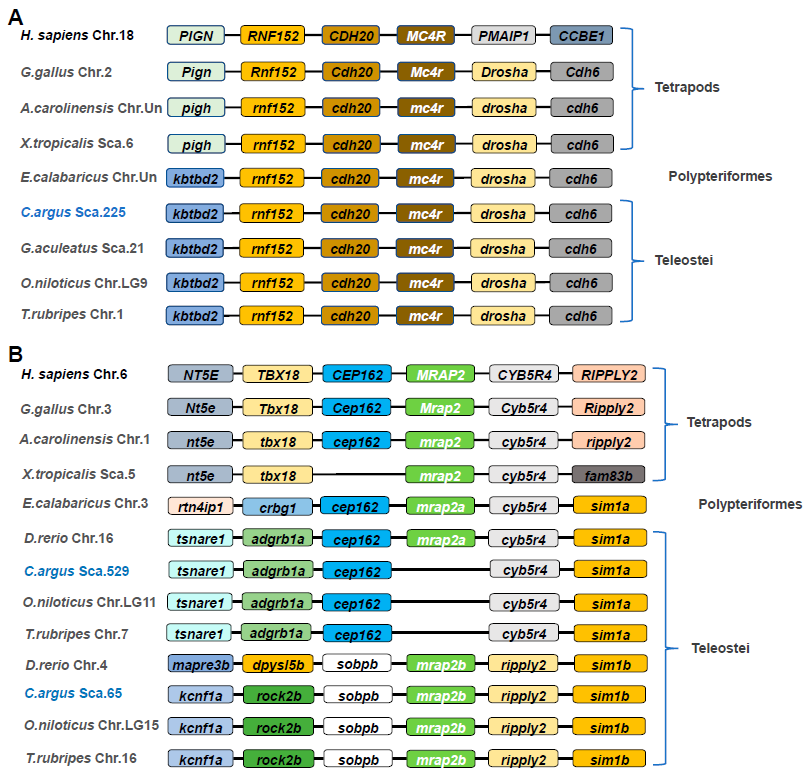
3.2. Comparative Synteny of mc4r and mrap2 in Various Vertebrate Genomes

In the present study, a comparative genomic analysis was performed to investigate the genetic diversity of MC4R and MRAP2 in vertebrates (Figure 2). As shown in Figure 2A, a conserved gene cluster RNF152-CDH20-MC4R-DROSHA-CDH6 was identified in genomes of nearly all representative species, implying that the synteny of MC4R was highly conserved across vertebrates (Figure 2A).
Different from MC4R, mrap2 possessed two isoforms in teleosts and only a single gene in tetrapods (Figure 2B). Generally, a gene conserved cluster NT5E-TBX18-CEP162-MRAP2-CYB5R4-RIPPLY2 was identified in tetrapods, and the core gene cluster CEP162-MRAP2a-CYB5R4 was also found in teleosts (Figure 2B), such as zebrafish (D. rerio) and a living fossil species reedfish (E. calabaricus). However, mrap2a was lost in Perciform fishes including snakehead (C. argus), tilapia (O. niloticus), and pufferfish (T. rubripes). Interestingly, a different gene cluster SOBPb-MRAP2b-RIPPLY2-SIM1b was identified in almost all teleosts examined in the present study, except reedfish (Figure 2B).

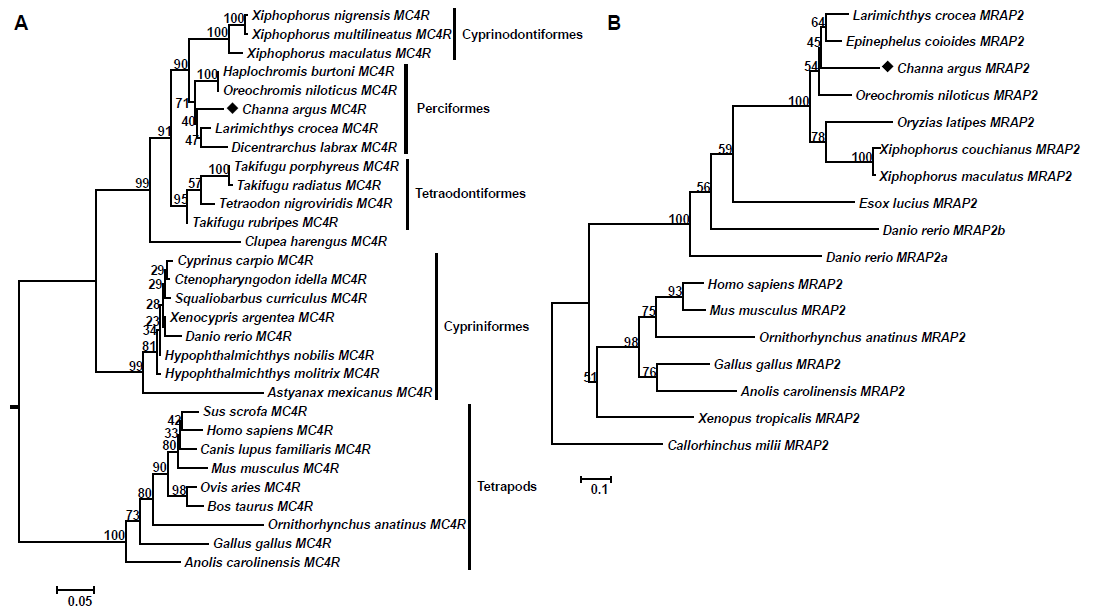
3.3. Phylogenetic Analysis

Two phylogenetic trees were constructed using Neighbor-Joining (NJ) method based on a series of protein sequences of vertebrate MC4Rs and MRAP2s, and both trees were robust with high bootstrap values (Figure 3).
As shown in Figure 3A, the phylogenetic tree was divided into two groups, teleost MC4Rs and higher vertebrate MC4Rs, and the teleost MC4R group could be further divided into four subgroups containing Cyprinodontiformes, Perciformes, Tetraodonformes, and Cypriniformes. Meanwhile, MC4R in Perciformes appeared posterior to Cypriniformes, but prior to Cyprinodontiformes in the evolutionary history of vertebrates (Figure 3A). Moreover, the snakehead MC4R was grouped into Perciformes, and shared a close relationship with seabass (Dicentrarchus labrax) and large yellow croaker (Larimichthys crocea) MC4Rs (Figure 3A). Additionally, the phylogenetic tree of MRAP2 was clustered into two groups of tetrapods and teleosts, and snakehead MRAP2 was grouped into the Perciforms with a close relationship with tilapia, orange-spotted grouper, and large yellow croaker (Figure 3B). Notably, it is shown that zebrafish MRAP2b shared close relationship with MRAP2 from other teleosts, in comparison with its paralog MRAP2a (Figure 3B).

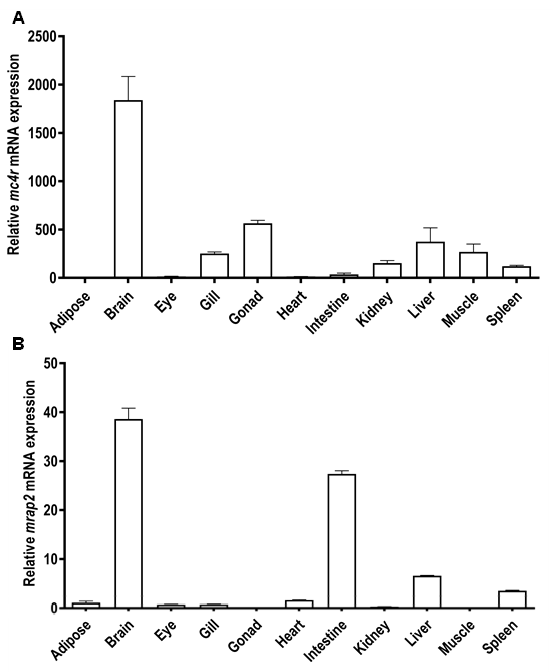
3.4. Tissue Distribution of Snakehead mc4r and mrap2 Genes

The expression of snakehead mc4r and mrap2 was determined using quantitative real-time PCR. Similar to other fish, snakehead mc4r was found to be extensively expressed in central and peripheral tissues, including adipose, brain, eye, gill, gonad (ovary), heart, intestine, kidney, liver, muscle, and spleen (Figure 4A), with the highest expression in the brain (Figure 4A).
Similarly, snakehead mrap2 was also widely distributed in these tissues with the highest expression in brain (Figure 4B).

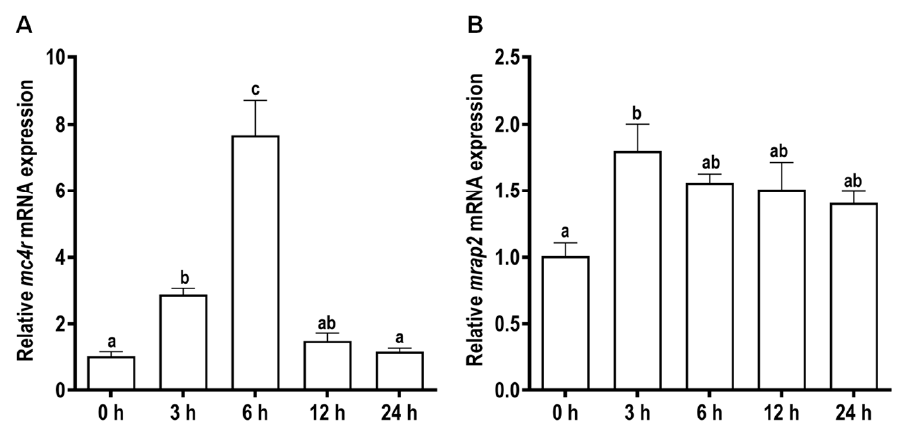
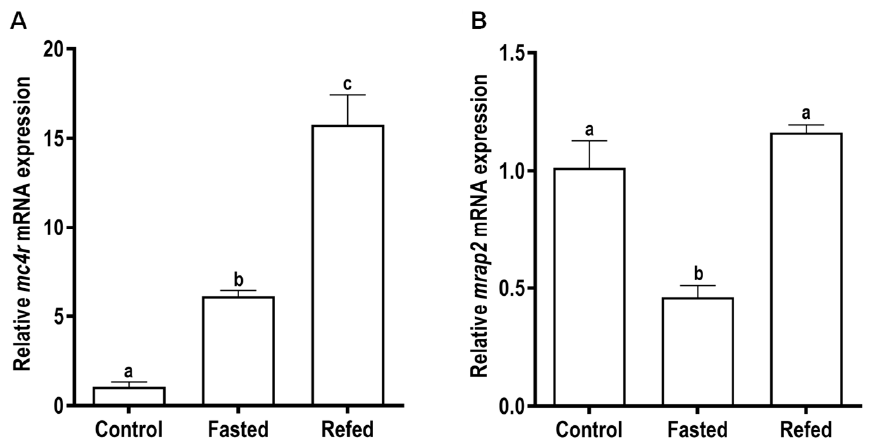
3.5. Effects of Fasting and Refeeding on the Expressions of Snakehead mc4r and mrap2 Genes

To investigate the potential roles of snakehead MC4R and MRAP2 in energy balance, the mRNA expression levels of both genes in the brain were determined after food deprivation and refeeding. In the short-term trial, the mc4r mRNA level was significantly increased at 3 and 6 h while returned to basal level at 12 and 24 h after food deprivation (Figure 5A).
Meanwhile, the mrap2 mRNA level was significantly increased at 3 h, and then maintained at relatively high mRNA levels at 6, 12, and 24 h (Figure 5B). In the long-term trial, the expression level of mc4r was significantly increased after two-week fasting, and further increased after refeeding (Figure 6A). Differently, the mRNA level of mrap2 was dramatically decreased after fasting whereas recovered to the control level after refeeding (Figure 6B).

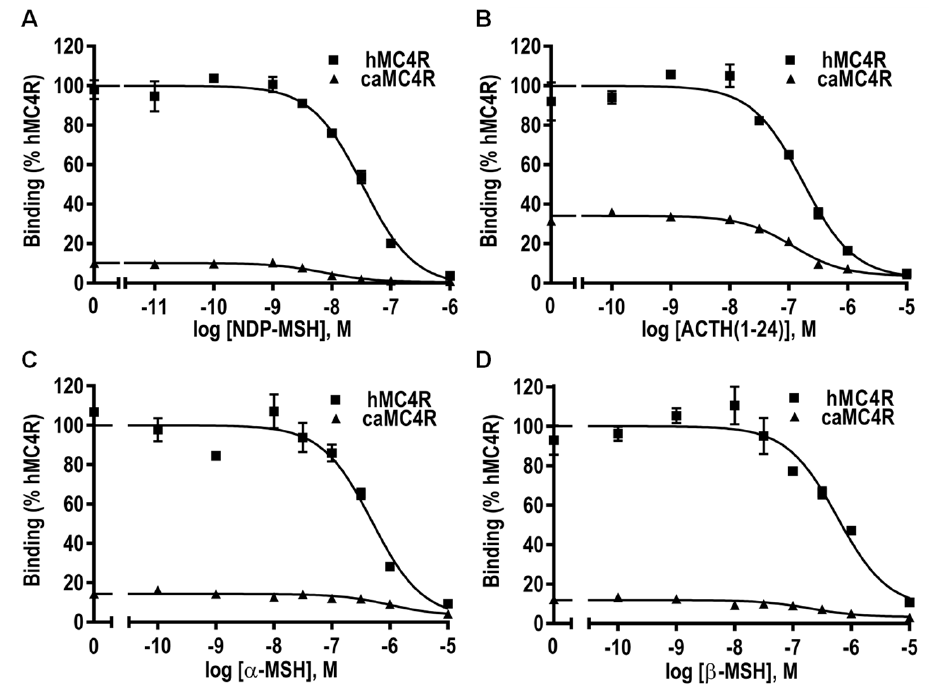
3.6. Ligand Binding Properties of caMC4R

Ligand binding assays were performed to determine the binding properties of caMC4R with different MC4R ligands. Four unlabeled ligands (NDP-MSH, ACTH (1–24), α-MSH and β-MSH) were used to compete with 125I-NDP-MSH. The maximal binding value of caMC4R was significantly lower than that of hMC4R (16.32 ± 2.46% of hMC4R) (Figure 7 and Table 1).
When NDP-MSH or α-MSH was used to displace the 125I-NDP-MSH, caMC4R showed significantly decreased or increased IC50 values in comparison with hMC4R, whereas when the other two ligands were used as competitors, hMC4R and caMC4R exhibited similar IC50s (Figure 7 and Table 1).

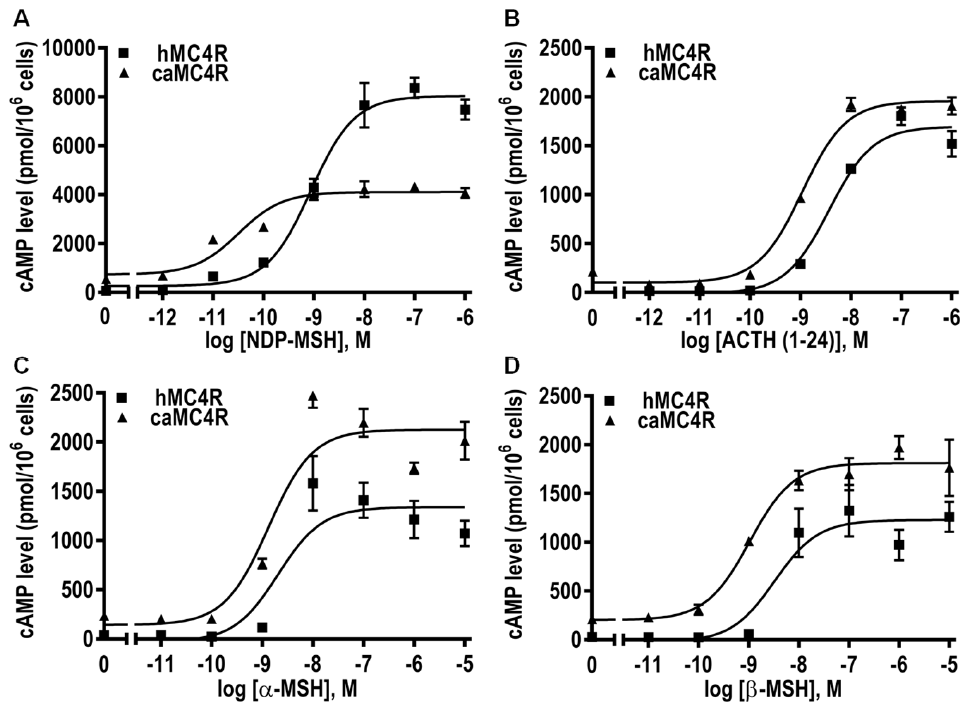
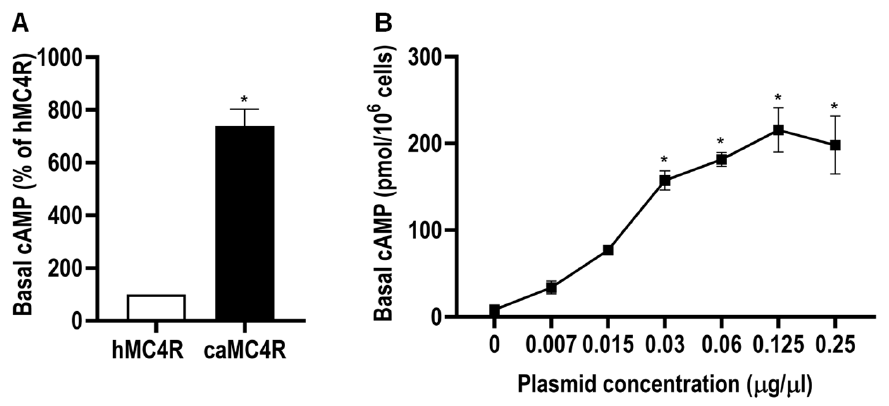
3.7. Signaling Properties of caMC4R

To investigate whether caMC4R could respond to ligand stimulation with increased cAMP level, RIA was carried out. As shown in Figure 8, all ligands could increase the intracellular cAMP level in a dose-dependent manner. The EC50 of ACTH (1–24) for caMC4R was significantly lower than that of hMC4R, whereas the EC50s of NDP-MSH, α-MSH, and β-MSH were comparable with those of hMC4R (Table 2). The caMC4R showed higher maximal responses than hMC4R when stimulated with ACTH (1–24), α-MSH, and β-MSH, and slightly decreased maximal response in response to NDP-MSH (Figure 8 and Table 2).
The basal cAMP level of caMC4R was also measured. The results demonstrated caMC4R had significantly increased basal activity, which was 7.39 times that of hMC4R (Figure 9A and Table 2). To confirm constitutive activity of caMC4R, different concentrations of caMC4R plasmids were transfected into HEK293T cells and basal cAMP levels were measured. The high basal intracellular cAMP level was detected at only 0.03 μg/μL caMC4R plasmid transfected (Figure 9B).

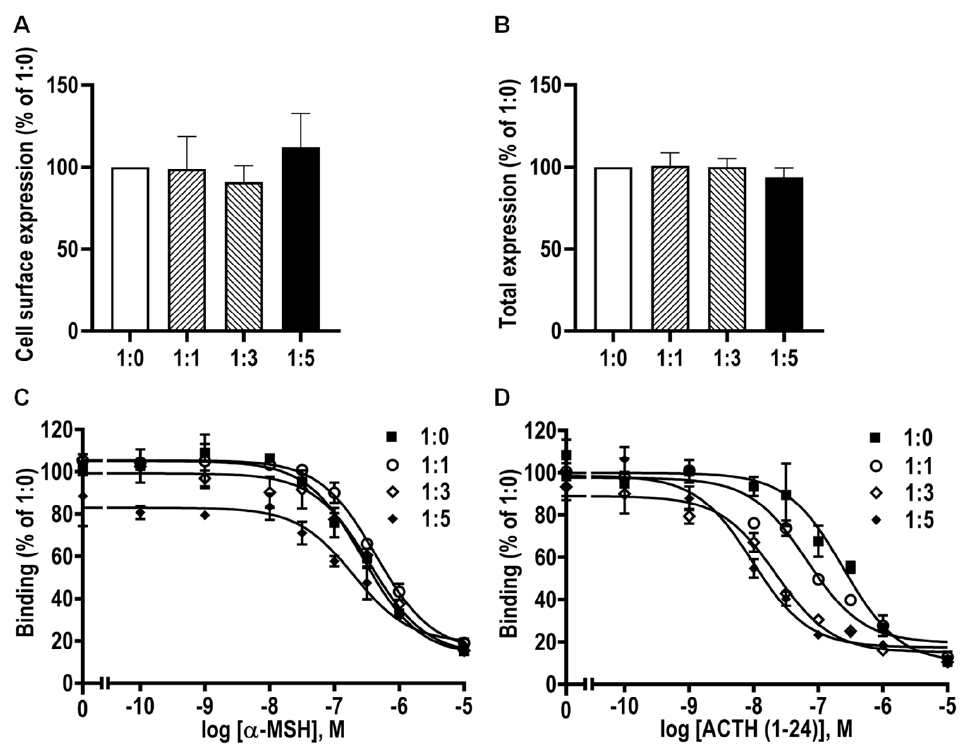
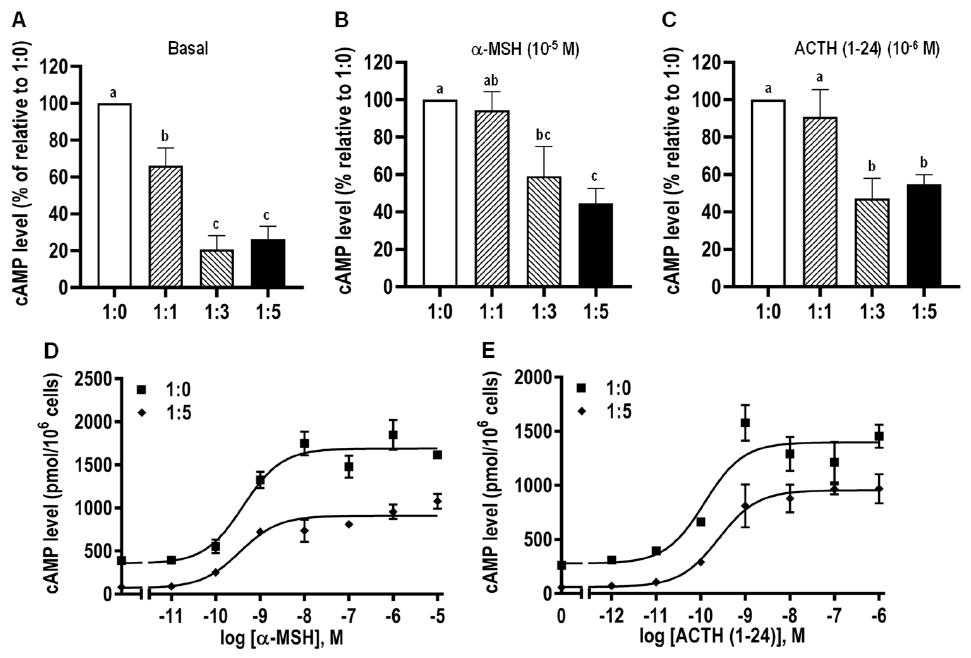
3.8. Modulation of caMC4R Expression and Pharmacological Properties by caMRAP2

To investigate the effects of caMRAP2 on the cell surface and total expression levels of caMC4R, flow cytometry was performed. No significant difference was observed among the four groups for cell surface or total expression (Figure 10A,B). Competitive ligand binding assays showed that IC50s of caMC4R to ACTH (1–24) was decreased by caMRAP2 in the 1:3 and 1:5 groups, whereas no change was observed in IC50s for α-MSH among the four groups (Figure 10C,D and Table 3).
In order to explore the effect of caMRAP2 on the cAMP signaling of caMC4R, cells were co-transfected with caMC4R and caMRAP2 in different ratios. The results showed that caMRAP2 dose-dependently decreased the basal cAMP levels (Figure 11A). In addition, caMRAP2 significantly reduced signaling induced by both α-MSH and ACTH (1–24) (Figure 11B,C and Table 4). Dose–response experiments showed that caMRAP2 only decreased the maximal response with no effect on EC50s (Figure 11D,E and Table 4).

4. Discussion

In this study, we cloned snakehead mc4r and mrap2 genes. Sequence comparison showed that caMC4R shared more than 80% amino acid identity with other teleost MC4Rs, whereas caMRAP2 shared lower identity (37.5–77.5%) with other teleost MRAP2s, suggesting MC4R was more conserved than MRAP2 in teleosts.
Comparative gene synteny analysis showed that only a single copy of mc4r was identified in vertebrates with a conservative gene cluster RNF152-CDH20-MC4R-DROSHA-CDH6, suggesting that this receptor is highly conserved and may play similar roles in vertebrates. In tetrapod, only a single copy of mrap2 was identified in their genomes, exhibiting a conserved gene cluster NT5E-TBX18-CEP162-MRAP2-CYB5R4-RIPPLY2. In teleosts, the gene number of mrap2 is variable. In zebrafish, two copies of mrap2 (mrap2a and mrap2b) were identified, and functional studies showed that MRAP2a decreases binding affinity for α-MSH while MRAP2b increases ligand sensitivity of MC4R [35]. In reedfish, only a single mrap2 was identified and it shares a similar conserved genetic locus with tetrapod mrap2 and zebrafish mrap2a, suggesting that the duplication of mrap2 might have occurred after the specific whole genome duplication event in teleost [55]. Interestingly, we found that the homolog of zebrafish mrap2a was lost in Perciform and Tetraodontiform fishes, including snakehead, tilapia, and puffer fish. However, the mrap2b paralog was retained in these teleost genomes with a conserved gene cluster SOBPb-MRAP2b-RIPPLY2-SIM1b, suggesting the evolutionary process of mrap2 is complex in teleosts and the physiological role of this gene might be variable.
To investigate the evolutionary relationship of vertebrate MC4Rs and MRAP2s, phylogenetic trees were constructed. Both trees were divided into two subgroups of teleost and tetrapod subgroup, similar to previous studies [28,32,33]. For the MC4R tree, the Cypriniformes clade was located at the root of the subgroup, suggesting the Cypriniformes MC4R might have appeared earlier in the evolutionary history than other teleosts. Meanwhile, the snakehead MC4R was clustered into Perciformes clade, and shared a close relationship with seabass MC4R. These findings were consistent with the traditional species classification [27,28]. For the MRAP2 tree, zebrafish MRAP2b shares a close relationship with MRAP2 from other teleosts, in comparison with its paralog MRAP2a, suggesting the restrained MRAP2 in snakehead and other teleosts is the homolog of zebrafish MRAP2b, consistent with gene synteny analysis.
Data from real-time quantitative PCR showed that mc4r was widely expressed in various tissues with high expression in brain and gonad, similar to previous studies [27,28,29,30,31,32,33,56], suggesting that snakehead MC4R might also be involved in regulating food intake [25,32] and sexual maturation [12,57]. Meanwhile, mrap2 was also extensively distributed in several tissues, with relatively high expression in brain and gonad. This distribution pattern of mrap2 was also found in orange-spotted grouper [30], Nile tilapia [39], and topmouth culter [31], suggesting functional identity of MRAP2 in teleosts. Additionally, mc4r and mrap2 exhibited similar distribution pattern, indicating that they might interact with each other in snakehead.
We measured mc4r and mrap2 expression after short-term and long-term fasting and refeeding. We showed that expression of these genes was modulated by these manipulations (Figure 5 and Figure 6), indicating their potential involvement in regulating energy homeostasis. Several previous studies also investigated the expression of these genes with fasting and refeeding, obtaining conflicting results in different species [32,33,56,58,59]. Further studies, including physiological experiments involving measuring energy balance with in vivo administration of ligands, are needed to clarify the physiological function of MC4R.
To investigate the pharmacological characteristics of caMC4R, four ligands were used, together with hMC4R for comparison. Our results demonstrated that caMC4R was fully functional. The synthetic agonist NDP-MSH bound to caMC4R with the highest affinity with an IC50 of 4.50 nM, which is about 7-fold lower than hMC4R. Additionally, it stimulated caMC4R with the highest potency with an EC50 of 0.04 nM. α- and β-MSHs stimulated caMC4R with similar potency as hMC4R. However, ACTH (1–24) had 3-fold higher potency at caMC4R than hMC4R. Previous studies demonstrated that fish MC4Rs have decreased binding capacities [27,28,29,30,31,60]. We also found lower binding capacity in caMC4R (16.32% of that of hMC4R) (Figure 7 and Table 1). Among the three endogenous ligands used here, ACTH (1–24) showed high binding affinity, further supporting the suggestion that ACTH (1–24) might act as the ancestral ligand for MCRs.
A remarkably elevated basal cAMP activity was found in caMC4R. This phenomenon has also been reported in other fish species, such as spotted scat [27], grass carp [28], swamp eel [29], orange-spotted grouper [30], and topmouth culter [31]. In contrast to hMC3R, hMC4R has some basal activity [61]. Srinivasan and colleagues reported that part of the N-terminus functions as a tethered intramolecular ligand to maintain the constitutive activity of hMC4R [62]. Here, low sequence homology was found within the N-terminus in caMC4R when compared with hMC4R. We hypothesized that structural difference of N-termini may account for its high basal activity. The loss of constitutive activity in mutant hMC4Rs is one cause of obesity [62,63]. Therefore, the development of an MC4R agonist has been regarded as a therapeutic option for human obesity treatment. However, increasing food intake and decreasing energy expenditure of aquaculture species will deliver benefits for farmers. As a result, focusing on the study of caMC4R antagonists will promote the development of snakehead cultivation.
In this study, we showed that caMRAP2 did not affect cell surface and total expression of caMC4R, similar to the observation in chicken [59], but different from results obtained in tilapia [39] and mouse [22] (decreased cell surface expression), or zebrafish [35] and topmouth culter [31] (increased cell surface expression). Therefore, MRAP2 has a differential effect on MC4R membrane expression in different species. Snakehead MRAP2 increased binding affinity of caMC4R to ACTH (1–24), but did not affect the IC50 of caMC4R to α-MSH. In topmouth culter, two isoforms of MRAP2 are also shown to increase binding affinity of MC4R to ACTH (1–24), but not to α-MSH [31]. In addition to its chaperoning role, MRAP1 also enables MC2R to form the high-affinity binding pocket to ACTH [64]. MRAP2 might also make caMC4R to achieve a conformation with enhanced affinity to ACTH. The high constitutive activity in cAMP pathway of caMC4R was inhibited by caMRAP2, similar to our previous observations in orange-spotted grouper [30] and topmouth culter [31]. In the presence of caMRAP2, significantly decreased maximal response but not EC50 of caMC4R in response to α-MSH or ACTH (1–24) was observed. Previous studies demonstrated that MC4R can become an ACTH receptor by increasing ligand sensitivity to ACTH in the presence of MRAP2 [36,59,65]. In our experiments, ligand sensitivity to ACTH (1–24) of caMC4R was not increased by caMRAP2, despite the increased binding affinity to ACTH (1–24) by caMRAP2.
In addition to energy homeostasis, MC4R also regulates reproduction and sexual function [2]. Compared with mammals, the evidence of MC4R in regulating teleost reproduction is relatively scarce. In swordtail fish, nonfunctional Y-linked mc4r copies in larger males act as dominant-negative mutants and delay puberty onset [57]. In spotted scat, MC4R stimulates gnrh expression in the hypothalamus, thereby modulating pituitary FSH and LH synthesis [66]. In black rockfish, α- and β-MSHs increase brain gnih and decrease sgnrh and cgnrh expression in vitro; they also affect expression of some ovarian genes. These studies demonstrated that MC4R could play a vital role in reproductive regulation in fish. In the present study, we also observed that mc4r and mrap2 were highly expressed in gonad, implying a potential role in reproduction. Therefore, future studies on MC4R regulation of reproductive function are warranted.

5. Conclusions

In conclusion, our studies on snakehead MC4R and MRAP2 and their interaction contributes to a better understanding of fish MC4Rs. Some aspects, such as high expression of these genes in the brain and significant expression in the gonad, and high basal activity were similar to previous studies in fish. However, our data, combined with literature, suggested that functional implications of MRAP2 on MC4R are divergent in different species. Whether MC4R could be modulated to improve growth and reproduction of snakehead remains to be investigated.

Supplementary Materials

The following are available online at https://www.mdpi.com/2218-273X/11/3/481/s1.

Author Contributions

Conceptualization, Y.-X.T.; methodology, Z.-Y.W. and Y.-X.T.; software, Z.-Y.W., T.L., C.-J.Q., and J.W.; validation, Z.-Y.W., T.L., Y.-C.Z., J.W., and R.L.; formal analysis, Z.-Y.W., T.L., and C.-J.Q.; investigation, Z.-Y.W., T.L., J.W., and R.L.; resources, C.-J.Q., Y.-C.Z., J.W., and R.L.; data curation, Z.-Y.W. and T.L.; writing—original draft preparation, Z.-Y.W. and T.L.; writing—review and editing, Y.-X.T.; visualization, Z.-Y.W. and T.L.; supervision, Z.-Y.W. and Y.-X.T.; project administration, Z.-Y.W. and Y.-X.T.; funding acquisition, Z.-Y.W. and Y.-X.T. All authors have read and agreed to the published version of the manuscript.

Funding

This research was funded by the Scientific Research Fund of Sichuan Provincial Education Department (no. 18ZB0328) and the Special Research Program of Neijiang Normal University (no. 17ZL03) and Ocean University of China—Auburn University Joint Center Grants Program.

Institutional Review Board Statement

The study was conducted according to the guidelines of the Declaration of Helsinki, and approved by the Ethics Committee of Neijiang Normal University (protocol code SK1703 and approved on 2017-05-21).

Data Availability Statement

The raw data supporting the conclusions of this article will be made available by the authors upon request, without undue reservation.

Conflicts of Interest

The authors declare no conflict of interest. The funders had no role in the design of the study; in the collection, analyses, or interpretation of data; in the writing of the manuscript, or in the decision to publish the results.

References

  1. Cone, R.D. Anatomy and regulation of the central melanocortin system. Nat. Neurosci. 2005, 8, 571–578. [Google Scholar] [CrossRef] [PubMed]
  2. Tao, Y.X. The melanocortin-4 receptor: Physiology, pharmacology, and pathophysiology. Endocr. Rev. 2010, 31, 506–543. [Google Scholar] [CrossRef] [PubMed] [Green Version]
  3. Gantz, I.; Miwa, H.; Konda, Y.; Shimoto, Y.; Tashiro, T.; Watson, S.J.; DelValle, J.; Yamada, T. Molecular cloning, expression, and gene localization of a fourth melanocortin receptor. J. Biol. Chem. 1993, 268, 15174–15179. [Google Scholar] [CrossRef]
  4. Mountjoy, K.G.; Mortrud, M.T.; Low, M.J.; Simerly, R.B.; Cone, R.D. Localization of the melanocortin-4 receptor (MC4-R) in neuroendocrine and autonomic control circuits in the brain. Mol. Endocrinol. 1994, 8, 1298–1308. [Google Scholar] [PubMed] [Green Version]
  5. Fan, W.; Boston, B.A.; Kesterson, R.A.; Hruby, V.J.; Cone, R.D. Role of melanocortinergic neurons in feeding and the agouti obesity syndrome. Nature 1997, 385, 165–168. [Google Scholar] [CrossRef] [PubMed]
  6. Ollmann, M.M.; Wilson, B.D.; Yang, Y.K.; Kerns, J.A.; Chen, Y.; Gantz, I.; Barsh, G.S. Antagonism of central melanocortin receptors in vitro and in vivo by agouti-related protein. Science 1997, 278, 135–138. [Google Scholar] [CrossRef] [PubMed]
  7. Huszar, D.; Lynch, C.A.; Fairchild-Huntress, V.; Dunmore, J.H.; Fang, Q.; Berkemeier, L.R.; Gu, W.; Kesterson, R.A.; Boston, B.A.; Cone, R.D.; et al. Targeted disruption of the melanocortin-4 receptor results in obesity in mice. Cell 1997, 88, 131–141. [Google Scholar] [CrossRef] [Green Version]
  8. Vaisse, C.; Clement, K.; Guy-Grand, B.; Froguel, P. A frameshift mutation in human MC4R is associated with a dominant form of obesity. Nat. Genet. 1998, 20, 113–114. [Google Scholar] [CrossRef]
  9. Yeo, G.S.; Farooqi, I.S.; Aminian, S.; Halsall, D.J.; Stanhope, R.G.; O’Rahilly, S. A frameshift mutation in MC4R associated with dominantly inherited human obesity. Nat. Genet. 1998, 20, 111–112. [Google Scholar] [CrossRef]
  10. Loos, R.J.; Lindgren, C.M.; Li, S.; Wheeler, E.; Zhao, J.H.; Prokopenko, I.; Inouye, M.; Freathy, R.M.; Attwood, A.P.; Beckmann, J.S.; et al. Common genetic variation near MC4R is associated with waist circumference and insulin resistance. Nat. Genet. 2008, 40, 716–718. [Google Scholar]
  11. Van der Ploeg, L.H.; Martin, W.J.; Howard, A.D.; Nargund, R.P.; Austin, C.P.; Guan, X.; Drisko, J.; Cashen, D.; Sebhat, I.; Patchett, A.A.; et al. A role for the melanocortin 4 receptor in sexual function. Proc. Natl. Acad. Sci. USA 2002, 99, 11381–11386. [Google Scholar] [CrossRef] [Green Version]
  12. Irani, B.G.; Xiang, Z.; Moore, M.C.; Mandel, R.J.; Haskell-Luevano, C. Voluntary exercise delays monogenetic obesity and overcomes reproductive dysfunction of the melanocortin-4 receptor knockout mouse. Biochem. Biophys. Res. Commun. 2005, 326, 638–644. [Google Scholar] [CrossRef]
  13. Sandrock, M.; Schulz, A.; Merkwitz, C.; Schoneberg, T.; Spanel-Borowski, K.; Ricken, A. Reduction in corpora lutea number in obese melanocortin-4-receptor-deficient mice. Reprod. Biol. Endocrinol. 2009, 7, 24. [Google Scholar] [CrossRef] [Green Version]
  14. Agosti, F.; López Soto, E.J.; Cabral, A.; Castrogiovanni, D.; Schioth, H.B.; Perelló, M.; Raingo, J. Melanocortin 4 receptor activation inhibits presynaptic N-type calcium channels in amygdaloid complex neurons. Eur. J. Neurosci. 2014, 40, 2755–2765. [Google Scholar] [CrossRef]
  15. Podyma, B.; Sun, H.; Wilson, E.A.; Carlson, B.; Pritikin, E.; Gavrilova, O.; Weinstein, L.S.; Chen, M. The stimulatory G protein Gsalpha is required in melanocortin 4 receptor-expressing cells for normal energy balance, thermogenesis, and glucose metabolism. J. Biol. Chem. 2018, 293, 10993–11005. [Google Scholar] [CrossRef] [Green Version]
  16. Cortés, R.; Agulleiro, M.J.; Navarro, S.; Guillot, R.; Sánchez, E.; Cerdá-Reverter, J.M. Melanocortin receptor accessory protein 2 (MRAP2) interplays with the zebrafish melanocortin 1 receptor (MC1R) but has no effect on its pharmacological profile. Gen. Comp. Endocrinol. 2014, 201, 30–36. [Google Scholar] [CrossRef]
  17. Cerdá-Reverter, J.M.; Agulleiro, M.J.; Cortés, R.; Sánchez, E.; Guillot, R.; Leal, E.; Fernández-Durán, B.; Puchol, S.; Eley, M. Involvement of melanocortin receptor accessory proteins (MRAPs) in the function of melanocortin receptors. Gen. Comp. Endocrinol. 2013, 188, 133–136. [Google Scholar] [CrossRef] [PubMed]
  18. Rouault, A.A.J.; Srinivasan, D.K.; Yin, T.C.; Lee, A.A.; Sebag, J.A. Melanocortin receptor accessory proteins (MRAPs): Functions in the melanocortin system and beyond. Biochim. Biophys. Acta 2017, 1864, 2322–2329. [Google Scholar] [CrossRef] [PubMed]
  19. Schonnop, L.; Kleinau, G.; Herrfurth, N.; Volckmar, A.L.; Cetindag, C.; Müller, A.; Peters, T.; Herpertz, S.; Antel, J.; Hebebrand, J.; et al. Decreased melanocortin-4 receptor function conferred by an infrequent variant at the human melanocortin receptor accessory protein 2 gene. Obesity 2016, 24, 1976–1982. [Google Scholar] [CrossRef]
  20. Asai, M.; Ramachandrappa, S.; Joachim, M.; Shen, Y.; Zhang, R.; Nuthalapati, N.; Ramanathan, V.; Strochlic, D.E.; Ferket, P.; Linhart, K.; et al. Loss of function of the melanocortin 2 receptor accessory protein 2 is associated with mammalian obesity. Science 2013, 341, 275–278. [Google Scholar] [CrossRef] [PubMed] [Green Version]
  21. Chan, L.F.; Webb, T.R.; Chung, T.T.; Meimaridou, E.; Cooray, S.N.; Guasti, L.; Chapple, J.P.; Egertova, M.; Elphick, M.R.; Cheetham, M.E.; et al. MRAP and MRAP2 are bidirectional regulators of the melanocortin receptor family. Proc. Natl. Acad. Sci. USA 2009, 106, 6146–6151. [Google Scholar] [CrossRef] [Green Version]
  22. Habara, M.; Mori, N.; Okada, Y.; Kawasumi, K.; Nakao, N.; Tanaka, Y.; Arai, T.; Yamamoto, I. Molecular characterization of feline melanocortin 4 receptor and melanocortin 2 receptor accessory protein 2. Gen. Comp. Endocrinol. 2018, 261, 31–39. [Google Scholar] [CrossRef]
  23. Bruschetta, G.; Kim, J.D.; Diano, S.; Chan, L.F. Overexpression of melanocortin 2 receptor accessory protein 2 (MRAP2) in adult paraventricular MC4R neurons regulates energy intake and expenditure. Mol. Metab. 2018, 18, 79–87. [Google Scholar] [CrossRef]
  24. Cerdá-Reverter, J.M.; Ringholm, A.; Schioth, H.B.; Peter, R.E. Molecular cloning, pharmacological characterization, and brain mapping of the melanocortin 4 receptor in the goldfish: Involvement in the control of food intake. Endocrinology 2003, 144, 2336–2349. [Google Scholar] [CrossRef] [Green Version]
  25. Haitina, T.; Klovins, J.; Andersson, J.; Fredriksson, R.; Lagerstrom, M.C.; Larhammar, D.; Larson, E.T.; Schioth, H.B. Cloning, tissue distribution, pharmacology and three-dimensional modelling of melanocortin receptors 4 and 5 in rainbow trout suggest close evolutionary relationship of these subtypes. Biochem. J. 2004, 380, 475–486. [Google Scholar] [CrossRef] [Green Version]
  26. Li, J.T.; Yang, Z.; Chen, H.P.; Zhu, C.H.; Deng, S.P.; Li, G.L.; Tao, Y.X. Molecular cloning, tissue distribution, and pharmacological characterization of melanocortin-4 receptor in spotted scat, Scatophagus argus. Gen. Comp. Endocrinol. 2016, 230–231, 143–152. [Google Scholar] [CrossRef]
  27. Li, L.; Yang, Z.; Zhang, Y.P.; He, S.; Liang, X.F.; Tao, Y.X. Molecular cloning, tissue distribution, and pharmacological characterization of melanocortin-4 receptor in grass carp (Ctenopharyngodon idella). Domest Anim Endocrinol. 2017, 59, 140–151. [Google Scholar] [CrossRef]
  28. Yi, T.L.; Yang, L.K.; Ruan, G.L.; Yang, D.Q.; Tao, Y.X. Melanocortin-4 receptor in swamp eel (Monopterus albus): Cloning, tissue distribution, and pharmacology. Gene 2018, 678, 79–89. [Google Scholar] [CrossRef]
  29. Rao, Y.Z.; Chen, R.; Zhang, Y.; Tao, Y.X. Orange-spotted grouper melanocortin-4 receptor: Modulation of signaling by MRAP2. Gen. Comp. Endocrinol. 2019, 284, 113234. [Google Scholar] [CrossRef]
  30. Tao, M.; Ji, R.L.; Huang, L.; Fan, S.Y.; Liu, T.; Liu, S.J.; Tao, Y.X. Regulation of melanocortin-4 receptor pharmacology by two isoforms of melanocortin receptor accessory protein 2 in topmouth culter (Culter alburnus). Front. Endocrinol. 2020, 11, 538. [Google Scholar] [CrossRef]
  31. Kobayashi, Y.; Tsuchiya, K.; Yamanome, T.; Schioth, H.B.; Kawauchi, H.; Takahashi, A. Food deprivation increases the expression of melanocortin-4 receptor in the liver of barfin flounder, Verasper moseri. Gen. Comp. Endocrinol. 2008, 155, 280–287. [Google Scholar] [CrossRef] [PubMed]
  32. Wei, R.; Yuan, D.; Zhou, C.; Wang, T.; Lin, F.; Chen, H.; Wu, H.; Xin, Z.; Yang, S.; Chen, D.; et al. Cloning, distribution and effects of fasting status of melanocortin 4 receptor (MC4R) in Schizothorax prenanti. Gene 2013, 532, 100–107. [Google Scholar] [CrossRef] [PubMed]
  33. Aspiras, A.C.; Rohner, N.; Martineau, B.; Borowsky, R.L.; Tabin, C.J. Melanocortin 4 receptor mutations contribute to the adaptation of cavefish to nutrient-poor conditions. Proc. Natl. Acad. Sci. USA 2015, 112, 9668–9673. [Google Scholar] [CrossRef] [PubMed] [Green Version]
  34. Sebag, J.A.; Zhang, C.; Hinkle, P.M.; Bradshaw, A.M.; Cone, R.D. Developmental control of the melanocortin-4 receptor by MRAP2 proteins in zebrafish. Science 2013, 341, 278–281. [Google Scholar] [CrossRef] [Green Version]
  35. Josep Agulleiro, M.; Cortes, R.; Fernandez-Duran, B.; Navarro, S.; Guillot, R.; Meimaridou, E.; Clark, A.J.; Cerdá-Reverter, J.M. Melanocortin 4 receptor becomes an ACTH receptor by coexpression of melanocortin receptor accessory protein 2. Mol. Endocrinol. 2013, 27, 1934–1945. [Google Scholar] [CrossRef]
  36. Tao, Y.X. Molecular chaperones and G protein-coupled receptor maturation and pharmacology. Mol. Cell Endocrinol. 2020, 511, 110862. [Google Scholar] [CrossRef]
  37. Zhu, M.; Xu, B.; Wang, M.; Liu, S.; Zhang, Y.; Zhang, C. Pharmacological modulation of MRAP2 protein on melanocortin receptors in the sea lamprey. Endocr. Connect 2019, 8, 378–388. [Google Scholar] [CrossRef] [Green Version]
  38. Wang, M.; Chen, Y.J.; Zhu, M.; Xu, B.X.; Guo, W.X.; Lyu, Y.S.; Zhang, C. Pharmacological modulation of melanocortin-4 receptor by melanocortin receptor accessory protein 2 in Nile tilapia. Gen. Comp. Endocrinol. 2019, 282, 113219. [Google Scholar] [CrossRef]
  39. Wen, Z.Y.; Qin, C.J.; Wang, J.; He, Y.; Li, H.T.; Li, R.; Wang, X.D. Molecular characterization of two leptin genes and their transcriptional changes in response to fasting and refeeding in Northern snakehead (Channa argus). Gene 2020, 736, 144420. [Google Scholar] [CrossRef]
  40. Xu, J.; Bian, C.; Chen, K.C.; Liu, G.M.; Jiang, Y.L.; Luo, Q.; You, X.X.; Peng, W.Z.; Li, J.; Huang, Y.; et al. Draft genome of the Northern snakehead, Channa argus. Giga Sci. 2017, 6, gix011. [Google Scholar] [CrossRef]
  41. Mo, X.L.; Yang, R.; Tao, Y.X. Functions of transmembrane domain 3 of human melanocortin-4 receptor. J. Mol. Endocrinol. 2012, 49, 221–235. [Google Scholar] [CrossRef] [Green Version]
  42. Steiner, A.L.; Kipnis, D.M.; Utiger, R.; Parker, C. Radioimmunoassay for the measurement of adenosine 3’,5’-cyclic phosphate. Proc. Natl. Acad. Sci. USA 1969, 64, 367–373. [Google Scholar] [CrossRef] [Green Version]
  43. Tao, Y.X.; Segaloff, D.L. Functional characterization of melanocortin-4 receptor mutations associated with childhood obesity. Endocrinology 2003, 144, 4544–4551. [Google Scholar] [CrossRef]
  44. Wen, Z.Y.; Liang, X.F.; He, S.; Li, L.; Shen, D.; Tao, Y.X. Molecular cloning and tissue expression of uncoupling protein 1, 2 and 3 genes in Chinese perch (Siniperca chuatsi). Comp. Biochem. Physiol. Part B Biochem. Mol. Biol. 2015, 185, 24–33. [Google Scholar] [CrossRef]
  45. Yu, J.; Gimenez, L.E.; Hernandez, C.C.; Wu, Y.; Wein, A.H.; Han, G.W.; McClary, K.; Mittal, S.R.; Burdsall, K.; Stauch, B.; et al. Determination of the melanocortin-4 receptor structure identifies Ca2+ as a cofactor for ligand binding. Science 2020, 368, 428–433. [Google Scholar] [CrossRef]
  46. Wen, Z.Y.; Wang, J.; Bian, C.; Zhang, X.; Li, J.; Peng, Y.; Zhan, Q.; Shi, Q.; Li, Y.Y. Molecular cloning of two kcnk3 genes from the Northern snakehead (Channa argus) for quantification of their transcriptions in response to fasting and refeeding. Gen. Comp. Endocrinol. 2019, 281, 49–57. [Google Scholar] [CrossRef]
  47. Wen, Z.Y.; Bian, C.; You, X.; Zhang, X.; Li, J.; Zhan, Q.; Peng, Y.; Li, Y.Y.; Shi, Q. Characterization of two kcnk3 genes in Nile tilapia (Oreochromis niloticus): Molecular cloning, tissue distribution, and transcriptional changes in various salinity of seawater. Genomics 2020, 112, 2213–2222. [Google Scholar] [CrossRef]
  48. Wen, Z.; Li, Y.; Bian, C.; Shi, Q.; Li, Y. Characterization of two kcnk3 genes in rabbitfish (Siganus canaliculatus): Molecular cloning, distribution patterns and their potential roles in fatty acids metabolism and osmoregulation. Gen. Comp. Endocrinol. 2020, 296, 113546. [Google Scholar] [CrossRef]
  49. Nylander, J.A.A. MrAIC. pl. Program Distributed by the Author; Evolutionary Biology Centre, Uppsala University: Uppsala, Sweden, 2004. [Google Scholar]
  50. Abascal, F.; Zardoya, R.; Posada, D. ProtTest: Selection of best-fit models of protein evolution. Bioinformatics 2005, 21, 2104–2105. [Google Scholar] [CrossRef] [Green Version]
  51. Qin, C.J.; Wen, Z.Y.; Wang, J.; He, Y.; Yuan, D.Y.; Li, R. Uncoupling protein 1 in snakehead (Channa argus): Cloning, tissue distribution, and its expression in response to fasting and refeeding. Comp. Biochem. Physiol. A Mol. Integr. Physiol. 2018, 225, 1–6. [Google Scholar] [CrossRef]
  52. Chen, C.; Okayama, H. High-efficiency transformation of mammalian cells by plasmid DNA. Mol. Cell Biol. 1987, 7, 2745–2752. [Google Scholar] [CrossRef]
  53. Wang, S.X.; Fan, Z.C.; Tao, Y.X. Functions of acidic transmembrane residues in human melanocortin-3 receptor binding and activation. Biochem. Pharmacol. 2008, 76, 520–530. [Google Scholar] [CrossRef] [Green Version]
  54. Hughes, L.C.; Orti, G.; Huang, Y.; Sun, Y.; Baldwin, C.C.; Thompson, A.W.; Arcila, D.; Betancur, R.R.; Li, C.; Becker, L.; et al. Comprehensive phylogeny of ray-finned fishes (Actinopterygii) based on transcriptomic and genomic data. Proc. Natl. Acad. Sci. USA 2018, 115, 6249–6254. [Google Scholar] [CrossRef] [Green Version]
  55. Wan, Y.; Zhang, Y.; Ji, P.; Li, Y.; Xu, P.; Sun, X. Molecular characterization of CART, AgRP, and MC4R genes and their expression with fasting and re-feeding in common carp (Cyprinus carpio). Mol. Biol. Rep. 2012, 39, 2215–2223. [Google Scholar] [CrossRef]
  56. Lampert, K.P.; Schmidt, C.; Fischer, P.; Volff, J.N.; Hoffmann, C.; Muck, J.; Lohse, M.J.; Ryan, M.J.; Schartl, M. Determination of onset of sexual maturation and mating behavior by melanocortin receptor 4 polymorphisms. Curr. Biol. 2010, 20, 1729–1734. [Google Scholar] [CrossRef]
  57. Jangprai, A.; Boonanuntanasarn, S.; Yoshizaki, G. Characterization of melanocortin 4 receptor in Snakeskin Gourami and its expression in relation to daily feed intake and short-term fasting. Gen. Comp. Endocrinol. 2011, 173, 27–37. [Google Scholar] [CrossRef]
  58. Zhang, J.; Li, X.; Zhou, Y.; Cui, L.; Li, J.; Wu, C.; Wan, Y.; Li, J.; Wang, Y. The interaction of MC3R and MC4R with MRAP2, ACTH, α-MSH and AgRP in chickens. J. Endocrinol. 2017, 234, 155–174. [Google Scholar] [CrossRef] [PubMed]
  59. Zhang, K.Q.; Hou, Z.S.; Wen, H.S.; Li, Y.; Qi, X.; Li, W.J.; Tao, Y.X. Melanocortin-4 receptor in spotted sea bass, Lateolabrax maculatus: Cloning, tissue distribution, physiology, and pharmacology. Front. Endocrinol. 2019, 10, 705. [Google Scholar] [CrossRef] [PubMed] [Green Version]
  60. Tao, Y.X. Functional characterization of novel melanocortin-3 receptor mutations identified from obese subjects. Biochim. Biophys. Acta 2007, 1772, 1167–1174. [Google Scholar] [CrossRef] [Green Version]
  61. Srinivasan, S.; Lubrano-Berthelier, C.; Govaerts, C.; Picard, F.; Santiago, P.; Conklin, B.R.; Vaisse, C. Constitutive activity of the melanocortin-4 receptor is maintained by its N-terminal domain and plays a role in energy homeostasis in humans. J. Clin. Investig. 2004, 114, 1158–1164. [Google Scholar] [CrossRef] [PubMed] [Green Version]
  62. Tao, Y.X. Constitutive activation of G protein-coupled receptors and diseases: Insights into mechanism of activation and therapeutics. Pharmacol. Ther. 2008, 120, 129–148. [Google Scholar] [CrossRef] [Green Version]
  63. Sebag, J.A.; Hinkle, P.M. Regions of melanocortin 2 (MC2) receptor accessory protein necessary for dual topology and MC2 receptor trafficking and signaling. J. Biol. Chem. 2009, 284, 610–618. [Google Scholar] [CrossRef] [Green Version]
  64. Soletto, L.; Hernandez-Balfago, S.; Rocha, A.; Scheerer, P.; Kleinau, G.; Cerdá-Reverter, J.M. Melanocortin receptor accessory protein 2-induced adrenocorticotropic hormone response of human melanocortin 4 receptor. J. Endocr. Soc. 2019, 3, 314–323. [Google Scholar] [CrossRef] [Green Version]
  65. Jiang, D.N.; Li, J.T.; Tao, Y.X.; Chen, H.P.; Deng, S.P.; Zhu, C.H.; Li, G.L. Effects of melanocortin-4 receptor agonists and antagonists on expression of genes related to reproduction in spotted scat, Scatophagus argus. J. Comp. Physiol. B 2017, 187, 603–612. [Google Scholar] [CrossRef]
  66. Zhang, Y.; Wen, H.S.; Li, Y.; Lyu, L.K.; Zhang, Z.X.; Wang, X.J.; Li, J.S.; Tao, Y.X.; Qi, X. Melanocortin-4 receptor regulation of reproductive function in black rockfish (Sebastes schlegelii). Gene 2020, 741, 144541. [Google Scholar] [CrossRef]
Figure 1. Nucleotide and deduced protein sequences of snakehead MC4R (A) and MRAP2 (B). Positions of nucleotide and amino acid sequences were indicated on both sides. Open boxes denoted the consensus sequence for N-linked glycosylation sites. Amino acids in shaded boxes indicated putative transmembrane domains. Underlines showed PMY, DRY, and DPxxY motifs in MC4R. Asterisk (*) indicated stop codon.
Biomolecules 11 00481 g001
Figure 2. Comparative gene synteny of MC4R (A) and MRAP2 (B) among representative vertebrate genomes. The colored boxes represent genes and solid lines stand for intergenic regions. The genes showing conserved synteny were indicated with same color. Taxon names of selected species were shown on the left side of the figure.
Biomolecules 11 00481 g002
Figure 3. Phylogenetic trees of vertebrate MC4R (A) and MRAP2 (B). Both trees were constructed with MEGA 6.0 software based on protein datasets. The values at the nodes represented bootstrap percentages from 1000 replicates. The caMC4R and caMRAP2 were marked with a black diamond. The IDs of protein sequences used in present study were shown in Tables S2 and S3.
Biomolecules 11 00481 g003
Figure 4. Tissue distribution patterns of snakehead mc4r (A) and mrap2 (B). Eleven tissues were studied in the present study. Results were expressed as relative expression levels and standardized by tubα1-b gene. Error bars represented standard error of the mean (SEM) (n = 6).
Biomolecules 11 00481 g004
Figure 5. Effects of short-term (24 h) fasting on the expressions of cerebral mc4r (A) and mrap2 (B) in snakehead. Data were represented as mean ± SEM (n = 6). Significant differences (p < 0.05) between groups were detected using a one-way ANOVA. Groups that differ significantly were indicated by different letters above bars.
Biomolecules 11 00481 g005
Figure 6. Effects of long-term (2 weeks) fasting and refeeding on expressions of brain mc4r (A) and mrap2 (B) in snakehead. Data were presented as mean ± SEM (n = 6). Significant difference (p < 0.05) between groups was determined using one-way ANOVA. Groups that differ significantly were indicated by different letters above bars.
Biomolecules 11 00481 g006
Figure 7. Ligand binding properties of caMC4R. HEK293T cells were transiently transfected with MC4R plasmids, and the binding properties were measured 48 h later by displacing the binding of 125I-NDP-MSH using different concentrations of unlabeled NDP-MSH (A), ACTH (1–24) (B), α-MSH (C), or β-MSH (D) as described in Materials and Methods. Data were expressed as % of hMC4R binding ± range in the absence of competitor from duplicate measurements within one experiment. All experiments were performed at least three times independently.
Biomolecules 11 00481 g007
Figure 8. Signaling properties of caMC4R. HEK293T cells were transiently transfected with MC4R plasmids, and the intracellular cAMP levels were measured 48 h later via radioimmunoassay. Different concentrations of NDP-MSH (A), ACTH (1–24) (B), α-MSH (C), or β-MSH (D) were used to stimulate HEK293T cell. Data were expressed as mean ± SEM from triplicate measurements within one experiment. The curves were representative of at least three independent experiments.
Biomolecules 11 00481 g008
Figure 9. Constitutive activities of caMC4R in cAMP signaling pathway. HEK293T cells were transiently transfected with 0.25 µg/µL hMC4R or caMC4R to compare their basal cAMP activity (A) or transfected with increasing concentrations of caMC4R (B). Data were expressed as mean ± SEM (n ≥ 3). Asterisk (*) showed significant difference (p < 0.05) of basal cAMP level compared with respective control group (Student’s t-test in A and one-way ANOVA followed by Tukey-test in B).
Biomolecules 11 00481 g009
Figure 10. Modulation of caMC4R expression and binding properties by caMRAP2. HEK293T cells were co-transfected with caMC4R/caMRAP2 in four different ratios (1:0, 1:1, 1:3, and 1:5). Cell surface (A) and total (B) expression levels of caMC4R were measured by flow cytometry. Ligand binding experiments (C,D) were performed as in Figure 7. The results, calculated as percentage of 1:0 group, were expressed as the mean ± SEM of at least three independent experiments.
Biomolecules 11 00481 g010
Figure 11. Effects of caMRAP2 on signaling properties of caMC4R. HEK293T cells were co-transfected with caMC4R/caMRAP2 in four different ratios (1:0, 1:1, 1:3, and 1:5), and cAMP levels under basal (A) or stimulated with 10−5 M α-MSH or 10−6 M ACTH (1–24) (B,C) were measured. The results were calculated as a percentage of 1:0 group. Results were expressed as mean ± SEM (n ≥ 3). Different letters indicate significant difference (one-way ANOVA followed by Tukey-test). (D,E) The curves represented at least three independent experiments in which different concentrations of α-MSH or ACTH (1–24) were used to stimulate cells co-transfected with caMC4R and caMRAP2 at the ratios of 1:0 and 1:5.
Biomolecules 11 00481 g011
Table 1. The binding properties of caMC4R.
MC4RBmax (%)NDP-MSHACTH (1–24)α-MSHβ-MSH
IC50 (nM)IC50 (nM)IC50 (nM)IC50 (nM)
hMC4R10027.72 ± 4.29324.6 ± 88.97488.2 ± 2.55749.4 ± 93.98
caMC4R16.32 ± 2.46 c4.50 ± 1.07 a415.1 ± 163.7981.0 ± 45.52 b328.7 ± 119.6
Results were expressed as the mean ± SEM of at least three independent experiments. a Significantly different from the parameter of hMC4R, p < 0.05. b Significantly different from the parameter of hMC4R, p < 0.01. c Significantly different from the parameter of hMC4R, p < 0.0001.
Table 2. The signaling properties of caMC4R.
MC4R hMC4RcaMC4R
Basal (%) 100739.2 ± 63.82 b
NDP-MSHEC50 (nM)0.59 ± 0.180.04 ± 0.02
Rmax (%)10075.18 ± 27.83
ACTH (1–24)EC50 (nM)2.68 ± 0.500.81 ± 0.18 a
Rmax (%)100119.0 ± 3.73 a
α-MSHEC50 (nM)2.82 ± 0.402.32 ± 0.57
Rmax (%)100198.1 ± 55.95
β-MSHEC50 (nM)6.67 ± 3.412.49 ± 0.81
Rmax (%)100163.9 ± 89.36
Results were expressed as the mean ± SEM of at least three independent experiments. a Significantly different from the parameter of hMC4R, p < 0.05. b Significantly different from the parameter of hMC4R, p < 0.01.
Table 3. The effect of caMRAP2 on ligand binding properties of caMC4R.
caMC4R/caMRAP2Bmax (%)α-MSHACTH (1–24)
IC50 (nM)IC50 (nM)
1:0100383.80 ± 68.82239.90 ± 23.61
1:1100.70 ± 6.24461.00 ± 65.51144.80 ± 74.73
1:3102.80 ± 9.56497.10 ± 147.449.48 ± 19.47 a
1:583.62 ± 7.17238.10 ± 60.7724.73 ± 11.73 a
Results were expressed as the mean ± SEM of at least three independent experiments. a Significantly different from the parameter of 1:0, p < 0.05.
Table 4. The effect of caMRAP2 on signaling properties of caMC4R.
caMC4R/caMRAP2α-MSHACTH (1–24)
EC50 (nM)Rmax (%)EC50 (nM)Rmax (%)
1:00.48 ± 0.121000.45 ± 0.20100
1:50.61 ± 0.1544.70 ± 7.96 c0.42 ± 0.1354.81 ± 5.19 c
Results are expressed as the mean ± SEM of at least three independent experiments. c Significantly different from the parameter of 1:0, p < 0.001.
Publisher’s Note: MDPI stays neutral with regard to jurisdictional claims in published maps and institutional affiliations.

