
Metabolic Changes of Cholangiocarcinoma Cells in Response to Coniferyl Alcohol Treatment

 ,
,  , and
, and 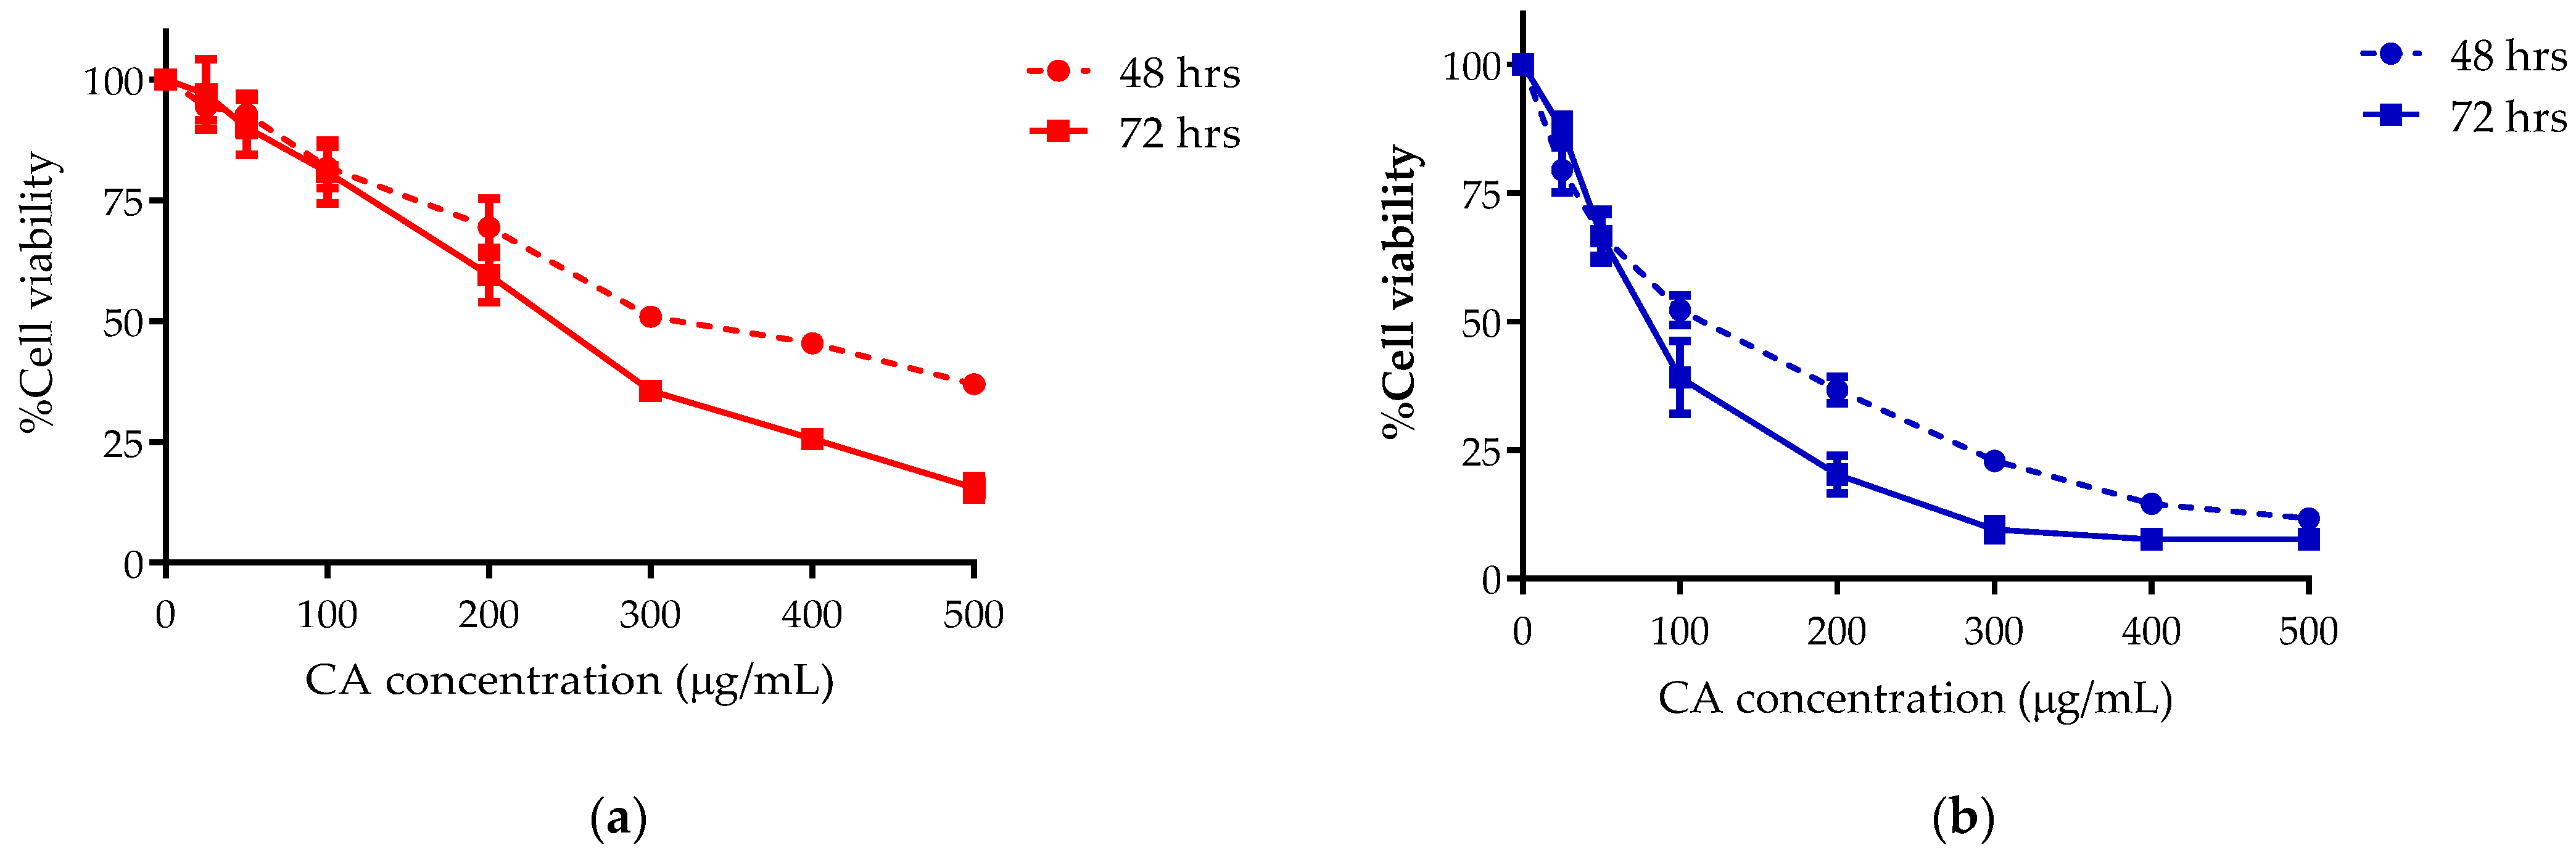
Abstract
:1. Introduction
2. Materials and Methods
2.1. Chemicals and Reagents
2.2. Cell Lines
2.3. Coniferyl Alcohol Synthesis
2.4. CCA cell Inhibition Test
2.5. The Assessment of Apoptosis Using Flow Cytometry
2.6. Western Blot Analysis
2.7. The Measurement of Intracellular Reactive Oxygen Species (ROS)
2.8. The Collection of Cells for Metabonomics Analysis
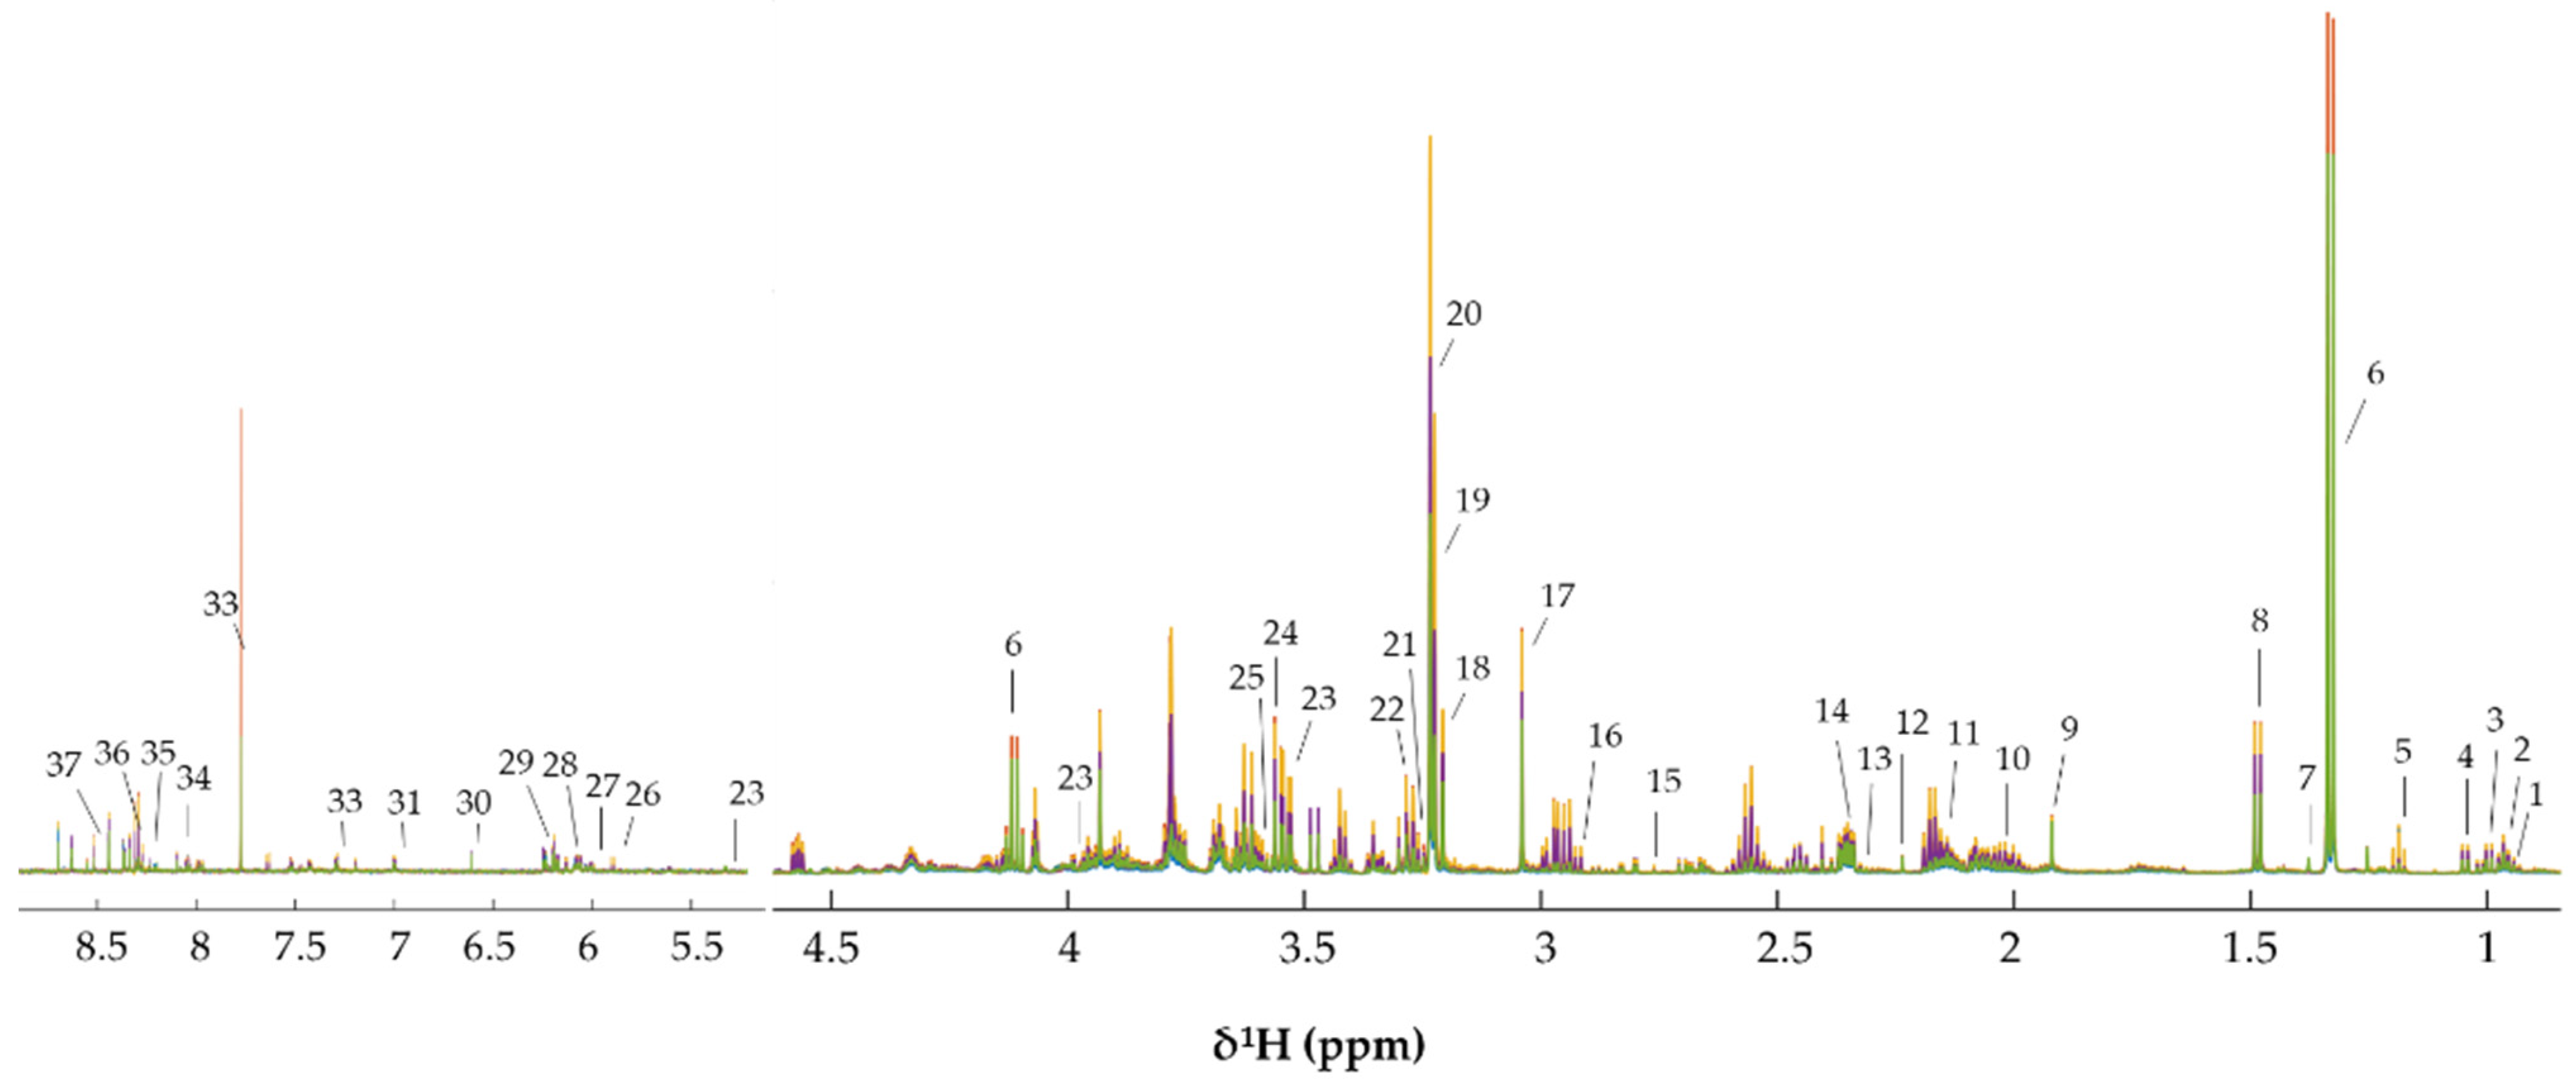
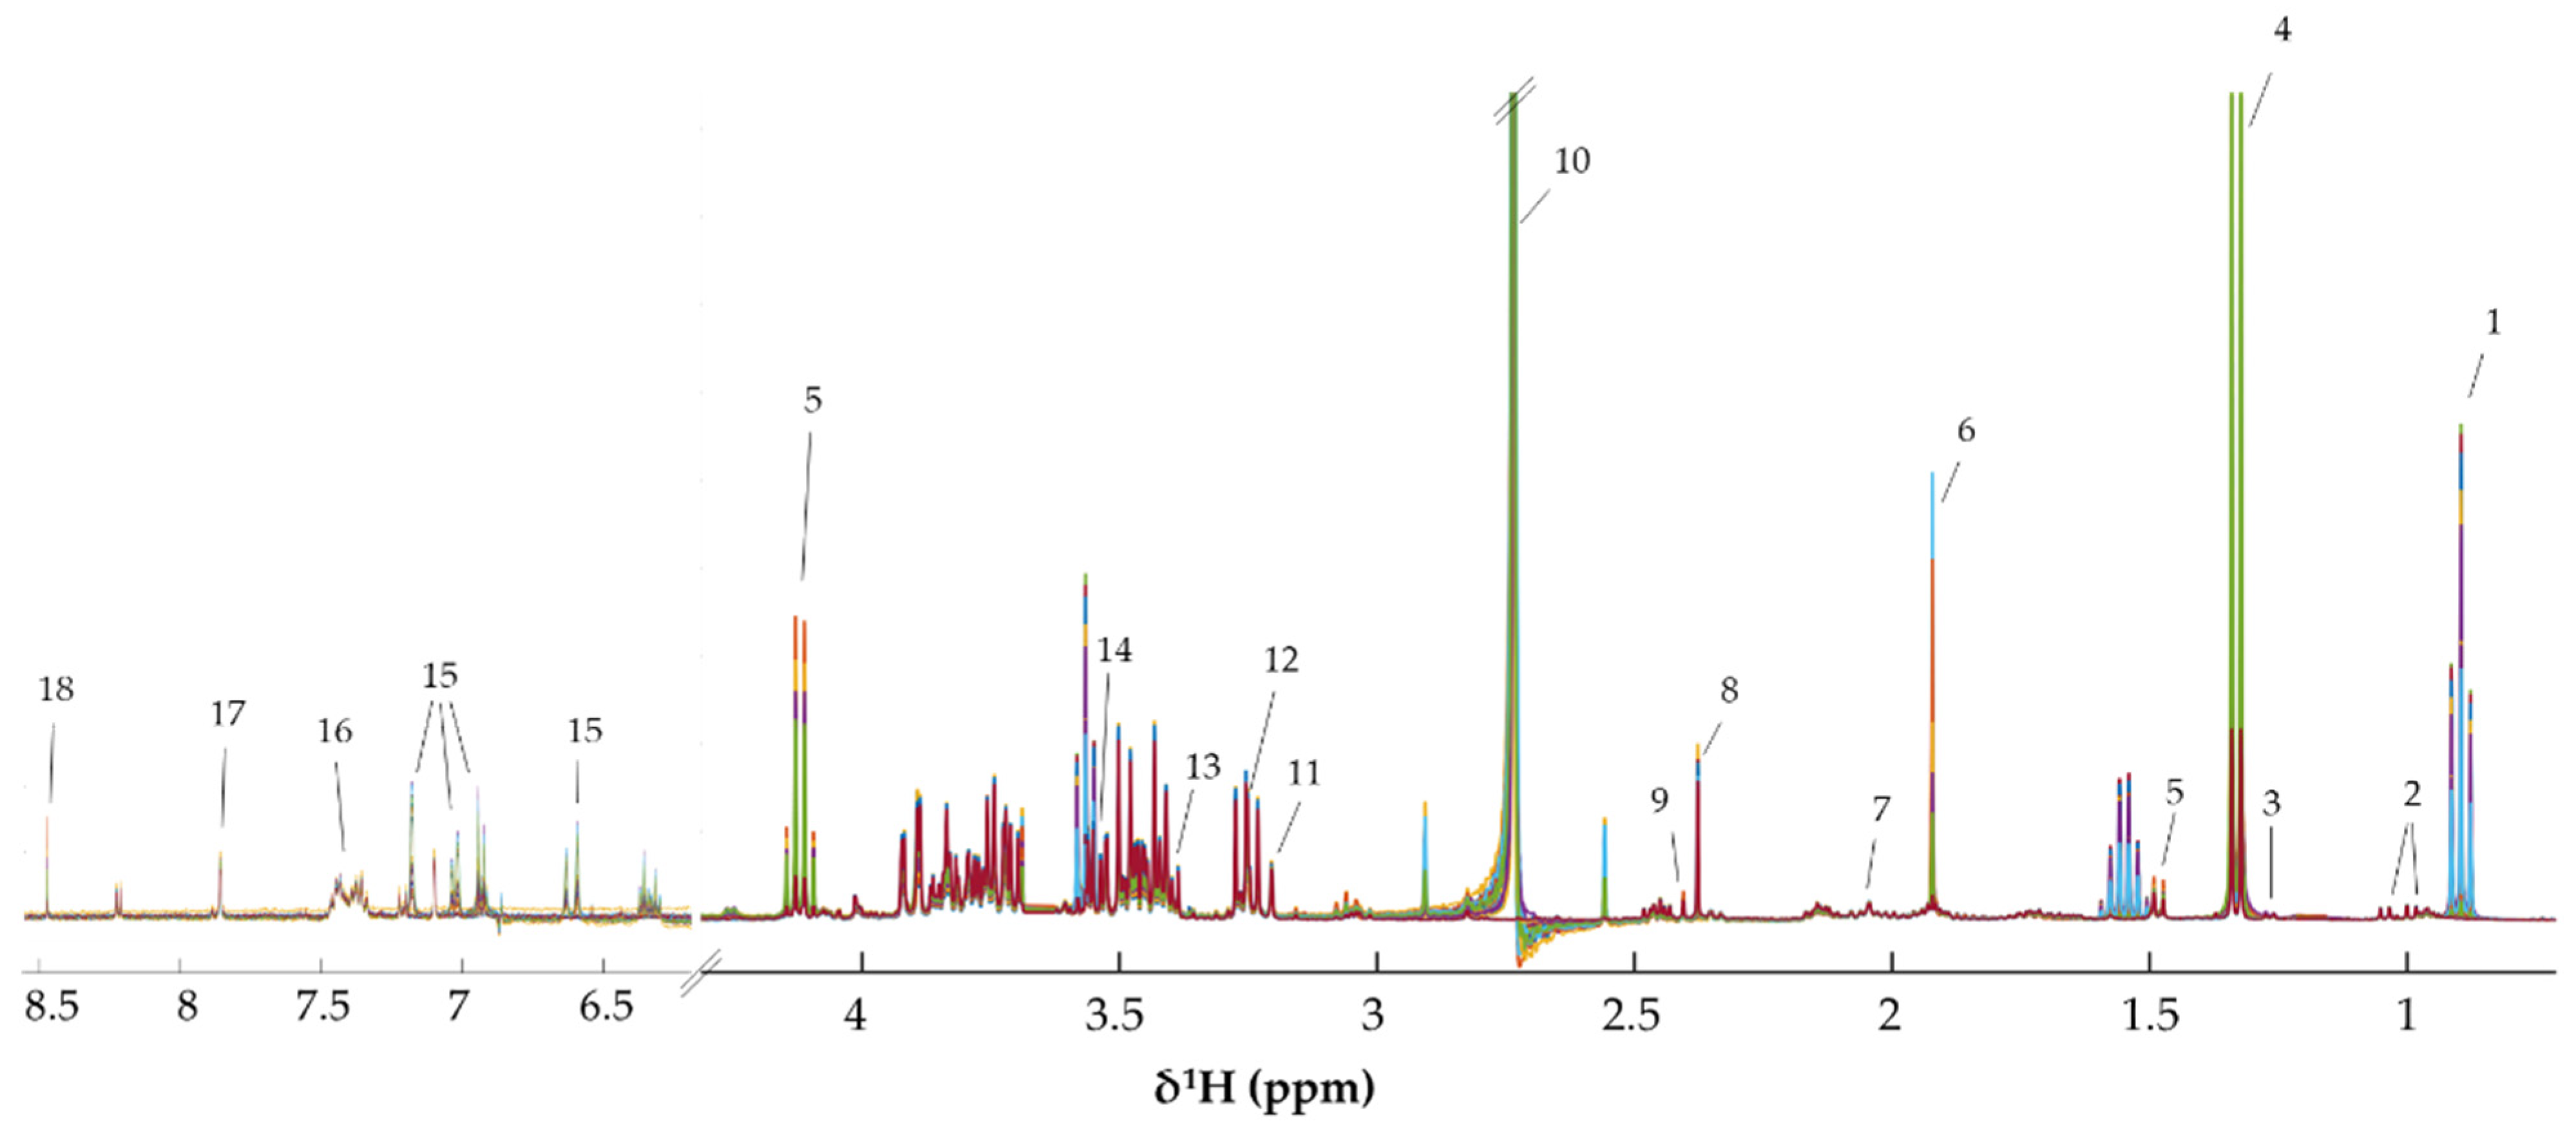
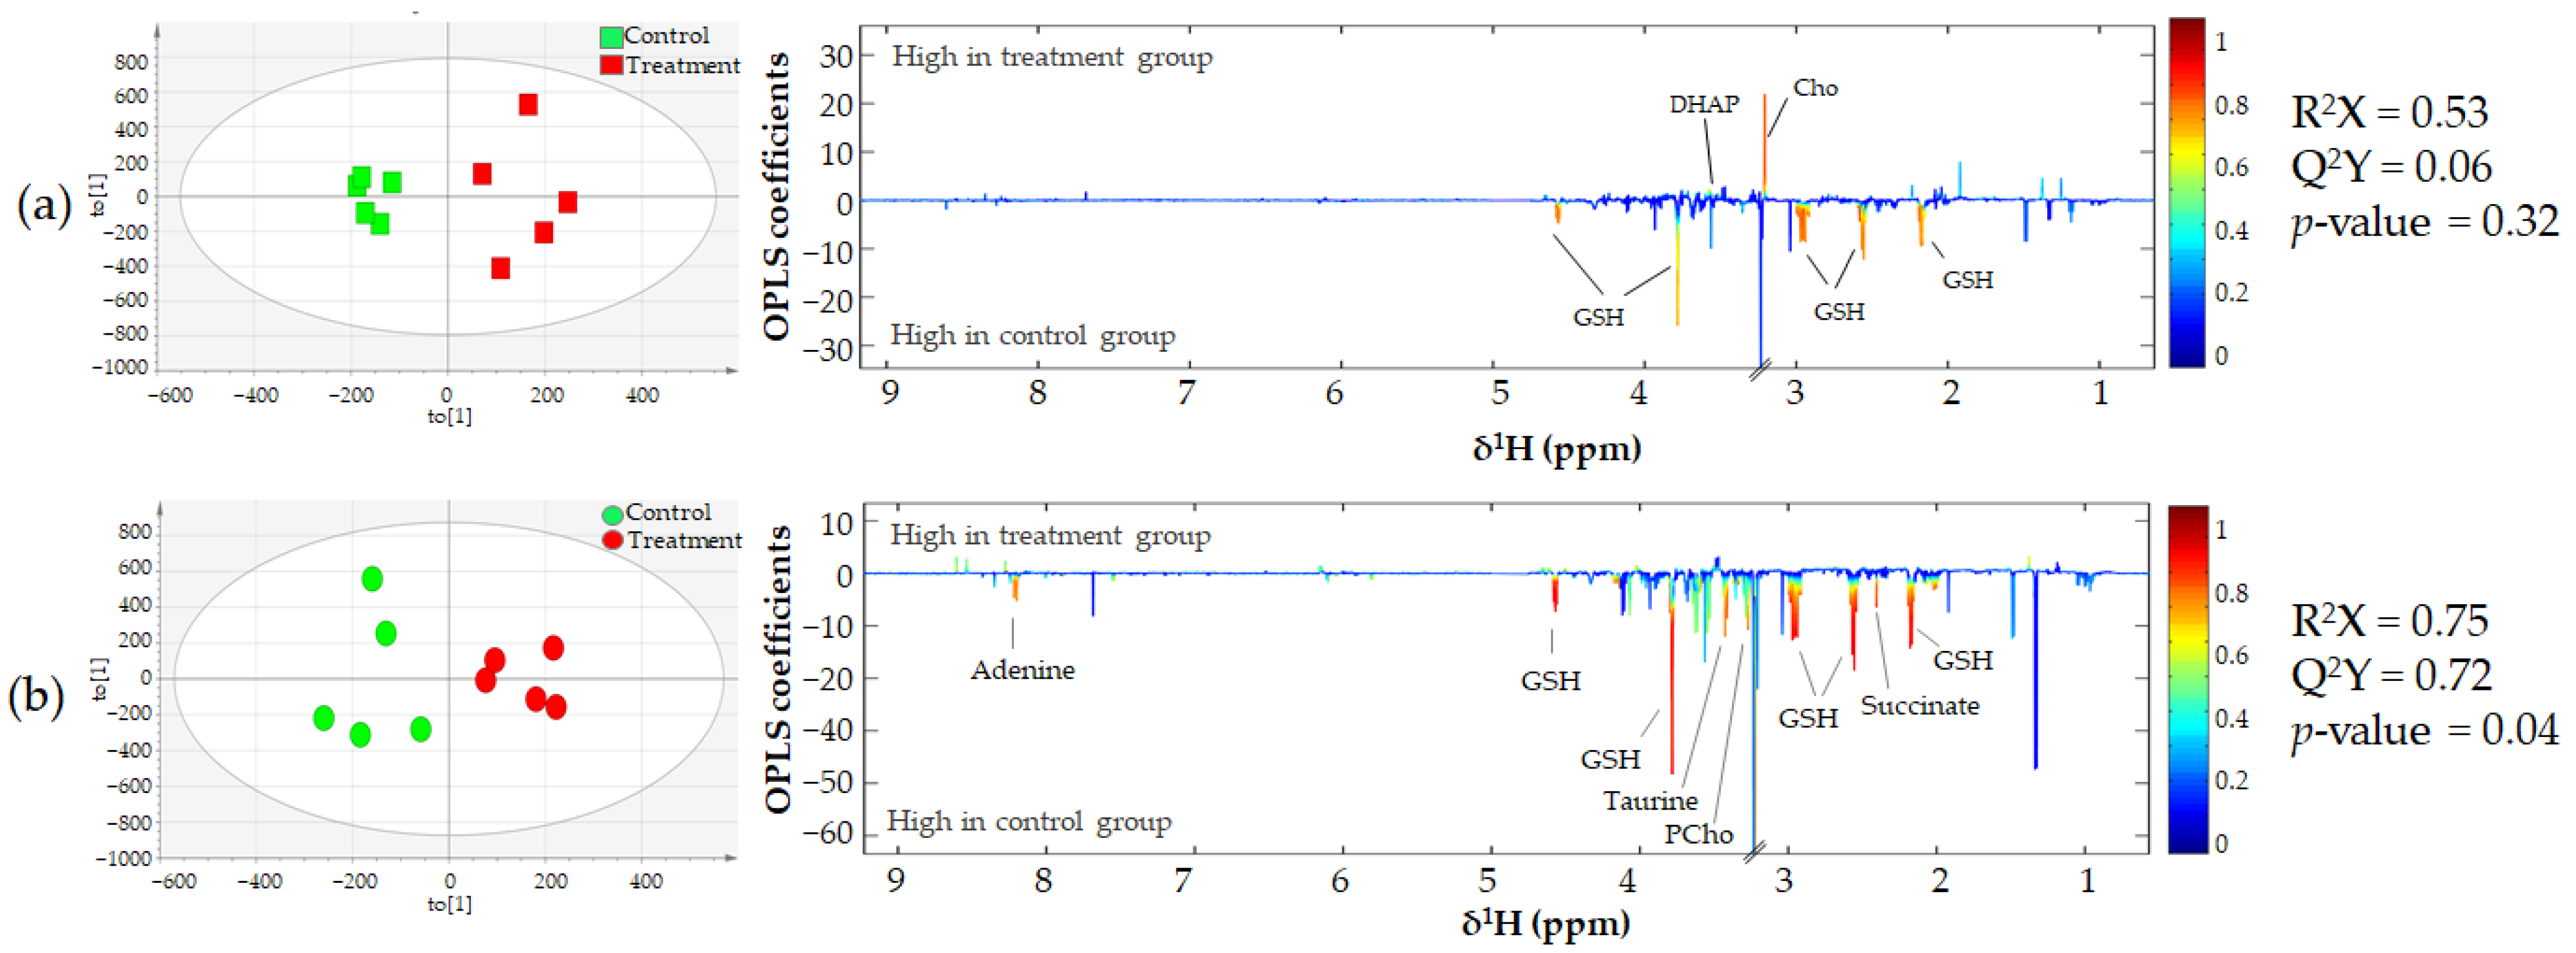
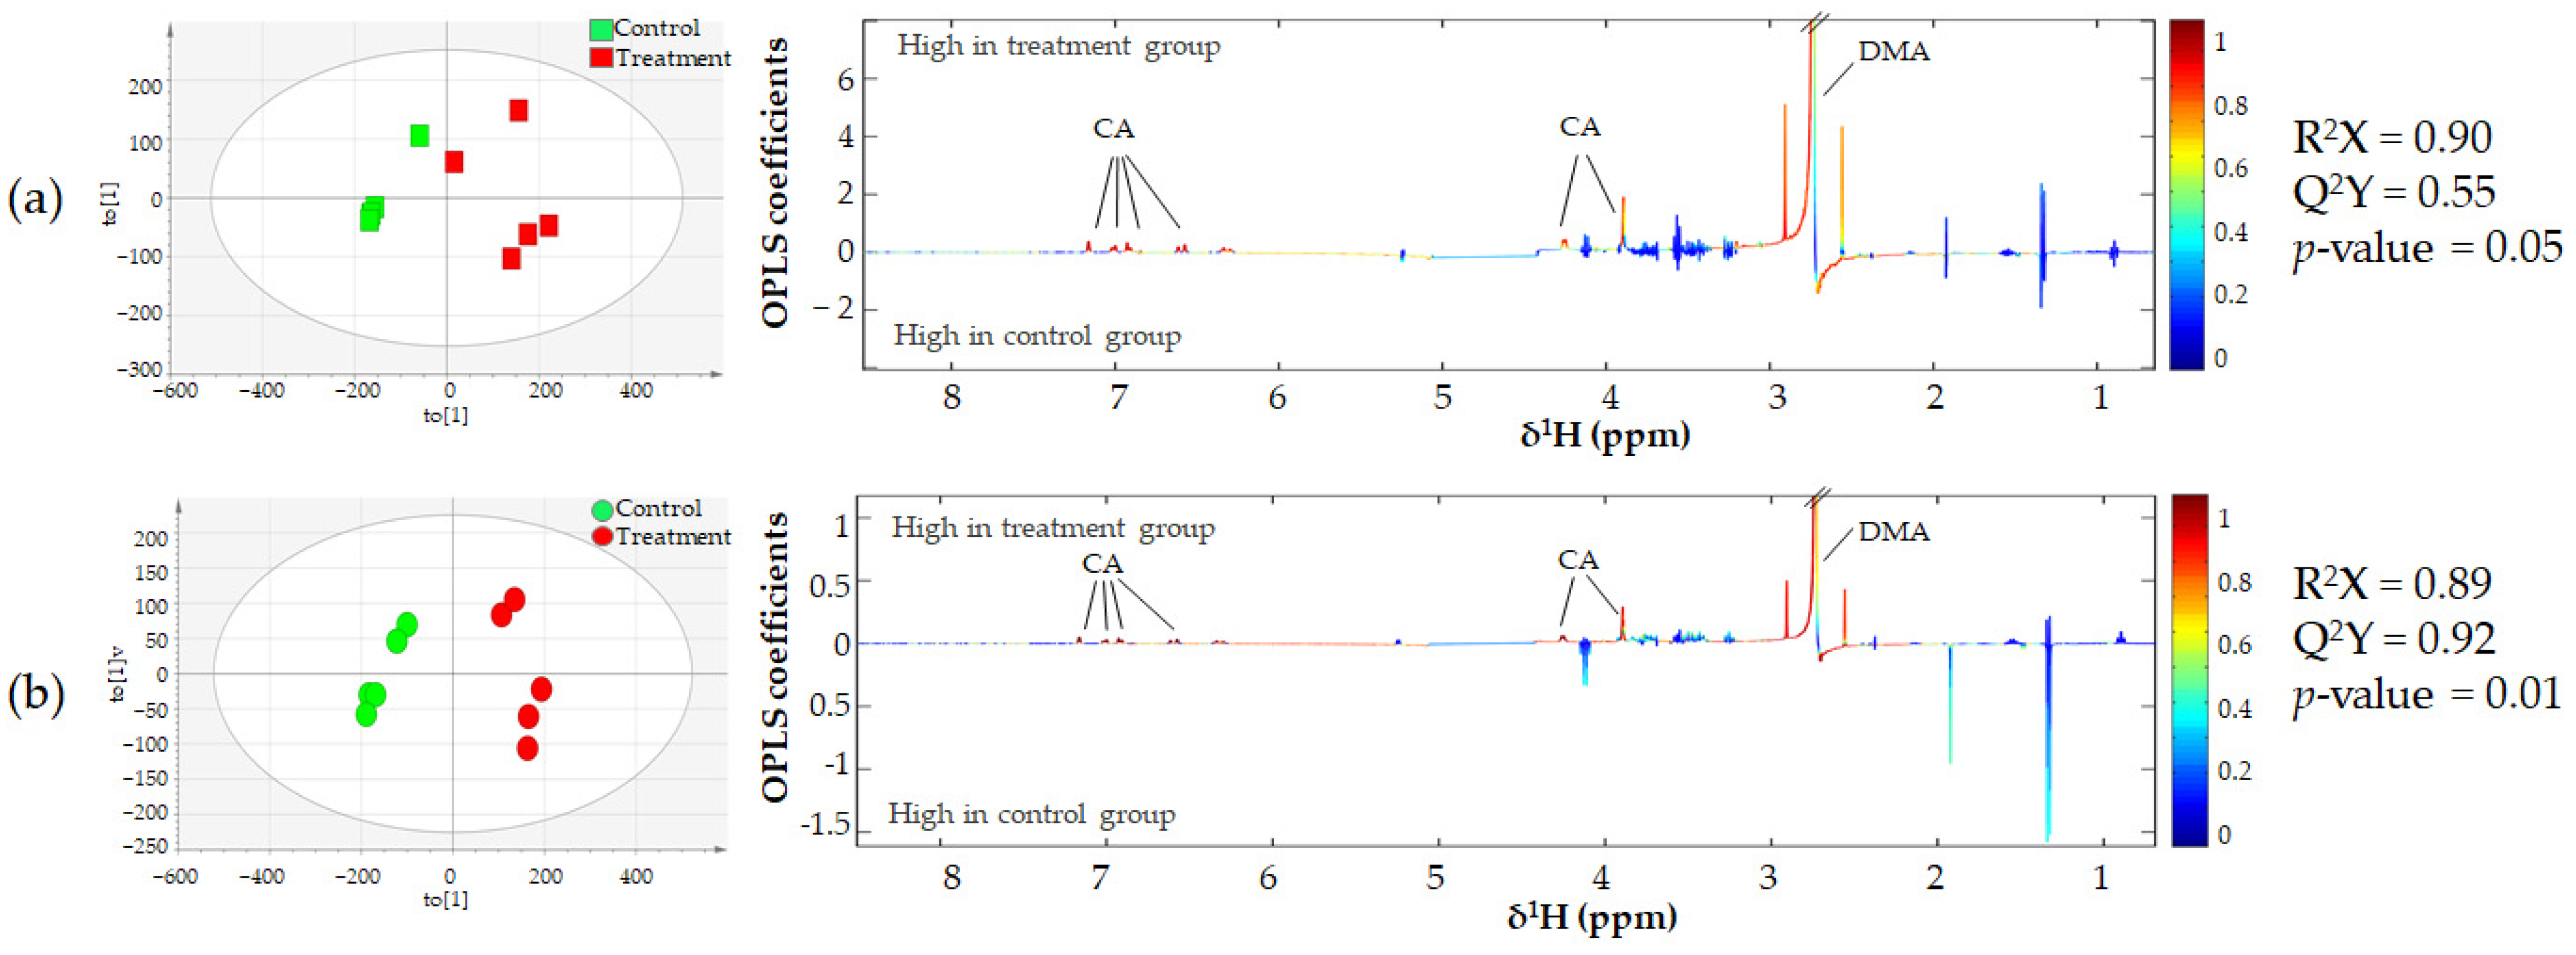
2.9. 1H-NMR Based Metabonomics Analysis
2.10. Statistical Analysis
3. Results
3.1. CA Inhibits CCA Cell Growth in a Dose Dependent Manner
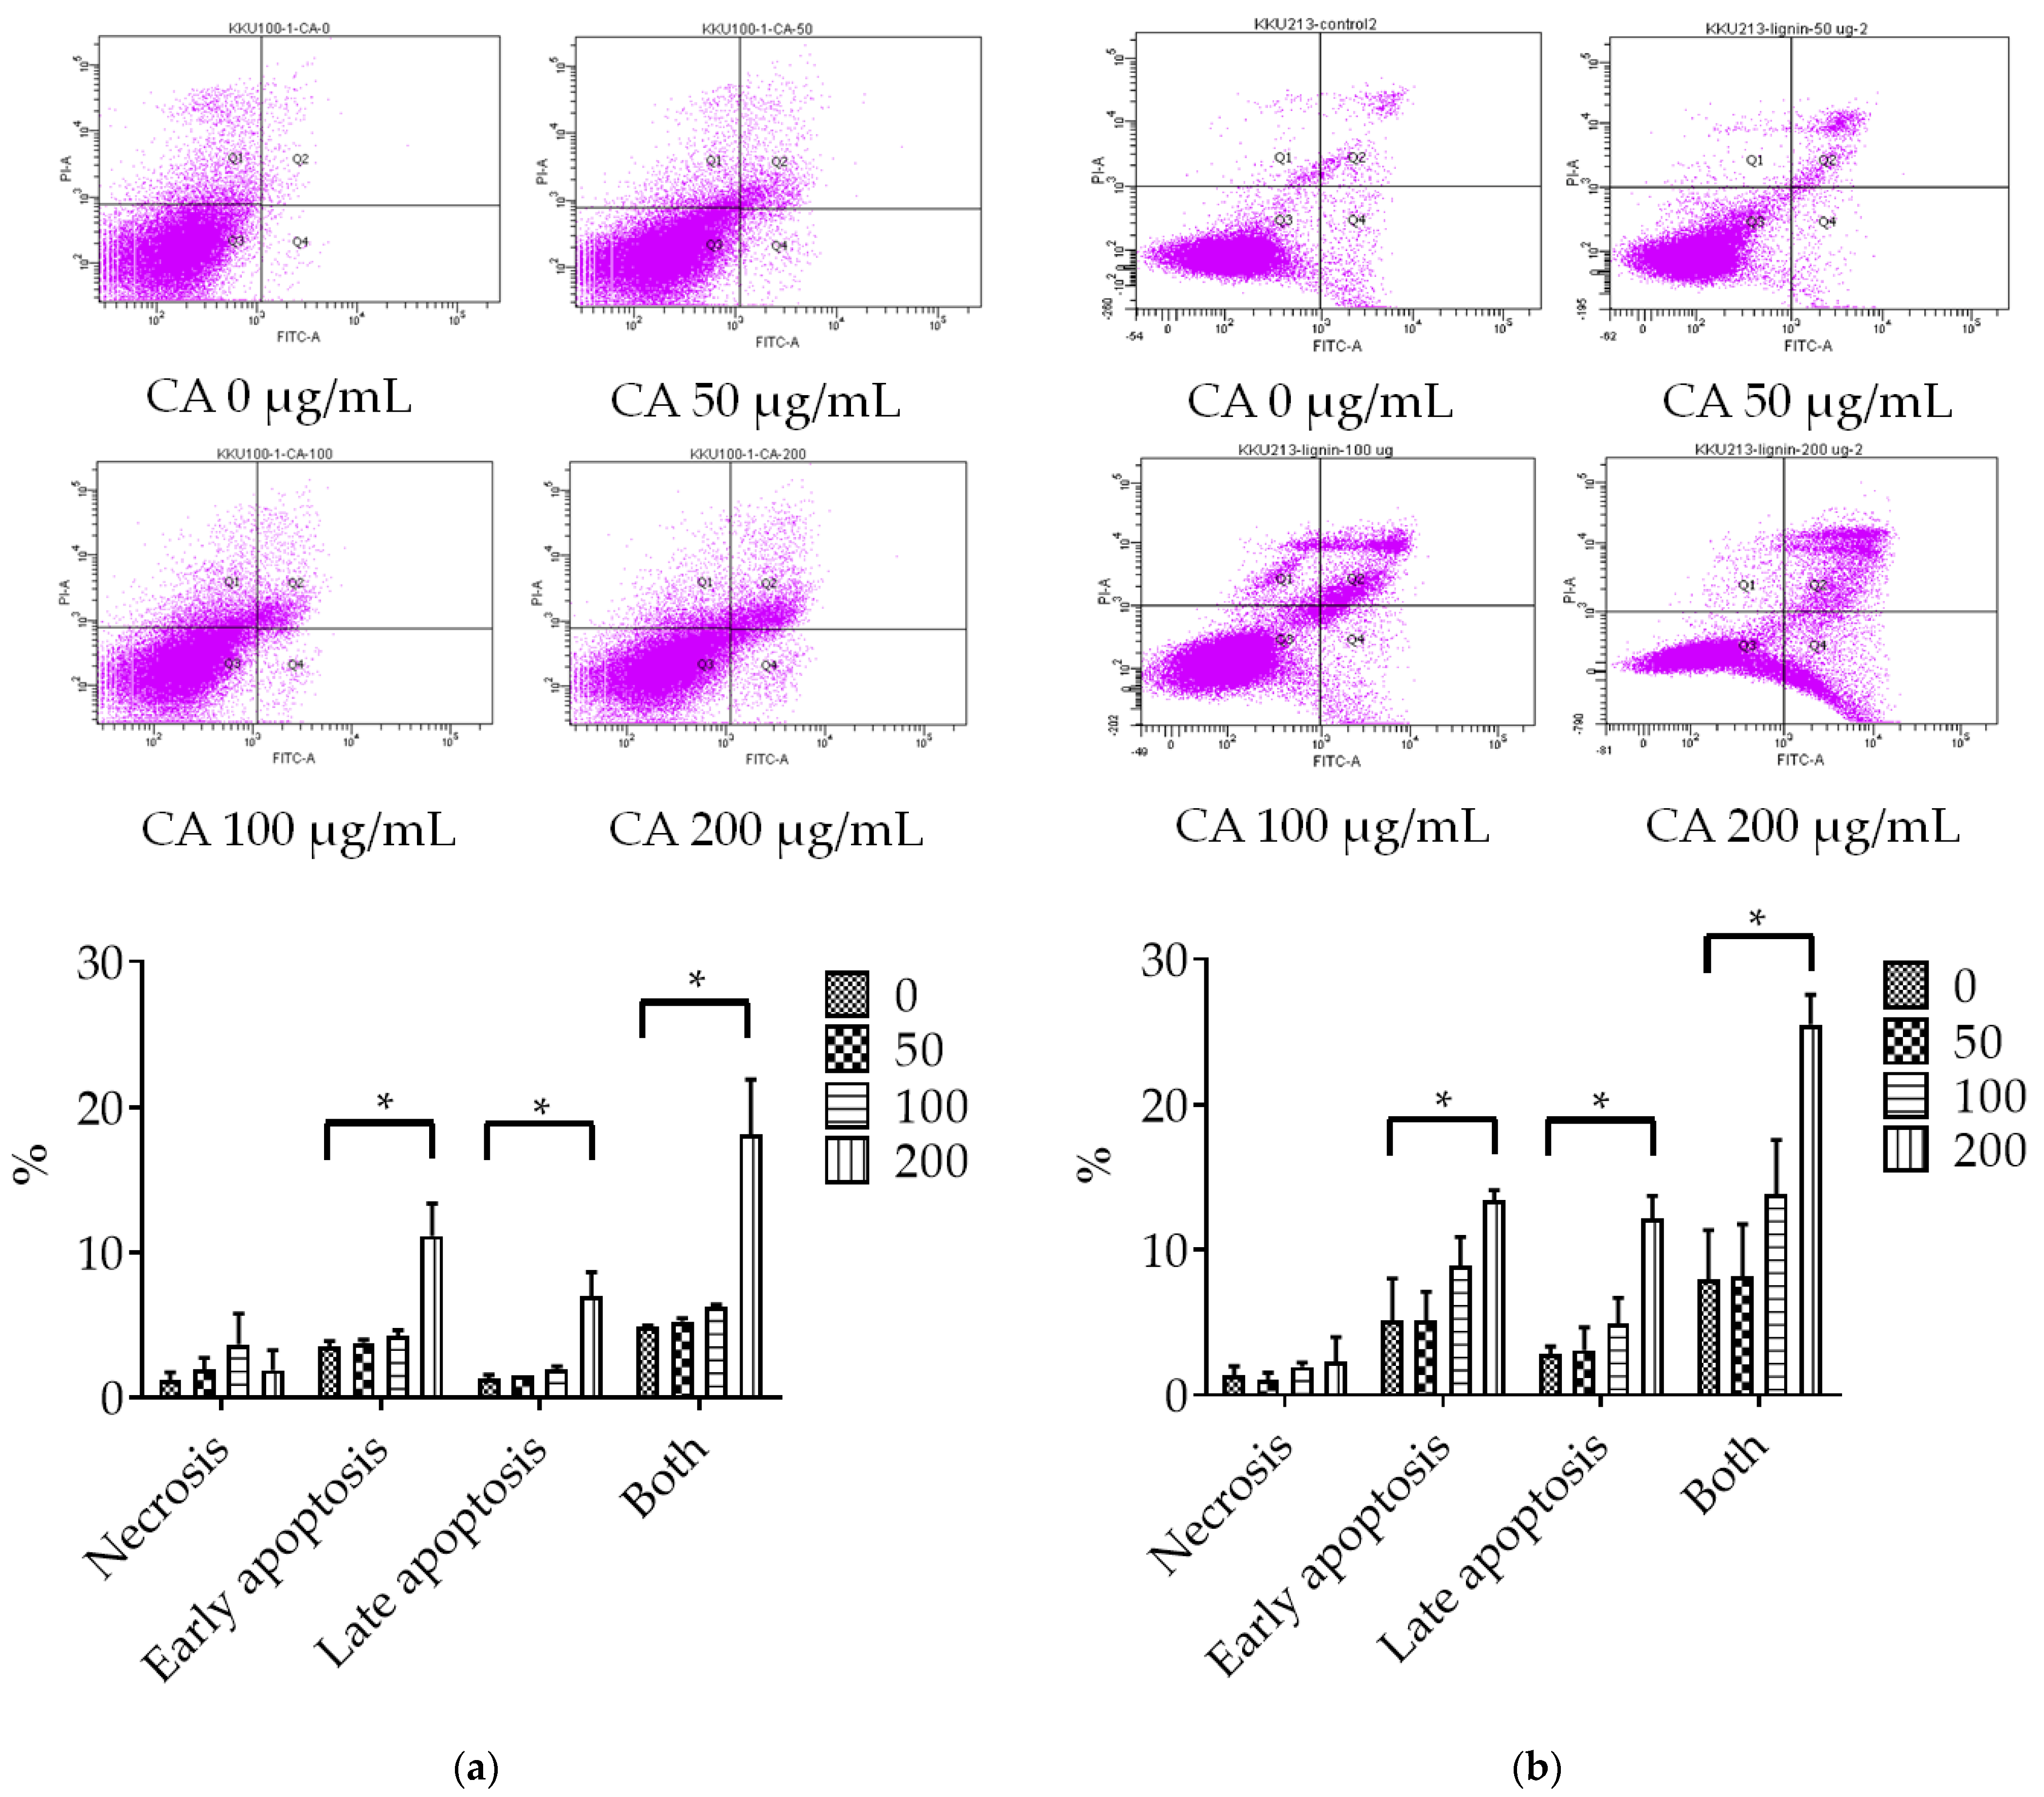
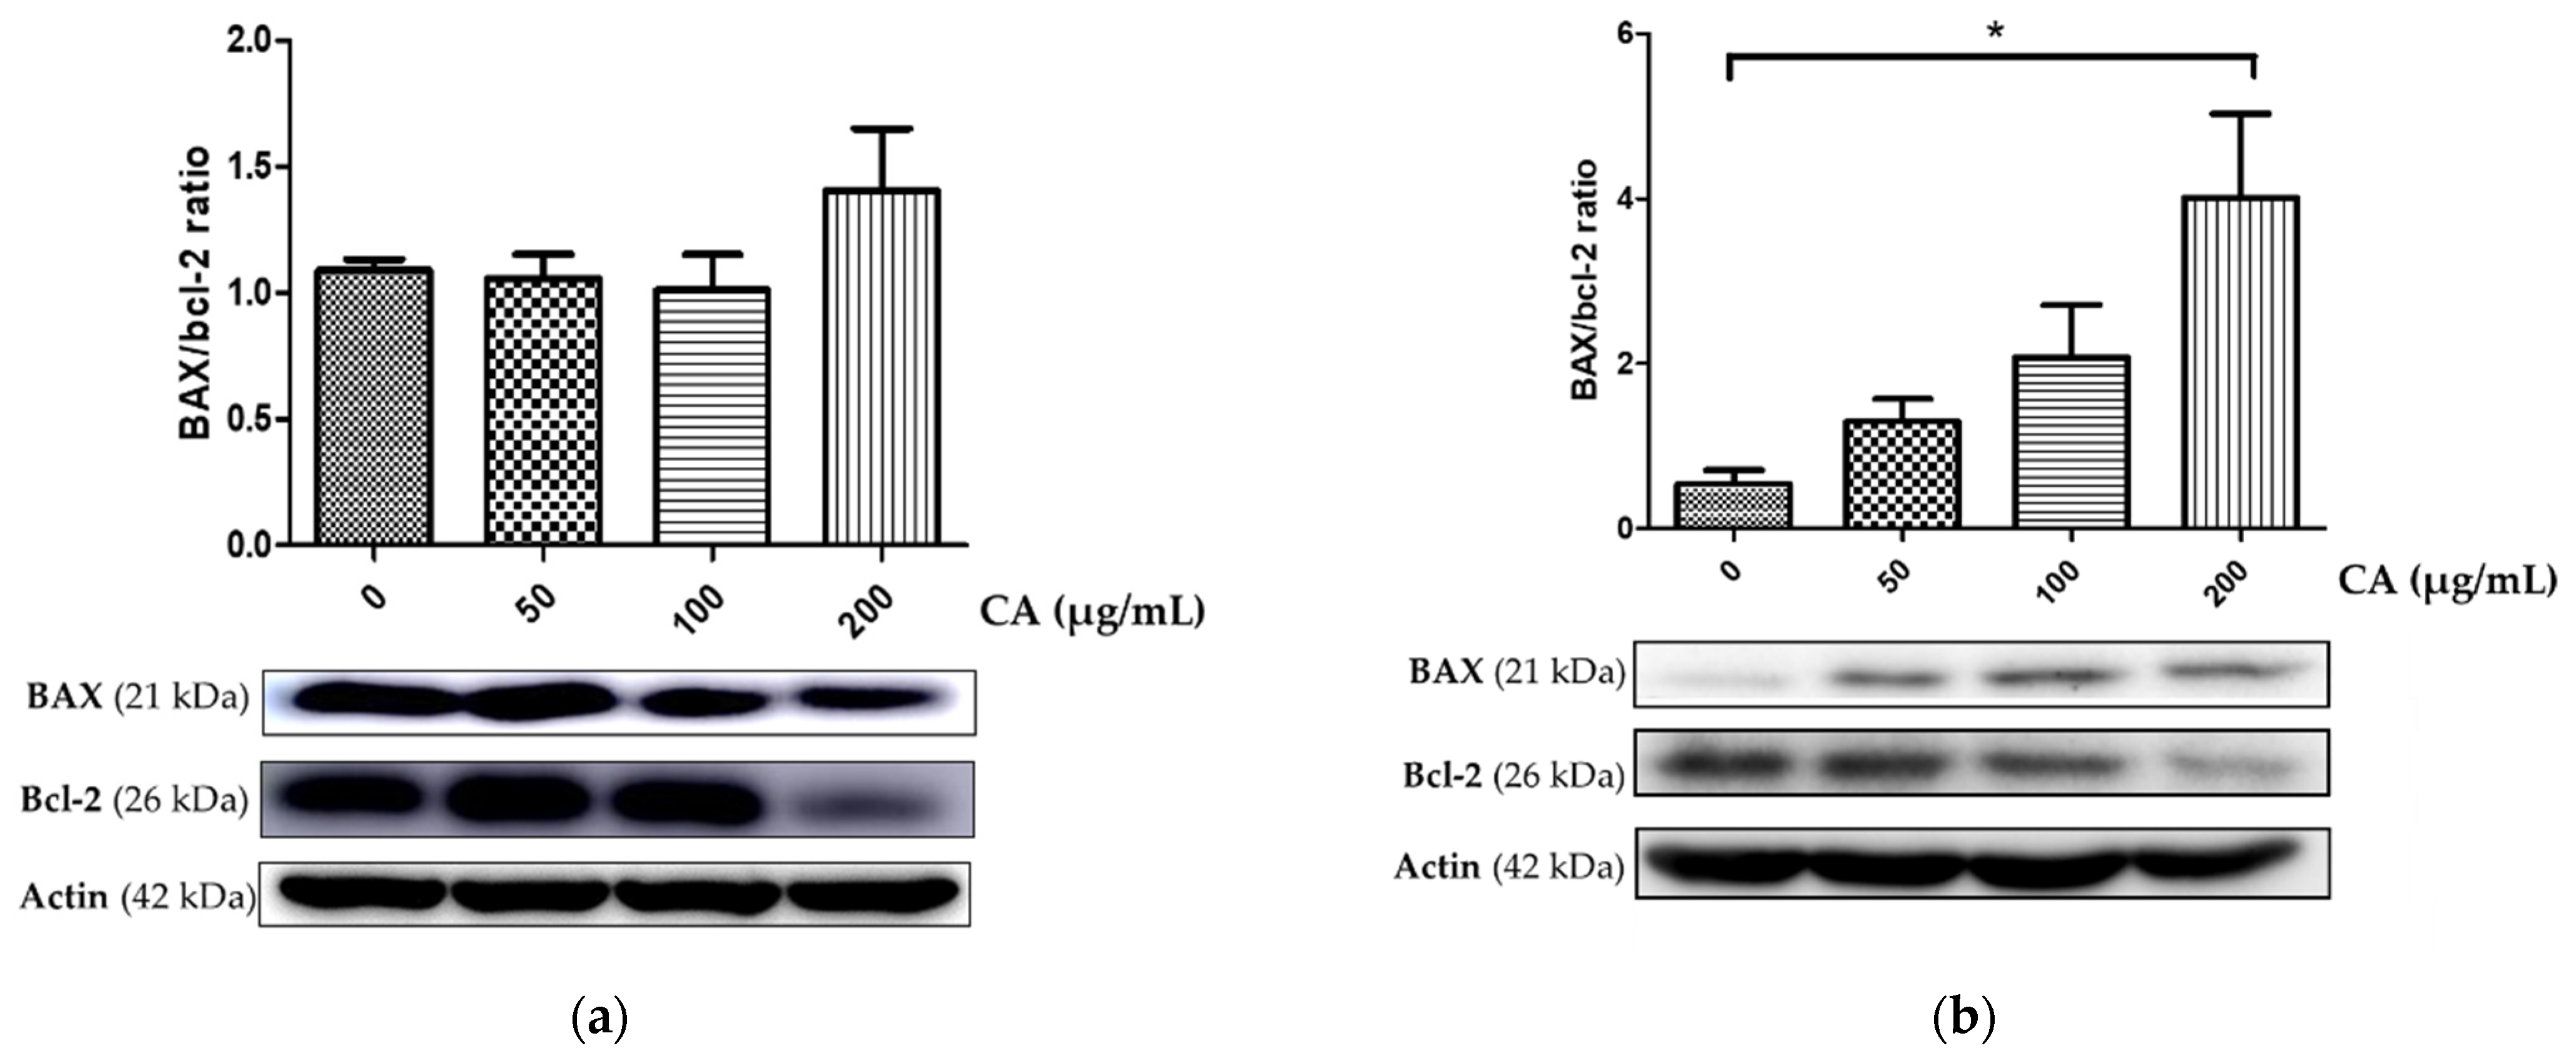
3.2. Assessment of CA-Induced Apoptosis Effects
3.3. Metabonomics of CCA Cells Treated with CA
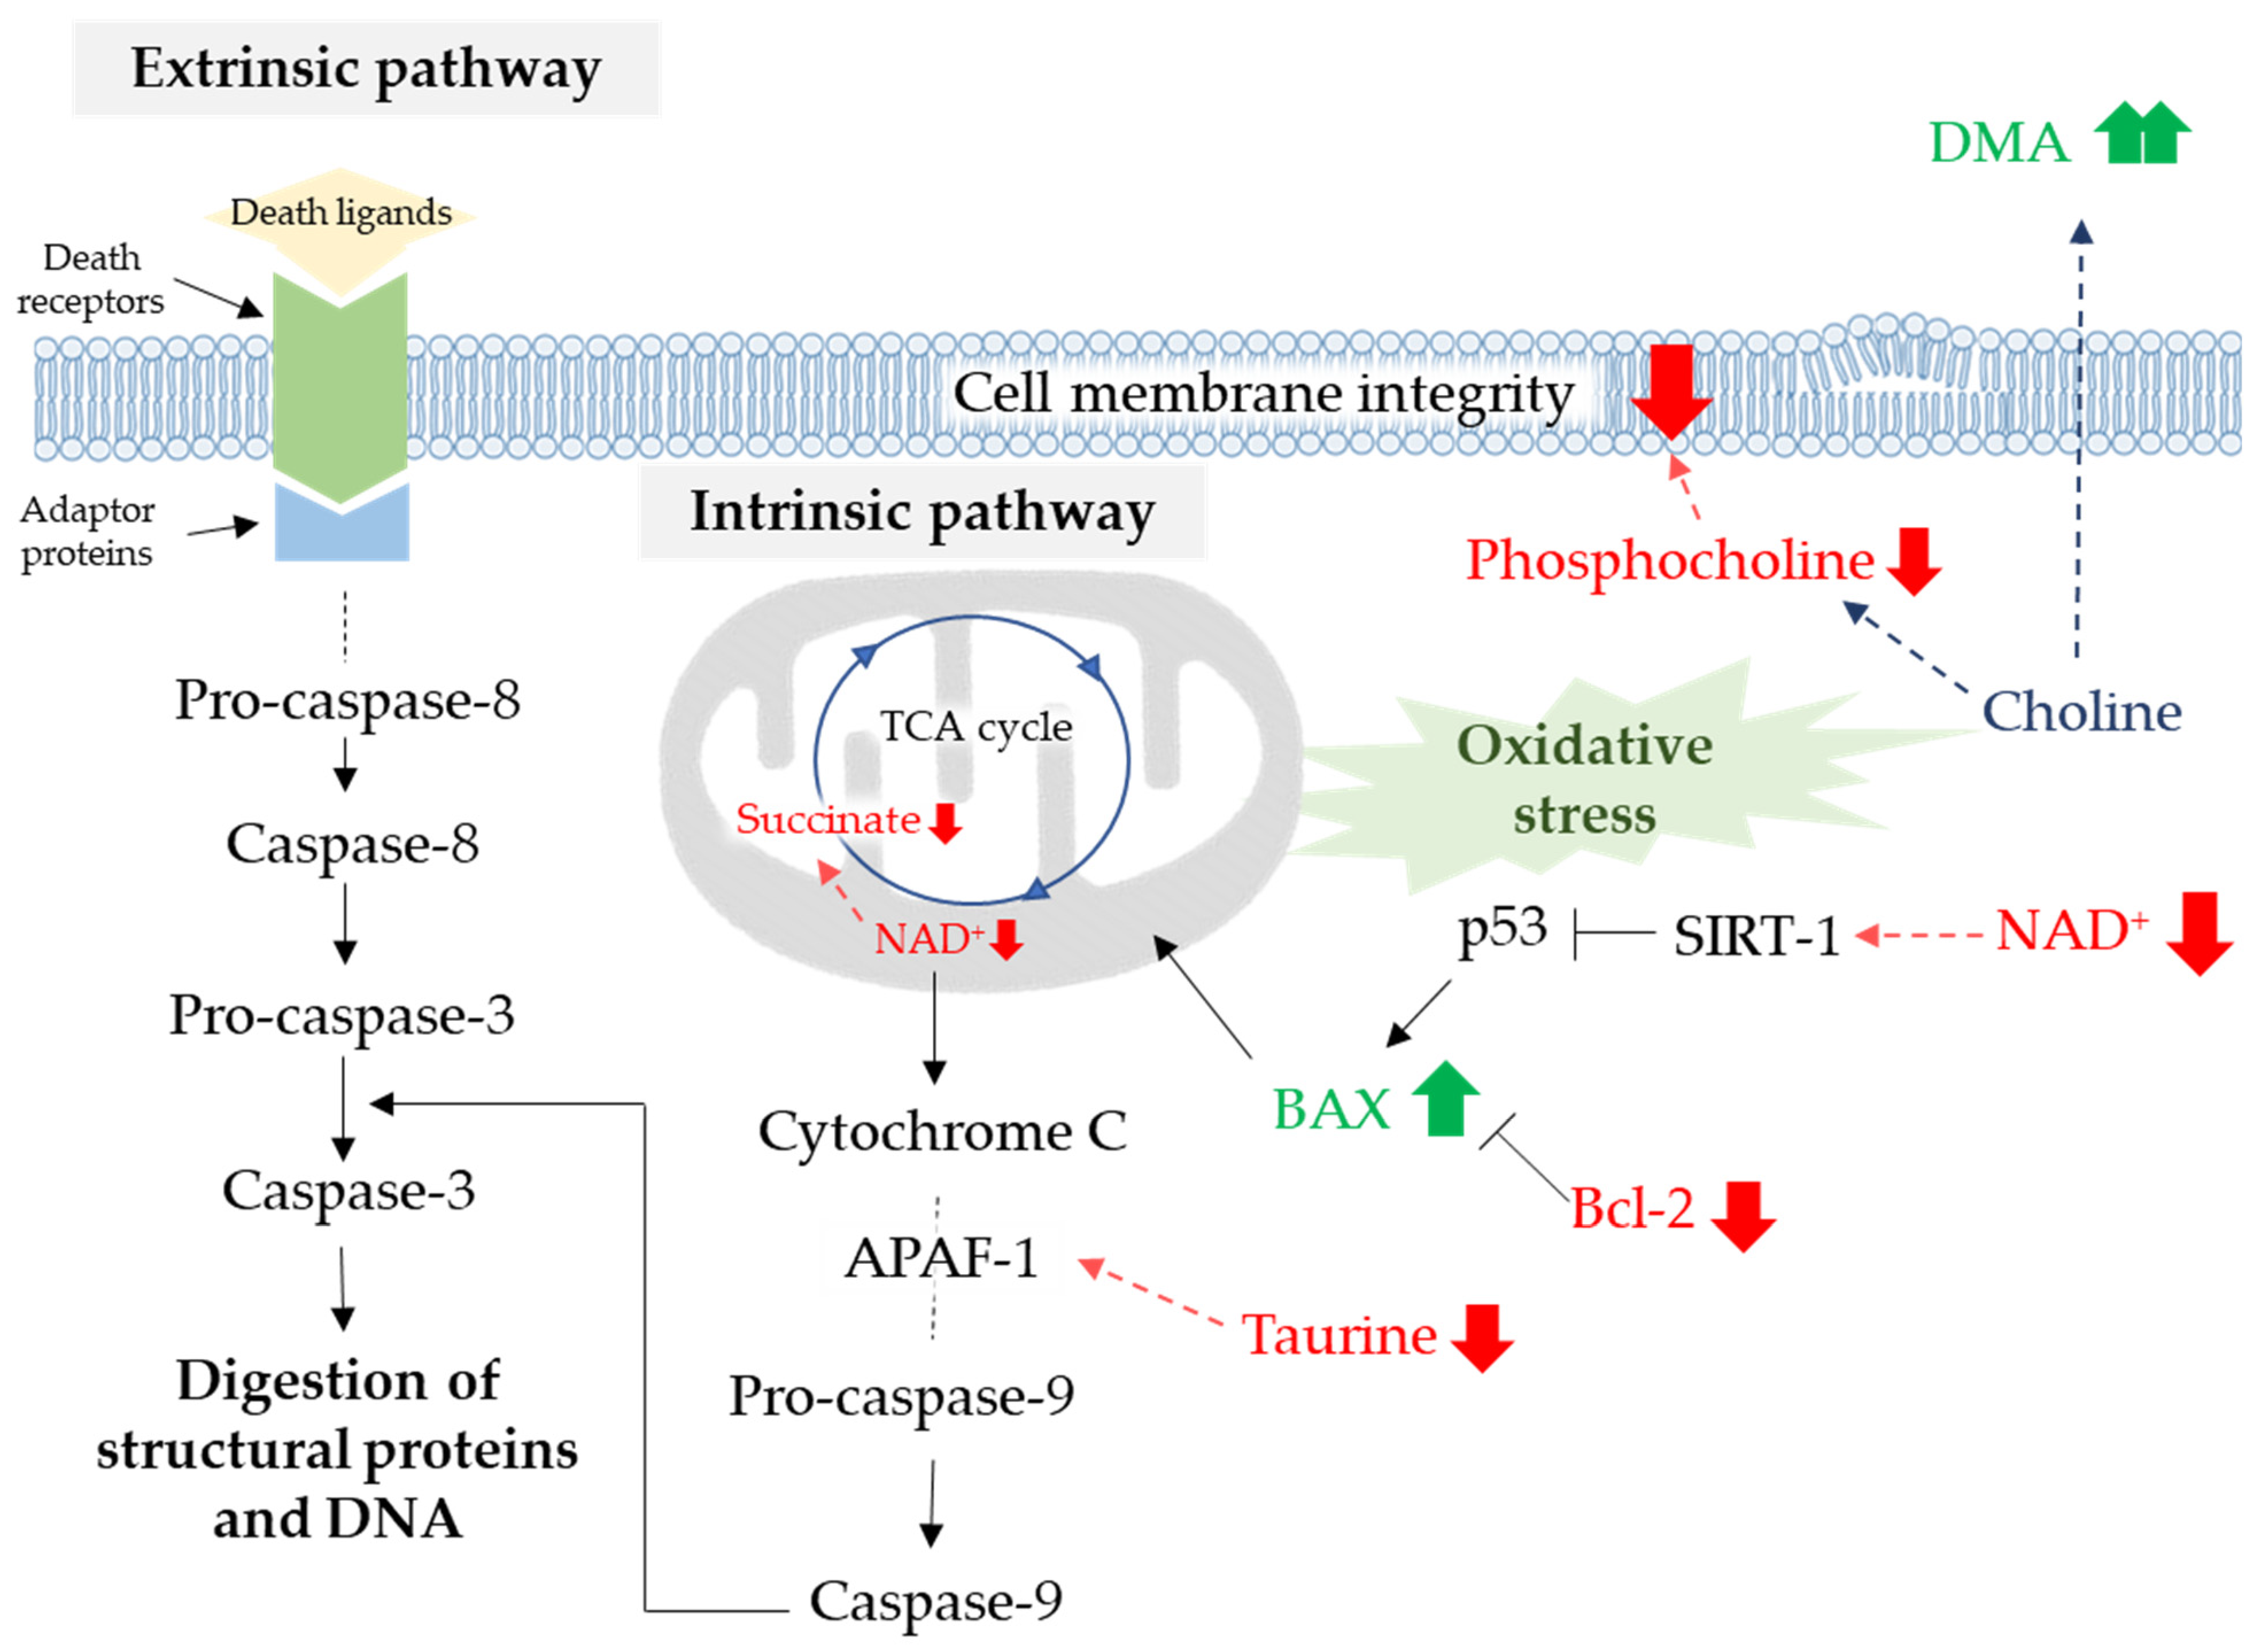
4. Discussion
5. Conclusions
Supplementary Materials
Author Contributions
Funding
Institutional Review Board Statement
Informed Consent Statement
Data Availability Statement
Acknowledgments
Conflicts of Interest
References
- Khuntikeo, N.; Loilome, W.; Thinkhamrop, B.; Chamadol, N.; Yongvanit, P. A Comprehensive Public Health Conceptual Framework and Strategy to Effectively Combat Cholangiocarcinoma in Thailand. PLoS Negl. Trop. Dis. 2016, 10, e0004293. [Google Scholar] [CrossRef]
- Rizvi, S.; Gores, G.J. Pathogenesis, diagnosis, and management of cholangiocarcinoma. Gastroenterology 2013, 145, 1215–1229. [Google Scholar] [CrossRef] [Green Version]
- Ramirez-Merino, N.; Aix, S.P.; Cortes-Funes, H. Chemotherapy for cholangiocarcinoma: An update. World J. Gastrointest. Oncol. 2013, 5, 171–176. [Google Scholar] [CrossRef] [PubMed]
- Benson, A.B.; Abrams, T.A.; Ben-Josef, E.; Bloomston, P.M.; Botha, J.F.; Clary, B.M.; Covey, A.; Curley, S.A.; D’Angelica, M.I.; Davila, R.; et al. NCCN clinical practice guidelines in oncology: Hepatobiliary cancers. J. Natl. Compr. Cancer Netw. 2009, 7, 350–391. [Google Scholar] [CrossRef] [PubMed]
- Aljiffry, M.; Walsh, M.J.; Molinari, M. Advances in diagnosis, treatment and palliation of cholangiocarcinoma: 1990–2009. World J. Gastroenterol. 2009, 15, 4240–4262. [Google Scholar] [CrossRef] [PubMed]
- Ishimura, N.; Isomoto, H.; Bronk, S.F.; Gores, G.J. Trail induces cell migration and invasion in apoptosis-resistant cholangiocarcinoma cells. Am. J. Physiol. Gastrointest. Liver Physiol. 2006, 290, G129–G136. [Google Scholar] [CrossRef] [PubMed] [Green Version]
- Yoon, H.; Min, J.K.; Lee, J.W.; Kim, D.G.; Hong, H.J. Acquisition of chemoresistance in intrahepatic cholangiocarcinoma cells by activation of AKT and extracellular signal-regulated kinase (ERK)1/2. Biochem. Biophys. Res. Commun. 2011, 405, 333–337. [Google Scholar] [CrossRef]
- Harnois, D.M.; Que, F.G.; Celli, A.; LaRusso, N.F.; Gores, G.J. Bcl-2 is overexpressed and alters the threshold for apoptosis in a cholangiocarcinoma cell line. Hepatology 1997, 26, 884–890. [Google Scholar] [CrossRef] [PubMed]
- Vanholme, R.; Demedts, B.; Morreel, K.; Ralph, J.; Boerjan, W. Lignin biosynthesis and structure. Plant Physiol. 2010, 153, 895–905. [Google Scholar] [CrossRef] [Green Version]
- Fathy, M.; Fawzy, M.A.; Hintzsche, H.; Nikaido, T.; Dandekar, T.; Othman, E.M. Eugenol Exerts Apoptotic Effect and Modulates the Sensitivity of HeLa Cells to Cisplatin and Radiation. Molecules 2019, 24, 3979. [Google Scholar] [CrossRef] [Green Version]
- Alvarez-Delgado, C.; Reyes-Chilpa, R.; Estrada-Muniz, E.; Mendoza-Rodriguez, C.A.; Quintero-Ruiz, A.; Solano, J.; Cerbon, M.A. Coumarin A/AA induces apoptosis-like cell death in HeLa cells mediated by the release of apoptosis-inducing factor. J. Biochem. Mol. Toxicol. 2009, 23, 263–272. [Google Scholar] [CrossRef] [PubMed]
- Promraksa, B.; Phetcharaburanin, J.; Namwat, N.; Techasen, A.; Boonsiri, P.; Loilome, W. Evaluation of anticancer potential of Thai medicinal herb extracts against cholangiocarcinoma cell lines. PLoS ONE 2019, 14, e0216721. [Google Scholar] [CrossRef] [PubMed]
- Dona, A.C.; Kyriakides, M.; Scott, F.; Shephard, E.A.; Varshavi, D.; Veselkov, K.; Everett, J.R. A guide to the identification of metabolites in NMR-based metabonomics/metabolomics experiments. Comput. Struct. Biotechnol. J. 2016, 14, 135–153. [Google Scholar] [CrossRef] [Green Version]
- Nicholson, J.K.; Lindon, J.C.; Holmes, E. ‘Metabonomics’: Understanding the metabolic responses of living systems to pathophysiological stimuli via multivariate statistical analysis of biological NMR spectroscopic data. Xenobiotica 1999, 29, 1181–1189. [Google Scholar] [CrossRef] [PubMed]
- Wishart, D.S. Emerging applications of metabolomics in drug discovery and precision medicine. Nat. Rev. Drug Discov. 2016, 15, 473–484. [Google Scholar] [CrossRef]
- Gavaghan, C.L.; Holmes, E.; Lenz, E.; Wilson, I.D.; Nicholson, J.K. An NMR-based metabonomic approach to investigate the biochemical consequences of genetic strain differences: Application to the C57BL10J and Alpk: ApfCD mouse. FEBS Lett. 2000, 484, 169–174. [Google Scholar] [CrossRef] [Green Version]
- Zhang, L.; Hatzakis, E.; Patterson, A.D. NMR-Based Metabolomics and Its Application in Drug Metabolism and Cancer Research. Curr. Pharmacol. Rep. 2016, 2, 231–240. [Google Scholar] [CrossRef] [Green Version]
- Gangar, M.; Ittuveetil, A.; Goyal, S.; Pal, A.; Harikrishnan, M.; Nair, V.A. Anti selective glycolate aldol reactions of (S)-4-isopropyl-1-[(R)-1-phenylethyl]imidazolidin-2-one: Application towards the asymmetric synthesis of 8-4′-oxyneolignans. RSC Adv. 2016, 6, 102116–102126. [Google Scholar] [CrossRef]
- Vichai, V.; Kirtikara, K. Sulforhodamine B colorimetric assay for cytotoxicity screening. Nat. Protoc. 2006, 1, 1112–1116. [Google Scholar] [CrossRef]
- Cloarec, O.; Dumas, M.-E.; Craig, A.; Barton, R.H.; Trygg, J.; Hudson, J.; Blancher, C.; Gauguier, D.; Lindon, J.C.; Holmes, A.E.; et al. Statistical total correlation spectroscopy: An exploratory approach for latent biomarker identification from metabolic 1H NMR data sets. Anal. Chem. 2005, 77, 1282–1289. [Google Scholar] [CrossRef] [PubMed]
- Triba, M.N.; Le Moyec, L.; Amathieu, R.; Goossens, C.; Bouchemal, N.; Nahon, P.; Rutledge, D.N.; Savarin, P. PLS/OPLS models in metabolomics: The impact of permutation of dataset rows on the K-fold cross-validation quality parameters. Mol. BioSyst. 2015, 11, 13–19. [Google Scholar] [CrossRef] [PubMed]
- Boeing, H.; Bechthold, A.; Bub, A.; Ellinger, S.; Haller, D.; Kroke, A.; Leschik-Bonnet, E.; Muller, M.J.; Oberritter, H.; Schulze, M.; et al. Critical review: Vegetables and fruit in the prevention of chronic diseases. Eur. J. Nutr. 2012, 51, 637–663. [Google Scholar] [CrossRef] [PubMed] [Green Version]
- Liu, R.H. Potential synergy of phytochemicals in cancer prevention: Mechanism of action. J. Nutr. 2004, 134, 3479S–3485S. [Google Scholar] [CrossRef] [Green Version]
- Azadfar, M.; Gao, A.H.; Bule, M.V.; Chen, S. Structural characterization of lignin: A potential source of antioxidants guaiacol and 4-vinylguaiacol. Int. J. Biol. Macromol. 2015, 75, 58–66. [Google Scholar] [CrossRef] [PubMed]
- Pfeffer, C.M.; Singh, A.T.K. Apoptosis: A Target for Anticancer Therapy. Int. J. Mol. Sci. 2018, 19, 448. [Google Scholar] [CrossRef] [Green Version]
- Thanee, M.; Loilome, W.; Techasen, A.; Sugihara, E.; Okazaki, S.; Abe, S.; Ueda, S.; Masuko, T.; Namwat, N.; Khuntikeo, N.; et al. CD44 variant-dependent redox status regulation in liver fluke-associated cholangiocarcinoma: A target for cholangiocarcinoma treatment. Cancer Sci. 2016, 107, 991–1000. [Google Scholar] [CrossRef]
- Adams, J.M.; Cory, S. The Bcl-2 apoptotic switch in cancer development and therapy. Oncogene 2007, 26, 1324–1337. [Google Scholar] [CrossRef] [Green Version]
- Bligh, E.G.; Dyer, W.J. A rapid method of total lipid extraction and purification. Can. J. Biochem. Physiol. 1959, 37, 911–917. [Google Scholar] [CrossRef] [Green Version]
- Worley, B.; Powers, R. Multivariate Analysis in Metabolomics. Curr. Metab. 2013, 1, 92–107. [Google Scholar] [CrossRef]
- Han, M.; Cheng, X.; Gao, Z.; Zhao, R.; Zhang, S. Inhibition of tumor cell growth by adenine is mediated by apoptosis induction and cell cycle S phase arrest. Oncotarget 2017, 8, 94286–94296. [Google Scholar] [CrossRef] [Green Version]
- Canto, C.; Menzies, K.J.; Auwerx, J. NAD(+) Metabolism and the Control of Energy Homeostasis: A Balancing Act between Mitochondria and the Nucleus. Cell Metab. 2015, 22, 31–53. [Google Scholar] [CrossRef] [PubMed] [Green Version]
- Luo, J.; Nikolaev, A.Y.; Imai, S.; Chen, D.; Su, F.; Shiloh, A.; Guarente, L.; Gu, W. Negative control of p53 by Sir2alpha promotes cell survival under stress. Cell 2001, 107, 137–148. [Google Scholar] [CrossRef] [Green Version]
- Saensa-Ard, S.; Leuangwattanawanit, S.; Senggunprai, L.; Namwat, N.; Kongpetch, S.; Chamgramol, Y.; Loilome, W.; Khansaard, W.; Jusakul, A.; Prawan, A.; et al. Establishment of cholangiocarcinoma cell lines from patients in the endemic area of liver fluke infection in Thailand. Tumour Biol. 2017, 39, 1010428317725925. [Google Scholar] [CrossRef] [PubMed] [Green Version]
- Zamaraeva, M.V.; Sabirov, R.Z.; Maeno, E.; Ando-Akatsuka, Y.; Bessonova, S.V.; Okada, Y. Cells die with increased cytosolic ATP during apoptosis: A bioluminescence study with intracellular luciferase. Cell Death Differ. 2005, 12, 1390–1397. [Google Scholar] [CrossRef]
- Tu, S.; Zhang, X.; Luo, D.; Liu, Z.; Yang, X.; Wan, H.; Yu, L.; Li, H.; Wan, F. Effect of taurine on the proliferation and apoptosis of human hepatocellular carcinoma HepG2 cells. Exp. Ther. Med. 2015, 10, 193–200. [Google Scholar] [CrossRef] [Green Version]
- Li, H.; Ruan, W.J.; Liu, L.Q.; Wan, H.F.; Yang, X.H.; Zhu, W.F.; Yu, L.H.; Zhang, X.L.; Wan, F.S. Impact of Taurine on the proliferation and apoptosis of human cervical carcinoma cells and its mechanism. Chin. Med. J. 2019, 132, 948–956. [Google Scholar] [CrossRef]
- Takatani, T.; Takahashi, K.; Uozumi, Y.; Shikata, E.; Yamamoto, Y.; Ito, T.; Matsuda, T.; Schaffer, S.W.; Fujio, Y.; Azuma, J. Taurine inhibits apoptosis by preventing formation of the Apaf-1/caspase-9 apoptosome. Am. J. Physiol. Cell Physiol. 2004, 287, C949–C953. [Google Scholar] [CrossRef] [Green Version]
- D’Alessio, M.; Cerella, C.; Amici, C.; Pesce, C.; Coppola, S.; Fanelli, C.; de Nicola, M.; Cristofanon, S.; Clavarino, G.; Bergamaschi, A.; et al. Glutathione depletion up-regulates Bcl-2 in BSO-resistant cells. FASEB J. 2004, 18, 1609–1611. [Google Scholar] [CrossRef]
- Yen, C.L.; Mar, M.H.; Zeisel, S.H. Choline deficiency-induced apoptosis in PC12 cells is associated with diminished membrane phosphatidylcholine and sphingomyelin, accumulation of ceramide and diacylglycerol, and activation of a caspase. FASEB J. 1999, 13, 135–142. [Google Scholar] [CrossRef]
- Janeiro, M.H.; Ramirez, M.J.; Milagro, F.I.; Martinez, J.A.; Solas, M. Implication of Trimethylamine N-Oxide (TMAO) in Disease: Potential Biomarker or New Therapeutic Target. Nutrients 2018, 10, 1398. [Google Scholar] [CrossRef] [Green Version]
- Chen, C.; Gao, J.; Wang, T.S.; Guo, C.; Yan, Y.J.; Mao, C.Y.; Gu, L.W.; Yang, Y.; Li, Z.F.; Liu, A. NMR-based Metabolomic Techniques Identify the Toxicity of Emodin in HepG2 Cells. Sci. Rep. 2018, 8, 9379. [Google Scholar] [CrossRef] [PubMed]
- Chen, J.; Chaurio, R.A.; Maueroder, C.; Derer, A.; Rauh, M.; Kost, A.; Liu, Y.; Mo, X.; Hueber, A.; Bilyy, R.; et al. Inosine Released from Dying or Dead Cells Stimulates Cell Proliferation via Adenosine Receptors. Front. Immunol. 2017, 8, 504. [Google Scholar] [CrossRef] [PubMed] [Green Version]
- Liu, K.; Zheng, D.; Lei, H.; Liu, J.; Lei, J.; Wang, L.; Ma, X. Development of Novel Lignin-Based Targeted Polymeric Nanoparticle Platform for Efficient Delivery of Anticancer Drugs. ACS Biomater. Sci. Eng. 2018, 4, 1730–1737. [Google Scholar] [CrossRef]
- Dai, L.; Liu, R.; Hu, L.Q.; Zou, Z.F.; Si, C.L. Lignin Nanoparticle as a Novel Green Carrier for the Efficient Delivery of Resveratrol. ACS Sustain. Chem. Eng. 2017, 5, 8241–8249. [Google Scholar] [CrossRef]


Publisher’s Note: MDPI stays neutral with regard to jurisdictional claims in published maps and institutional affiliations. |
© 2021 by the authors. Licensee MDPI, Basel, Switzerland. This article is an open access article distributed under the terms and conditions of the Creative Commons Attribution (CC BY) license (http://creativecommons.org/licenses/by/4.0/).
Share and Cite
Promraksa, B.; Katrun, P.; Phetcharaburanin, J.; Kittirat, Y.; Namwat, N.; Techasen, A.; Li, J.V.; Loilome, W. Metabolic Changes of Cholangiocarcinoma Cells in Response to Coniferyl Alcohol Treatment. Biomolecules 2021, 11, 476. https://doi.org/10.3390/biom11030476
Promraksa B, Katrun P, Phetcharaburanin J, Kittirat Y, Namwat N, Techasen A, Li JV, Loilome W. Metabolic Changes of Cholangiocarcinoma Cells in Response to Coniferyl Alcohol Treatment. Biomolecules. 2021; 11(3):476. https://doi.org/10.3390/biom11030476
Chicago/Turabian StylePromraksa, Bundit, Praewpan Katrun, Jutarop Phetcharaburanin, Yingpinyapat Kittirat, Nisana Namwat, Anchalee Techasen, Jia V. Li, and Watcharin Loilome. 2021. "Metabolic Changes of Cholangiocarcinoma Cells in Response to Coniferyl Alcohol Treatment" Biomolecules 11, no. 3: 476. https://doi.org/10.3390/biom11030476