
Alcohol-Induced Lysosomal Damage and Suppression of Lysosome Biogenesis Contribute to Hepatotoxicity in HIV-Exposed Liver Cells

 ,
, 
 , , and
Abstract
:1. Introduction
2. Materials and Methods
2.1. Reagents and Antibodies
2.2. In Vitro Studies
2.3. RNA Isolation and Real-Time PCR (RT-PCR)
2.4. Proteasome Activities
2.5. Cathepsin B and L Activities
2.6. Whole-Cell Lysates and Nuclear/Cytosolic Fractionations
2.7. Immunoblotting
2.8. Immunofluorescence
2.9. Statistical Analyses
3. Results
3.1. AGS and HIV Exposure Lowers Cathepsin Activities and Lysosome Numbers
3.2. Both AGS and HIV Enhance Lysosome Leakage
3.3. AGS and HIV Enhance Intracellular Oxidant Stress
3.4. AGS and HIV Enhance Cathepsin Leakage and Intrinsic Apoptosis
3.5. AGS and HIV Exposure Suppress TFEB Protein Expressions in Cytosolic and Nuclear Fractions of RLW Cells
3.6. AGS and HIV Exposures Suppress Proteasome Activity and Enhance ZKSCAN3 Expression
4. Discussion
5. Conclusions
Author Contributions
Funding
Institutional Review Board Statement
Informed Consent Statement
Acknowledgments
Conflicts of Interest
References
- Lorenc, A.; Ananthavarathan, P.; Lorigan, J.; Banarsee, R.; Jowata, M.; Brook, G. The prevalence of comorbidities among people living with HIV in Brent: A diverse London Borough. Lond. J. Prim. Care 2014, 6, 84–90. [Google Scholar] [CrossRef]
- Kendall, C.E.; Wong, J.; Taljaard, M.; Glazier, R.H.; Hogg, W.; Younger, J.; Manuel, D.G. A cross-sectional, population-based study measuring comorbidity among people living with HIV in Ontario. BMC Public Health 2014, 14, 161. [Google Scholar] [CrossRef] [Green Version]
- Price, J.C.; Thio, C.L. Liver disease in the HIV-infected individual. Clin. Gastroenterol. Hepatol. 2010, 8, 1002–1012. [Google Scholar] [CrossRef] [PubMed] [Green Version]
- Falade-Nwulia, O.; Thio, C.L. Liver disease, HIV and aging. Sex. Health 2011, 8, 512–520. [Google Scholar] [CrossRef] [Green Version]
- Kaspar, M.B.; Sterling, R.K. Mechanisms of liver disease in patients infected with HIV. BMJ Open Gastroenterol. 2017, 4, e000166. [Google Scholar] [CrossRef] [Green Version]
- Ganesan, M.; Poluektova, L.Y.; Kharbanda, K.K.; Osna, N.A. Liver as a target of human immunodeficiency virus infection. World J. Gastroenterol. 2018, 24, 4728–4737. [Google Scholar] [CrossRef] [PubMed]
- Ganesan, M.; New-Aaron, M.; Dagur, R.S.; Makarov, E.; Wang, W.; Kharbanda, K.K.; Kidambi, S.; Poluektova, L.Y.; Osna, N.A. Alcohol metabolism potentiates HIV-induced hepatotoxicity: Contribution to end-stage liver disease. Biomolecules 2019, 9, 851. [Google Scholar] [CrossRef] [Green Version]
- Ivanov, A.V.; Valuev-Elliston, V.T.; Ivanova, O.N.; Kochetkov, S.; Starodubova, E.S.; Bartosch, B.; Isaguliants, M.G. Oxidative stress during HIV Infection: Mechanisms and consequences. Oxidative Med. Cell. Longev. 2016, 2016, 8910396. [Google Scholar] [CrossRef] [PubMed] [Green Version]
- Donohue, T.M.; Osna, N.A.; Kharbanda, K.K.; Thomes, P.G. Lysosome and proteasome dysfunction in alcohol-induced liver injury. Liver Res. 2019, 3, 191–205. [Google Scholar] [CrossRef]
- Dagur, R.S.; New-Aaron, M.; Ganesan, M.; Wang, W.; Romanova, S.; Kidambi, S.; Kharbanda, K.; Poluektova, L.; Osna, N. Alcohol-and-HIV-induced lysosomal dysfunction regulates extracellular vesicles secretion In Vitro and in liver-humanized mice. Biology 2021, 10, 29. [Google Scholar] [CrossRef]
- Boya, P.; Kroemer, G. Lysosomal membrane permeabilization in cell death. Oncogene 2008, 27, 6434–6451. [Google Scholar] [CrossRef] [Green Version]
- Sardiello, M.; Palmieri, M.; Di Ronza, A.; Medina, D.L.; Valenza, M.; Gennarino, V.A.; Di Malta, C.; Donaudy, F.; Embrione, V.; Polishchuk, R.S.; et al. A gene network regulating lysosomal biogenesis and function. Science 2009, 325, 473–477. [Google Scholar] [CrossRef] [Green Version]
- Chao, X.; Wang, S.; Zhao, K.; Li, Y.; Williams, J.A.; Li, T.; Chavan, H.; Krishnamurthy, P.; He, X.C.; Li, L.; et al. Impaired TFEB-mediated lysosome biogenesis and autophagy promote chronic ethanol-induced liver injury and steatosis in mice. Gastroentelogoy 2018, 155, 865–879.e12. [Google Scholar] [CrossRef] [PubMed]
- Bala, S.; Szabo, G. TFEB, a master regulator of lysosome biogenesis and autophagy, is a new player in alcoholic liver disease. Dig. Med. Res. 2018, 1, 16. [Google Scholar] [CrossRef] [PubMed]
- Napolitano, G.; Esposito, A.; Choi, H.; Matarese, M.; Benedetti, V.; Di Malta, C.; Monfregola, J.; Medina, D.L.; Lippincott-Schwartz, J.; Ballabio, A. mTOR-dependent phosphorylation controls TFEB nuclear export. Nat. Commun. 2018, 9, 3312. [Google Scholar] [CrossRef]
- Sha, Y.; Rao, L.; Settembre, C.; Ballabio, A.; Eissa, N.T. STUB 1 regulates TFEB-induced autophagy-lysosome pathway. EMBO J. 2017, 36, 2544–2552. [Google Scholar] [CrossRef]
- Chauhan, S.; Goodwin, J.G.; Chauhan, S.; Manyam, G.; Wang, J.; Kamat, A.M.; Boyd, D.D. ZKSCAN3 is a master transcriptional repressor of autophagy. Mol. Cell 2013, 50, 16–28. [Google Scholar] [CrossRef] [PubMed] [Green Version]
- Snapper, C.M.; Finkelman, F.D.; Paul, W.E. Differential regulation of IgG1 and IgE synthesis by interleukin 4. J. Exp. Med. 1988, 167, 183–196. [Google Scholar] [CrossRef]
- Ganesan, M.; Krutik, V.M.; Makarov, E.; Mathews, S.; Kharbanda, K.K.; Poluektova, L.Y.; Casey, C.A.; Osna, N.A. Acetaldehyde suppresses the display of HBV-MHC class I complexes on HBV-expressing hepatocytes. Am. J. Physiol. Liver Physiol. 2019, 317, G127–G140. [Google Scholar] [CrossRef]
- Thomes, P.G.; Ehlers, R.A.; Trambly, C.S.; Clemens, D.L.; Fox, H.; Tuma, D.J.; Donohue, J.T.M. Multilevel regulation of autophagosome content by ethanol oxidation in HepG2 cells. Autophagy 2013, 9, 63–73. [Google Scholar] [CrossRef] [Green Version]
- Ganesan, M.; Natarajan, S.K.; Zhang, J.; Mott, J.; Poluektova, L.; McVicker, B.L.; Kharbanda, K.K.; Tuma, D.J.; Osna, N.A. Role of apoptotic hepatocytes in HCV dissemination: Regulation by acetaldehyde. Am. J. Physiol. Liver Physiol. 2016, 310, G930–G940. [Google Scholar] [CrossRef]
- Ganesan, M.; Poluektova, L.Y.; Tuma, D.J.; Kharbanda, K.K.; Osna, N.A. Acetaldehyde disrupts interferon alpha signaling in hepatitis C virus-infected liver cells by up-regulating USP18. Alcohol. Clin. Exp. Res. 2016, 40, 2329–2338. [Google Scholar] [CrossRef]
- Ganesan, M.; Dagur, R.S.; Makarov, E.; Poluektova, L.I.; Kidambi, S.; Osna, N.A. Matrix stiffness regulate apoptotic cell death in HIV-HCV co-infected hepatocytes: Importance for liver fibrosis progression. Biochem. Biophys. Res. Commun. 2018, 500, 717–722. [Google Scholar] [CrossRef] [PubMed]
- LaForge, M.; Limou, S.; Harper, F.; Casartelli, N.; Rodrigues, V.; Silvestre, R.; Haloui, H.; Zagury, J.-F.; Senik, A.; Estaquier, J. DRAM triggers lysosomal membrane permeabilization and cell death in CD4+ T cells infected with HIV. PLoS Pathog. 2013, 9, e1003328. [Google Scholar] [CrossRef] [PubMed] [Green Version]
- Chacinska, A.; Koehler, C.M.; Milenkovic, D.; Lithgow, T.; Pfanner, N. Importing mitochondrial proteins: Machineries and mechanisms. Cell 2009, 138, 628–644. [Google Scholar] [CrossRef] [PubMed] [Green Version]
- Yamamoto, H.; Itoh, N.; Kawano, S.; Yatsukawa, Y.-I.; Momose, T.; Makio, T.; Matsunaga, M.; Yokota, M.; Esaki, M.; Shodai, T.; et al. Dual role of the receptor Tom20 in specificity and efficiency of protein import into mitochondria. Proc. Natl. Acad. Sci. USA 2011, 108, 91–96. [Google Scholar] [CrossRef] [PubMed] [Green Version]
- Wang, F.; Gómez-Sintes, R.; Boya, P. Lysosomal membrane permeabilization and cell death. Traffic 2018, 19, 918–931. [Google Scholar] [CrossRef] [PubMed]
- Rojas, V.; Park, I.-W. Role of the ubiquitin proteasome system (UPS) in the HIV-1 life cycle. Int. J. Mol. Sci. 2019, 20, 2984. [Google Scholar] [CrossRef] [Green Version]
- Seissler, T.; Marquet, R.; Paillart, J.-C. Hijacking of the ubiquitin/proteasome pathway by the HIV auxiliary proteins. Viruses 2017, 9, 322. [Google Scholar] [CrossRef] [Green Version]
- Fredericksen, B.L.; Wei, B.L.; Yao, J.; Luo, T.; Garcia, J.V. Inhibition of endosomal/lysosomal degradation increases the infectivity of human immunodeficiency virus. J. Virol. 2002, 76, 11440–11446. [Google Scholar] [CrossRef] [Green Version]
- Ali, H.; Mano, M.; Braga, L.; Naseem, A.; Marini, B.; Vu, D.M.; Collesi, C.; Meroni, G.; Lusic, M.; Giacca, M. Cellular TRIM33 restrains HIV-1 infection by targeting viral integrase for proteasomal degradation. Nat. Commun. 2019, 10, 926. [Google Scholar] [CrossRef] [PubMed]
- Ganesan, M.; Poluektova, L.Y.; Enweluzo, C.; Kharbanda, K.K.; Osna, N.A. Hepatitis C virus-infected apoptotic hepatocytes program macrophages and hepatic stellate cells for liver inflammation and fibrosis development: Role of ethanol as a second hit. Biomolecules 2018, 8, 113. [Google Scholar] [CrossRef] [PubMed] [Green Version]
- Feldstein, A.E.; Werneburg, N.W.; Li, Z.; Bronk, S.F.; Gores, G.J. Bax inhibition protects against free fatty acid-induced lysosomal permeabilization. Am. J. Physiol. Liver Physiol. 2006, 290, G1339–G1346. [Google Scholar] [CrossRef] [PubMed] [Green Version]
- Li, Z.; Berk, M.; McIntyre, T.M.; Gores, G.J.; Feldstein, A.E. The lysosomal-mitochondrial axis in free fatty acid-induced hepatic lipotoxicity. Hepatology 2008, 47, 1495–1503. [Google Scholar] [CrossRef] [PubMed] [Green Version]
- Donohue, T.M.; Curry-McCoy, T.V.; Nanji, A.A.; Kharbanda, K.K.; Osna, N.A.; Radio, S.J.; Todero, S.L.; White, R.L.; Casey, C.A. Lysosomal leakage and lack of adaptation of hepatoprotective enzyme contribute to enhanced susceptibility to ethanol-induced liver injury in female rats. Alcohol. Clin. Exp. Res. 2007, 31, 1944–1952. [Google Scholar] [CrossRef] [PubMed]
- Li, Y.; Chen, M.; Xu, Y.; Yu, X.; Xiong, T.; Du, M.; Sun, J.; Liu, L.; Tang, Y.; Yao, P. Iron-mediated lysosomal membrane permeabilization in ethanol-induced hepatic oxidative damage and apoptosis: Protective effects of quercetin. Oxidative Med. Cell. Longev. 2015, 2016, 4147610. [Google Scholar] [CrossRef] [PubMed]
- Aits, S.; Kricker, J.; Liu, B.; Ellegaard, A.M.; Hämälistö, S.; Tvingsholm, S.; Corcelle-Termeau, E.; Høgh, S.; Farkas, T.; Jonassen, A.H.; et al. Sensitive detection of lysosomal membrane permeabilization by lysosomal galectin puncta assay. Autophagy 2015, 11, 1408–1424. [Google Scholar] [CrossRef] [Green Version]
- Guan, J.-J.; Zhang, X.; Sun, W.; Qi, L.; Wu, J.-C.; Qin, Z.-H. DRAM1 regulates apoptosis through increasing protein levels and lysosomal localization of BAX. Cell Death Dis. 2015, 6, e1624. [Google Scholar] [CrossRef]
- Takahashi, M.; Kakudo, Y.; Takahashi, S.; Sakamoto, Y.; Kato, S.; Ishioka, C. Overexpression of DRAM enhances p53-dependent apoptosis. Cancer Med. 2013, 2, 1–10. [Google Scholar] [CrossRef]
- Garufi, A.; Pistritto, G.; Baldari, S.; Toietta, G.; Cirone, M.; D’Orazi, G. p53-dependent PUMA to DRAM antagonistic interplay as a key molecular switch in cell-fate decision in normal/high glucose conditions. J. Exp. Clin. Cancer Res. 2017, 36, 126. [Google Scholar] [CrossRef] [Green Version]
- Saitoh, T.; Igura, M.; Obita, T.; Ose, T.; Kojima, R.; Maenaka, K.; Endo, T.; Kohda, D. Tom20 recognizes mitochondrial presequences through dynamic equilibrium among multiple bound states. EMBO J. 2007, 26, 4777–4787. [Google Scholar] [CrossRef] [Green Version]
- Boya, P.; Andreau, K.; Poncet, D.; Zamzami, N.; Perfettini, J.-L.; Metivier, D.; Ojcius, D.; Jaattela, M.; Kroemer, G. Lysosomal membrane permeabilization induces cell death in a mitochondrion-dependent fashion. J. Exp. Med. 2003, 197, 1323–1334. [Google Scholar] [CrossRef] [PubMed]
- Paquet, C.; Sané, A.-T.; Beauchemin, M.; Bertrand, R. Caspase- and mitochondrial dysfunction-dependent mechanisms of lysosomal leakage and cathepsin B activation in DNA damage-induced apoptosis. Leukemia 2005, 19, 784–791. [Google Scholar] [CrossRef]
- Johansson, A.-C.; Appelqvist, H.; Nilsson, C.; Kågedal, K.; Roberg, K.; Öllinger, K. Regulation of apoptosis-associated lysosomal membrane permeabilization. Apoptosis 2010, 15, 527–540. [Google Scholar] [CrossRef] [PubMed] [Green Version]
- Papadopoulos, C.; Meyer, H. Detection and clearance of damaged lysosomes by the endo-lysosomal damage response and lysophagy. Curr. Biol. 2017, 27, R1330–R1341. [Google Scholar] [CrossRef] [Green Version]
- Yoshida, Y.; Yasuda, S.; Fujita, T.; Hamasaki, M.; Murakami, A.; Kawawaki, J.; Iwai, K.; Saeki, Y.; Yoshimori, T.; Matsuda, N.; et al. Ubiquitination of exposed glycoproteins by SCF(FBXO27) directs damaged lysosomes for autophagy. Proc. Natl. Acad. Sci. USA 2017, 114, 8574–8579. [Google Scholar] [CrossRef] [Green Version]
- Radulovic, M.; Schink, K.O.; Wenzel, E.M.; Nähse, V.; Bongiovanni, A.; Lafont, F.; Stenmark, H. ESCRT -mediated lysosome repair precedes lysophagy and promotes cell survival. EMBO J. 2018, 37, e99753. [Google Scholar] [CrossRef] [PubMed]
- Jia, J.; Claude-Taupin, A.; Gu, Y.; Choi, S.W.; Peters, R.; Bissa, B.; Mudd, M.H.; Allers, L.; Pallikkuth, S.; Lidke, K.A.; et al. Galectin-3 coordinates a cellular system for lysosomal repair and removal. Dev. Cell 2020, 52, 69–87.e8. [Google Scholar] [CrossRef]
- Jia, J.; Bissa, B.; Brecht, L.; Allers, L.; Choi, S.W.; Gu, Y.; Zbinden, M.; Burge, M.R.; Timmins, G.; Hallows, K.; et al. AMPK, a regulator of metabolism and autophagy, is activated by lysosomal damage via a novel galectin-directed ubiquitin signal transduction system. Mol. Cell 2020, 77, 951–969.e9. [Google Scholar] [CrossRef] [PubMed]
- Fujita, N.; Morita, E.; Itoh, T.; Tanaka, A.; Nakaoka, M.; Osada, Y.; Umemoto, T.; Saitoh, T.; Nakatogawa, H.; Kobayashi, S.; et al. Recruitment of the autophagic machinery to endosomes during infection is mediated by ubiquitin. J. Cell Biol. 2013, 203, 115–128. [Google Scholar] [CrossRef] [Green Version]
- Jia, J.; Abudu, Y.P.; Claude-Taupin, A.; Gu, Y.; Kumar, S.; Choi, S.W.; Peters, R.; Mudd, M.H.; Allers, L.; Salemi, M.; et al. Galectins control mTOR in response to endomembrane damage. Mol. Cell 2018, 70, 120–135.e8. [Google Scholar] [CrossRef] [Green Version]
- Thomes, P.G.; Trambly, C.S.; Fox, H.S.; Tuma, D.J.; Donohue, T.M. Acute and chronic ethanol administration differentially modulate hepatic autophagy and transcription factor EB. Alcohol. Clin. Exp. Res. 2015, 39, 2354–2363. [Google Scholar] [CrossRef]
- Chao, X.; Ni, H.-M.; Ding, W.-X. Insufficient autophagy: A novel autophagic flux scenario uncovered by impaired liver TFEB-mediated lysosomal biogenesis from chronic alcohol-drinking mice. Autophagy 2018, 14, 1646–1648. [Google Scholar] [CrossRef] [Green Version]
- Thomes, P.G.; Rasineni, K.; Yang, L.; Donohue, T.M.; Kubik, J.L.; McNiven, M.A.; Casey, C.A. Ethanol withdrawal mitigates fatty liver by normalizing lipid catabolism. Am. J. Physiol. Liver Physiol. 2019, 316, G509–G518. [Google Scholar] [CrossRef]
- Jia, H.; Liang, Z.; Zhang, X.; Wang, J.; Xu, W.; Qian, H. 14-3-3 proteins: An important regulator of autophagy in diseases. Am. J. Transl. Res. 2017, 9, 4738–4746. [Google Scholar] [PubMed]
- Medina, D.L.; Di Paola, S.; Peluso, I.; Armani, A.; De Stefani, D.; Venditti, R.; Montefusco, S.; Rosato, A.S.; Prezioso, C.; Forrester, A.; et al. Lysosomal calcium signalling regulates autophagy through calcineurin and TFEB. Nat. Cell Biol. 2015, 17, 288–299. [Google Scholar] [CrossRef] [Green Version]
- Puertollano, R.; Ferguson, S.M.; Brugarolas, J.; Ballabio, A. The complex relationship between TFEB transcription factor phosphorylation and subcellular localization. EMBO J. 2018, 37, e98804. [Google Scholar] [CrossRef] [PubMed]
- Gu, J.; Han, B.; Wang, J. COVID-19: Gastrointestinal manifestations and potential fecal–oral transmission. Gastroenterology 2020, 158, 1518–1519. [Google Scholar] [CrossRef] [PubMed]
- Osna, N.A.; Donohue, T.M., Jr. Implication of altered proteasome function in alcoholic liver injury. World J. Gastroenterol. 2007, 13, 4931. [Google Scholar] [CrossRef] [Green Version]
- Bardag-Gorce, F. Effects of ethanol on the proteasome interacting proteins. World J. Gastroenterol. 2010, 16, 1349–1357. [Google Scholar] [CrossRef]
- Bardag-Gorce, F.; Li, J.; French, B.A.; French, S.W. The effect of ethanol-induced CYP2E1 on proteasome activity: The role of 4-hydroxynonenal. Exp. Mol. Pathol. 2005, 78, 109–115. [Google Scholar] [CrossRef]
- Bardag-Gorce, F.; Venkatesh, R.; Li, J.; French, B.A.; French, S.W. Hyperphosphorylation of rat liver proteasome subunits: The effects of ethanol and okadaic acid are compared. Life Sci. 2004, 75, 585–597. [Google Scholar] [CrossRef] [PubMed]
- Fernandez, D.J.; Tuma, D.J.; Tuma, P.L. Hepatic microtubule acetylation and stability induced by chronic alcohol exposure impair nuclear translocation of STAT3 and STAT5B, but not Smad2/3. Am. J. Physiol. Liver Physiol. 2012, 303, G1402–G1415. [Google Scholar] [CrossRef] [PubMed] [Green Version]
- Groebner, J.; Giron-Bravo, M.T.; Rothberg, M.L.; Adhikari, R.; Tuma, D.J.; Tuma, P.L. Alcohol-induced microtubule acetylation leads to the accumulation of large, immobile lipid droplets. Am. J. Physiol. Liver Physiol. 2019, 317, G373–G386. [Google Scholar] [CrossRef] [PubMed]


| Parameters | Effect Due To: | Figures |
|---|---|---|
| Cathepsin B activity | AGS + HIV | Figure 1A |
| Cathepsin L activity | AGS + HIV | Figure 1B |
| LAMP1 immunostaining | AGS | Figure 1C,D |
| LAMP1 Western blot | AGS + HIV | Figure 1E,F |
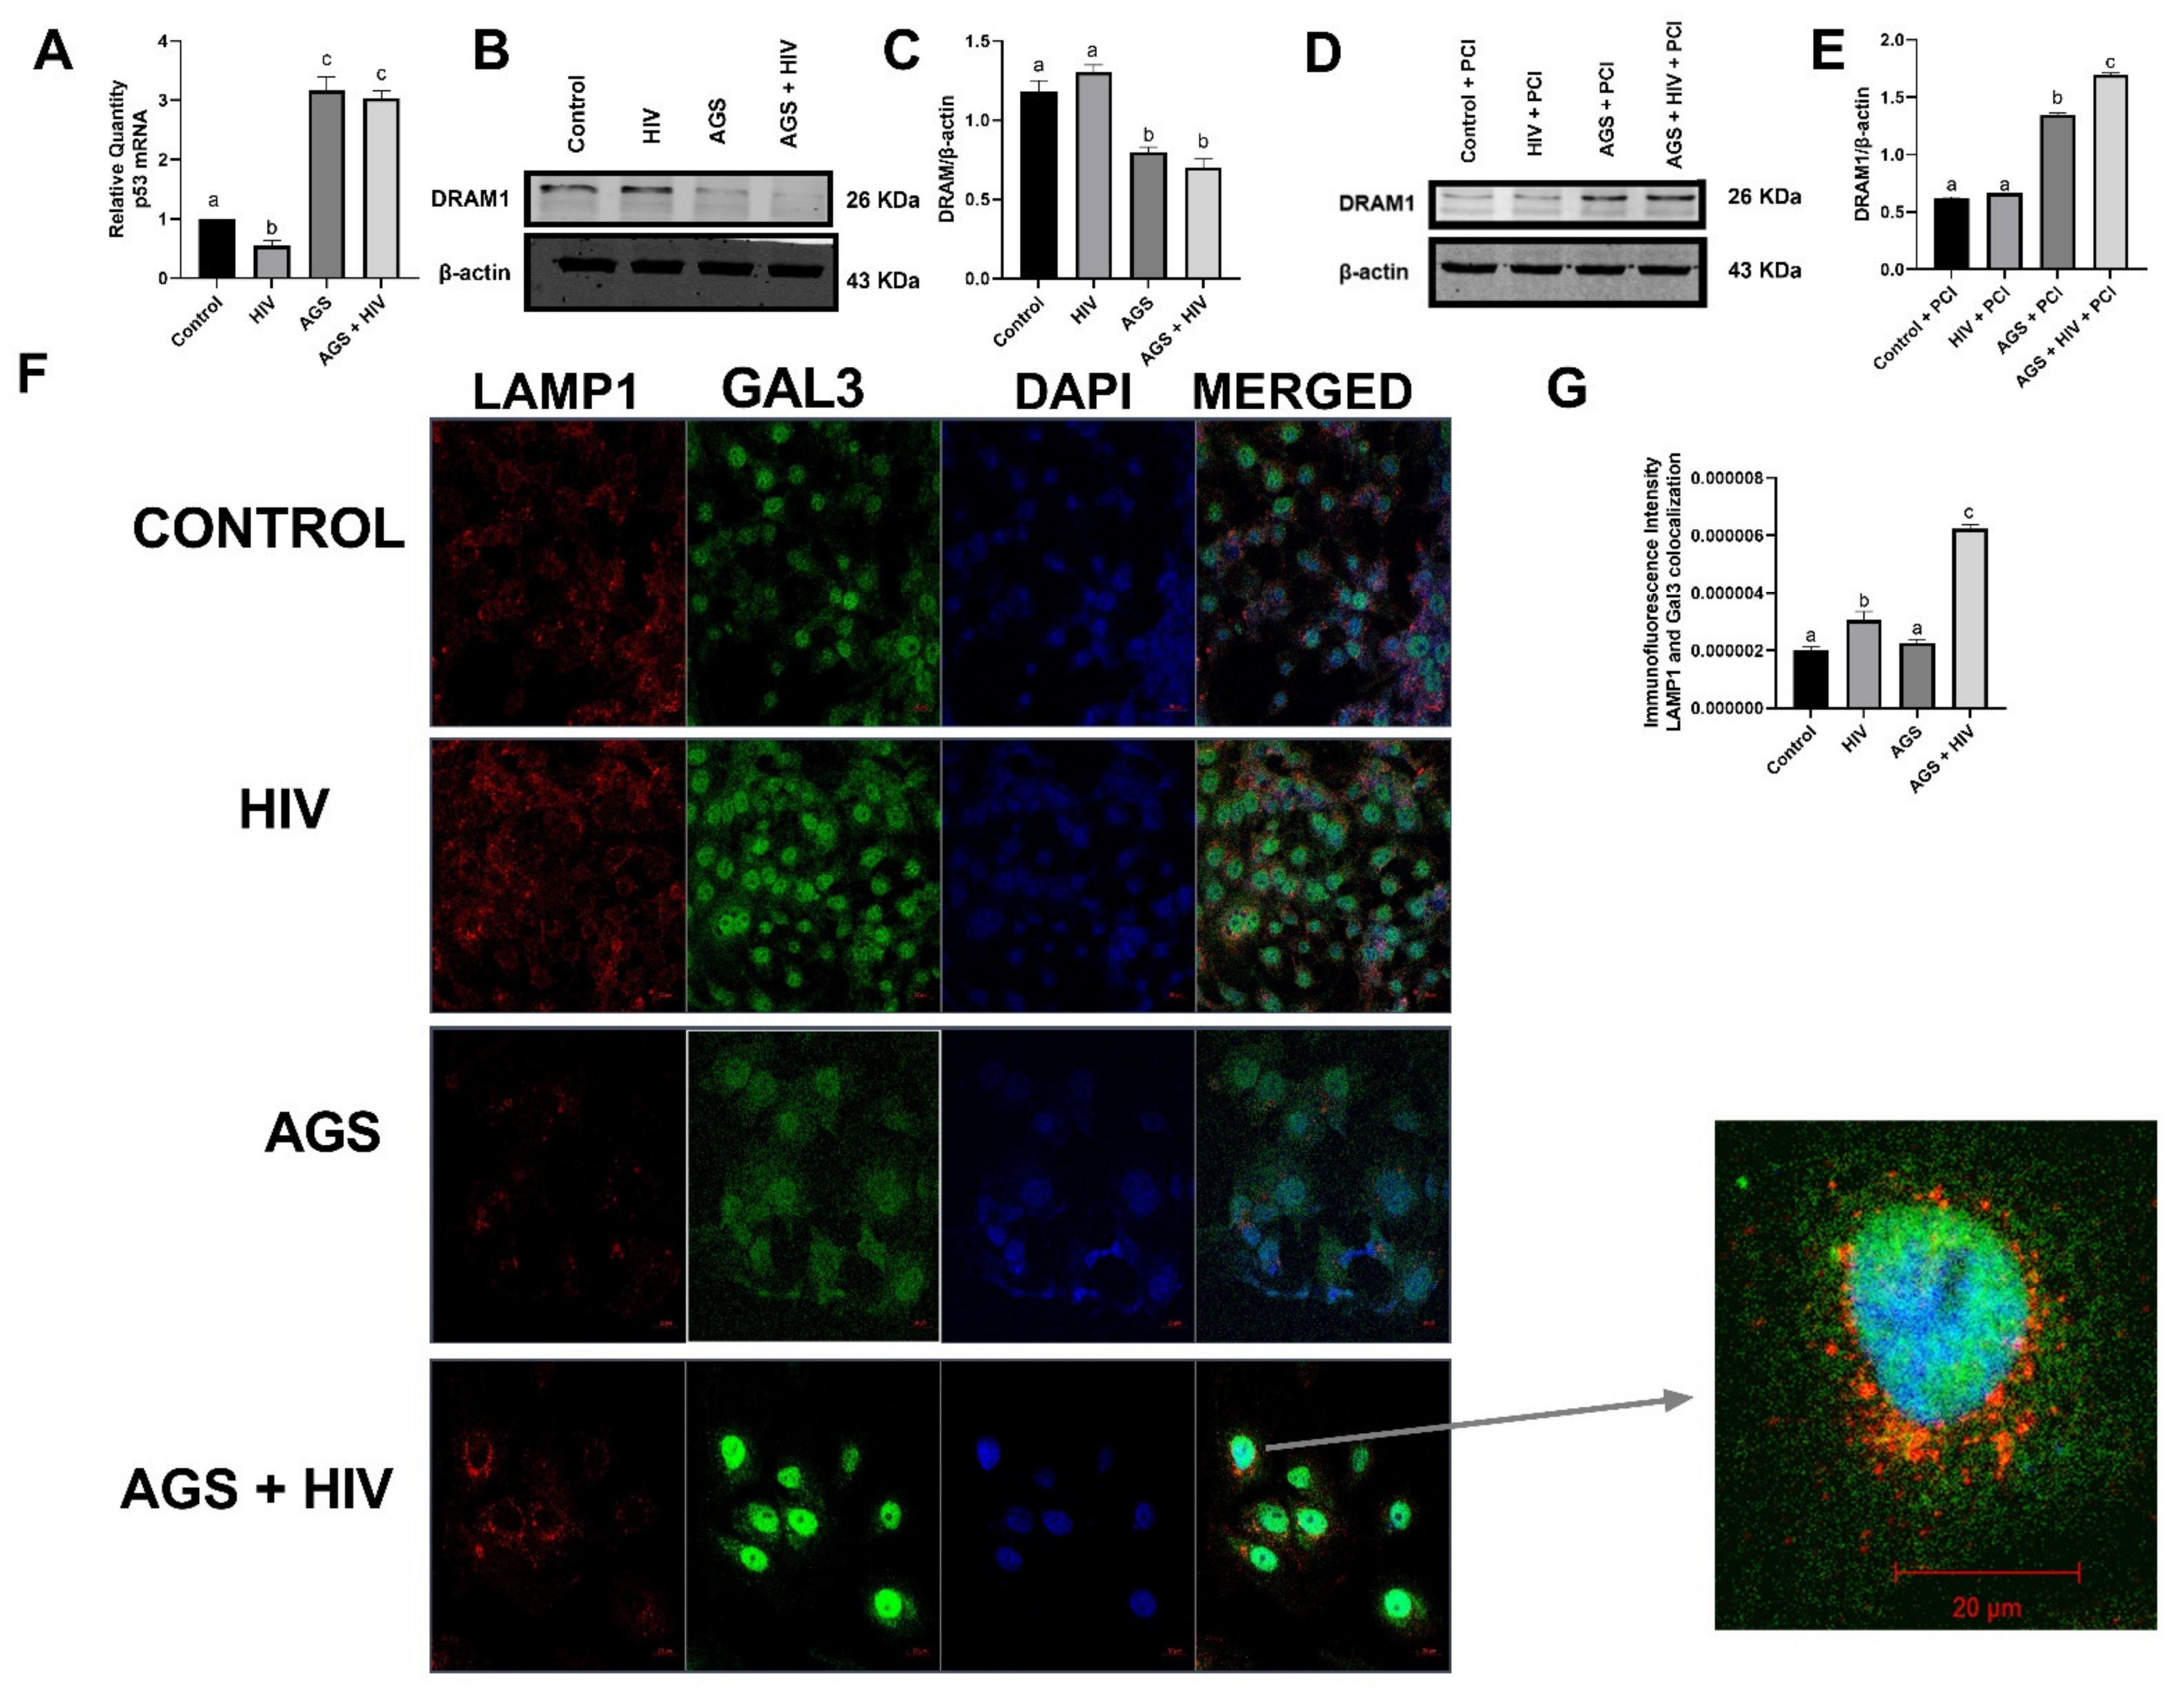
| p53 mRNA | AGS | Figure 2A |
| DRAM1 | AGS + HIV | Figure 2D,E |
| LAMP1 + Galectin 3 immunostaining | AGS + HIV | Figure 2F,G |
| Cathepsin B restoration by NAC | AGS + HIV—higher magnitude | Figure 3A |
| Cathepsin L restoration by NAC | AGS + HIV—higher magnitude | Figure 3B |
| M30 | AGS + HIV | Figure 3C |
| Tom20 + Cathepsin B immunostaining | AGS + HIV | Figure 4A,B |
| Cleaved caspase 3 | AGS + HIV | Figure 4C,D |
| Nuclear TFEB/Cyto TFEB | AGS + HIV | Figure 5A,B |
| PTFEB (S211) | AGS | Figure 5D,E |
| Acetylated Tubulin | AGS | Figure 5H,I |
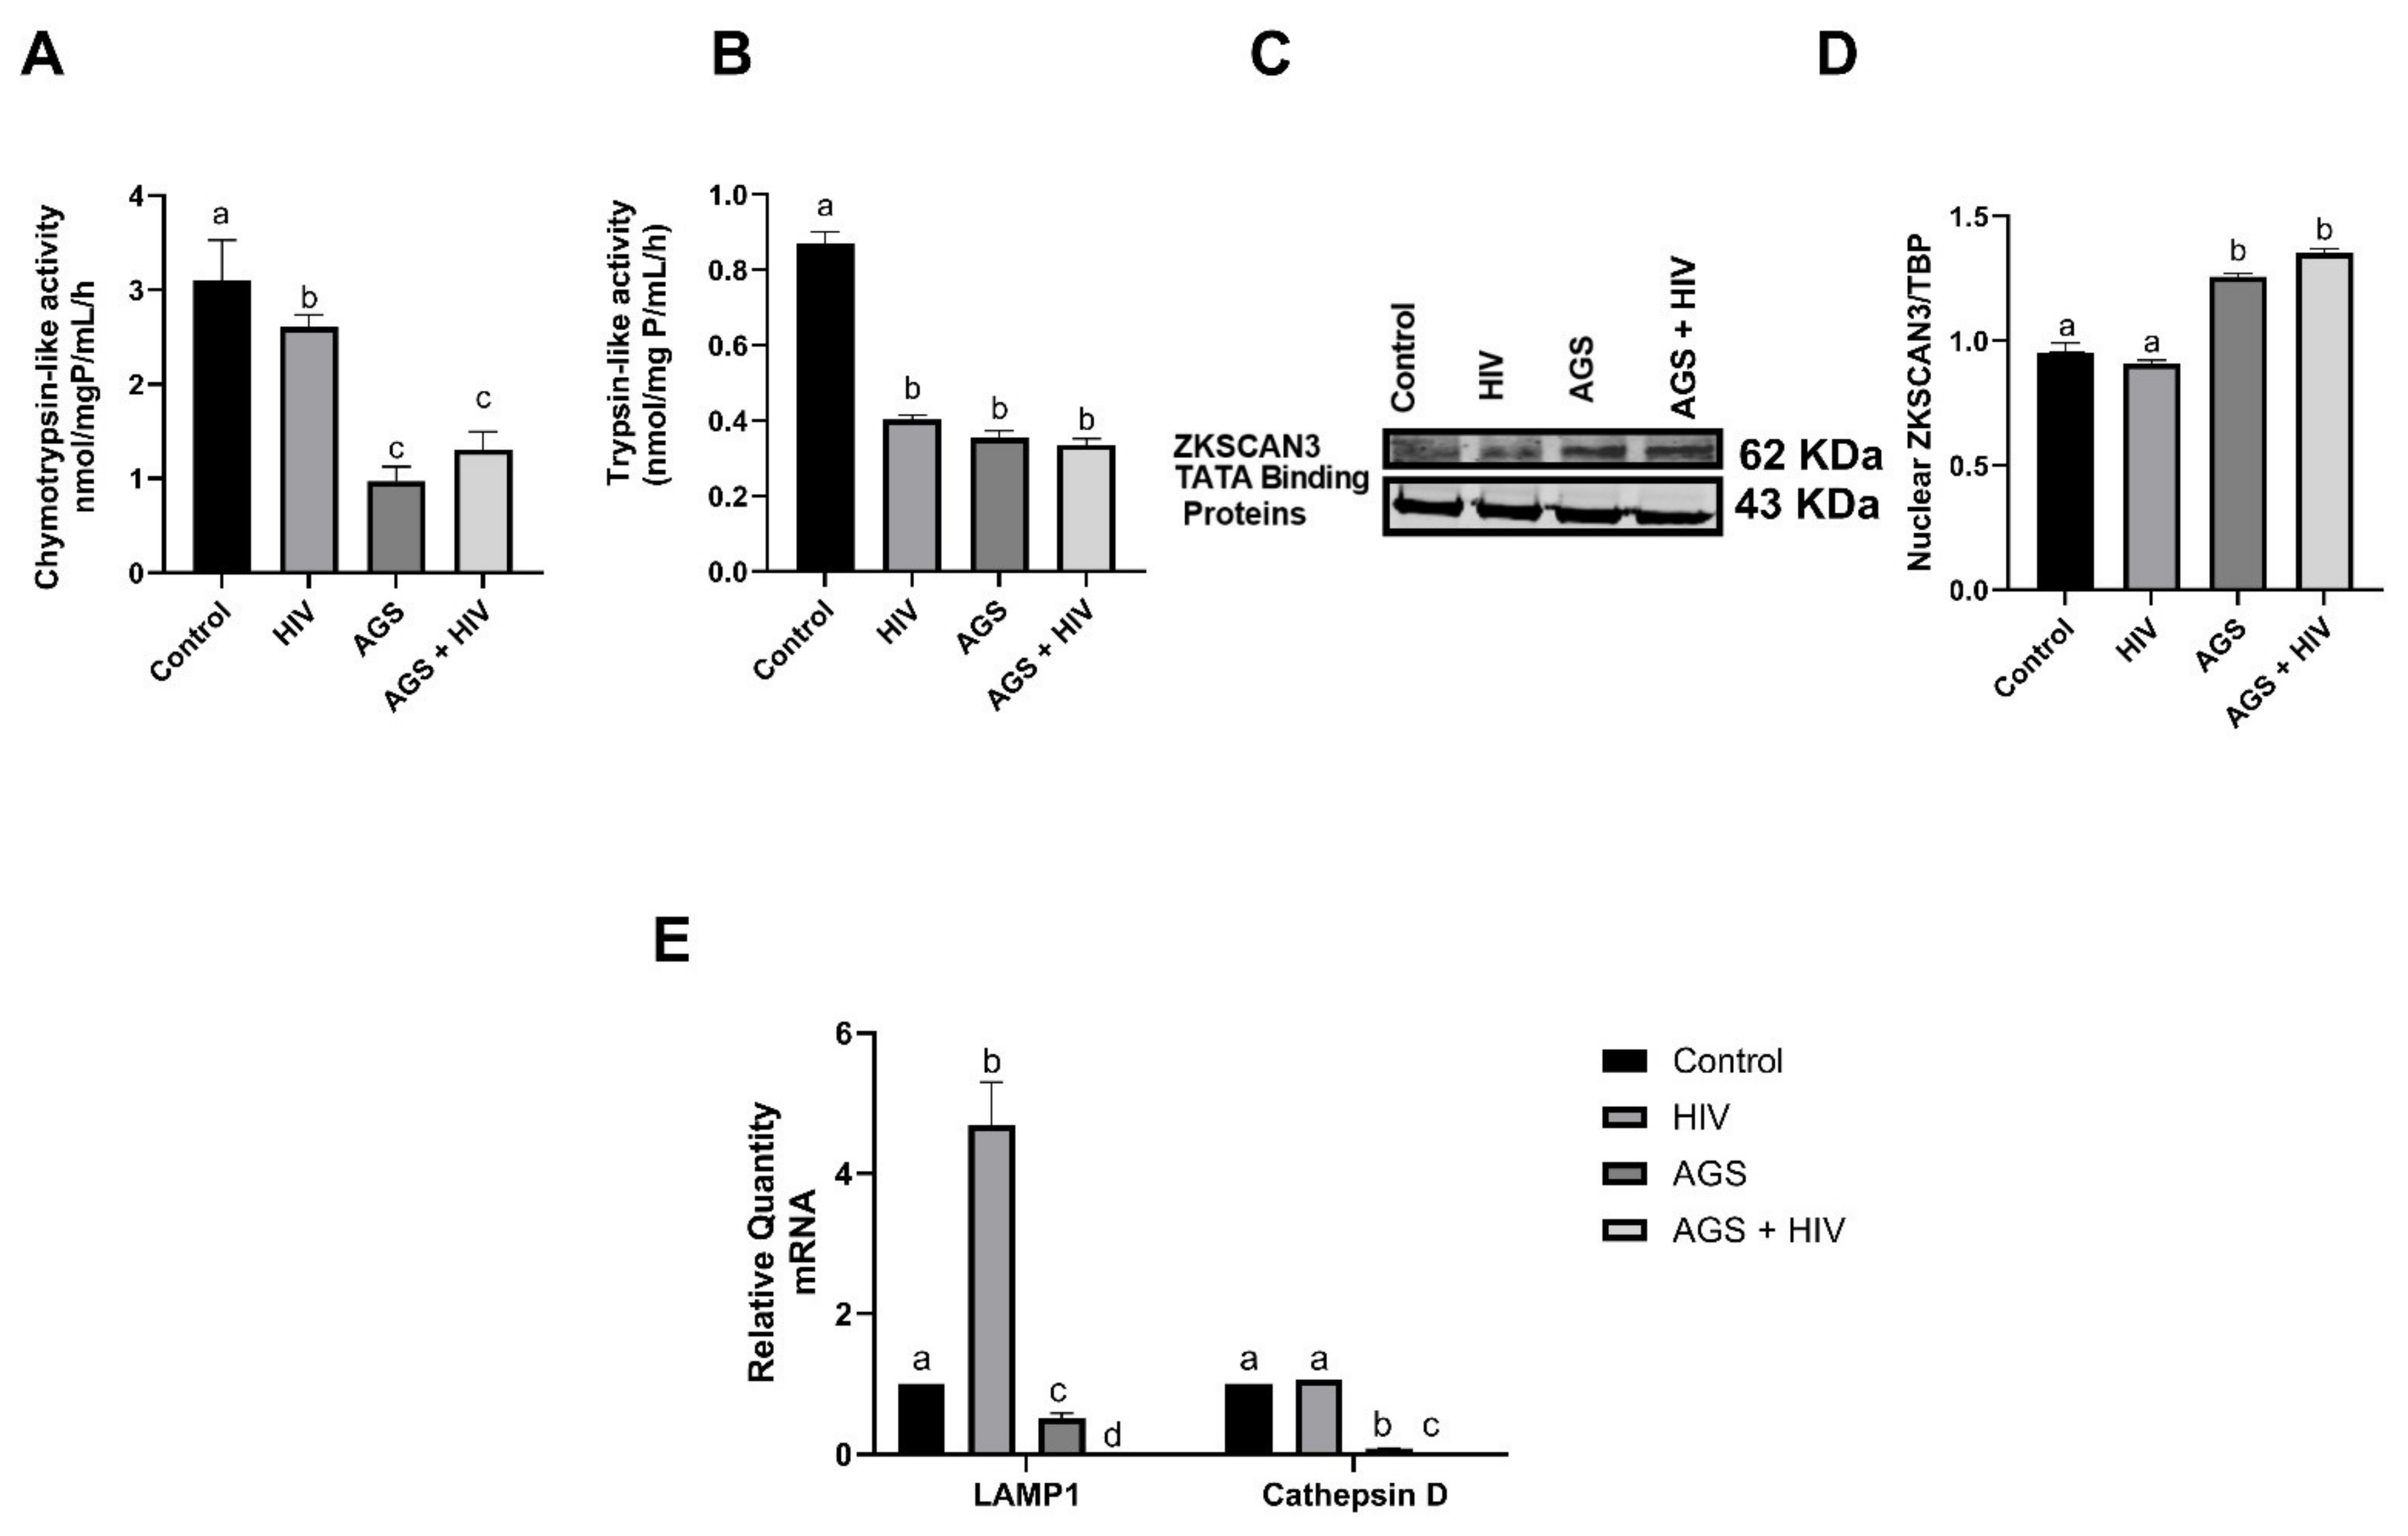
| Chymotrypsin-like activity | AGS | Figure 6A |
| Trypsin-like activity | AGS | Figure 6B |
| ZKSCAN3 | AGS | Figure 6C,D |
| LAMP1 mRNA | AGS + HIV | Figure 6E |
| Cathepsin D | AGS + HIV | Figure 6E |
Publisher’s Note: MDPI stays neutral with regard to jurisdictional claims in published maps and institutional affiliations. |
© 2021 by the authors. Licensee MDPI, Basel, Switzerland. This article is an open access article distributed under the terms and conditions of the Creative Commons Attribution (CC BY) license (https://creativecommons.org/licenses/by/4.0/).
Share and Cite
New-Aaron, M.; Thomes, P.G.; Ganesan, M.; Dagur, R.S.; Donohue, T.M., Jr.; Kusum, K.K.; Poluektova, L.Y.; Osna, N.A. Alcohol-Induced Lysosomal Damage and Suppression of Lysosome Biogenesis Contribute to Hepatotoxicity in HIV-Exposed Liver Cells. Biomolecules 2021, 11, 1497. https://doi.org/10.3390/biom11101497
New-Aaron M, Thomes PG, Ganesan M, Dagur RS, Donohue TM Jr., Kusum KK, Poluektova LY, Osna NA. Alcohol-Induced Lysosomal Damage and Suppression of Lysosome Biogenesis Contribute to Hepatotoxicity in HIV-Exposed Liver Cells. Biomolecules. 2021; 11(10):1497. https://doi.org/10.3390/biom11101497
Chicago/Turabian StyleNew-Aaron, Moses, Paul G. Thomes, Murali Ganesan, Raghubendra Singh Dagur, Terrence M. Donohue, Jr., Kharbanda K. Kusum, Larisa Y. Poluektova, and Natalia A. Osna. 2021. "Alcohol-Induced Lysosomal Damage and Suppression of Lysosome Biogenesis Contribute to Hepatotoxicity in HIV-Exposed Liver Cells" Biomolecules 11, no. 10: 1497. https://doi.org/10.3390/biom11101497