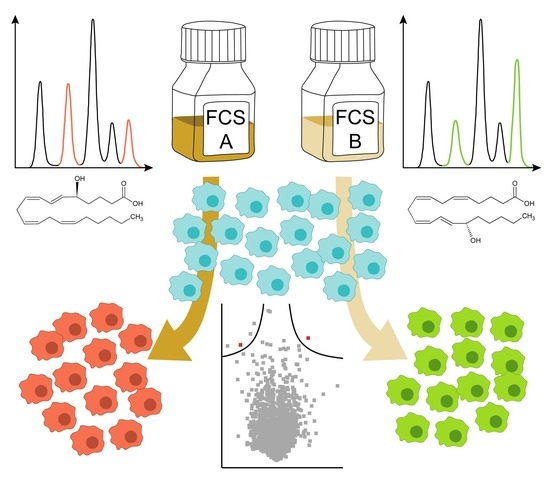
Eicosanoid Content in Fetal Calf Serum Accounts for Reproducibility Challenges in Cell Culture

 , , , and
Abstract
:
1. Introduction
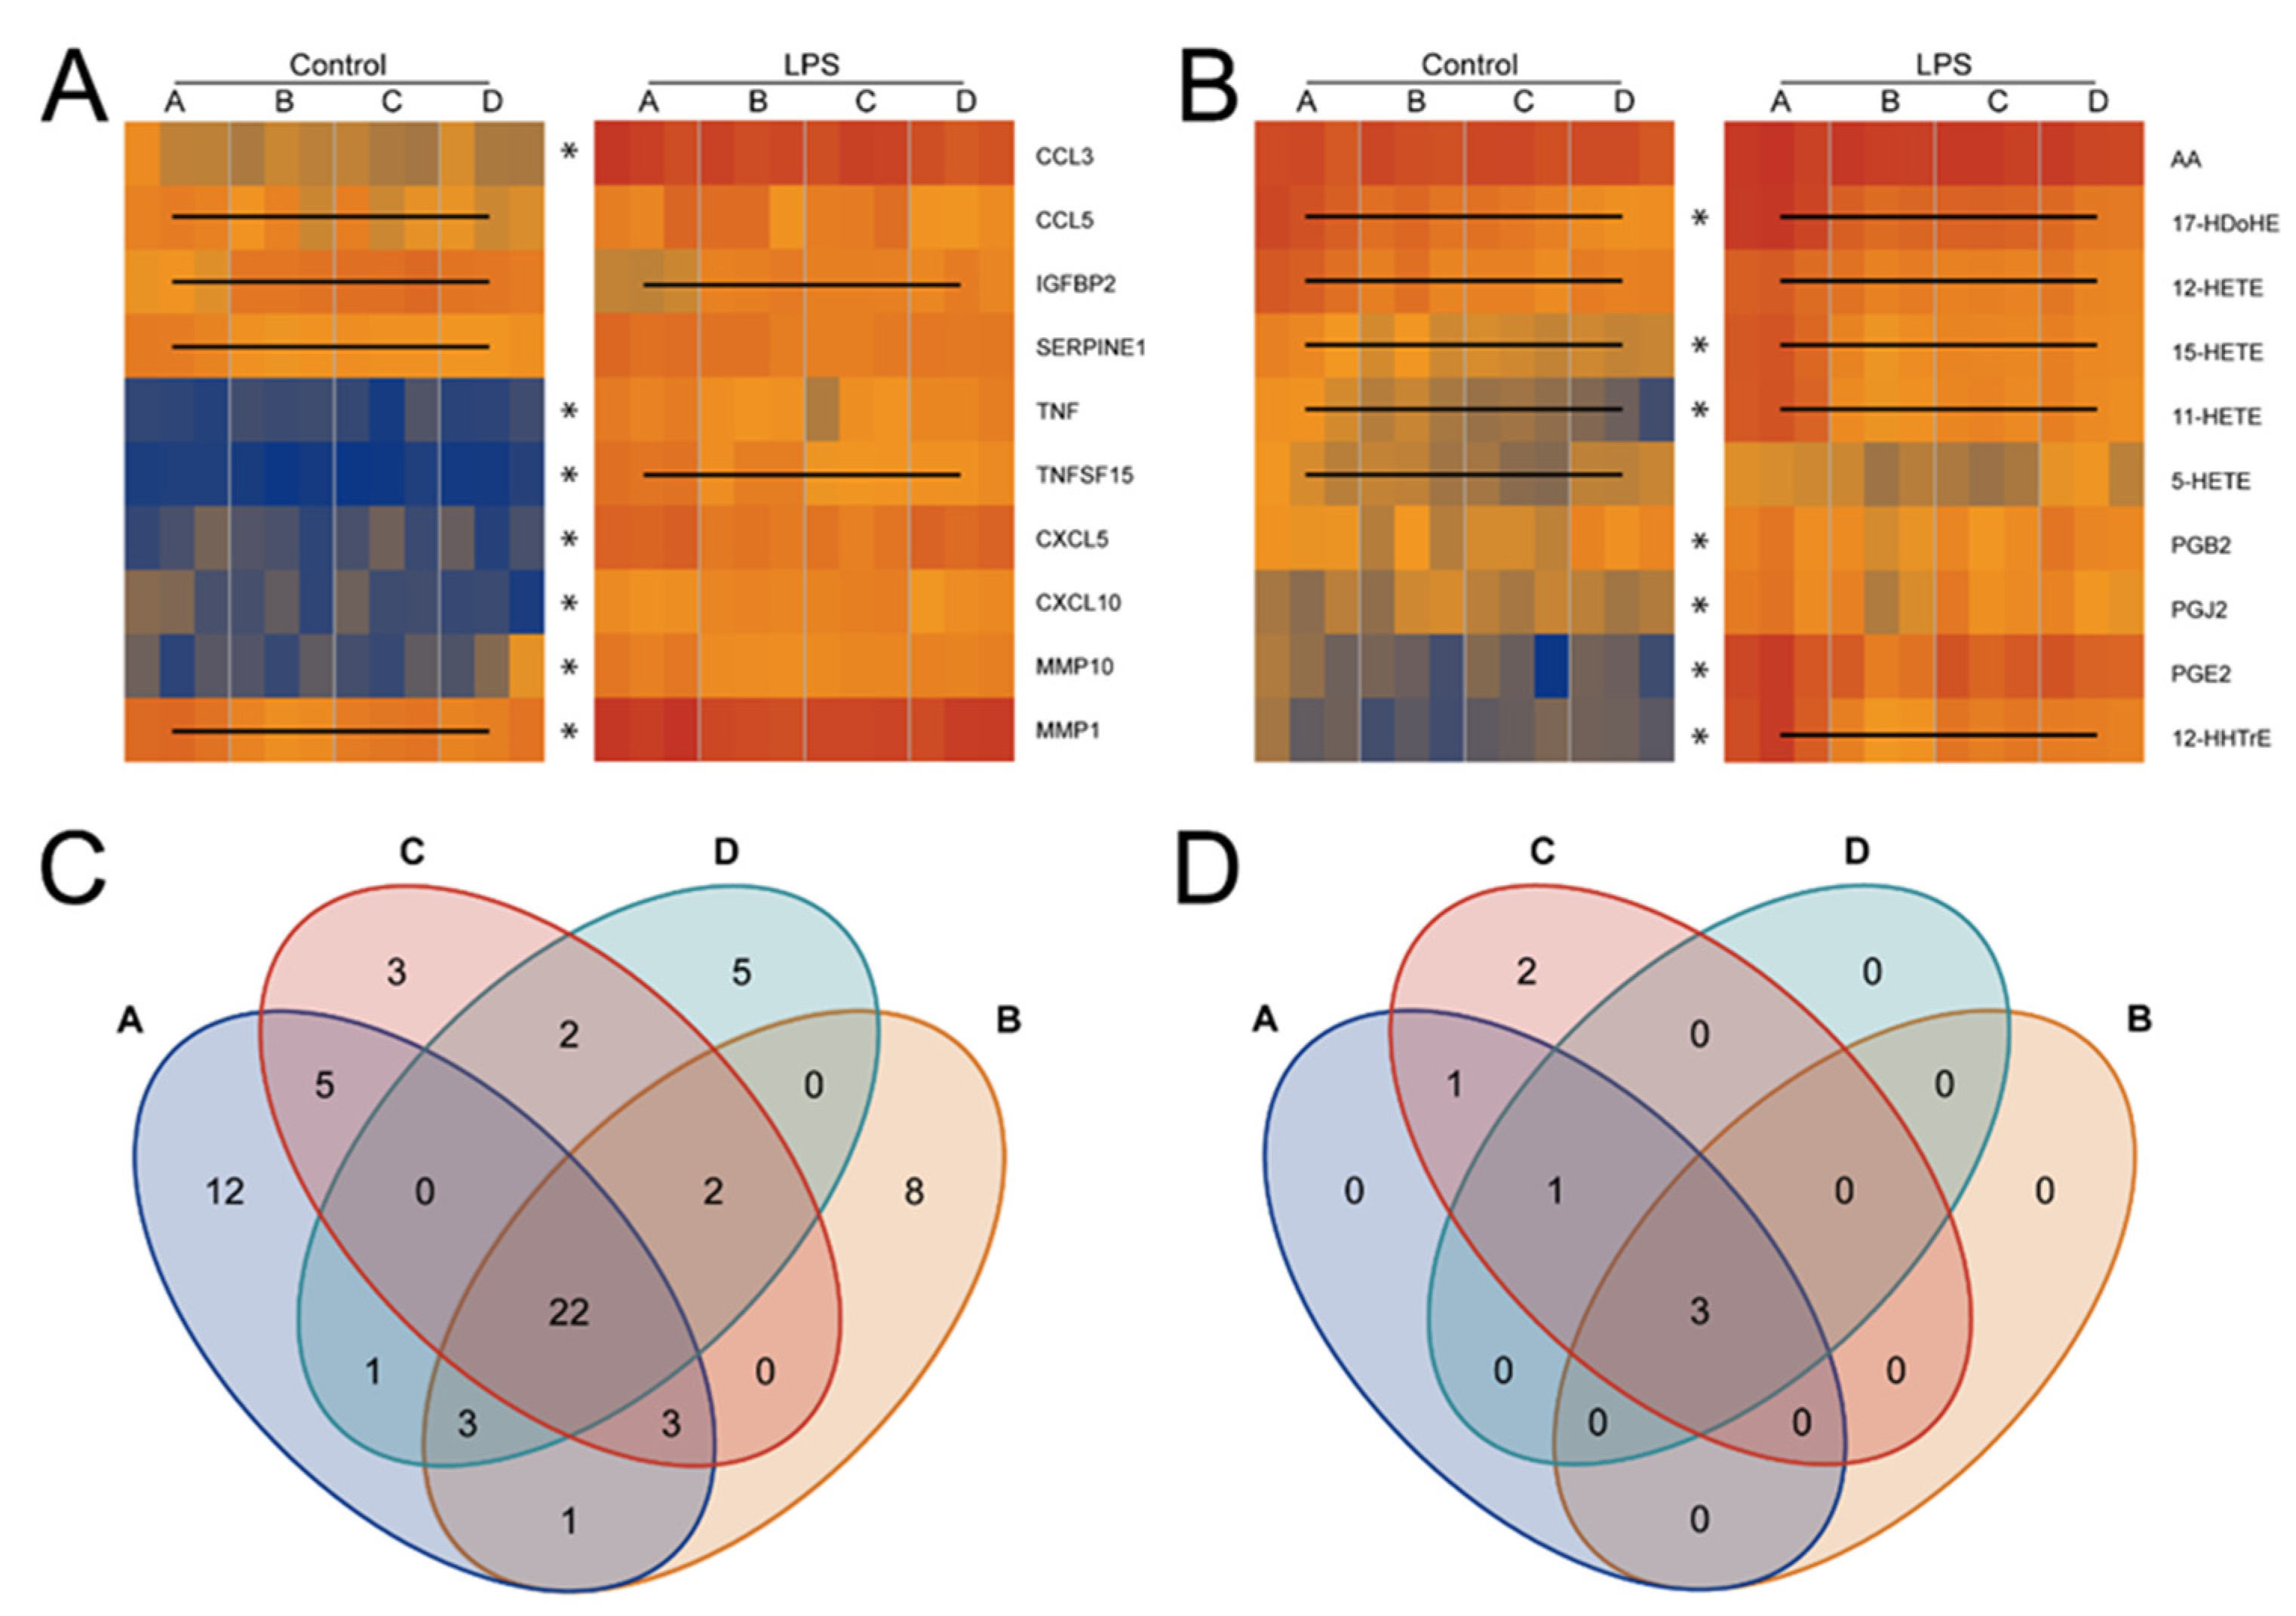
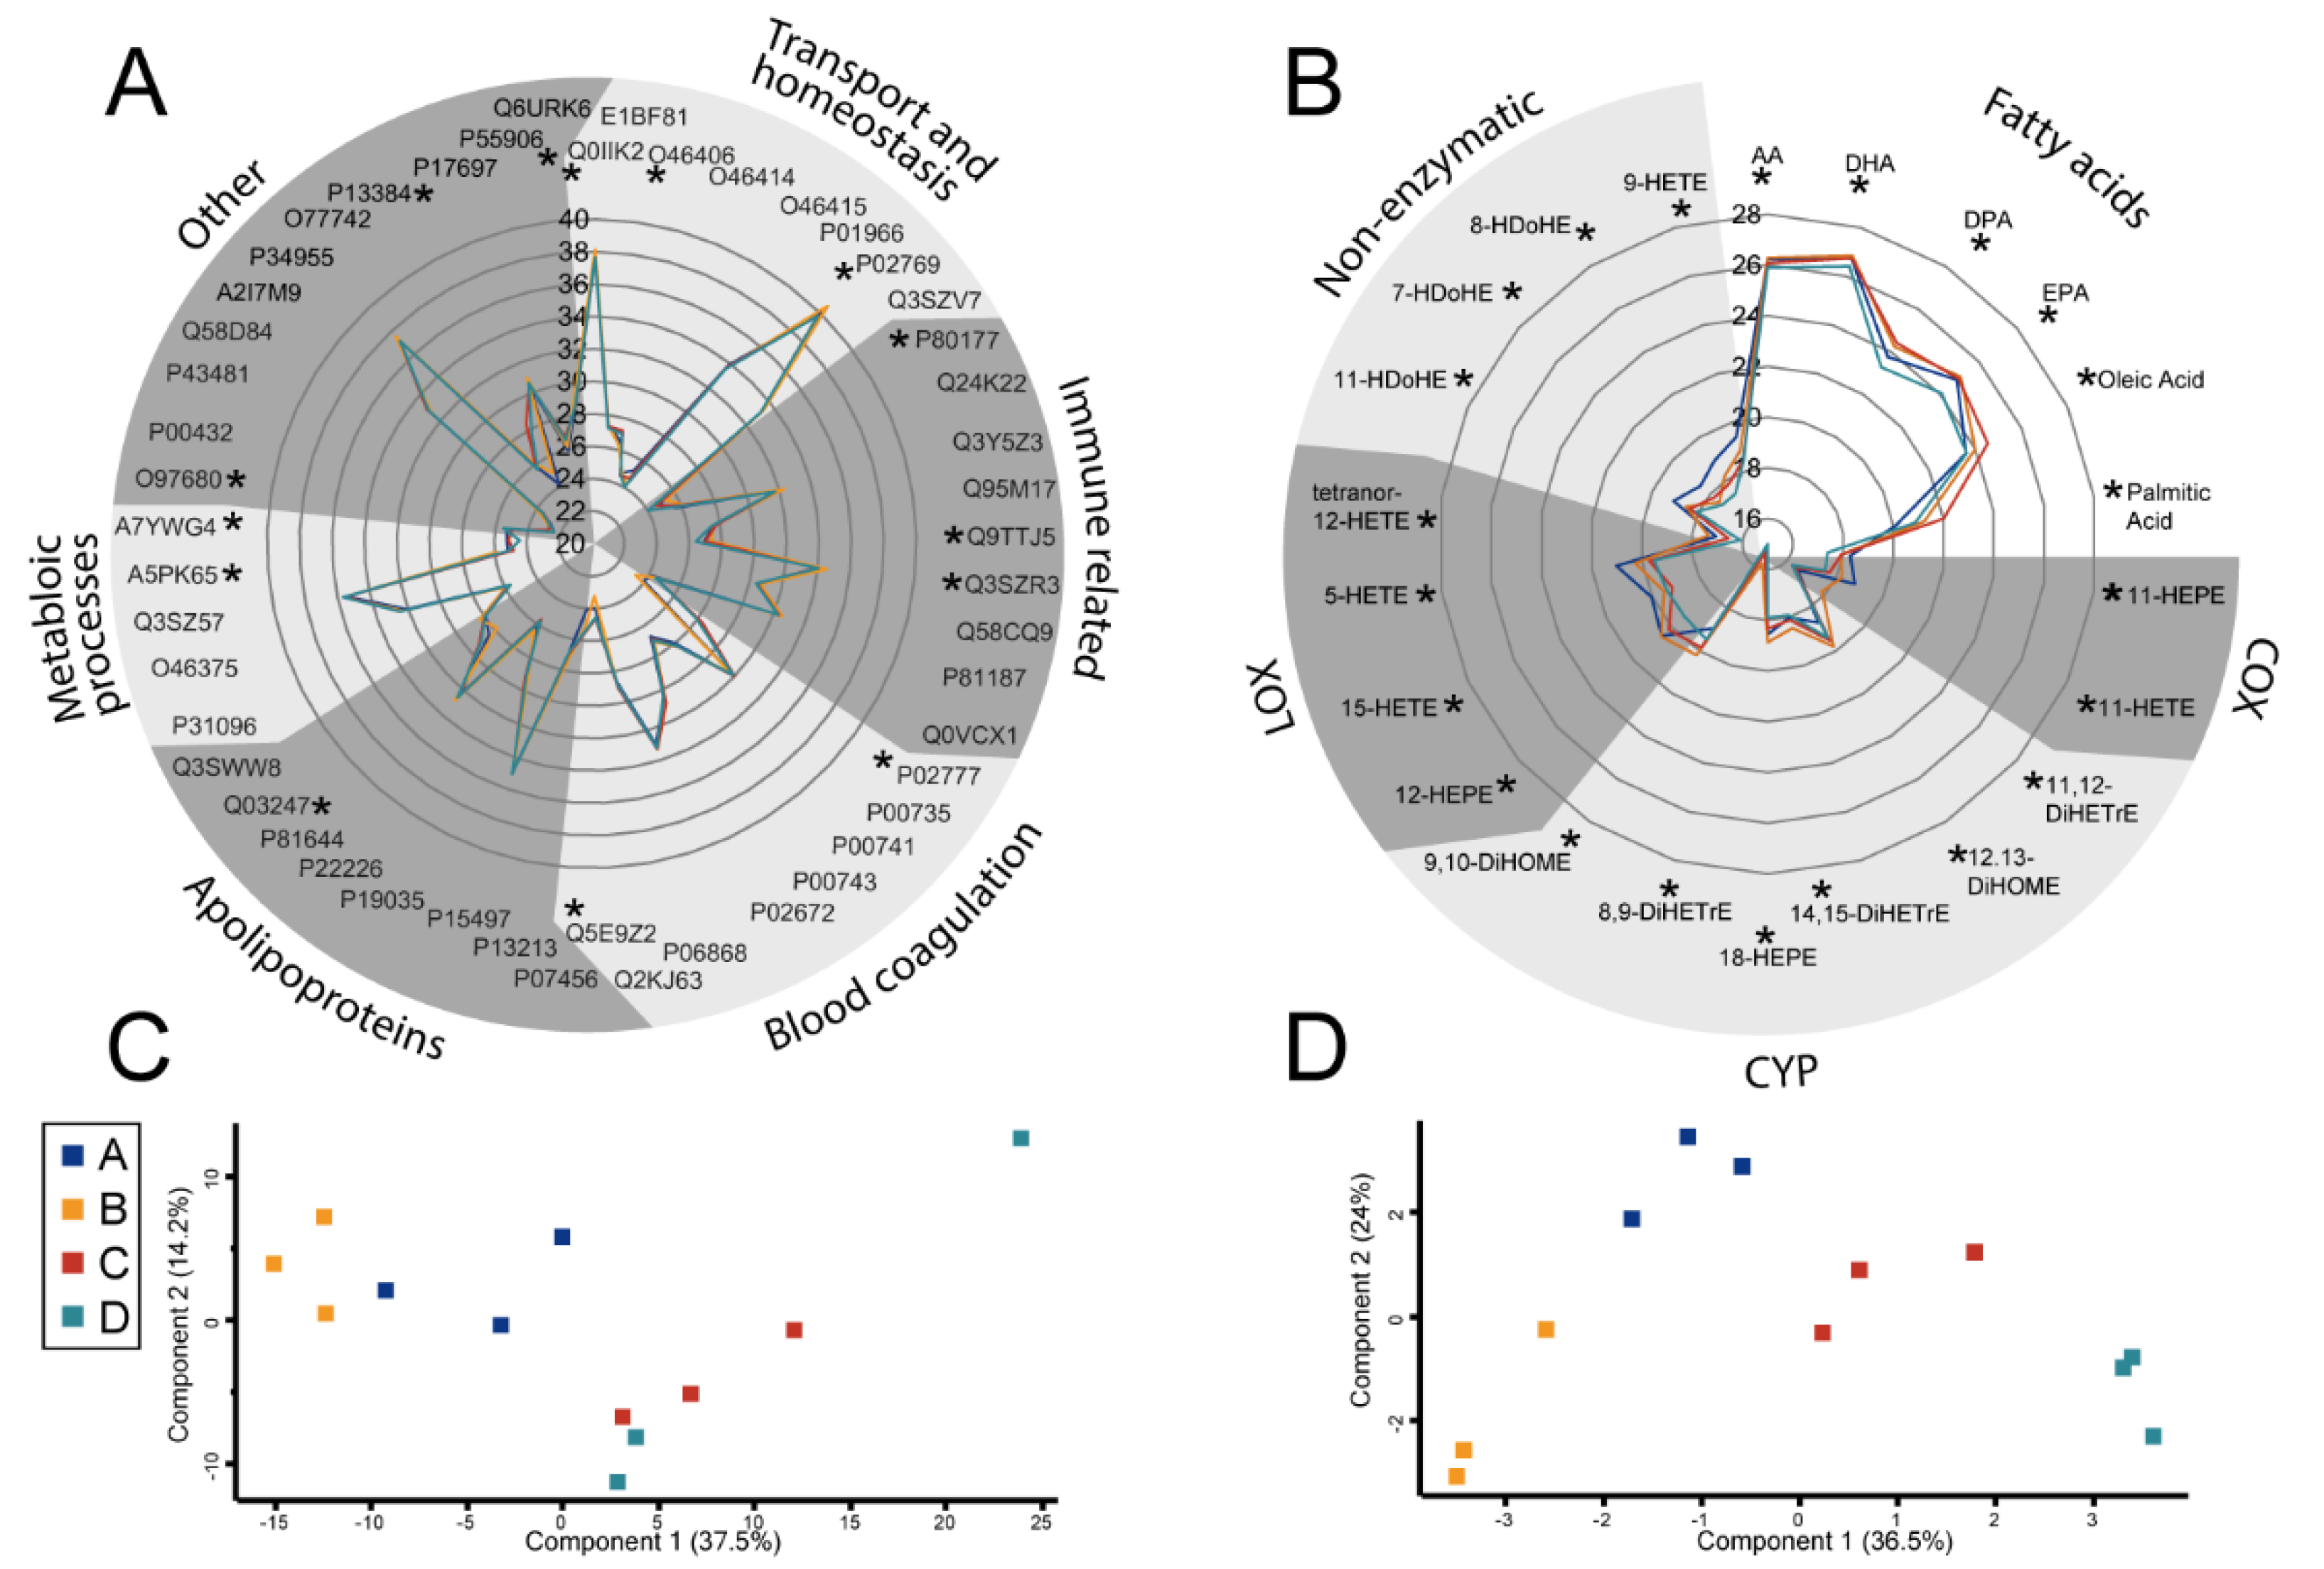
2. Results
2.1. The Eicosanoid Content of FCS Varies in a Batch-Dependent Fashion
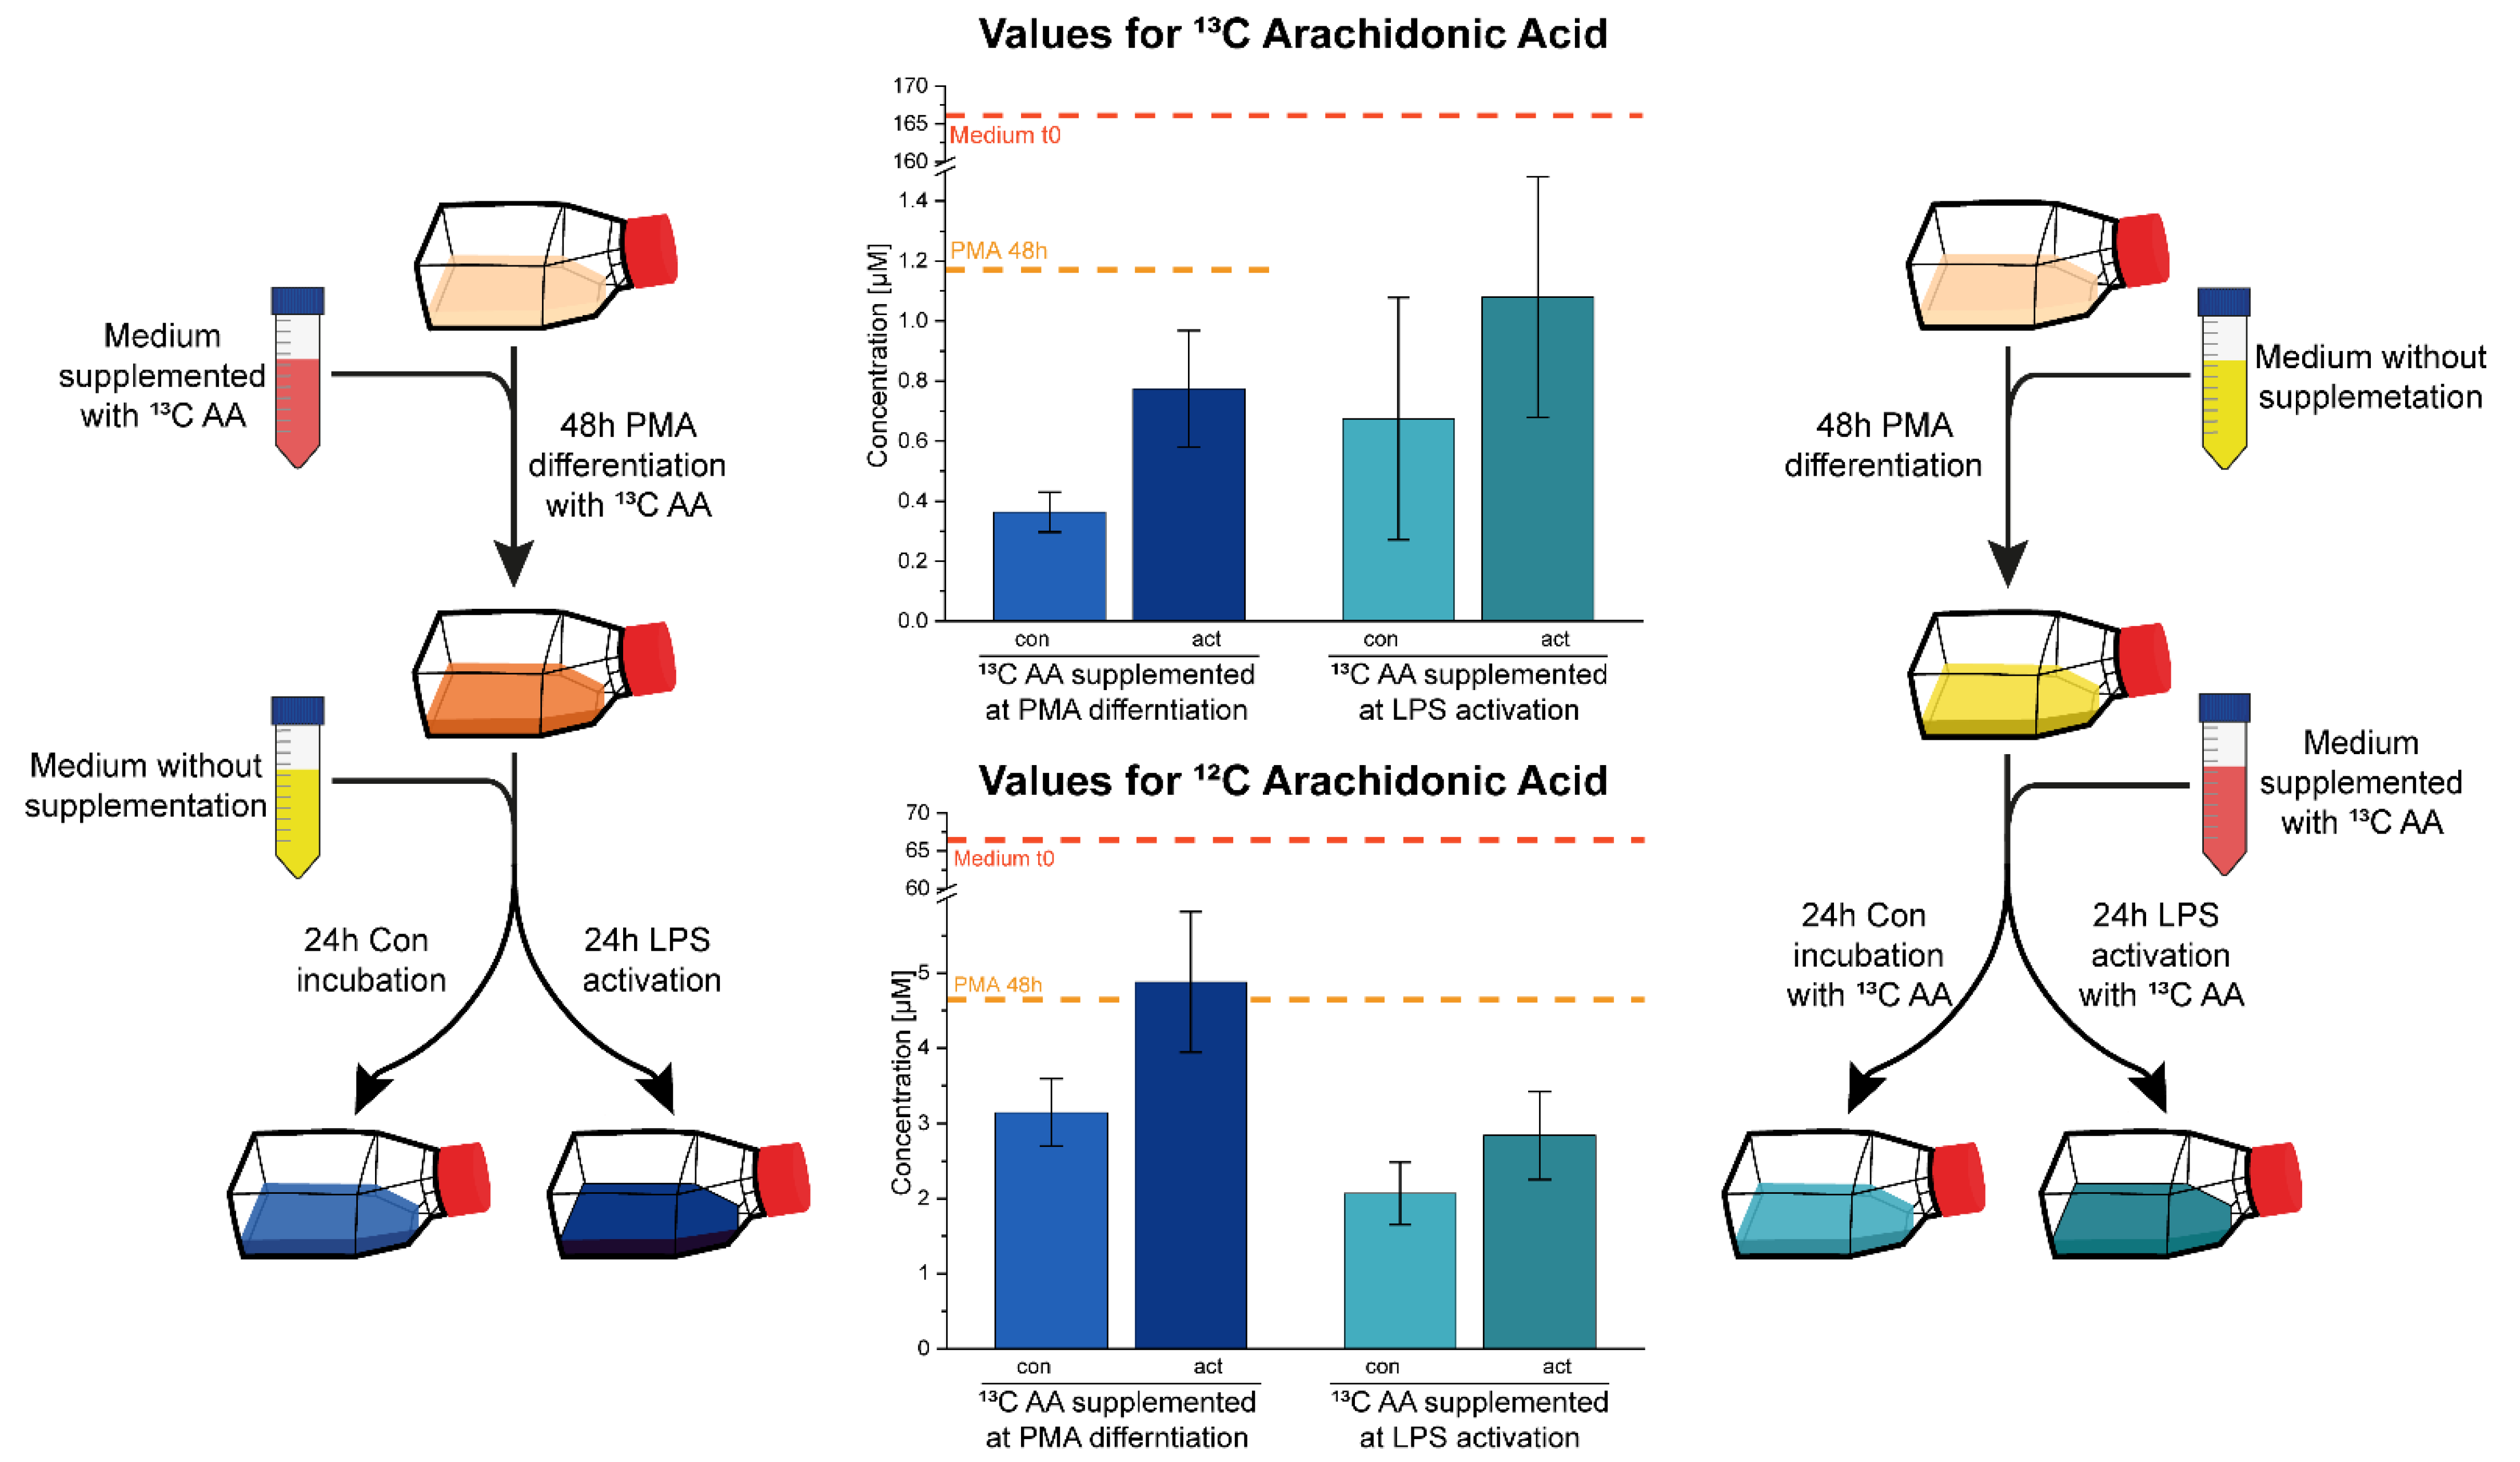
2.2. Cell Culture Subjects Fatty Acids to a High Turnover
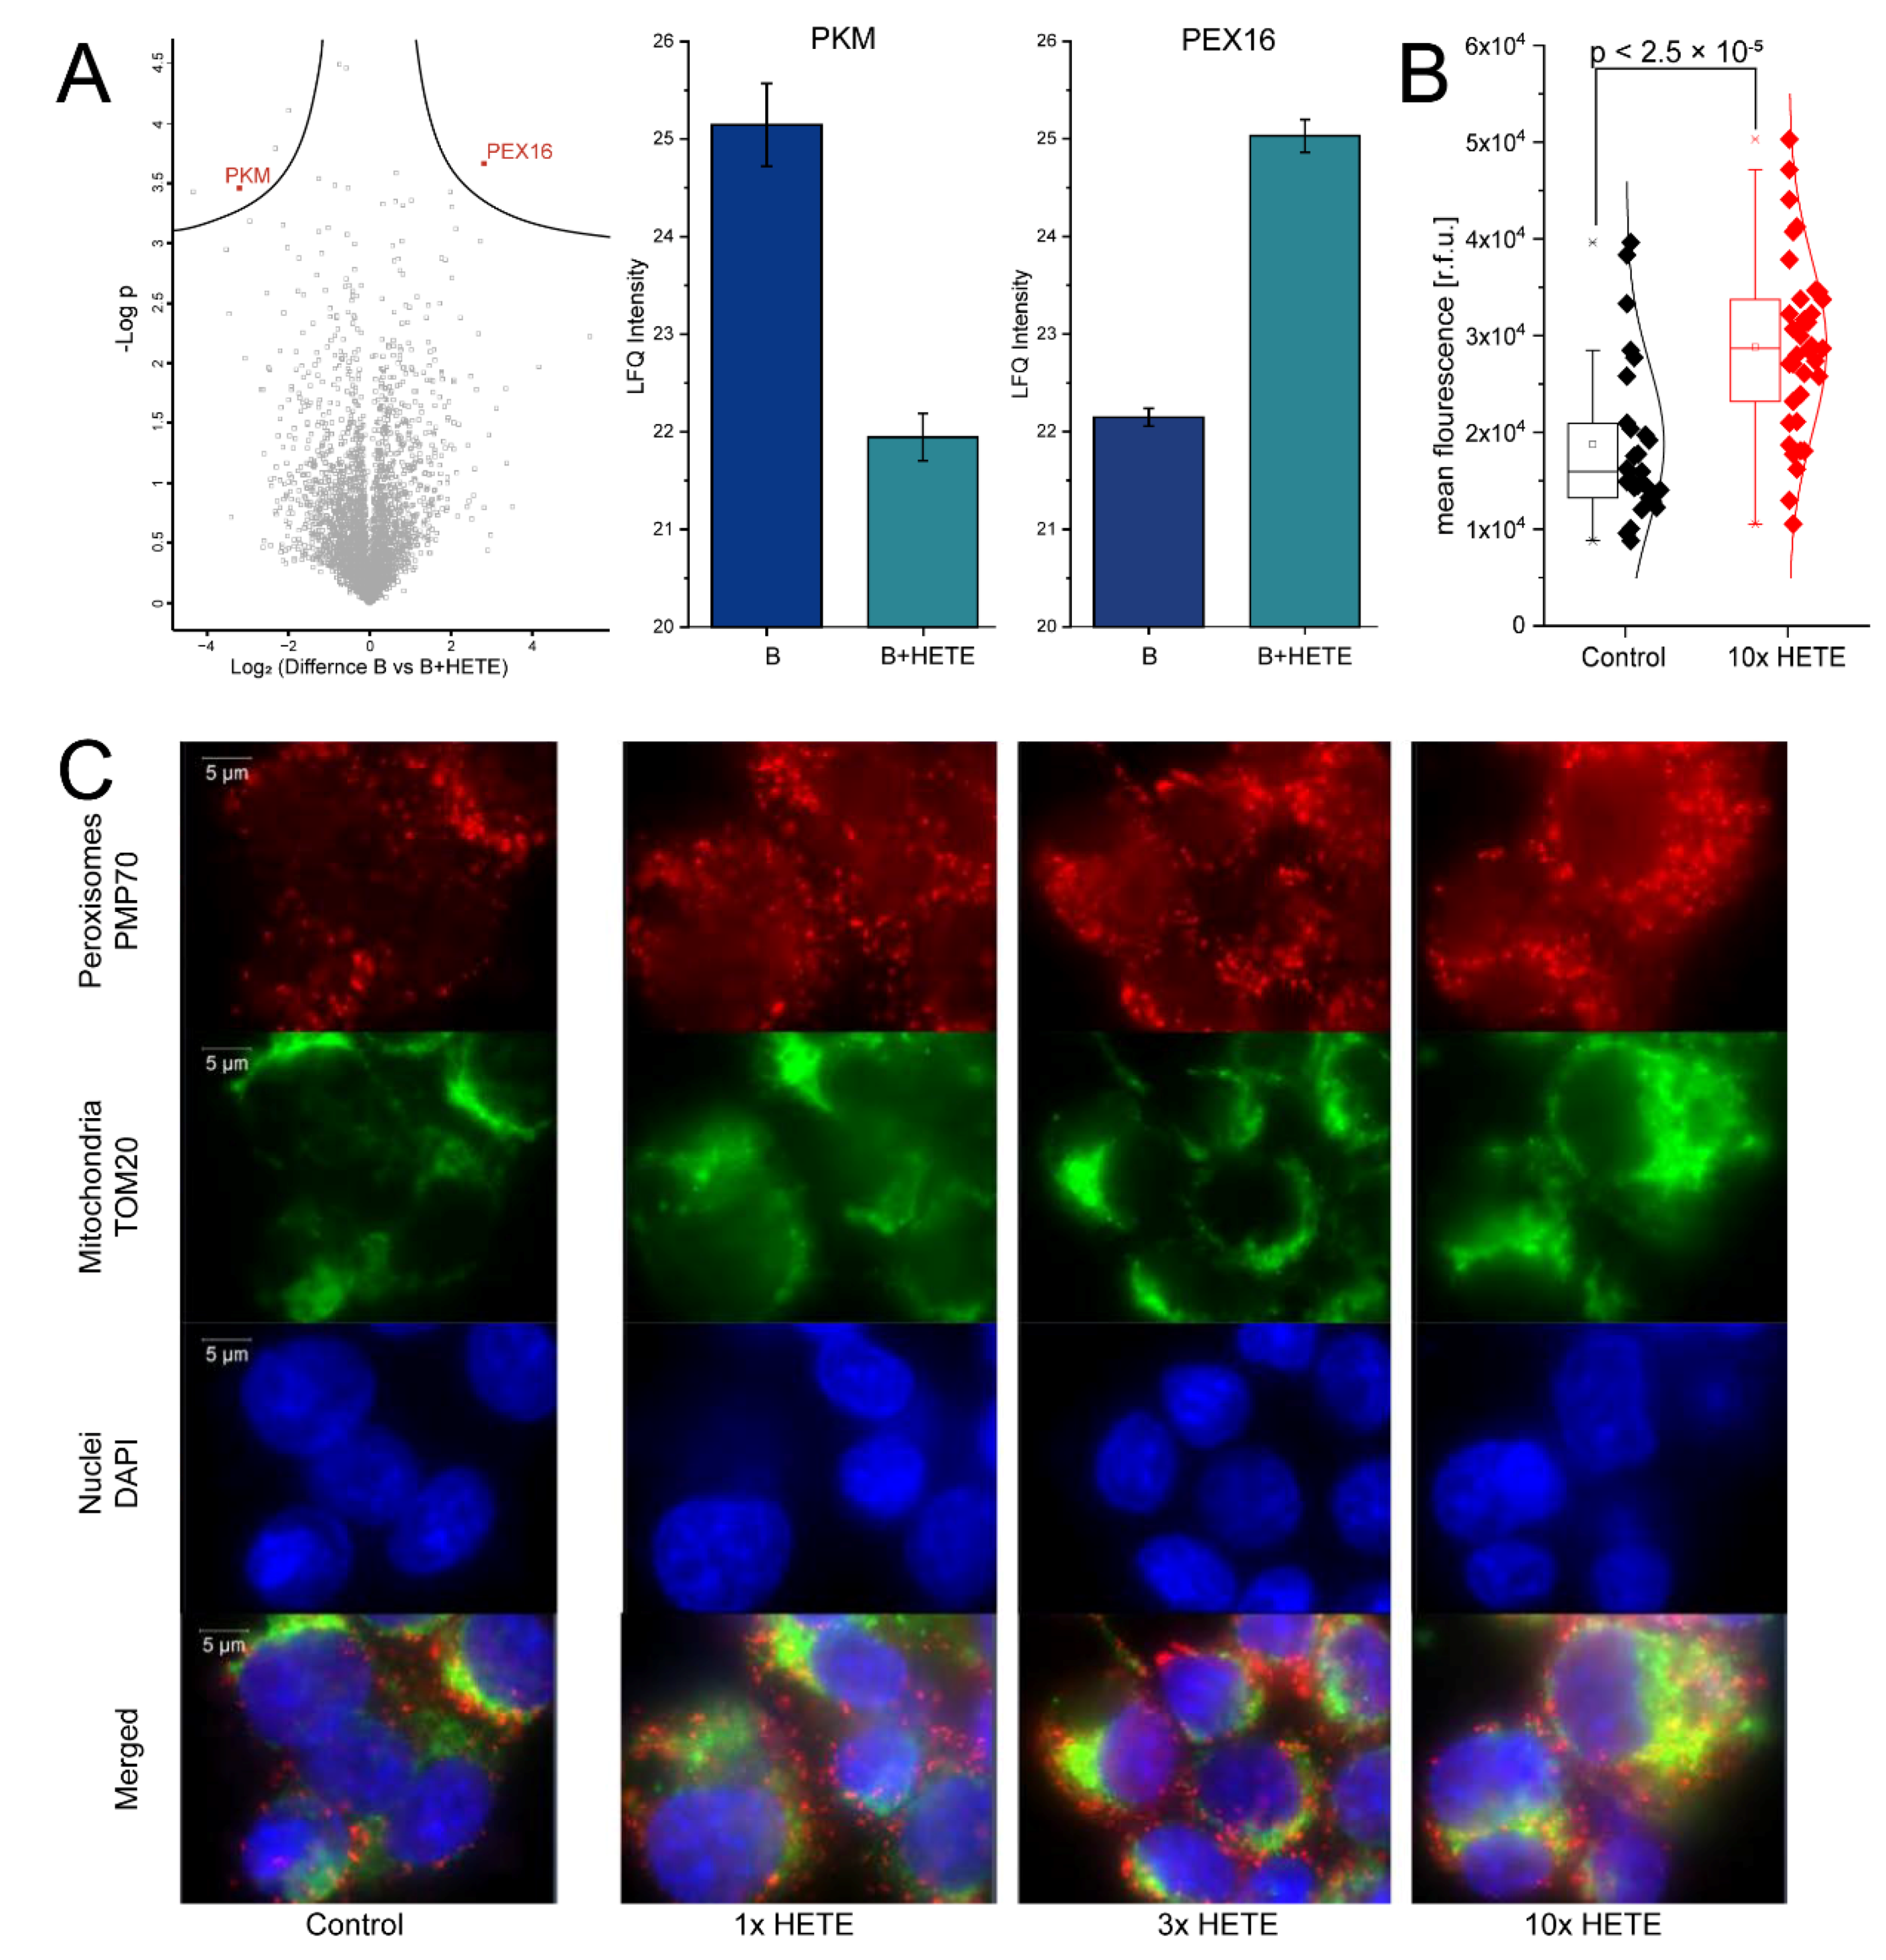
2.3. Supplementation of 5-HETE and 15-HETE in the Nanomolar Concentration Range Induces the Formation of Peroxisomes in U937 Macrophages
3. Discussion
4. Conclusions and Outlook
5. Materials and Methods
5.1. Cell Culture
5.2. Differentiation with Phorbol 12-Myristate 13-Acetate (PMA) and Inflammatory Activation with Lipopolysaccharides (LPS)
5.3. Test of Different FCS Batches
5.4. C13 Labelled Arachidonic Acid
5.5. Proteomics of Supernatant (SN), Cytoplasm (CYT), and Nuclear Extract (NE)
5.6. HPLC-MS/MS for Proteomics
5.7. Proteomics Data Analysis
5.8. Eicosanoid Sample Preparation
5.9. UHPLC-MS/MS for Eicosanoid Measurements
5.10. Immunofluorescence
5.11. Differentiation Status by Flow Cytometry
Supplementary Materials
Author Contributions
Funding
Data Availability Statement
Acknowledgments
Conflicts of Interest
Abbreviations
| AA | Arachidonic acid |
| FCS | Fetal calf serum |
| FFA | Free fatty acids |
| CDM | Chemically defined medium |
| FBS | Fetal bovine serum |
| HETE | Hydroxyeicosatetraenoic Acid |
| LC | Liquid chromatography |
| LPS | Lipopolysaccharides |
| MS | Mass spectrometry |
| MS/MS | Tandem mass spectrometry |
| PMA | Phorbol 12-myristate 13-acetate |
| PUFA | Polyunsaturated fatty acids |
References
- Prinz, F.; Schlange, T.; Asadullah, K. Believe it or not: How much can we rely on published data on potential drug targets? Nat. Rev. Drug Discov. 2011, 10, 712. [Google Scholar] [CrossRef] [PubMed] [Green Version]
- Baker, M. Reproducibility: Respect your cells! Nature 2016, 537, 433–435. [Google Scholar] [CrossRef] [PubMed]
- Wolfensohn, S. A review of the contributions of cross-discipline collaborative European IMI/EFPIA research projects to the development of Replacement, Reduction and Refinement strategies. Altern. Lab. Anim. 2018, 46, 91–102. [Google Scholar] [CrossRef] [PubMed]
- Del Favero, G.; Kraegeloh, A. Integrating Biophysics in Toxicology. Cells 2020, 9, 1282. [Google Scholar] [CrossRef] [PubMed]
- Freedman, L.P.; Cockburn, I.M.; Simcoe, T.S. The Economics of Reproducibility in Preclinical Research. PLoS Biol. 2015, 13, e1002165. [Google Scholar] [CrossRef]
- Ben-David, U.; Siranosian, B.; Ha, G.; Tang, H.; Oren, Y.; Hinohara, K.; Strathdee, C.A.; Dempster, J.; Lyons, N.J.; Burns, R.; et al. Genetic and transcriptional evolution alters cancer cell line drug response. Nature 2018, 560, 325–330. [Google Scholar] [CrossRef]
- Liu, Y.; Yang, M.; Mueller, T.; Kreibich, S.; Williams, E.G.; Van Drogen, A.; Borel, C.; Frank, M.; Germain, P.; Bludau, I.; et al. Multi-omic measurements of heterogeneity in HeLa cells across laboratories. Nat. Biotechnol. 2019, 37, 314–322. [Google Scholar] [CrossRef]
- Gstraunthaler, G.; Lindl, T.; van der Valk, J. A plea to reduce or replace fetal bovine serum in cell culture media. Cytotechnology 2013, 65, 791–793. [Google Scholar] [CrossRef] [Green Version]
- van der Valk, J.; Bieback, K.; Buta, C.; Cochrane, B.; Dirks, W.; Fu, J.; Hickman, J.; Hohensee, C.; Kolar, R.; Liebsch, M.; et al. Fetal Bovine Serum (FBS): Past–Present–Future. ALTEX 2018, 35, 99–118. [Google Scholar] [CrossRef] [Green Version]
- Sikora, M.J.; Johnson, M.D.; Lee, A.V.; Oesterreich, S. Endocrine Response Phenotypes Are Altered by Charcoal-Stripped Serum Variability. Endocrinology 2016, 157, 3760–3766. [Google Scholar] [CrossRef] [Green Version]
- Dennis, E.A.; Norris, P.C. Eicosanoid storm in infection and inflammation. Nat. Rev. Immunol. 2015, 15, 511–523. [Google Scholar] [CrossRef] [PubMed] [Green Version]
- Tahir, A.; Bileck, A.; Muqaku, B.; Niederstaetter, L.; Kreutz, D.; Mayer, R.L.; Wolrab, D.; Meier-Menches, S.M.; Slany, A.; Gerner, C. Combined Proteome and Eicosanoid Profiling Approach for Revealing Implications of Human Fibroblasts in Chronic Inflammation. Anal. Chem. 2017, 89, 1945–1954. [Google Scholar] [CrossRef] [PubMed]
- Reichl, B.; Niederstaetter, L.; Boegl, T.; Neuditschko, B.; Bileck, A.; Gojo, J.; Buchberger, W.; Peyrl, A.; Gerner, C. Determination of a Tumor-Promoting Microenvironment in Recurrent Medulloblastoma: A Multi-Omics Study of Cerebrospinal Fluid. Cancers 2020, 12, 1350. [Google Scholar] [CrossRef] [PubMed]
- Muqaku, B.; Pils, D.; Mader, J.C.; Stefanie, A.; Mangold, A.; Muqaku, L.; Slany, A.; Del Favero, G.; Gerner, C. Neutrophil Extracellular Trap Formation Correlates with Favorable Overall Survival in High Grade Ovarian Cancer. Cancers 2020, 12, 505. [Google Scholar] [CrossRef] [Green Version]
- Sundstrom, C.; Nilsson, K. Establishment and characterization of a human histiocytic lymphoma cell line (U-937). Int. J. Cancer 1976, 17, 565–577. [Google Scholar] [CrossRef] [PubMed]
- Haque, M.A.; Jantan, I.; Harikrishnan, H. Zerumbone suppresses the activation of inflammatory mediators in LPS-stimulated U937 macrophages through MyD88-dependent NF-kappaB/MAPK/PI3K-Akt signaling pathways. Int. Immunopharmacol. 2018, 55, 312–322. [Google Scholar] [CrossRef] [PubMed]
- Tian, X.; Xie, G.; Ding, F.; Zhou, X. LPS-induced MMP-9 expression is mediated through the MAPKs-AP-1 dependent mechanism in BEAS-2B and U937 cells. Exp. Lung Res. 2018, 44, 217–225. [Google Scholar] [CrossRef]
- Kim, P.K.; Mullen, R.T.; Schumann, U.; Lippincott-Schwartz, J. The origin and maintenance of mammalian peroxisomes involves a de novo PEX16-dependent pathway from the ER. J. Cell Biol. 2006, 173, 521–532. [Google Scholar] [CrossRef] [Green Version]
- Yao, C.; Narumiya, S. Prostaglandin-cytokine crosstalk in chronic inflammation. Br. J. Pharmacol. 2019, 176, 337–354. [Google Scholar] [CrossRef] [PubMed]
- Zhang, L.; Chen, Y.; Li, G.; Chen, M.; Huang, W.; Liu, Y.; Li, Y. TGF-beta1/FGF-2 signaling mediates the 15-HETE-induced differentiation of adventitial fibroblasts into myofibroblasts. Lipids Health Dis. 2016, 15, 2. [Google Scholar] [CrossRef] [PubMed] [Green Version]
- Zhang, L.; Ma, J.; Shen, T.; Wang, S.; Ma, C.; Liu, Y.; Ran, Y.; Wang, L.; Liu, L.; Zhu, D. Platelet-derived growth factor (PDGF) induces pulmonary vascular remodeling through 15-LO/15-HETE pathway under hypoxic condition. Cell. Signal. 2012, 24, 1931–1939. [Google Scholar] [CrossRef] [PubMed]
- van der Vusse, G.J. Albumin as fatty acid transporter. Drug Metab. Pharmacokinet. 2009, 24, 300–307. [Google Scholar] [CrossRef]
- Saifer, A.; Goldman, L. Free Fatty Acids Bound to Human Serum Albumin. J. Lipid Res. 1961, 2, 268–270. [Google Scholar] [CrossRef]
- Vorum, H.; Pedersen, A.O.; Honore, B. Fatty-Acid and Drug-Binding to a Low-Affinity Component of Human Serum-Albumin, Purified by Affinity-Chromatography. Int. J. Pept. Prot. Res. 1992, 40, 415–422. [Google Scholar] [CrossRef] [PubMed]
- Umamaheswaran, S.; Dasari, S.K.; Yang, P.; Lutgendorf, S.K.; Sood, A.K. Stress, inflammation, and eicosanoids: An emerging perspective. Cancer Metastasis Rev. 2018, 37, 203–211. [Google Scholar] [CrossRef]
- Harizi, H.; Gualde, N. The impact of eicosanoids on the crosstalk between innate and adaptive immunity: The key roles of dendritic cells. Tissue Antigens 2005, 65, 507–514. [Google Scholar] [CrossRef]
- Hammock, B.D.; Wang, W.; Gilligan, M.M.; Panigrahy, D. Eicosanoids: The Overlooked Storm in Coronavirus Disease 2019 (COVID-19)? Am. J. Pathol. 2020, 190, 1782–1788. [Google Scholar] [CrossRef]
- Dieter, P.; Ambs, P.; Fitzke, E.; Hidaka, H.; Hoffmann, R.; Schwende, H. Comparative studies of cytotoxicity and the release of TNF-alpha, nitric oxide, and eicosanoids of liver macrophages treated with lipopolysaccharide and liposome-encapsulated MTP-PE. J. Immunol. 1995, 155, 2595–2604. [Google Scholar]
- Kuhn, H.; O’Donnell, V.B. Inflammation and immune regulation by 12/15-lipoxygenases. Prog. Lipid Res. 2006, 45, 334–356. [Google Scholar] [CrossRef]
- Powell, W.S.; Rokach, J. Biochemistry, biology and chemistry of the 5-lipoxygenase product 5-oxo-ETE. Prog. Lipid Res. 2005, 44, 154–183. [Google Scholar] [CrossRef]
- Powell, W.S.; Rokach, J. Biosynthesis, biological effects, and receptors of hydroxyeicosatetraenoic acids (HETEs) and oxoeicosatetraenoic acids (oxo-ETEs) derived from arachidonic acid. Biochim. Biophys. Acta 2015, 1851, 340–355. [Google Scholar] [CrossRef] [PubMed] [Green Version]
- Christofides, A.; Konstantinidou, E.; Jani, C.; Boussiotis, V.A. The role of Peroxisome Proliferator-Activated Receptors (PPAR) in immune responses. Metabolism 2020, 154338. [Google Scholar] [CrossRef]
- Fransen, M.; Nordgren, M.; Wang, B.; Apanasets, O. Role of peroxisomes in ROS/RNS-metabolism: Implications for human disease. Biochim. Biophys. Acta 2012, 1822, 1363–1373. [Google Scholar] [CrossRef] [Green Version]
- Sato, T.; Morita, M.; Nomura, M.; Tanuma, N. Revisiting glucose metabolism in cancer: Lessons from a PKM knock-in model. Mol. Cell. Oncol. 2018, 5, e1472054. [Google Scholar] [CrossRef] [PubMed] [Green Version]
- Zaabi, N.A.; Kendi, A.; Al-Jasmi, F.; Takashima, S.; Shimozawa, N.; Al-Dirbashi, O.Y. Atypical PEX16 peroxisome biogenesis disorder with mild biochemical disruptions and long survival. Brain Dev. 2019, 41, 57–65. [Google Scholar] [CrossRef] [PubMed]
- Kreutz, D.; Bileck, A.; Plessl, K.; Wolrab, D.; Groessl, M.; Keppler, B.K.; Meier-Menches, S.M.; Gerner, C. Response Profiling Using Shotgun Proteomics Enables Global Metallodrug Mechanisms of Action To Be Established. Chem. A Eur. J. 2017, 23, 1881–1890. [Google Scholar] [CrossRef] [PubMed]
- Cox, J.; Mann, M. MaxQuant enables high peptide identification rates, individualized p.p.b.-range mass accuracies and proteome-wide protein quantification. Nat. Biotechnol. 2008, 26, 1367–1372. [Google Scholar] [CrossRef] [PubMed]
- Tyanova, S.; Temu, T.; Sinitcyn, P.; Carlson, A.; Hein, M.Y.; Geiger, T.; Mann, M.; Cox, J. The Perseus computational platform for comprehensive analysis of (prote)omics data. Nat. Methods 2016, 13, 731–740. [Google Scholar] [CrossRef]
- Vizcaino, J.A.; Deutsch, E.W.; Wang, R.; Csordas, A.; Reisinger, F.; Ríos, D.; Dianes, J.A.; Sun, Z.; Farrah, T.; Bandeira, N.; et al. ProteomeXchange provides globally coordinated proteomics data submission and dissemination. Nat. Biotechnol. 2014, 32, 223–226. [Google Scholar] [CrossRef]
- Fahy, E.; Sud, M.; Cotter, D.; Subramaniam, S. LIPID MAPS online tools for lipid research. Nucleic Acids Res. 2007, 35, W606–W612. [Google Scholar] [CrossRef] [Green Version]
- Del Favero, G.; Hohenbichler, J.; Mayer, R.M.; Rychlik, M.; Marko, D. Mycotoxin Altertoxin II Induces Lipid Peroxidation Connecting Mitochondrial Stress Response to NF-kappaB Inhibition in THP-1 Macrophages. Chem. Res. Toxicol. 2020, 33, 492–504. [Google Scholar] [CrossRef] [PubMed] [Green Version]


| Nomenclature | Vendor | Lot Number | Expiration Date | Origin | Processed |
|---|---|---|---|---|---|
| A | Sigma | BCBT4187 | 07.2021 | - | |
| B | Gibco | 42Q5650K | 06.2020 | Brazil | - |
| C | Gibco | 42G8378K | 11.2022 | Brazil | - |
| D | Gibco | 08Q8082K | 02.2023 | Brazil | Heat inactivated |
Publisher’s Note: MDPI stays neutral with regard to jurisdictional claims in published maps and institutional affiliations. |
© 2021 by the authors. Licensee MDPI, Basel, Switzerland. This article is an open access article distributed under the terms and conditions of the Creative Commons Attribution (CC BY) license (http://creativecommons.org/licenses/by/4.0/).
Share and Cite
Niederstaetter, L.; Neuditschko, B.; Brunmair, J.; Janker, L.; Bileck, A.; Del Favero, G.; Gerner, C. Eicosanoid Content in Fetal Calf Serum Accounts for Reproducibility Challenges in Cell Culture. Biomolecules 2021, 11, 113. https://doi.org/10.3390/biom11010113
Niederstaetter L, Neuditschko B, Brunmair J, Janker L, Bileck A, Del Favero G, Gerner C. Eicosanoid Content in Fetal Calf Serum Accounts for Reproducibility Challenges in Cell Culture. Biomolecules. 2021; 11(1):113. https://doi.org/10.3390/biom11010113
Chicago/Turabian StyleNiederstaetter, Laura, Benjamin Neuditschko, Julia Brunmair, Lukas Janker, Andrea Bileck, Giorgia Del Favero, and Christopher Gerner. 2021. "Eicosanoid Content in Fetal Calf Serum Accounts for Reproducibility Challenges in Cell Culture" Biomolecules 11, no. 1: 113. https://doi.org/10.3390/biom11010113