Identification of a Proanthocyanidin from Litchi Chinensis Sonn. Root with Anti-Tyrosinase and Antioxidant Activity

 ,
,  ,
,
Abstract
: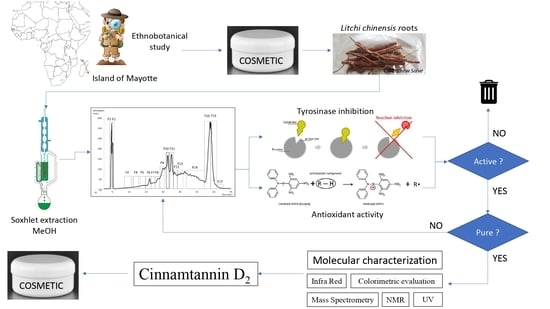
1. Introduction
1.1. Context
1.2. Litchi
1.3. Anti-Tyrosinase Activity
2. Materials and Methods
2.1. Plant Material
2.2. Sample Preparation
2.3. DPPH Antioxidant Activity
2.4. Tyrosinase Inhibition
2.5. Bio-Guided Fractionation
2.5.1. Preparative HPLC
2.5.2. Purification through Analytical HPLC
2.6. Molecular Characterization
2.6.1. IR
2.6.2. UV
2.6.3. MS
2.6.4. NMR
2.6.5. Colorimetric Test
3. Results and Discussion
3.1. Species Selection
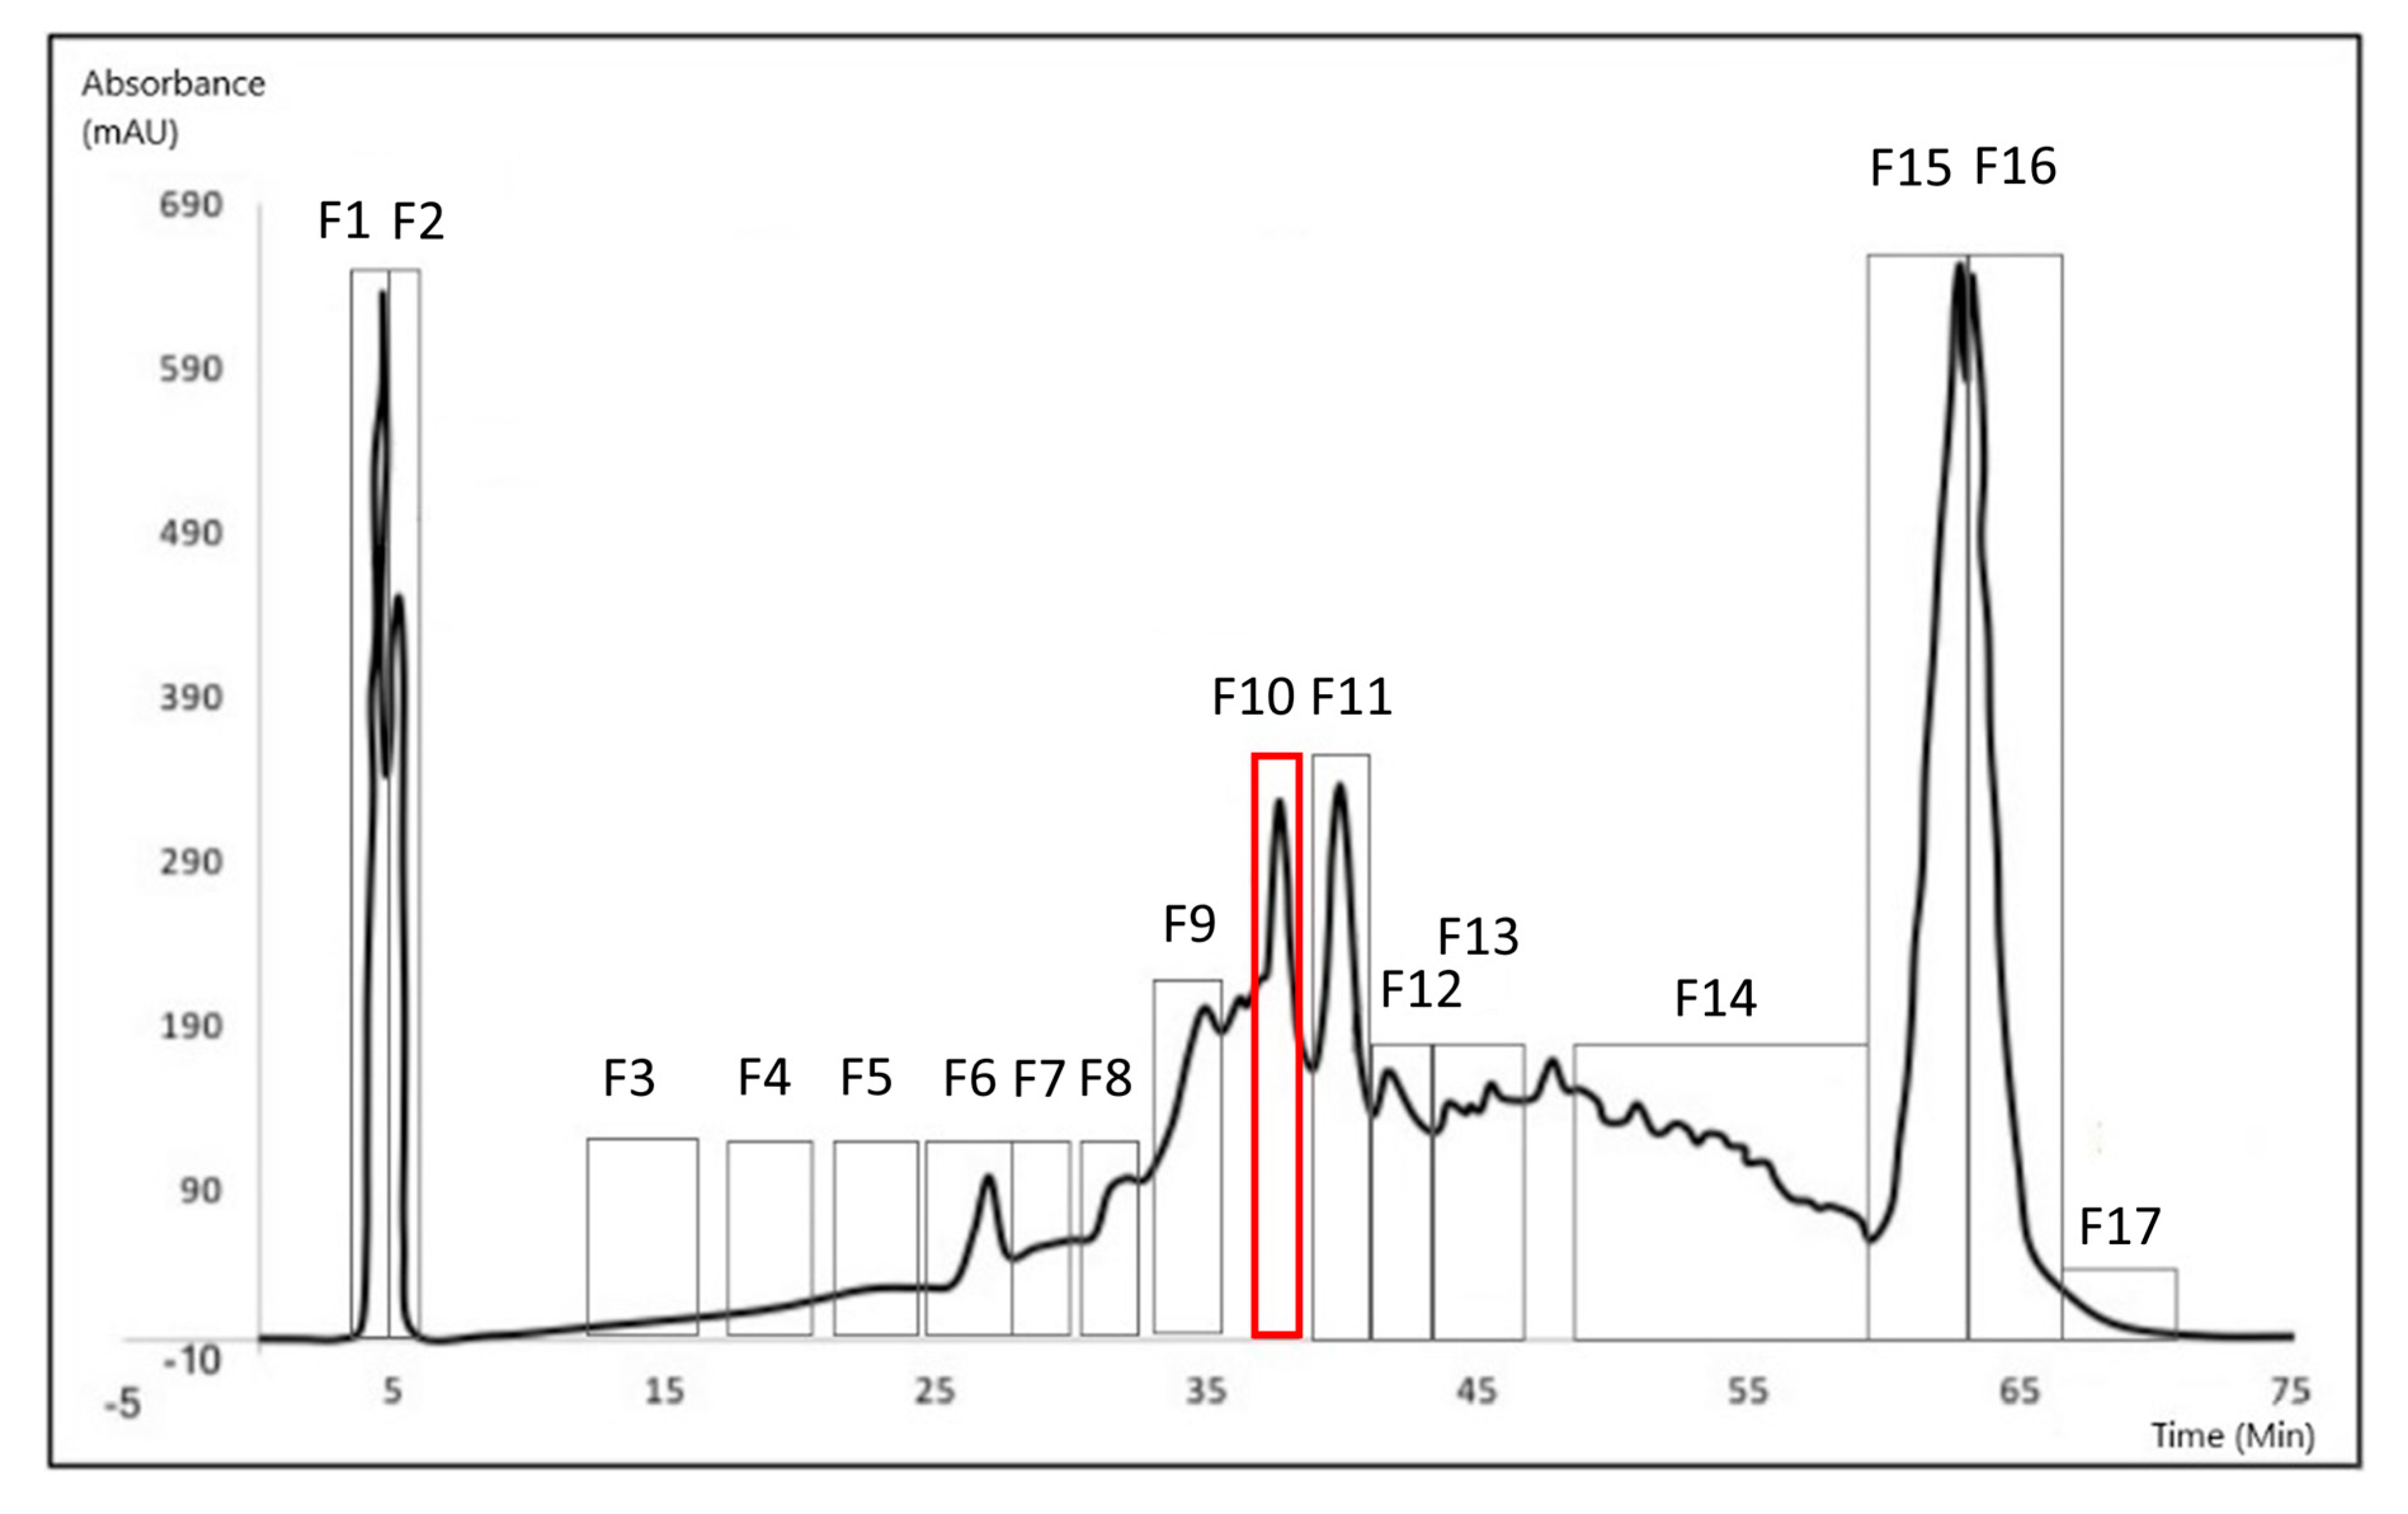
3.2. Bioguided Fractionation

| Fraction | DPPH | Tyrosinase | ||
|---|---|---|---|---|
| Inhibition % | SD % | Inhibition % | SD % | |
| 1 | 97.7 | 0.53 | 37.4 | 3.69 |
| 2 | 59.6 | 5.16 | 12.7 | 8.75 |
| 3 | 56.8 | 7.05 | 11.0 | 1.74 |
| 4 | 3.43 | 1.76 | 20.8 | 15.7 |
| 5 | 91.2 | 4.40 | 28.6 | 7.30 |
| 6 | 50.8 | 3.75 | 0.03 | 0.06 |
| 7 | 96.4 | 0.74 | 78.6 | 0.74 |
| 8 | 95.6 | 0.40 | 76.9 | 5.42 |
| 9 | 98.8 | 0.55 | 55.2 | 1.32 |
| 10 | 97.1 | 0.72 | 87.4 | 0.85 |
| 11 | 97.5 | 0.66 | 65.2 | 1.16 |
| 12 | 22.1 | 5.35 | 6.35 | 1.07 |
| 13 | 97.5 | 0.33 | 35.8 | 4.45 |
| 14 | 96.8 | 0.64 | 77.2 | 0.19 |
| 15 | 90.0 | 9.19 | 75.6 | 2.32 |
| 16 | 89.0 | 9.91 | 28.1 | 1.71 |
| 17 | 16.9 | 4.39 | 0.00 | 0.00 |
| Fraction | DPPH | Tyrosinase | ||
|---|---|---|---|---|
| Inhibition % | SD % | Inhibition % | SD % | |
| 10.1 | 28.6 | 13.2 | 35.8 | 4.45 |
| 10.2 | 18.0 | 5.07 | 57.1 | 0.90 |
| 10.3 | 72.6 | 10.2 | 82.4 | 0.87 |
| 10.4 | 35.3 | 22.7 | 52.5 | 3.35 |
| 10.5 | 32.0 | 15.3 | 51.9 | 3.14 |
| Fraction | DPPH | Tyrosinase | ||
|---|---|---|---|---|
| Inhibition % | SD % | Inhibition % | SD % | |
| 10.3.1 | 28.6 | 13.2 | 0.0 | 0.0 |
| 10.3.2 | 18.0 | 5.07 | 0.0 | 0.0 |
| 10.3.3 | 72.6 | 10.19 | 8.44 | 1.59 |
| 10.3.4 | 35.3 | 22.7 | 1.18 | 1.21 |
| 10.3.5 | 32.0 | 15.28 | 0.0 | 0.0 |
3.3. Molecular Characterization
3.3.1. IR
3.3.2. Mass Spectrometry
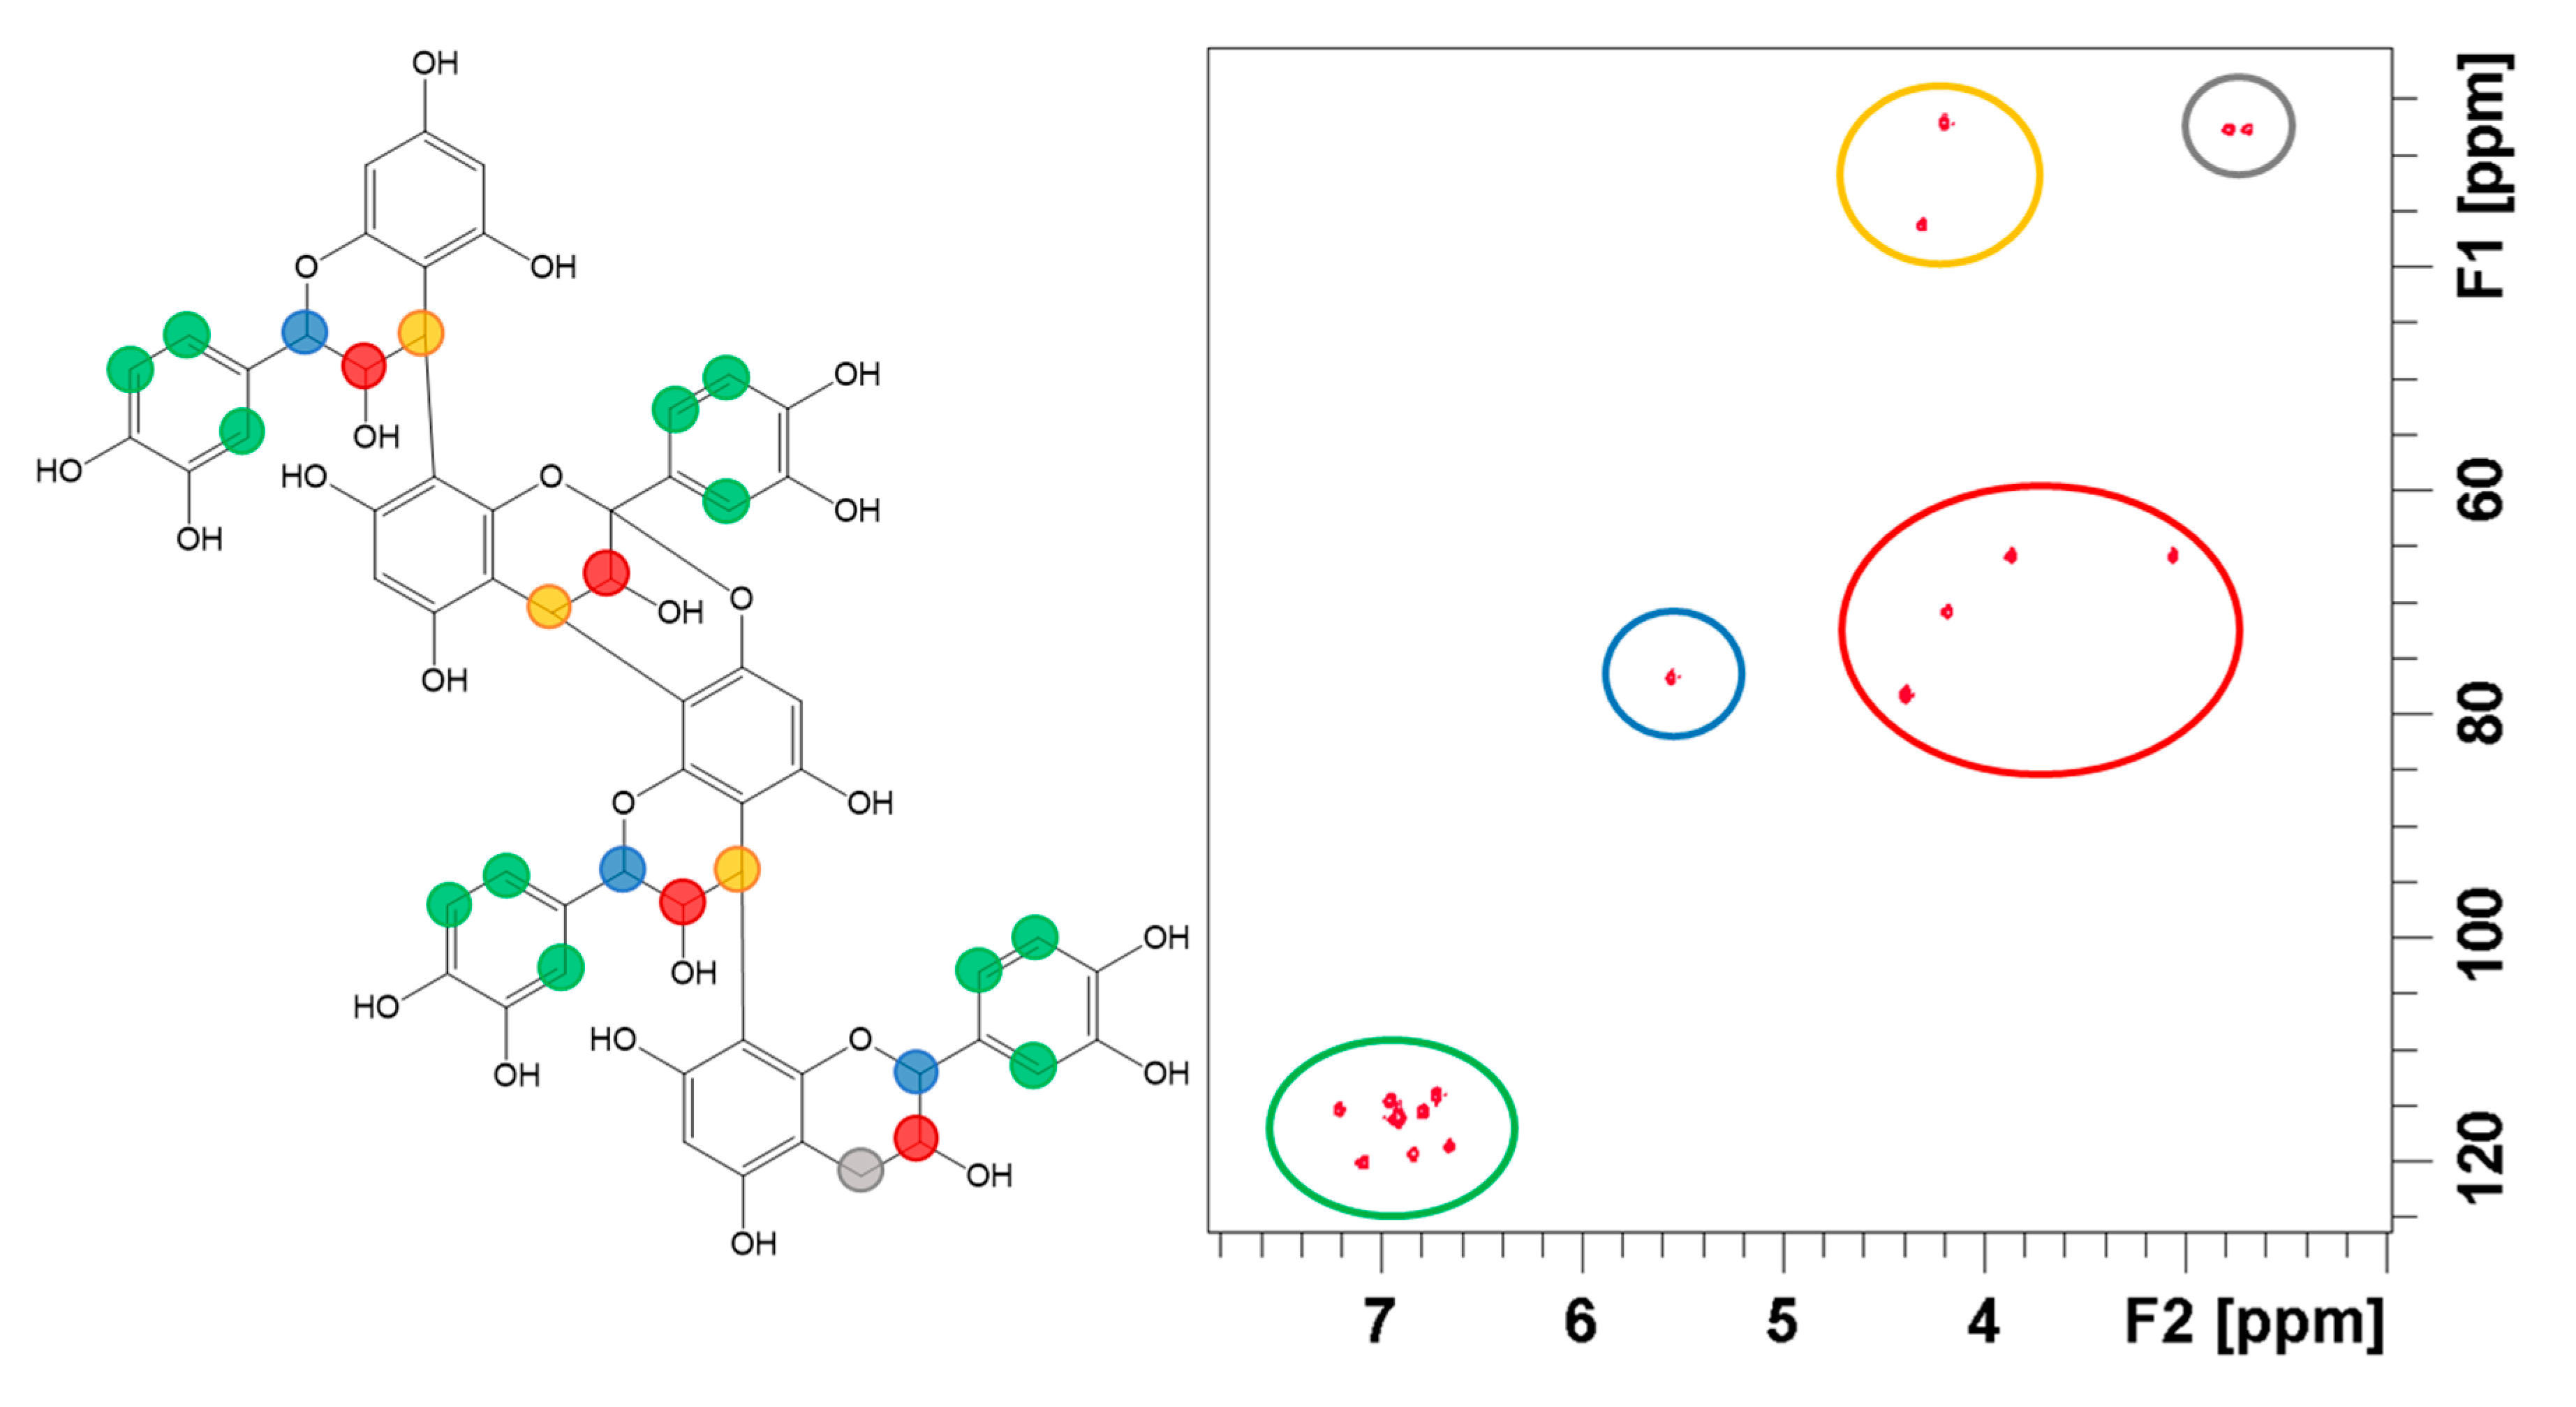
3.3.3. NMR
- -
- In HSQC, four signals are observed for non-aromatic hydroxylated C-H (red circle, Figure 7).
- -
- In HMBC, four aromatic 1H (two around 6.9 ppm and two around 6.8 ppm) are also coupled to 13C with a common pattern (131; 144 ppm).
- -
- In HSQC, the presence of signals at 4.2; 27 and 4.3; 36 ppm (Figure 7, yellow circle) can be explained if several catechin units are linked together since unpolymerized catechin should only display CH2 signals in this area of the spectrum.
- -
- In HMBC, the B-type bond between units is confirmed by the coupling of 1H at 4.3 ppm with 13C at 154, 153, 151, 108, 106, 77 and 71 ppm. Signals at 4.3; 154,153 and 151 ppm correspond to H5 coupled to C1’, C3 and C3′. The coupling of H5 with C4 and C4′ are also expected and probably correspond to signals at 4.3; 108 and 106 ppm, respectively (HMBC spectrum in Figure S5).
3.3.4. UV
3.3.5. Colorimetric Test
4. Conclusions
Supplementary Materials
Author Contributions
Funding
Acknowledgments
Conflicts of Interest
References
- Saive, M.; Frederich, M.; Fauconnier, M.-L. Plants used in traditional medicine and cosmetics in Mayotte Island (France): An ethnobotanical study. Indian J. Tradit. Knowl. 2018, 17, 645–653. [Google Scholar]
- Trotter, R.T.; Logan, M.H. Informant Consensus: A new approach for identifying potentially effective medicinal plants. In Plants in Indegenous Medicine and Diet: Biobehavioral Approaches; Etkin, N.L., Ed.; Redgrave Publishing Company: New York, NY, USA, 1986; p. 91. [Google Scholar]
- Kumar, M.; Kumar, V.; Prasad, R.; Varma, A. The Lychee Biotechnology; Springer: Singapore, 2017. [Google Scholar]
- Menzel, C.; Huang, X.; Liu, C. Litchi and Longan: Botany, Production, and Uses; Menzel, C., Waite, G.K., Eds.; CABI: Wallingford, UK, 2005. [Google Scholar] [CrossRef]
- Bourgaud, F.; Gravot, A.; Milesi, S.; Gontier, E. Production of plant secondary metabolites: A historical perspective. Plant Sci. 2001, 161, 839–851. [Google Scholar] [CrossRef]
- Liu, C.; Jiang, D.; Cheng, Y.; Deng, X.; Chen, F.; Fang, L.; Ma, Z.; Xu, J. Chemotaxonomic Study of Citrus Poncirus and Fortunella Genotypes Based on Peel Oil Volatile Compounds—Deciphering the Genetic Origin of Mangshanyegan (Citrus nobilis Lauriro). PLoS ONE 2013, 8, e58411. [Google Scholar] [CrossRef] [Green Version]
- Fan, Q.; Chen, S.; Zhou, R.; Xiang, X.; Liao, W.; Shi, S. Genetic variation of wild litchi (Litchi chinensis Sonn. subsp. chinensis) revealed by microsatellites. Conserv. Genet. 2011, 12, 753–760. [Google Scholar] [CrossRef]
- Diczbalis, Y. Farm and Forestry Production and Marketing Profile for Lychee (Litchi Chinensis); Permanent Agriculture Resources (PAR): Hölualoa, HI, USA, 2011; Available online: http://www.agroforestery.net (accessed on 21 June 2020).
- Boullet, V. La Flore de Mayotte; Conservatoire Botanique National de Mascarin: Réunion, France, 2014; Available online: http://floremaore.cbnm.org/index.php?option=com_content&view=article&id=2&Itemid=11&limitstart=2 (accessed on 10 August 2020).
- Nacif, S.R.; Paoli, A.A.S.; Salomão, L.C.C. Morphological and anatomical development of the litchi fruit (Litchi chinensis Sonn. cv. Brewster). Fruits 2001, 56, 225–233. [Google Scholar] [CrossRef]
- Menzel, C.; Aitken, R.L.; Dowling, A.W. Root distribution of lychee trees growing in acid soils of subtropical Queensland. Aust. J. Exp. Agric. 1990, 30. [Google Scholar] [CrossRef]
- Bhat, R.S.; Al-daihan, S. Antimicrobial activity of Litchi chinensis and Nephelium lappaceum aqueous seed extracts against some pathogenic bacterial strains. J. King Saud Univ. Sci. 2014, 26, 79–82. [Google Scholar] [CrossRef] [Green Version]
- Ibrahim, S.R.M.; Mohamed, G.A. Litchi chinensis: Medicinal uses, phytochemistry, and pharmacology. J. Ethnopharmacol. 2015, 174, 492–513. [Google Scholar] [CrossRef]
- Kamagaju, L.; Bizuru, E.; Minani, V.; Morandini, R.; Stévigny, C.; Ghanem, G.; Duez, P. An ethnobotanical survey of medicinal plants used in Rwanda for voluntary depigmentation. J. Ethnopharmacol. 2013, 150, 708–717. [Google Scholar] [CrossRef]
- Blois, M.S. Antioxidant Determinations by the Use of a Stable Free Radical. Nature 1958, 181, 1199–1200. [Google Scholar] [CrossRef]
- Rangkadilok, N.; Sitthimonchai, S.; Worasuttayangkurn, L.; Mahidol, C.; Ruchirawat, M.; Satayavivad, J. Evaluation of free radical scavenging and antityrosinase activities of standardized longan fruit extract. Food Chem. Toxicol. An. Int. J. Publ. Br. Ind. Biol. Res. Assoc. 2007, 45, 328–336. [Google Scholar] [CrossRef] [PubMed]
- Prior, R.L.; Fan, E.; Ji, H.; Howell, A.; Nio, C.; Payne, M.J.; Reed, J. Multi-laboratory validation of a standard method for quantifying proanthocyanidins in cranberry powders. J. Sci. Food Agric. 2010, 90, 1473–1478. [Google Scholar] [CrossRef] [PubMed]
- Cunningham, D.G.; Vannozzi, S.; O’Shea, E.; Turk, R. Analysis and Standardization of Cranberry Products; ACS Publications: Washington, DC, USA, 2002. [Google Scholar]
- Lv, Q.; Luo, F.; Zhao, X.; Liu, Y.; Hu, G.; Sun, C.; Li, X.; Chen, K. Identification of proanthocyanidins from litchi (Litchi chinensis Sonn.) pulp by LC-ESI-Q-TOF-MS and their antioxidant activity. PLoS ONE 2015, 10. [Google Scholar] [CrossRef] [Green Version]
- Xu, X.; Xie, H.; Wang, Y.; Wei, X. A-type proanthocyanidins from lychee seeds and their antioxidant and antiviral activities. J. Agric. Food Chem. 2010, 58, 11667–11672. [Google Scholar] [CrossRef]
- Enomoto, H.; Takahashi, S.; Takeda, S.; Hatta, H. Distribution of flavan-3-ol species in ripe strawberry fruit revealed by matrix-assisted laser desorption/ionization-mass spectrometry imaging. Molecules 2020, 25, 103. [Google Scholar] [CrossRef] [PubMed] [Green Version]
- Lin, L.-Z.; Sun, J.; Chen, P.; Monagas, M.J.; Harnly, J.M. UHPLC-PDA-ESI/HRMS n Profiling Method to Identify and Quantify Oligomeric Proanthocyanidins in Plant Products. J. Agric. Food Chem. 2014, 62, 9387–9400. [Google Scholar] [CrossRef] [Green Version]
- Gross, G.G.; Hemingway, R.W.; Yoshida, T. Plant. Polyphenols 2: Chemistry, Biology, Pharmacology, Ecology; Springer Science & Business Media: Boston, MA, USA, 2012; Volume 66. [Google Scholar]
- Delaunay, J.C.; Castagnino, C.; Chèze, C.; Vercauteren, J. Preparative isolation of polyphenolic compounds from Vitis vinifera by centrifugal partition chromatography. J. Chromatogr. A. 2002, 964, 123–128. [Google Scholar] [CrossRef]
- Hümmer, W.; Schreier, P. Analysis of proanthocyanidins. Mol. Nutr. Food Res. 2008, 52, 1381–1398. [Google Scholar] [CrossRef]
- Payne, M.J.; Hurst, W.J.; Stuart, D.A.; Ou, B.; Fan, E.; Ji, H.; Kou, Y. Determination of Total Procyanidins in Selected Chocolate and Confectionery Products Using DMAC. J. AOAC Int. Assoc. Off. Anal. Chem. 2010, 93, 89–96. [Google Scholar] [CrossRef] [Green Version]
- Wang, Y.; Singh, A.; Hurst, W.; Gliński, J.; Koo, H.; Vorsa, N. Influence of Degree-of-Polymerization and Linkage on the Quantification of Proanthocyanidins using 4-Dimethylaminocinamaldehyde (DMAC) Assay. J. Agric. Food Chem. 2016, 64. [Google Scholar] [CrossRef]
- Tatsuno, T.; Jinno, M.; Arima, Y.; Kawabata, T.; Hasegawa, T.; Yahagi, N.; Takano, F.; Ohta, T. Anti-inflammatory and anti-melanogenic proanthocyanidin oligomers from peanut skin. Biol. Pharm. Bull. 2012, 35, 909–916. [Google Scholar] [CrossRef] [PubMed] [Green Version]
- Arrowitz, C.; Schoelermann, A.M.; Mann, T.; Jiang, L.L.; Weber, T.; Kolbe, L. Effective Tyrosinase Inhibition by Thiamidol Results in Significant Improvement of Mild to Moderate Melasma. J. Investig. Dermatol. 2019, 139, 1691–1698. [Google Scholar] [CrossRef] [PubMed] [Green Version]
- Burger, P.; Landreau, A.; Azoulay, S.; Michel, T.; Fernandez, X. Skin Whitening Cosmetics: Feedback and Challenges in the Development of Natural Skin Lighteners. Cosmetics 2016, 3, 36. [Google Scholar] [CrossRef] [Green Version]
- Ghanem, M.E.; Hichri, I.; Smigocki, A.C.; Albacete, A.; Fauconnier, M.-L.; Diatloff, E.; Martinez-Andujar, C.; Lutts, S.; Dodd, I.C.; Pérez-Alfocea, F. Root-targeted biotechnology to mediate hormonal signalling and improve crop stress tolerance. Plant Cell Rep. 2011, 30, 807–823. [Google Scholar] [CrossRef]


| Compound Class/Subclass | Compound | Plant Part | Biological Activity |
|---|---|---|---|
| Polyphenols | Leaves Seeds Pulp Pericarp | Cytotoxic Anti-viral Antioxidant Antimicrobial Lipid peroxidation inhibitory activities α-glucosidase inhibitory activities | |
| Tannin | Coumarin | Seeds | Antioxidant |
| Litchtocotrienol A-G Macrolitchtocotrienol A Cyclolitchtocotrienol A | Leaves | Cytotoxic | |
| Lignan | Schizandriside | Leaves | Antioxidant |
| Lignan | Isolariciresinol | Pericarp | Antioxidant |
| Sesquiterpenes | Litchioside A and B Pumilaside A Funingensin A Pterodontriol-D-6-O-β-D-glucopyranoside | Seeds | Cytotoxic |
| Triterpenes | Aerial parts Seeds Pericarp | Antiviral | |
| Sterols | Aerial parts Seeds Pericarp | Antiviral | |
| Others | Litchiol A and B Secoisolariciresinol-9′-O-β-D-xyloside 4,7,7′,8′,9,9′-hexahydroxy-3,3′-dimethoxy-8,4′-oxyneolignan Ehletianol C Sesquipinsapol B, Sesquimarocanol B Ethyl shikimate, Methylshikimate Benzyl alcohol 5-(hydroxymethyl)furfural Hydrobenzoin | Leaves Pericarp Fruits | Antioxidant Cytotoxic |
| Observation | MeOH | DMAC 1mg/mL | HCl + EtOH | Sample | Sample + DMAC |
|---|---|---|---|---|---|
| Optical density | 0.00 ± 0.000 | 0.13 ± 0.00 | 0.00 ± 0.00 | 0.24 ± 0.00 | 0.46 ± 0.08 |
© 2020 by the authors. Licensee MDPI, Basel, Switzerland. This article is an open access article distributed under the terms and conditions of the Creative Commons Attribution (CC BY) license (http://creativecommons.org/licenses/by/4.0/).
Share and Cite
Saive, M.; Genva, M.; Istasse, T.; Frederich, M.; Maes, C.; Fauconnier, M.-L. Identification of a Proanthocyanidin from Litchi Chinensis Sonn. Root with Anti-Tyrosinase and Antioxidant Activity. Biomolecules 2020, 10, 1347. https://doi.org/10.3390/biom10091347
Saive M, Genva M, Istasse T, Frederich M, Maes C, Fauconnier M-L. Identification of a Proanthocyanidin from Litchi Chinensis Sonn. Root with Anti-Tyrosinase and Antioxidant Activity. Biomolecules. 2020; 10(9):1347. https://doi.org/10.3390/biom10091347
Chicago/Turabian StyleSaive, Matthew, Manon Genva, Thibaut Istasse, Michel Frederich, Chloé Maes, and Marie-Laure Fauconnier. 2020. "Identification of a Proanthocyanidin from Litchi Chinensis Sonn. Root with Anti-Tyrosinase and Antioxidant Activity" Biomolecules 10, no. 9: 1347. https://doi.org/10.3390/biom10091347