Transient Unfolding and Long-Range Interactions in Viral BCL2 M11 Enable Binding to the BECN1 BH3 Domain

Abstract
:
1. Introduction
2. Methods
2.1. System Preparation and Conformational Sampling
2.2. Anharmonic Conformational Analysis (ANCA)
2.3. Temporal Decorrelation of Fourth-Order on Time-Delayed Cumulant Matrices
2.4. Identifying Conformational Sub-States
2.5. Experimental Methods
3. Results
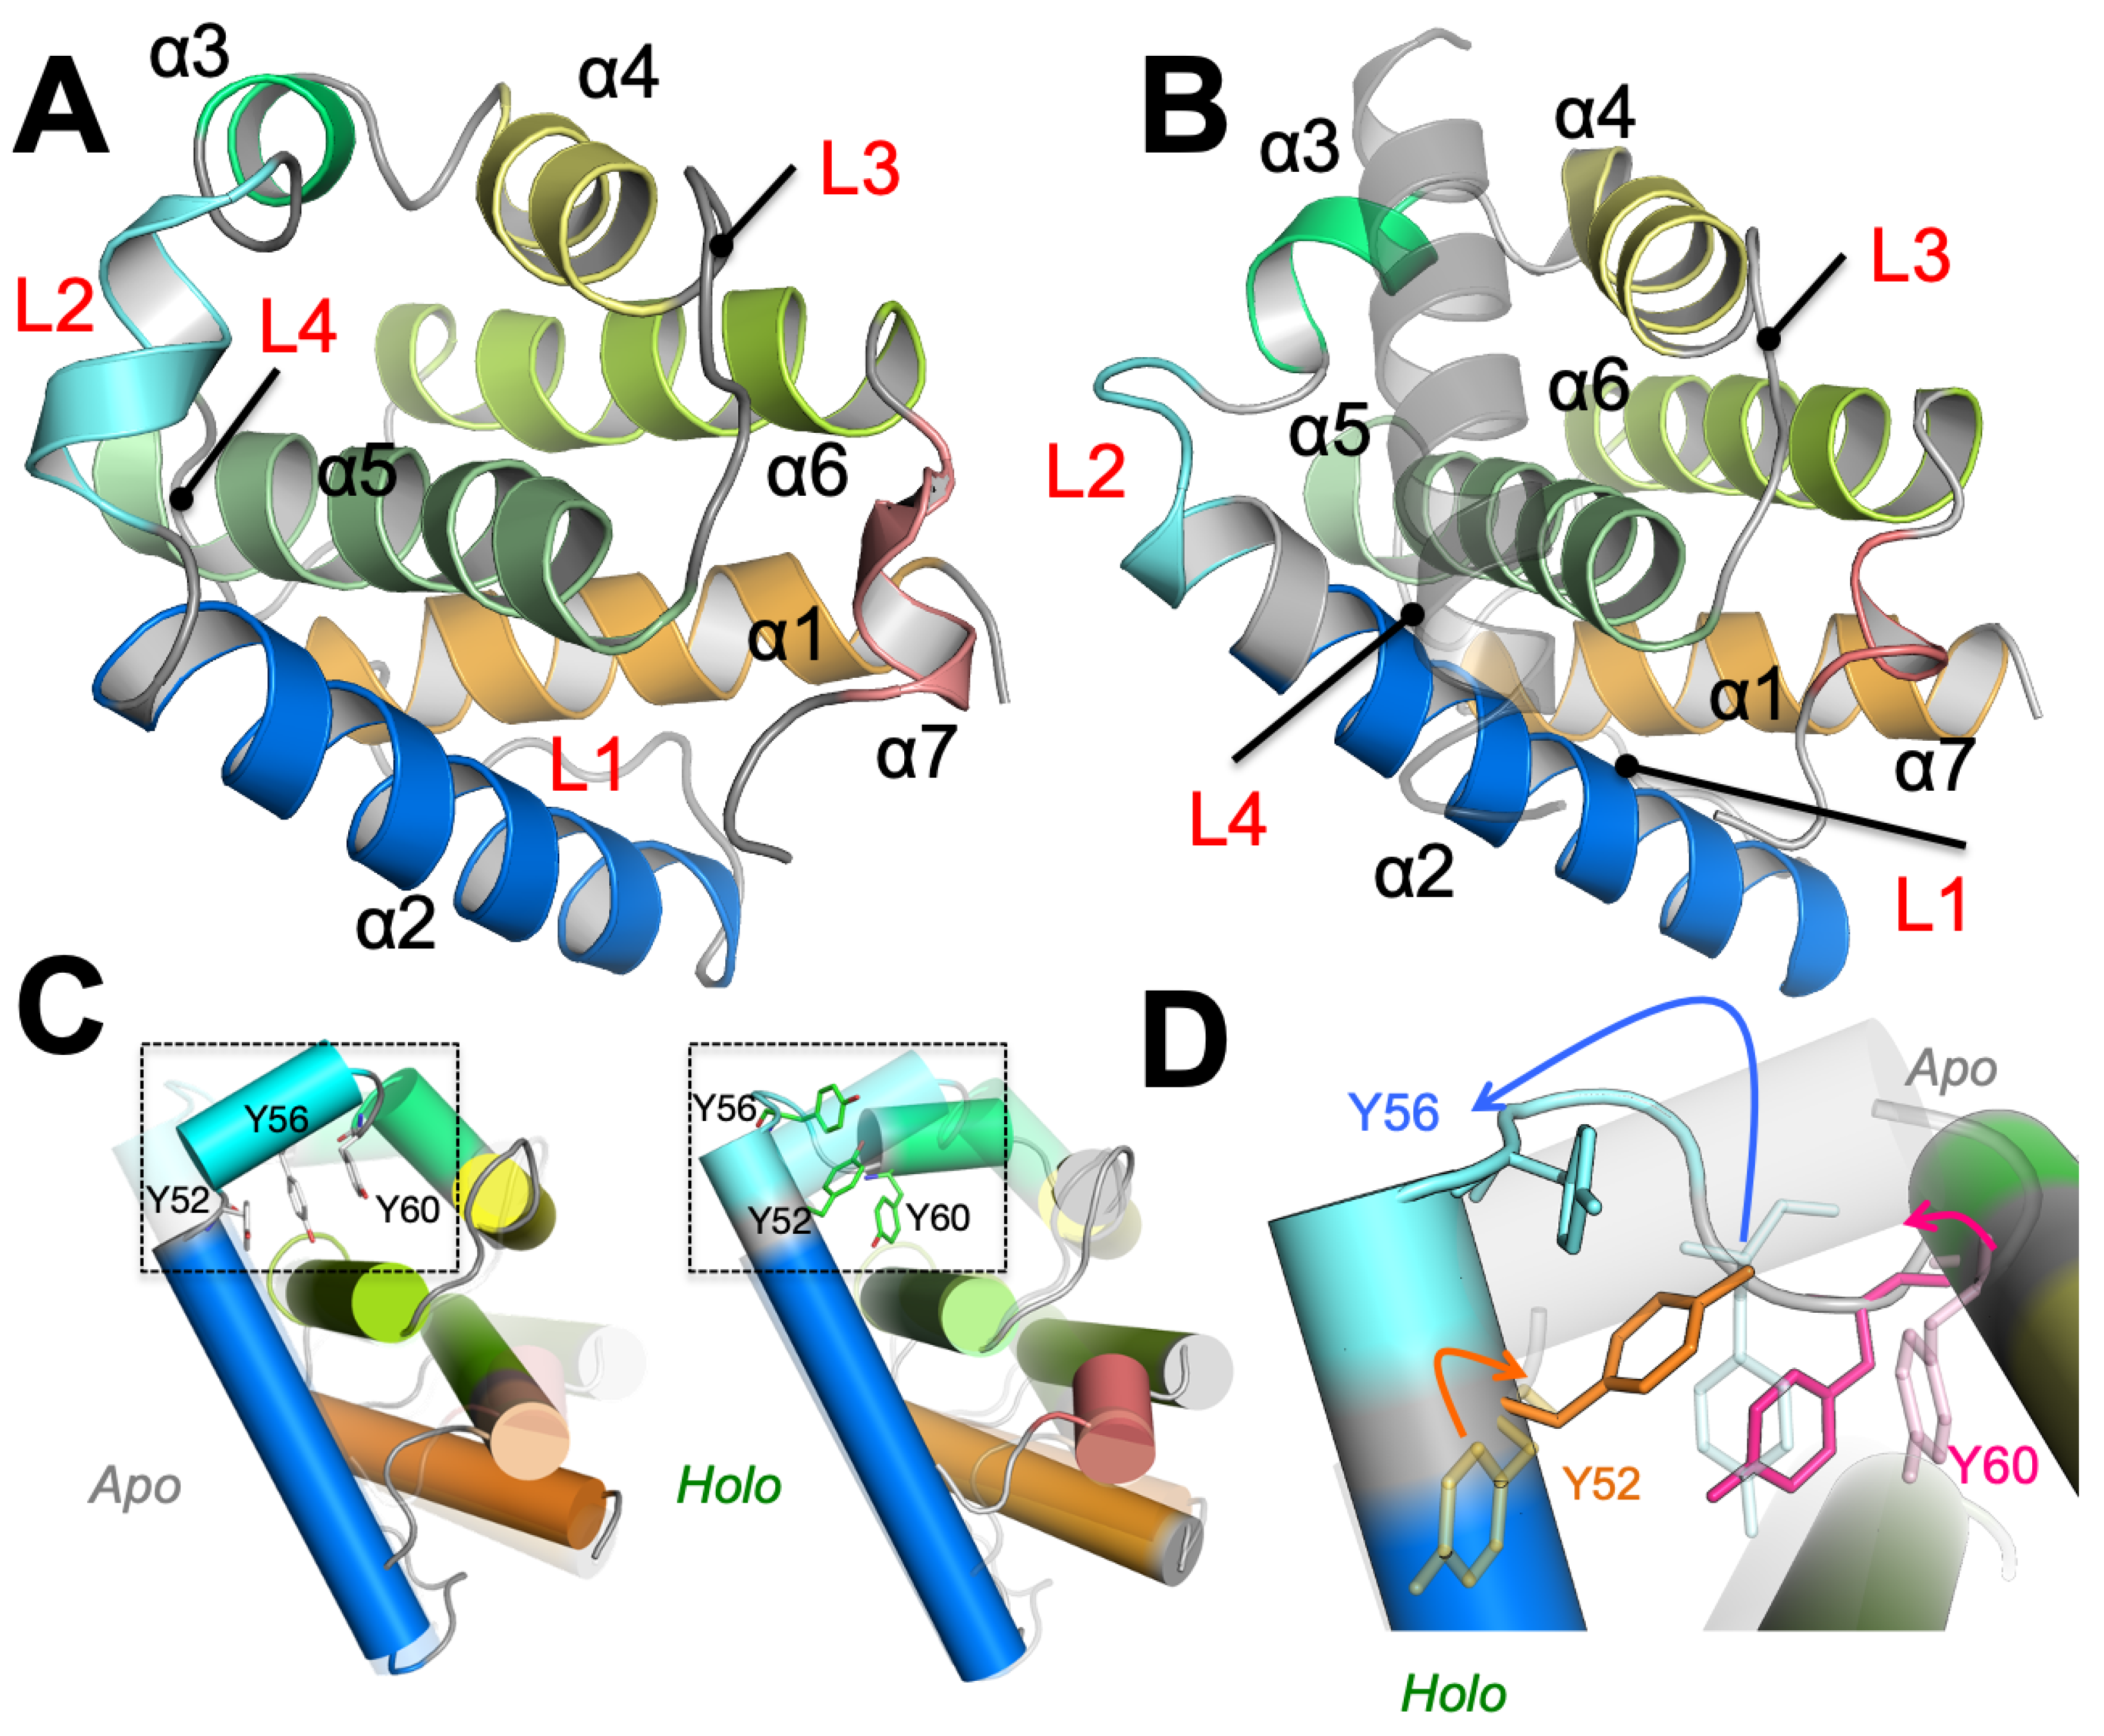
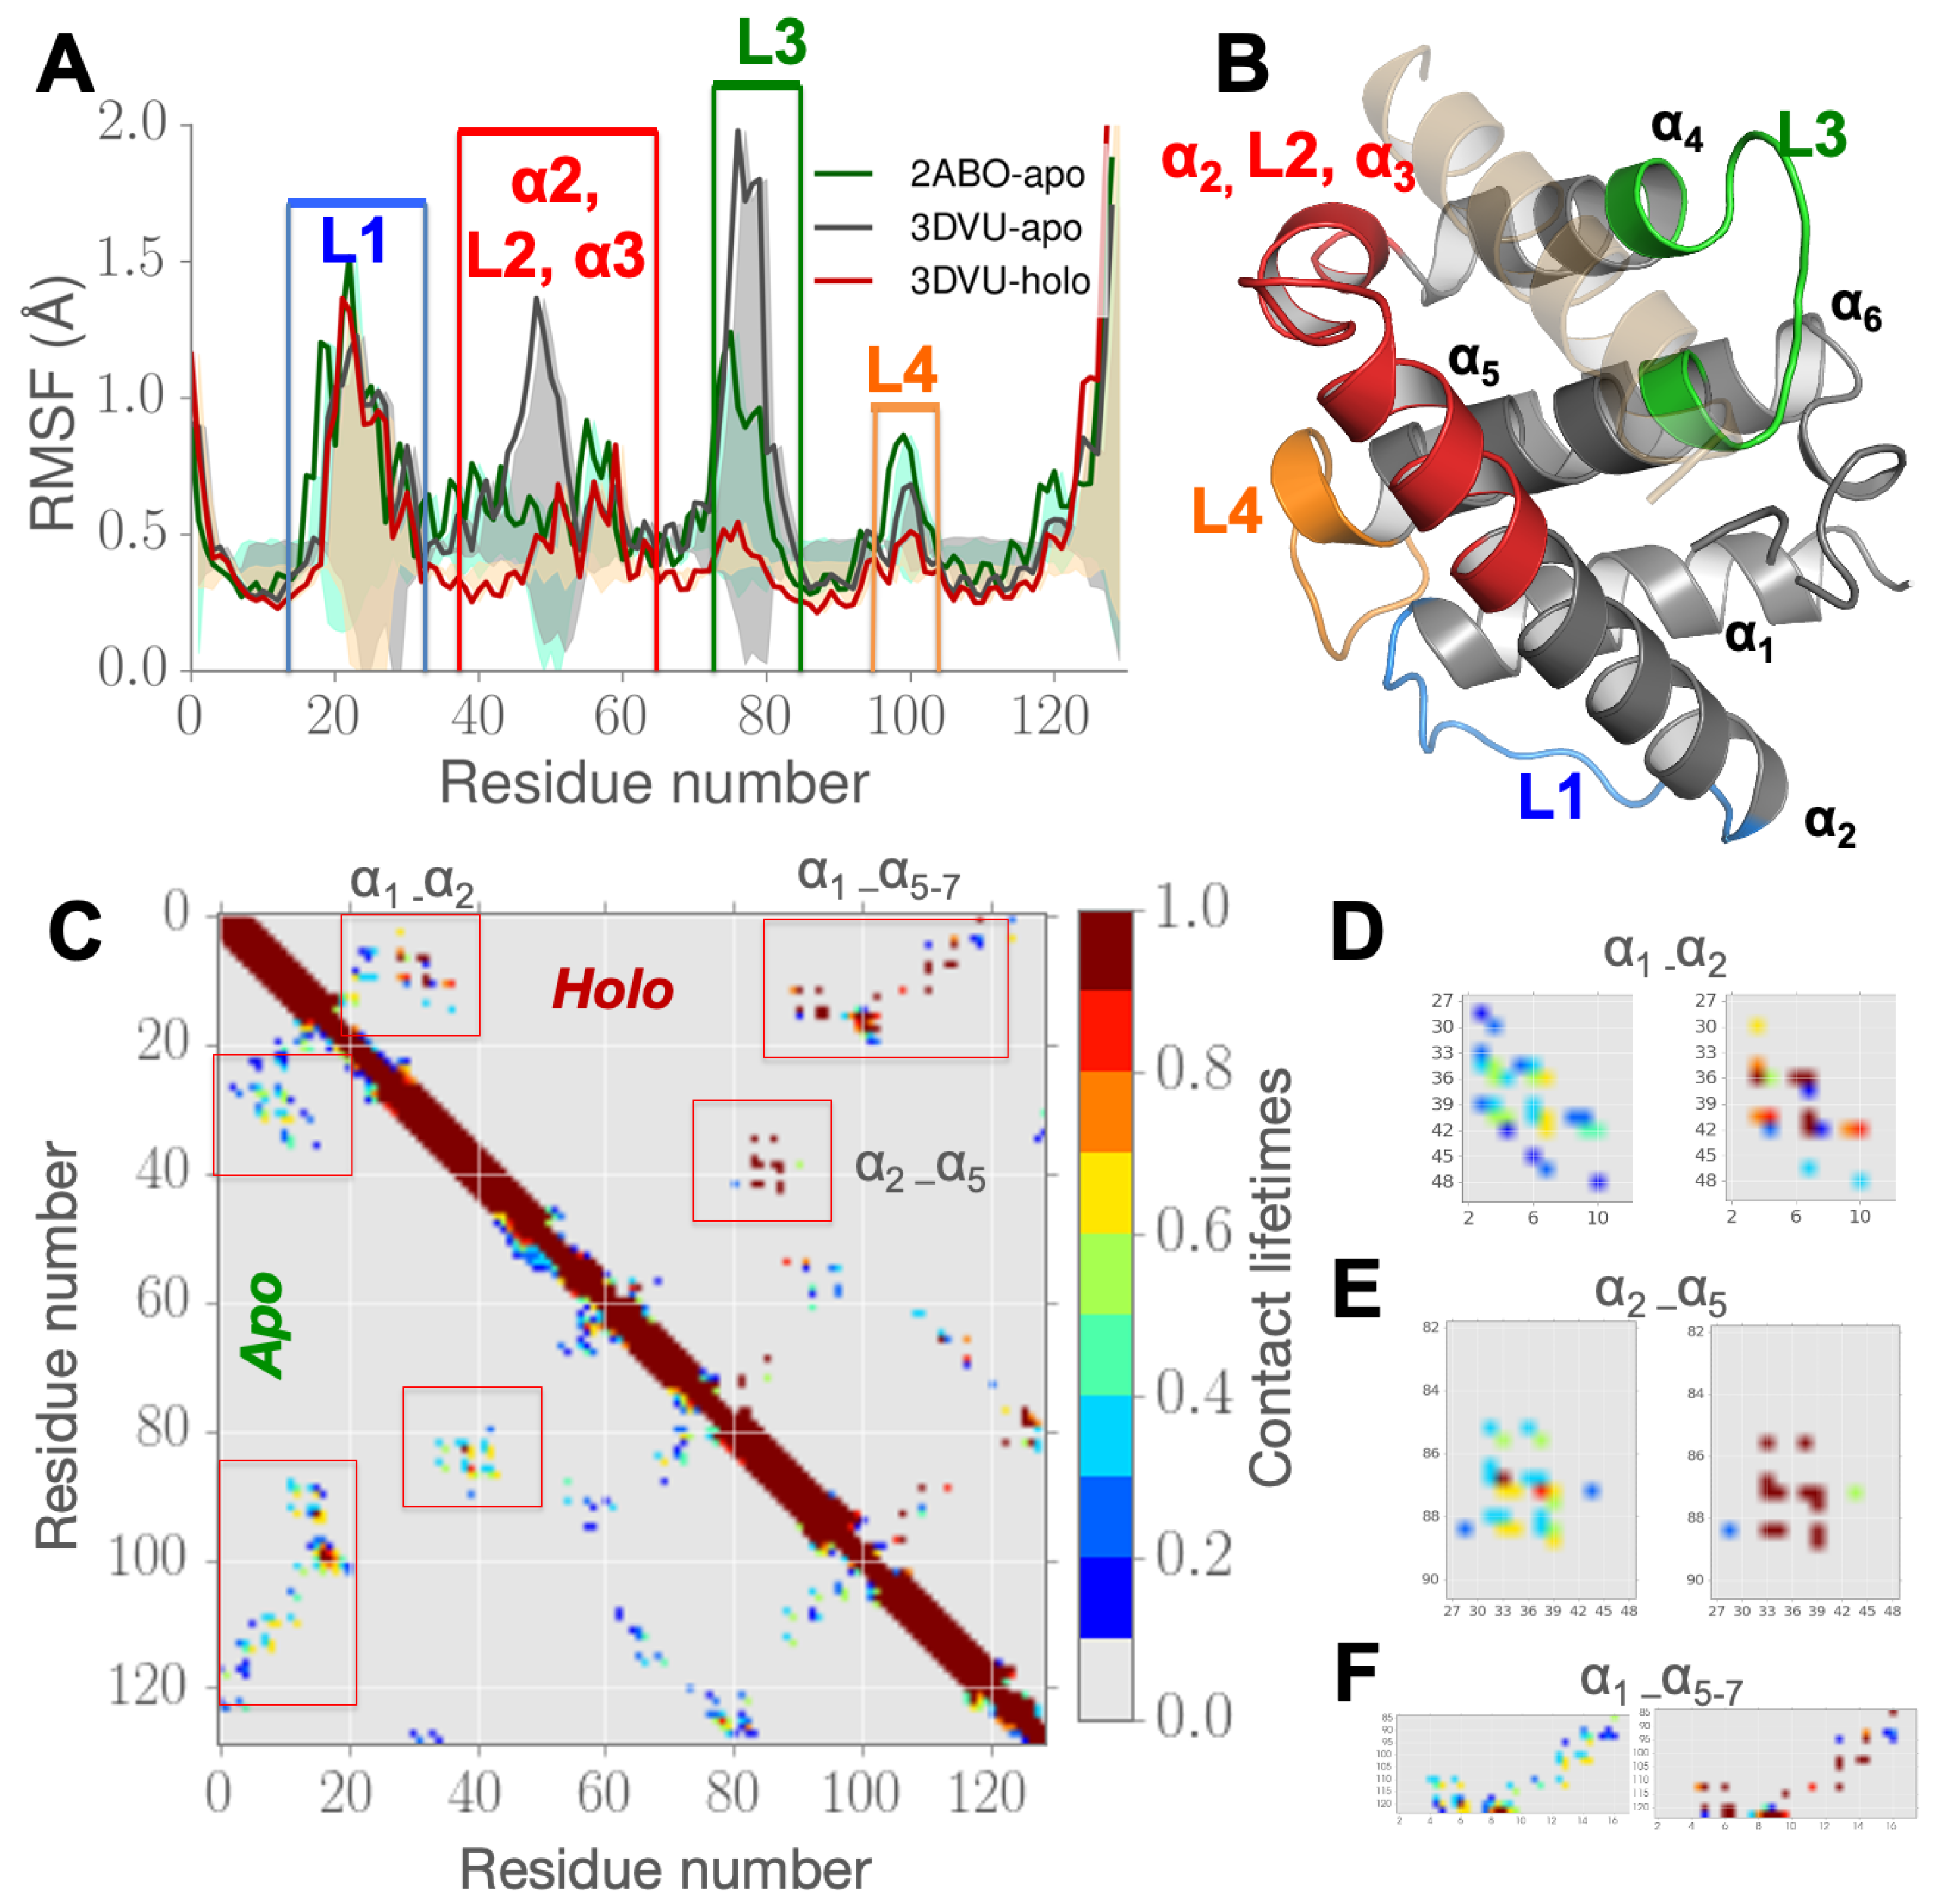
3.1. Partial Unfolding of M11- Facilitates Opening/Closing of BH3D Binding Site
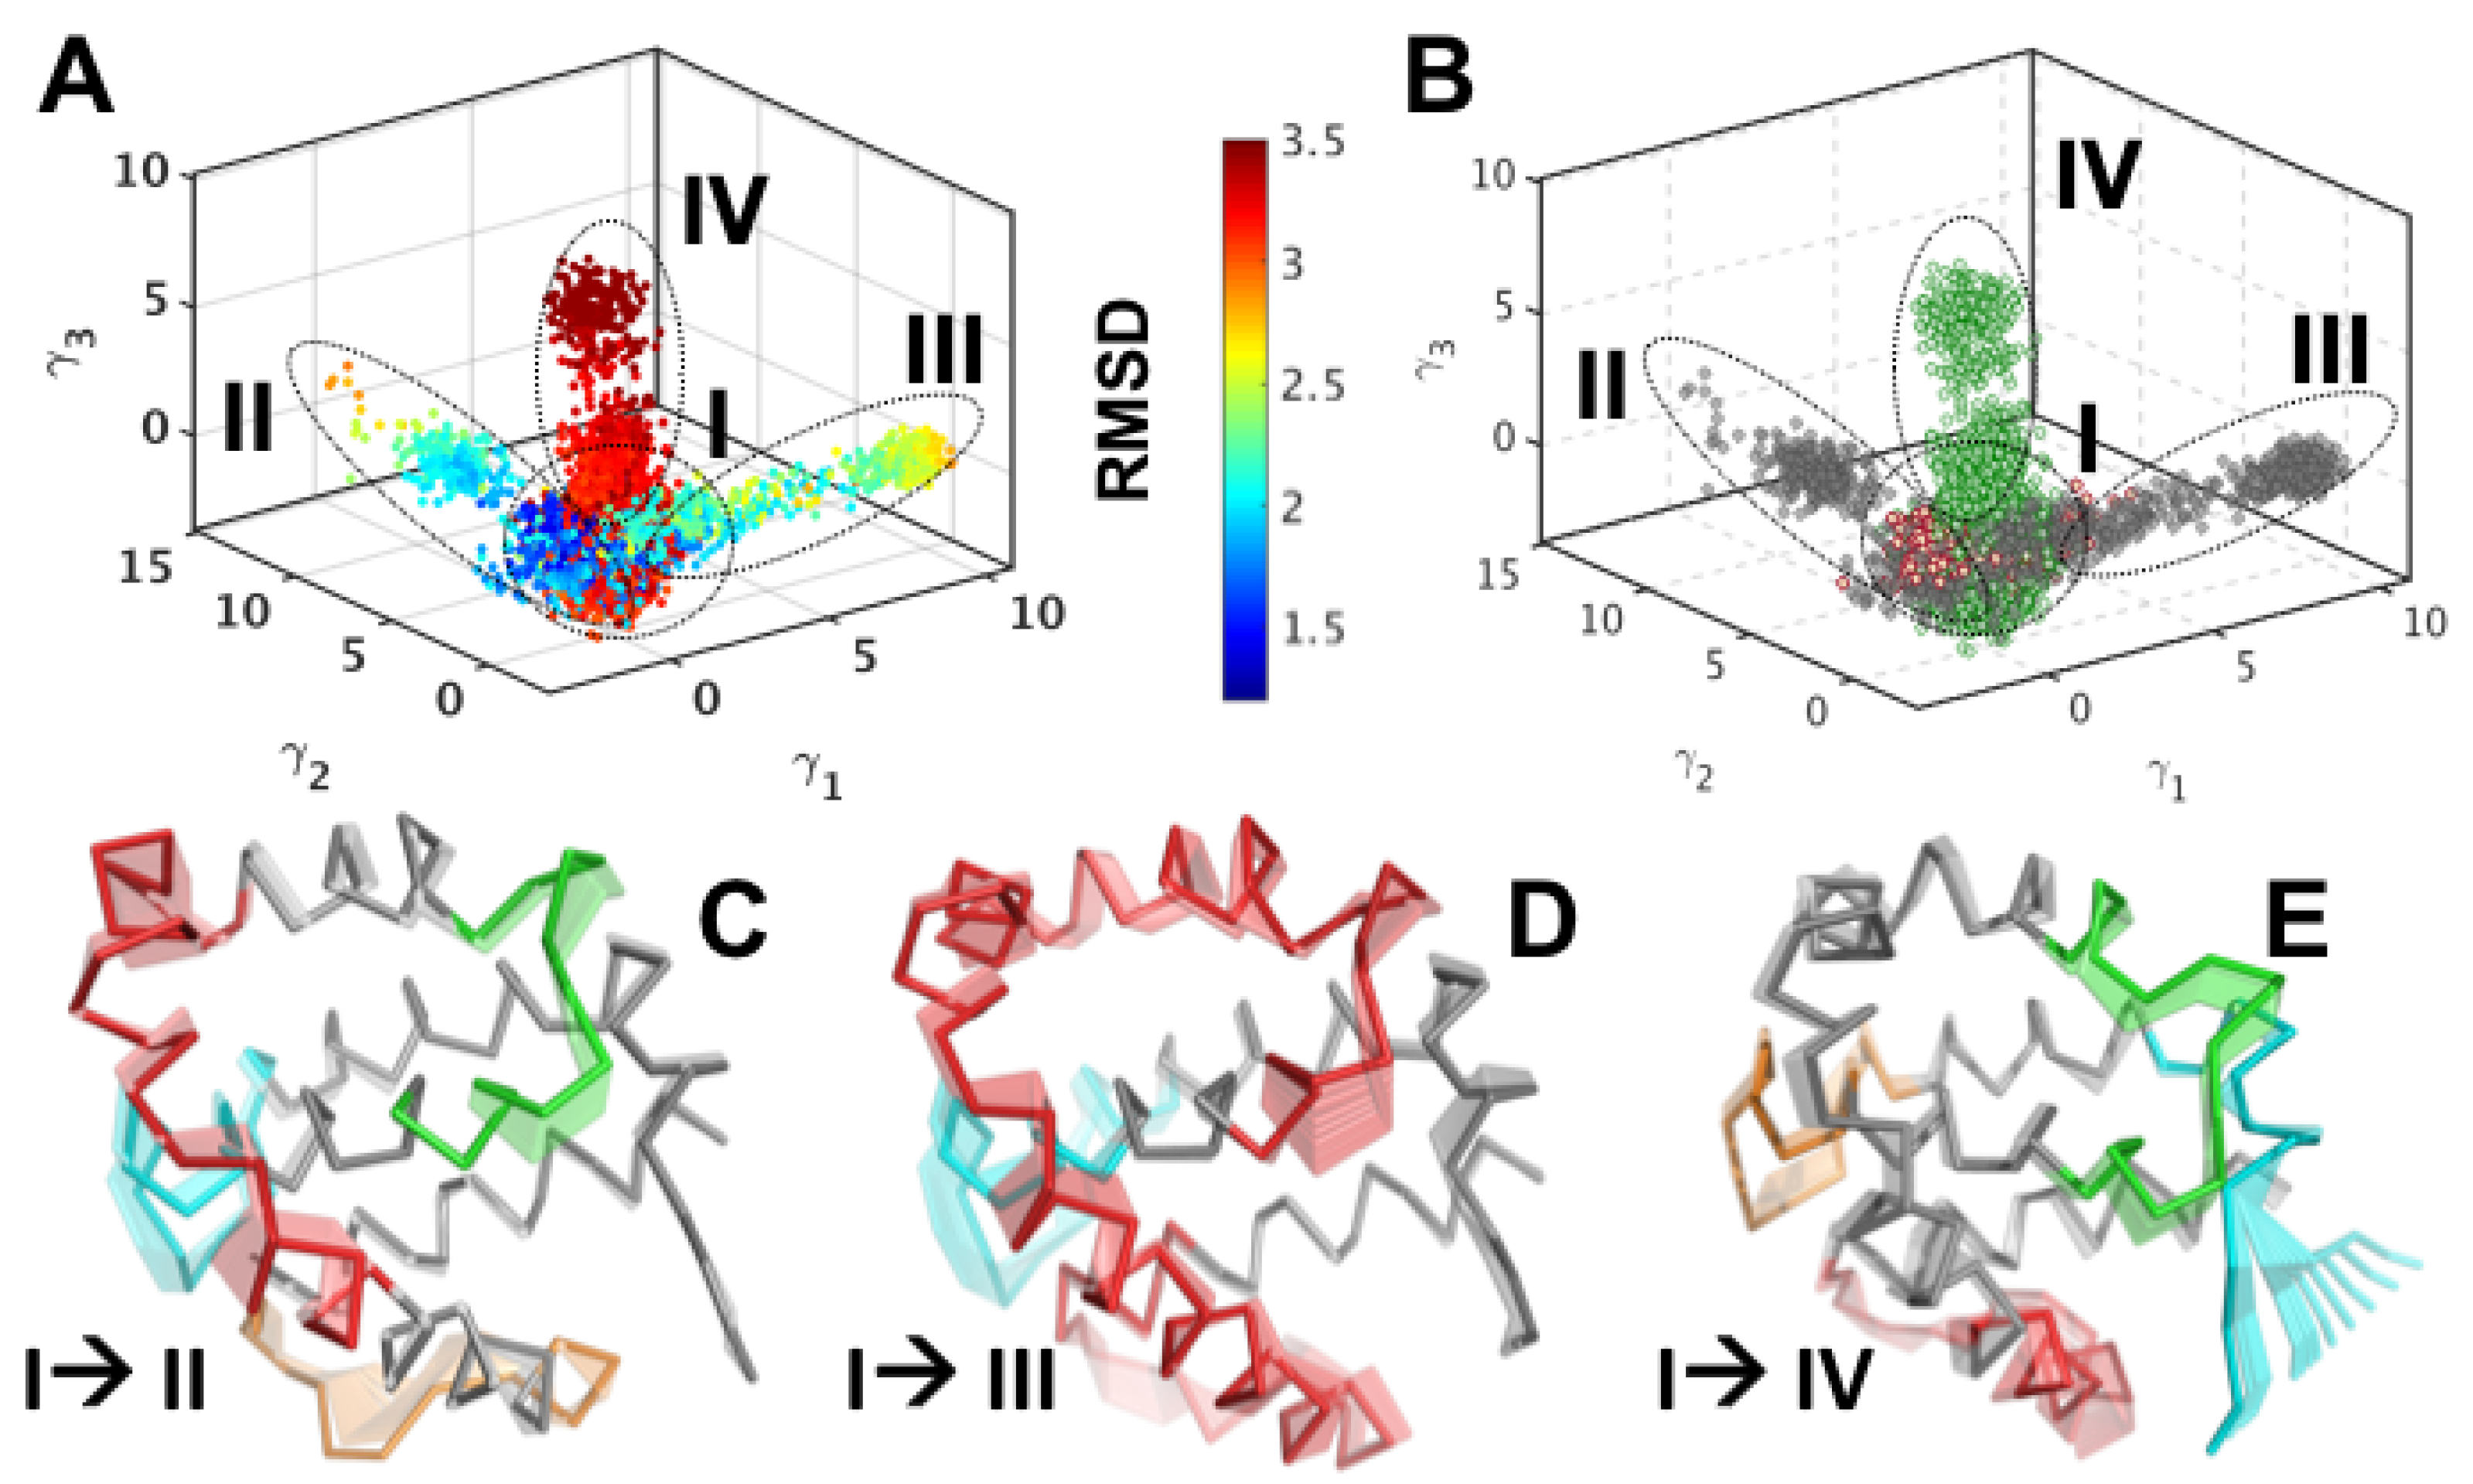
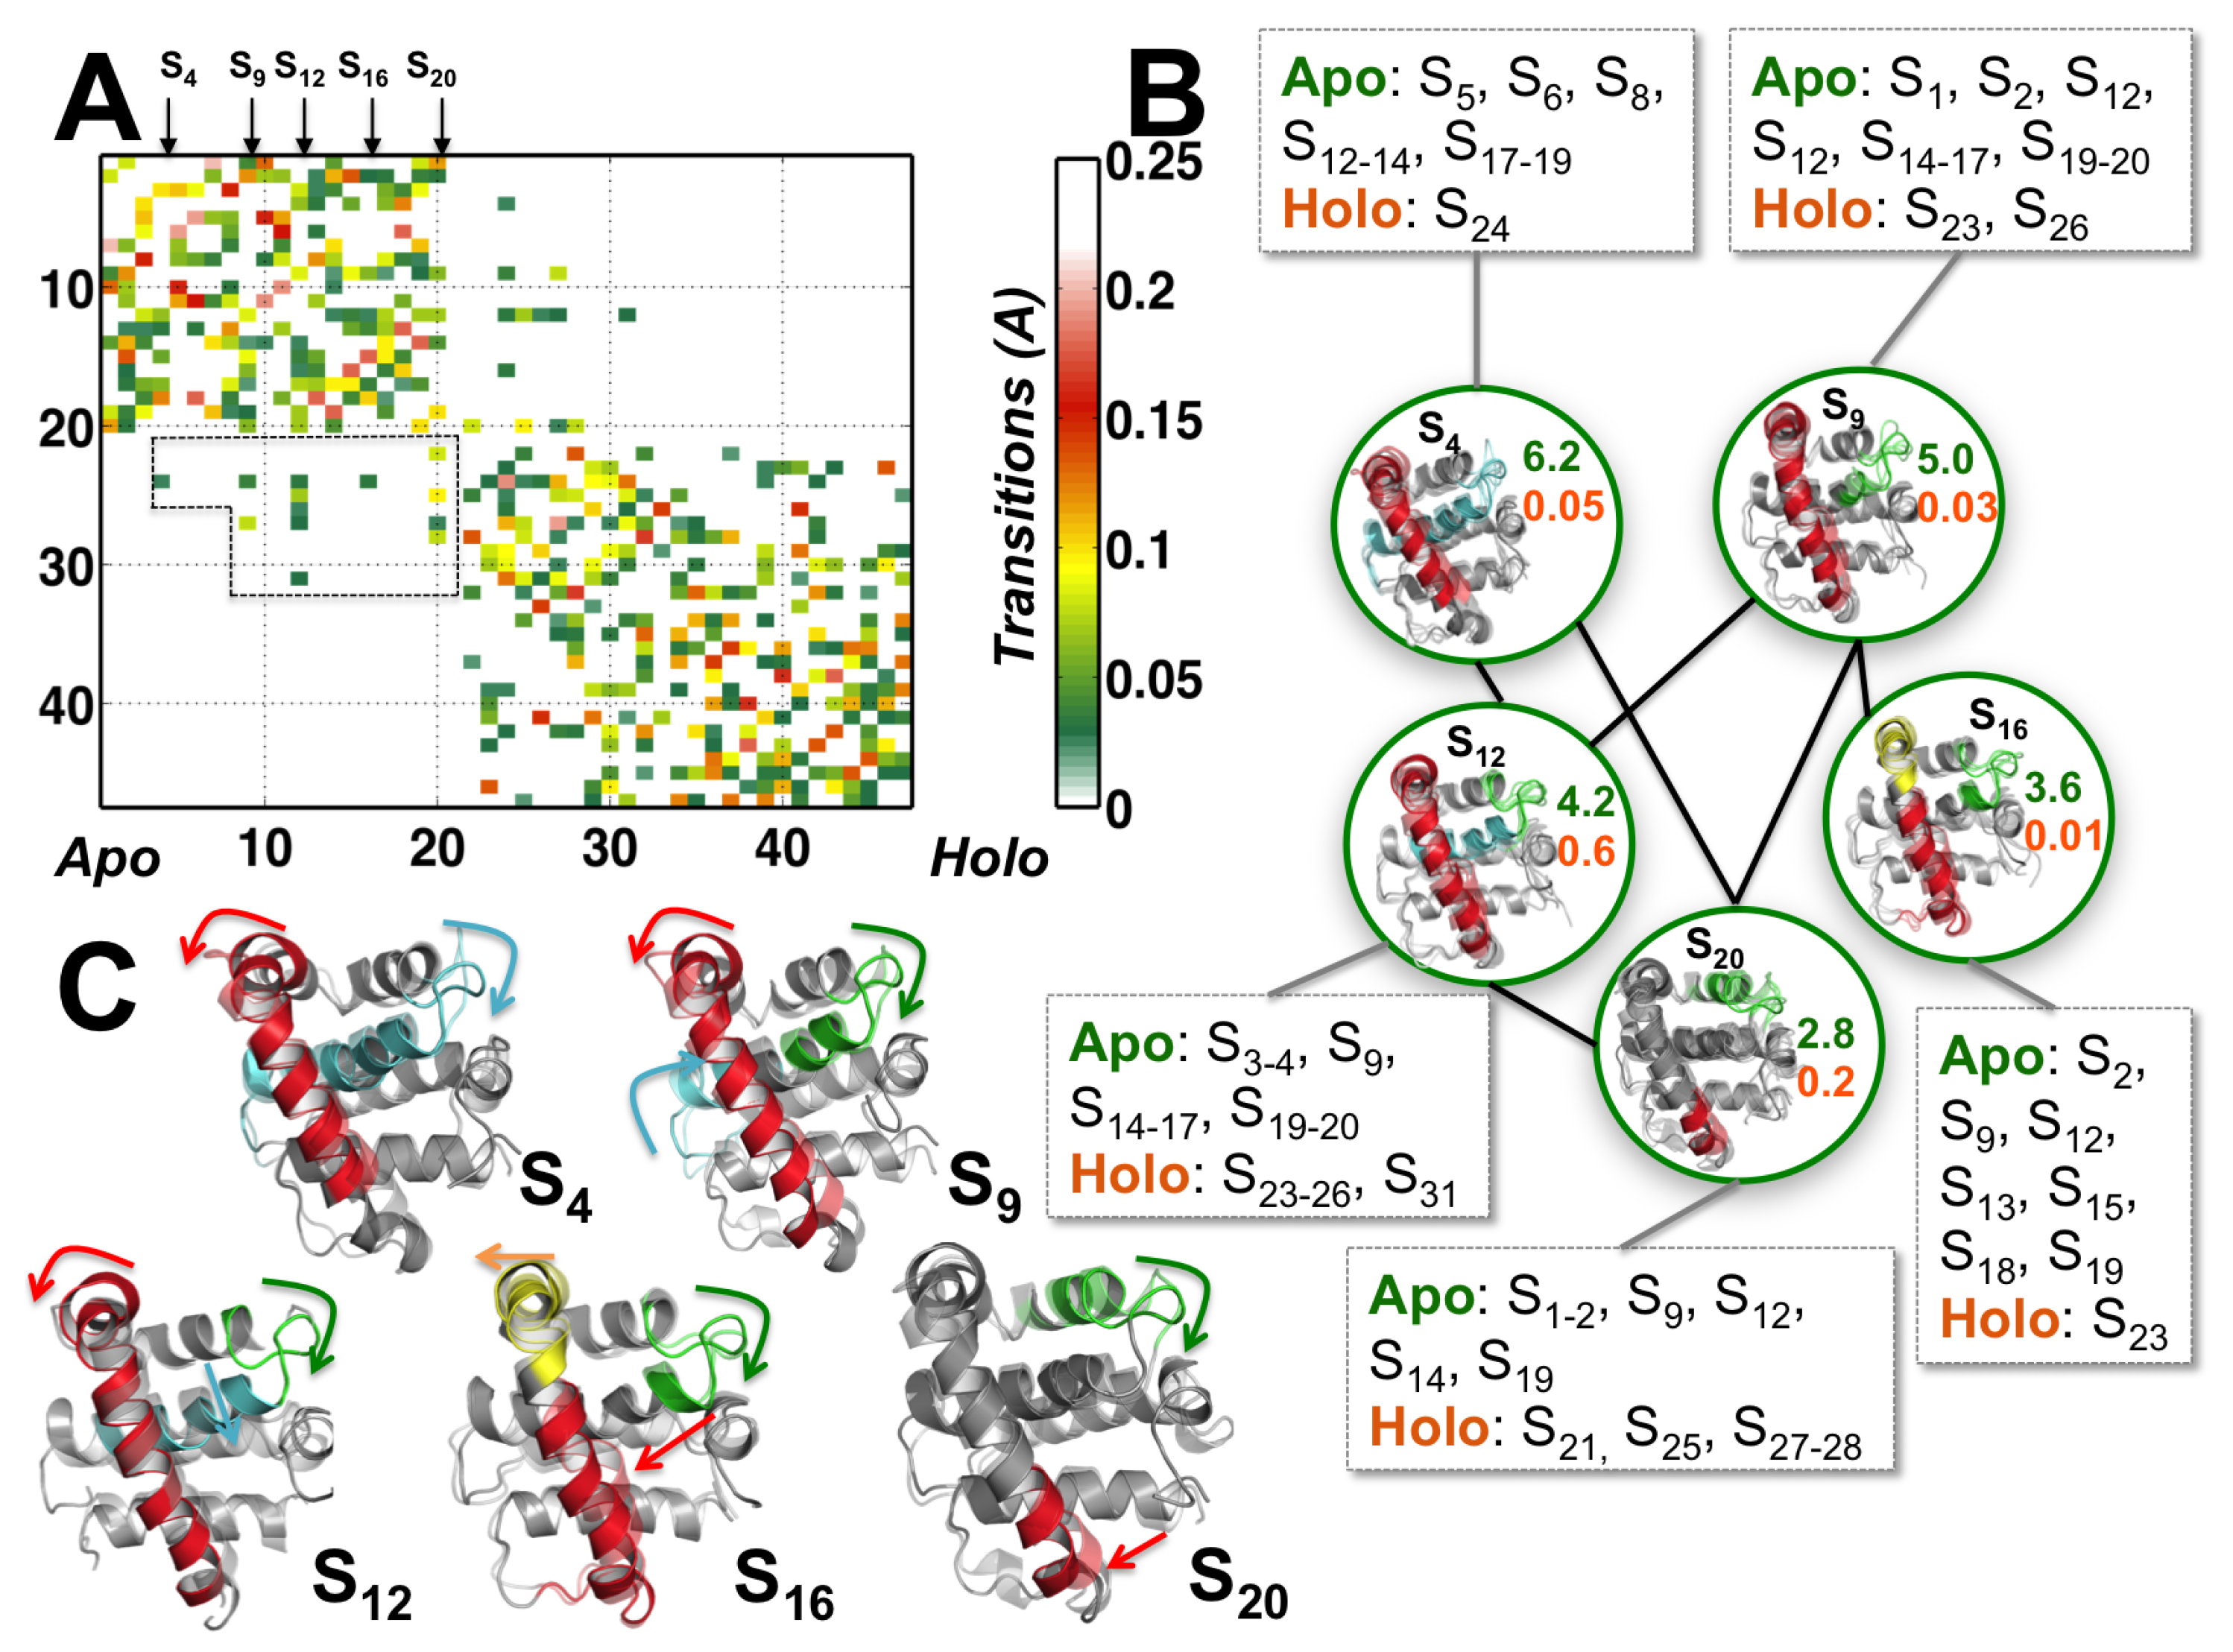
3.2. Structural Intermediates of the Apo- to Holo-M11 Show Transient Unfolding of 2
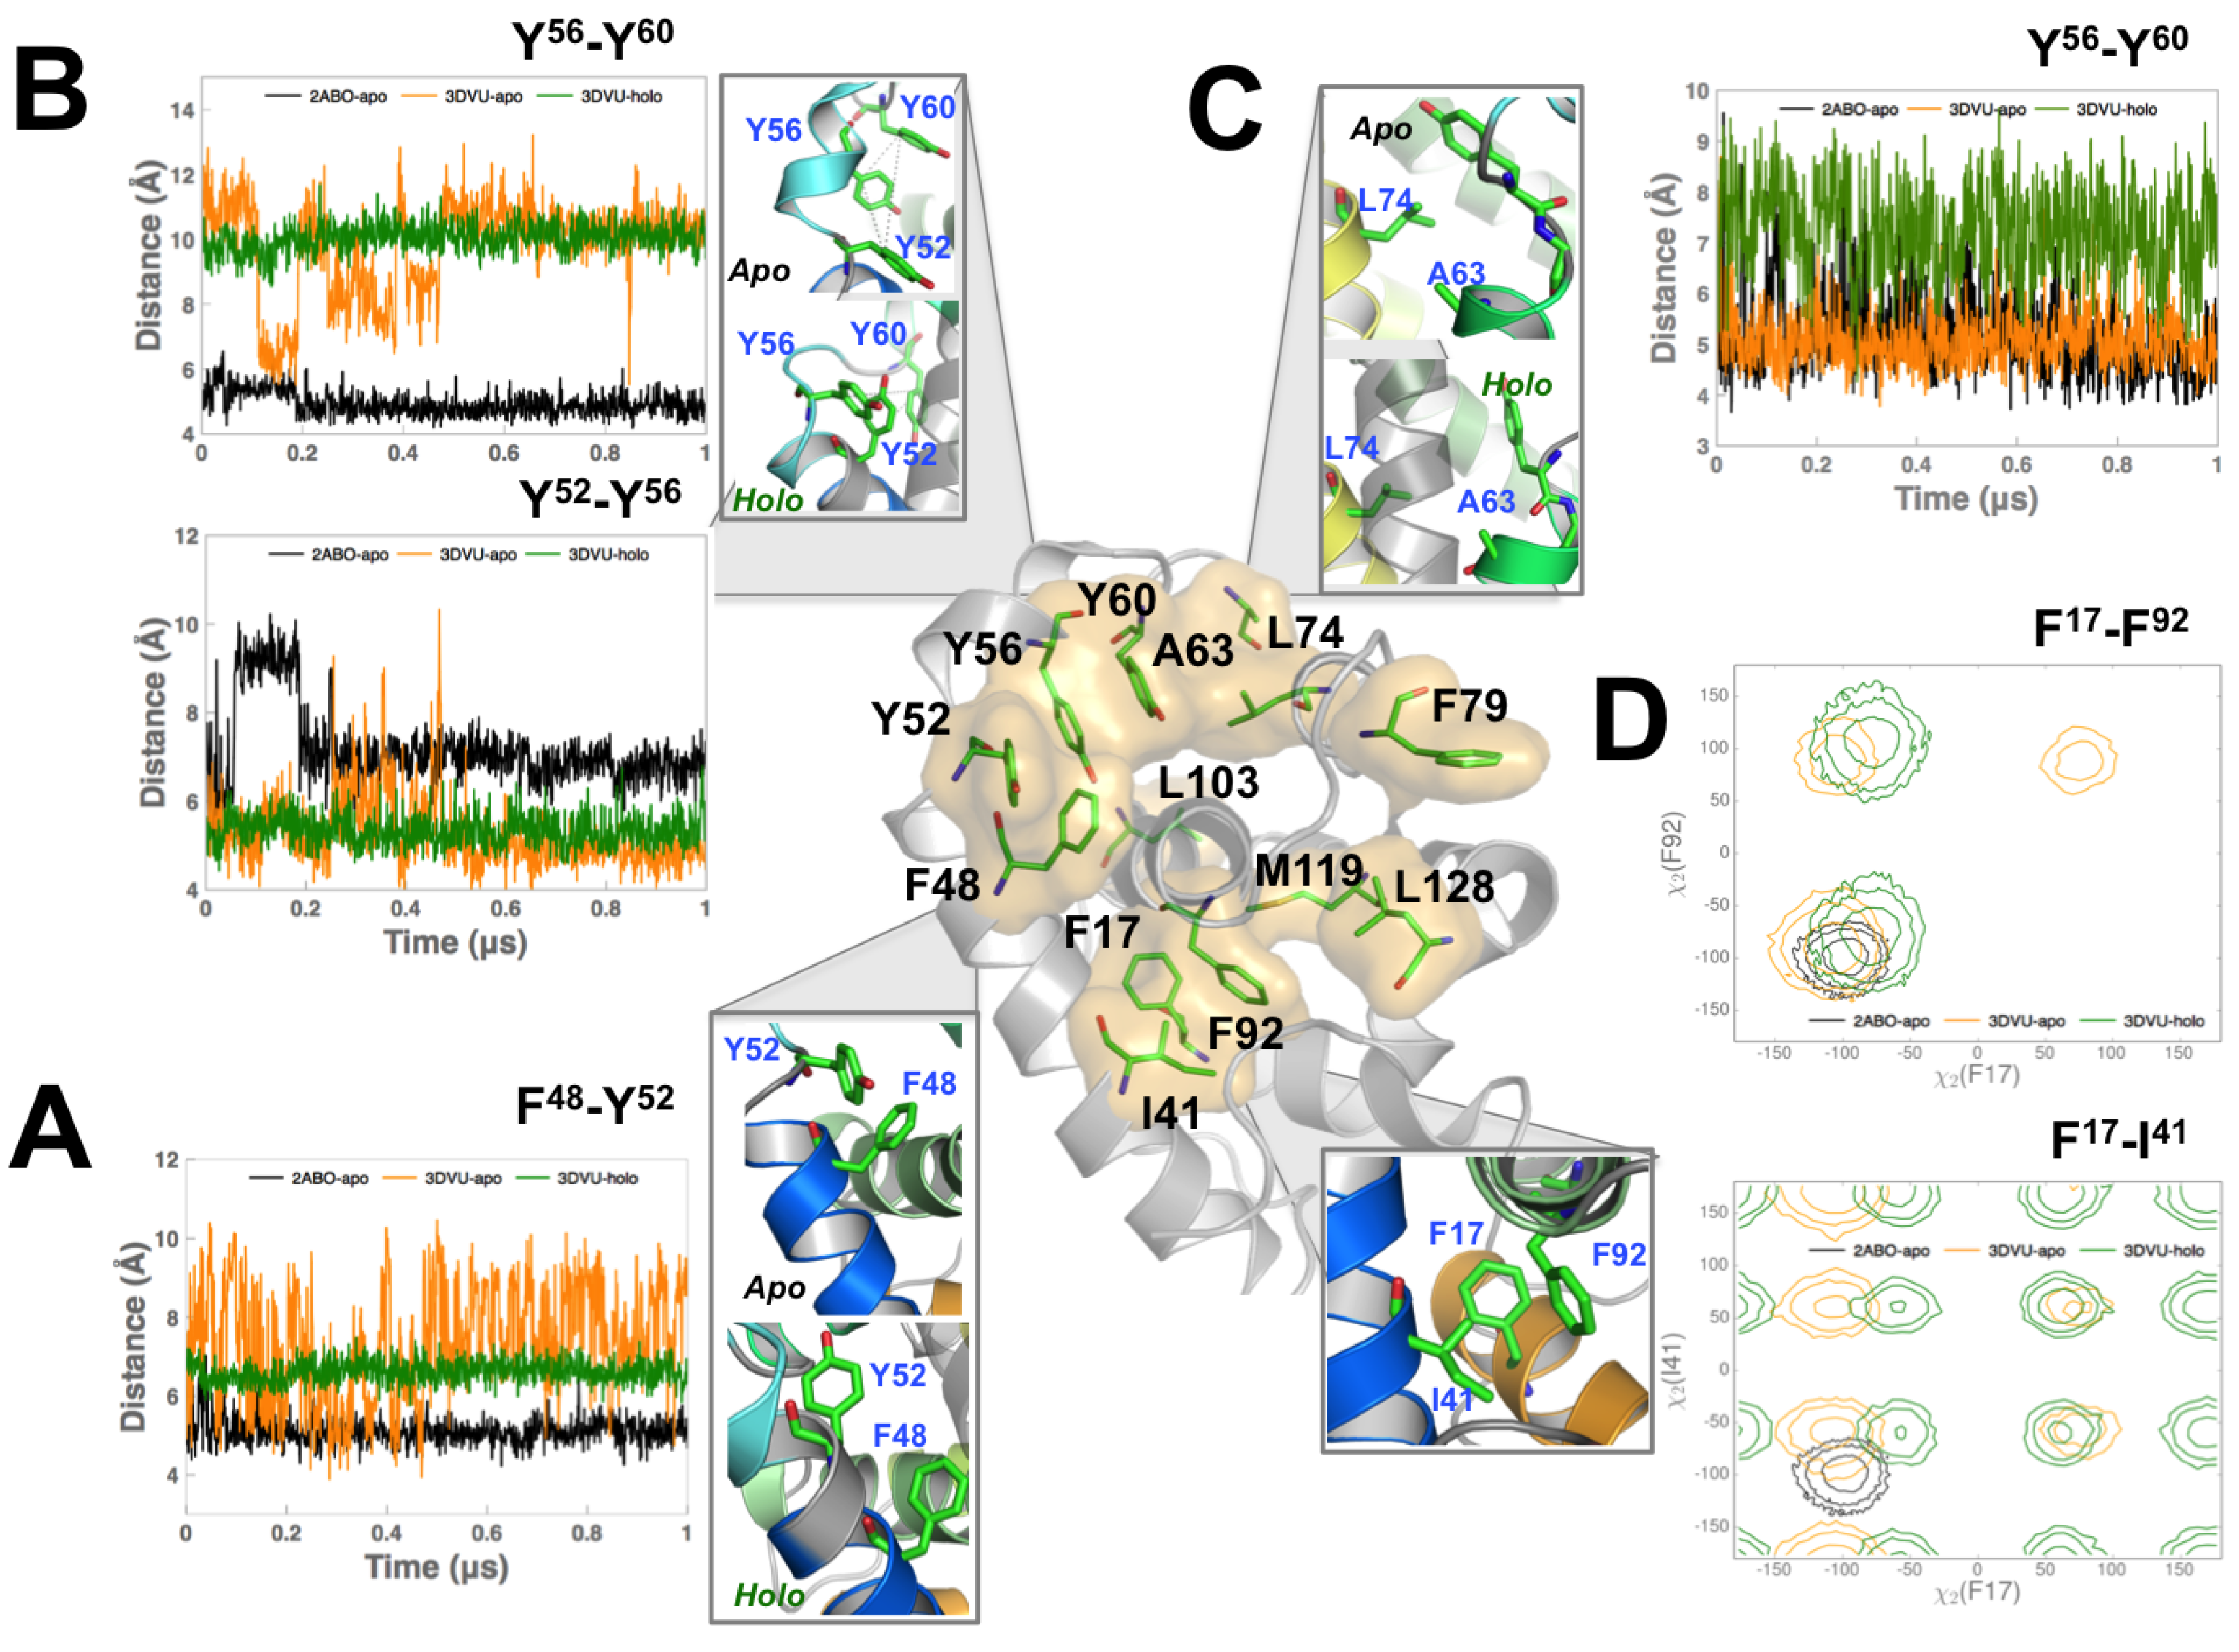
3.3. Perturbing Hydrophobic Interactions Farther from M11 Binding Cleft Impact BECN1 BH3D Binding
4. Discussion
Supplementary Materials
Author Contributions
Funding
Conflicts of Interest
References
- Cory, S.; Adams, J.M. The Bcl2 family: Regulators of the cellular life-or-death switch. Nat. Rev. Cancer 2002, 2, 647–656. [Google Scholar] [CrossRef] [PubMed]
- Cory, S.; Huang, D.C.S.; Adams, J.M. The Bcl-2 family: Roles in cell survival and oncogenesis. Oncogene 2003, 22, 8590–8607. [Google Scholar] [CrossRef] [PubMed] [Green Version]
- Youle, R.J.; Strasser, A. The BCL-2 protein family: Opposing activities that mediate cell death. Nat. Rev. Mol. Cell Biol. 2008, 9, 47–59. [Google Scholar] [CrossRef] [PubMed]
- Hardwick, J.M.; Soane, L. Multiple Functions of BCL-2 Family Proteins. Cold Spring Harb. Perspect Biol. 2013, 5, a008722. [Google Scholar] [CrossRef] [PubMed] [Green Version]
- Hardwick, J.; Bellows, D. Viral versus cellular BCL-2 proteins. Cell Death Differ. 2003, 10, S68–S76. [Google Scholar] [CrossRef]
- Bellows, D.S.; Chau, B.N.; Lee, P.; Lazebnik, Y.; Burns, W.H.; Hardwick, J.M. Antiapoptotic Herpesvirus Bcl-2 Homologs Escape Caspase-Mediated Conversion to Proapoptotic Proteins. J. Virol. 2000, 74, 5024–5031. [Google Scholar] [CrossRef]
- Gangappa, S.; van Dyk, L.F.; Jewett, T.J.; Speck, S.H.; Virgin, H.W. Identification of the In Vivo Role of a Viral bcl-2. J. Exp. Med. 2002, 195, 931–940. [Google Scholar] [CrossRef] [Green Version]
- Cuconati, A.; White, E. Viral homologs of BCL-2: Role of apoptosis in the regulation of virus infection. Genes Dev. 2002, 16, 2465–2478. [Google Scholar] [CrossRef] [Green Version]
- Altmann, M.; Hammerschmidt, W. Epstein-Barr Virus Provides a New Paradigm: A Requirement for the Immediate Inhibition of Apoptosis. PLoS Biol. 2005, 3, e404. [Google Scholar] [CrossRef] [Green Version]
- Xiaofei, E.; Hwang, S.; Oh, S.; Lee, J.S.; Jeong, J.H.; Gwack, Y.; Kowalik, T.F.; Sun, R.; Jung, J.U.; Liang, C. Viral Bcl-2-Mediated Evasion of Autophagy Aids Chronic Infection of γ Herpesvirus 68. PLoS Pathog. 2009, 5, e1000609. [Google Scholar]
- Tarakanova, V.L.; Suarez, F.; Tibbetts, S.A.; Jacoby, M.A.; Weck, K.E.; Hess, J.L.; Speck, S.H.; Virgin, H.W. Murine Gammaherpesvirus 68 Infection Is Associated with Lymphoproliferative Disease and Lymphoma in BALB β2 Microglobulin-Deficient Mice. J. Virol. 2005, 79, 14668–14679. [Google Scholar] [CrossRef] [PubMed] [Green Version]
- Gershburg, E.; Pagano, J.S. Epstein–Barr virus infections: Prospects for treatment. J. Antimicrob. Chemother. 2005, 56, 277–281. [Google Scholar] [CrossRef] [PubMed]
- Su, M.; Mei, Y.; Sanishvili, R.; Levine, B.; Colbert, C.L.; Sinha, S. Targeting γ-herpesvirus 68 Bcl-2 mediated down-regulation of autophagy. J. Biol. Chem. 2014, 289, 8029–8040. [Google Scholar] [CrossRef] [PubMed] [Green Version]
- Procko, E.; Berguig, G.Y.; Shen, B.W.; Song, Y.; Frayo, S.; Convertine, A.J.; Margineantu, D.; Booth, G.; Correia, B.E.; Cheng, Y.; et al. A Computationally Designed Inhibitor of an Epstein-Barr Viral Bcl-2 Protein Induces Apoptosis in Infected Cells. Cell 2014, 157, 1644–1656. [Google Scholar] [CrossRef] [PubMed] [Green Version]
- Foight, G.W.; Keating, A.E. Locating Herpesvirus Bcl-2 Homologs in the Specificity Landscape of Anti-Apoptotic Bcl-2 Proteins. J. Mol. Biol. 2015, 427, 2468–2490. [Google Scholar] [CrossRef] [Green Version]
- Mei, Y.; Su, M.; Soni, G.; Salem, S.; Colbert, C.L.; Sinha, S.C. Intrinsically disordered regions in autophagy proteins. Proteins Struct. Func. Bioinform. 2014, 82, 565–578. [Google Scholar] [CrossRef] [Green Version]
- Flanagan, A.M.; Letai, A. BH3 domains define selective inhibitory interactions with BHRF-1 and KSHV BCL-2. Cell Death. Differ. 2007, 15, 580–588. [Google Scholar] [CrossRef] [Green Version]
- Kvansakul, M.; Wei, A.H.; Fletcher, J.I.; Willis, S.N.; Chen, L.; Roberts, A.W.; Huang, D.C.S.; Colman, P.M. Structural Basis for Apoptosis Inhibition by Epstein-Barr Virus BHRF1. PLoS Pathog. 2010, 6, e1001236. [Google Scholar] [CrossRef] [Green Version]
- Sinha, S.C.; Colbert, C.L.; Becker, N.; Wei, Y.; Levine, B. Molecular basis of the regulation of Beclin 1-dependent autophagy by the γ-herpesvirus 68 Bcl-2 homolog M11. Autophagy 2008, 4, 989–997. [Google Scholar] [CrossRef]
- Ku, B.; Woo, J.S.; Liang, C.; Lee, K.H.; Hong, H.S.; E, X.; Kim, K.S.; Jung, J.U.; Oh, B.H. Structural and Biochemical Bases for the Inhibition of Autophagy and Apoptosis by Viral BCL-2 of Murine γ-Herpesvirus 68. PLoS Pathog. 2008, 4, e25. [Google Scholar] [CrossRef]
- Kang, R.; Zeh, H.J.; Lotze, M.T.; Tang, D. The Beclin 1 network regulates autophagy and apoptosis. Cell Death Differ. 2011, 18, 571–580. [Google Scholar] [CrossRef]
- Decuypere, J.P.; Parys, J.; Bultynck, G. Regulation of the autophagic Bcl-2/Beclin interaction. Cells 2012, 1, 284–312. [Google Scholar] [CrossRef] [PubMed]
- Chen, L.; Willis, S.N.; Wei, A.; Smith, B.J.; Fletcher, J.I.; Hinds, M.G.; Colman, P.M.; Day, C.L.; Adams, J.M.; Huang, D.C.S. Differential Targeting of Prosurvival Bcl-2 Proteins by Their BH3-Only Ligands Allows Complementary Apoptotic Function. Mol. Cell 2005, 17, 393–403. [Google Scholar] [CrossRef]
- Gavathiotis, E.; Suzuki, M.; Davis, M.L.; Pitter, K.; Bird, G.H.; Katz, S.G.; Tu, H.C.; Kim, H.; Cheng, E.H.Y.; Tjandra, N.; et al. BAX activation is initiated at a novel interaction site. Nature 2008, 455, 1076–1081. [Google Scholar] [CrossRef] [Green Version]
- Gavathiotis, E.; Reyna, D.; Davis, M.L.; Bird, G.H.; Walensky, L. BH3-Triggered Structural Reorganization Drives the Activation of Proapoptotic {BAX}. Mol. Cell 2010, 40, 481–492. [Google Scholar] [CrossRef] [PubMed] [Green Version]
- George, N.M.; Evans, J.J.; Luo, X. A three-helix homo-oligomerization domain containing BH3 and BH1 is responsible for the apoptotic activity of Bax. Genes Dev. 2007, 21, 1937–1948. [Google Scholar] [CrossRef] [PubMed] [Green Version]
- Ionescu, C.M.; Svobodová Vařeková, R.; Prehn, J.H.M.; Huber, H.J.; Koča, J. Charge Profile Analysis Reveals That Activation of Pro-apoptotic Regulators Bax and Bak Relies on Charge Transfer Mediated Allosteric Regulation. PLoS Comput. Biol. 2012, 8, e1002565. [Google Scholar] [CrossRef] [Green Version]
- Follis, A.V.; Chipuk, J.E.; Fisher, J.C.; Yun, M.K.; Grace, C.R.; Nourse, A.; Baran, K.; Ou, L.; Min, L.; White, S.W.; et al. PUMA binding induces partial unfolding within BCL-xL to disrupt p53 binding and promote apoptosis. Nat. Chem. Biol. 2013, 9, 163–168. [Google Scholar] [CrossRef] [Green Version]
- Kvansakul, M.; Hinds, M.G. The Bcl-2 family: Structures, interactions and targets for drug discovery. Apoptosis 2015, 20, 136–150. [Google Scholar] [CrossRef]
- Ramanathan, A.; Savol, A.J.; Langmead, C.J.; Agarwal, P.K.; Chennubhotla, C.S. Discovering conformational sub-states relevant to protein function. PLoS ONE 2011, 6, e15827. [Google Scholar] [CrossRef] [Green Version]
- Burger, V.M.; Ramanathan, A.; Savol, A.J.; Stanley, C.B.; Agarwal, P.K.; Chennubhotla, C.S. Quasi-anharmonic analysis reveals intermediate States in the nuclear co-activator receptor binding domain ensemble. Pac. Symp. Biocomput. 2012, 12, 70–81. [Google Scholar]
- Ramanathan, A.; Savol, A.; Burger, V.; Chennubhotla, C.S.; Agarwal, P.K. Protein Conformational Populations and Functionally Relevant Substates. Acc. Chem. Res. 2013, 47, 149–156. [Google Scholar] [CrossRef] [PubMed]
- Ramanathan, A.; Savol, A.J.; Agarwal, P.K.; Chennubhotla, C.S. Event detection and sub-state discovery from biomolecular simulations using higher-order statistics: Application to enzyme adenylate kinase. Proteins Struct. Funct. Bioinform. 2012, 80, 2536–2551. [Google Scholar] [CrossRef] [PubMed] [Green Version]
- Maier, J.A.; Martinez, C.; Kasavajhala, K.; Wickstrom, L.; Hauser, K.E.; Simmerling, C. ff14SB: Improving the Accuracy of Protein Side Chain and Backbone Parameters from ff99SB. J. Chem. Theory Comput. 2015, 11, 3696–3713. [Google Scholar] [CrossRef] [PubMed] [Green Version]
- Ramanathan, A.; Agarwal, P.K. Computational Identification of Slow Conformational Fluctuations in Proteins. J. Phys. Chem. B 2009, 113, 16669–16680. [Google Scholar] [CrossRef] [Green Version]
- Ryckaert, J.P.; Ciccotti, G.; Berendsen, H.J.C. Numerical integration of the cartesian equations of motion of a system with constraints: Molecular dynamics of n-alkanes. J. Comput. Phys. 1977, 23, 327–341. [Google Scholar] [CrossRef] [Green Version]
- Mao, B.; Pear, M.R.; McCammon, J.A.; Northrup, S.H. Molecular dynamics of ferrocytochrome c: Anharmonicity of atomic displacements. Biopolymers 1982, 21, 1979–1989. [Google Scholar] [CrossRef]
- Ichiye, T.; Karplus, M. Anisotropy and anharmonicity of atomic fluctuations in proteins: Analysis of a molecular dynamics simulation. Proteins Struct. Func. Bioinform. 1987, 2, 236–259. [Google Scholar] [CrossRef]
- Savol, A.J.; Burger, V.M.; Agarwal, P.K.; Ramanathan, A.; Chennubhotla, C.S. QAARM: Quasi-anharmonic autoregressive model reveals molecular recognition pathways in ubiquitin. Bioinformatics 2011, 27, 52–60. [Google Scholar] [CrossRef]
- Amari, S.; Cichocki, A.; Yang, H.H. A New Learning Algorithm for Blind Signal Separation. In Advances in Neural Information Processing Systems 9, NIPS; Denver, C.O., Mozer, M., Jordan, M.I., Petsche, T., Eds.; MIT Press: Cambridge, MA, USA, 1996; pp. 757–763. [Google Scholar]
- Burger, V.; Chennubhotla, C. Nhs: Network-based hierarchical segmentation for cryo-electron microscopy density maps. Biopolymers 2012, 97, 732–741. [Google Scholar] [CrossRef] [Green Version]
- Loh, J.; Huang, Q.; Petros, A.M.; Nettesheim, D.; van Dyk, L.F.; Labrada, L.; Speck, S.H.; Levine, B.; Olejniczak, E.T.; Virgin, H.W., IV. A Surface Groove Essential for Viral Bcl-2 Function During Chronic Infection In Vivo. PLoS Pathog. 2005, 1, e10. [Google Scholar] [CrossRef] [PubMed]
- Case, D.A.; Darden, T.A.; Cheatham, T.E.I.; Simmerling, C.L.; Wang, J.; Duke, R.E.; Luo, R.; Merz, K.M.; Wang, B.; Pearlman, D.A.; et al. AMBER 12; University of California: San Francisco, CA, USA, 2012. [Google Scholar]
- Touw, W.; Baakman, C.; Black, J.; te Beek, T.A.H.; Krieger, E.; Joosten, R.; Vriend, G. A series of PDB related databases for everyday needs. Nucl. Acids Res. 2015, 43, D364–D368. [Google Scholar] [CrossRef]
- Kabsch, W.; Sander, C. Dictionary of protein secondary structure: Pattern recognition of hydrogen-bonded and geometric features. Biopolymers 1983, 22, 2577–2637. [Google Scholar] [CrossRef] [PubMed]
- Chennubhotla, C.; Bahar, I. Signal Propagation in Proteins and Relation to Equilibrium Fluctuations. PLoS Comput. Biol. 2007, 3, e172. [Google Scholar]
- Chennubhotla, C.; Bahar, I. Markov Methods for Hierarchical Coarse-Graining of Large Protein Dynamics. J. Comput. Biol. 2007, 14, 765–776. [Google Scholar] [CrossRef]
- Chavez, L.L.; Onuchic, J.; Clementi, C. Quantifying the Roughness on the Free Energy Landscape: Entropic Bottlenecks and Protein Folding Rates. J. Am. Chem. Soc. 2004, 126, 8426–8432. [Google Scholar] [CrossRef]
- Kamat, A.P.; Lesk, A.M. Contact patterns between helices and strands of sheet define protein folding patterns. Proteins Struct. Func. Bioinform. 2007, 66, 869–876. [Google Scholar] [CrossRef]
- Mizushima, N.; Levine, B.; Cuervo, A.M.; Klionsky, D.J. Autophagy fights disease through cellular self-digestion. Nature 2008, 451, 1069–1075. [Google Scholar] [CrossRef] [Green Version]
- Levine, B.; Sinha, S.C.; Kroemer, G. Bcl-2 family members: Dual regulators of apoptosis and autophagy. Autophagy 2008, 4, 600–606. [Google Scholar] [CrossRef] [Green Version]
- Kvansakul, M.; Hinds, M.G. Structural biology of the Bcl-2 family and its mimicry by viral proteins. Cell Death Dis. 2013, 4, e909. [Google Scholar] [CrossRef]
- Fire, E.; Gulla, S.V.; Grant, R.A.; Keating, A.E. Mcl-1-Bim complexes accommodate surprising point mutations via minor structural changes. Protein Sci. 2010, 19, 507–519. [Google Scholar] [CrossRef] [PubMed]
- Pan, A.C.; Jacobson, D.; Yatsenko, K.; Sritharan, D.; Weinreich, T.M.; Shaw, D.E. Atomic-level characterization of protein–protein association. Proc. Natl. Acad. Sci. USA 2019, 116, 4244–4249. [Google Scholar] [CrossRef] [PubMed] [Green Version]
- Kharche, S.A.; Sengupta, D. Dynamic protein interfaces and conformational landscapes of membrane protein complexes. Curr. Opin. Struct. Biol. 2020, 61, 191–197. [Google Scholar] [CrossRef]
- Siebenmorgen, T.; Engelhard, M.; Zacharias, M. Prediction of protein–protein complexes using replica exchange with repulsive scaling. J. Comput. Chem. 2020, 41, 1436–1447. [Google Scholar] [CrossRef] [PubMed] [Green Version]
- Dhusia, K.; Su, Z.; Wu, Y. Using Coarse-Grained Simulations to Characterize the Mechanisms of Protein– Protein Association. Biomolecules 2020, 10, 1056. [Google Scholar] [CrossRef] [PubMed]
- Gapsys, V.; de Groot, B.L. On the importance of statistics in molecular simulations for thermodynamics, kinetics and simulation box size. eLife 2020, 9, e57589. [Google Scholar] [CrossRef]
- Lee, H.; Turilli, M.; Jha, S.; Bhowmik, D.; Ma, H.; Ramanathan, A. DeepDriveMD: Deep-Learning Driven Adaptive Molecular Simulations for Protein Folding. In Proceedings of the 2019 IEEE/ACM Third Workshop on Deep Learning on Supercomputers (DLS), Denver, CO, USA, 17 November 2019; pp. 12–19. [Google Scholar]
- Mei, Y.; Glover, K.; Su, M.; Sinha, S.C. Conformational flexibility of BECN1: Essential to its key role in autophagy and beyond. Protein Sci. 2016, 25, 1767–1785. [Google Scholar] [CrossRef] [Green Version]


| (M) | () | H (kJ/mol) | G (kJ/mol) | S (J/K·mol) | Distance (Å) | |
|---|---|---|---|---|---|---|
| WT | - | |||||
| F48A | 9.4 | |||||
| A63K | 11.9 | |||||
| Y56A | 9.7 | |||||
| F17A | N/A | N/A | N/A | N/A | N/A | 19.7 |
© 2020 by the authors. Licensee MDPI, Basel, Switzerland. This article is an open access article distributed under the terms and conditions of the Creative Commons Attribution (CC BY) license (http://creativecommons.org/licenses/by/4.0/).
Share and Cite
Ramanathan, A.; Parvatikar, A.; Chennubhotla, S.C.; Mei, Y.; Sinha, S.C. Transient Unfolding and Long-Range Interactions in Viral BCL2 M11 Enable Binding to the BECN1 BH3 Domain. Biomolecules 2020, 10, 1308. https://doi.org/10.3390/biom10091308
Ramanathan A, Parvatikar A, Chennubhotla SC, Mei Y, Sinha SC. Transient Unfolding and Long-Range Interactions in Viral BCL2 M11 Enable Binding to the BECN1 BH3 Domain. Biomolecules. 2020; 10(9):1308. https://doi.org/10.3390/biom10091308
Chicago/Turabian StyleRamanathan, Arvind, Akash Parvatikar, Srinivas C. Chennubhotla, Yang Mei, and Sangita C. Sinha. 2020. "Transient Unfolding and Long-Range Interactions in Viral BCL2 M11 Enable Binding to the BECN1 BH3 Domain" Biomolecules 10, no. 9: 1308. https://doi.org/10.3390/biom10091308