Computational Identification and Characterization of New microRNAs in Human Platelets Stored in a Blood Bank

 ,
,  and
and 
Abstract
:1. Introduction
2. Methods
2.1. Dataset Analysis
2.2. MicroRNAs Prediction in PCs
2.3. MicroRNA Expression and Quality Analysis between Different PCs
2.4. Validation of microRNAs by qPCR on 100 PC Units
2.5. IsomiR Annotation Analysis
2.6. MicroRNAs Target Prediction
2.7. Construction of the microRNA—Gene Interaction Network
2.8. Functional Enrichment Analysis
2.9. Statistical Analysis
3. Results
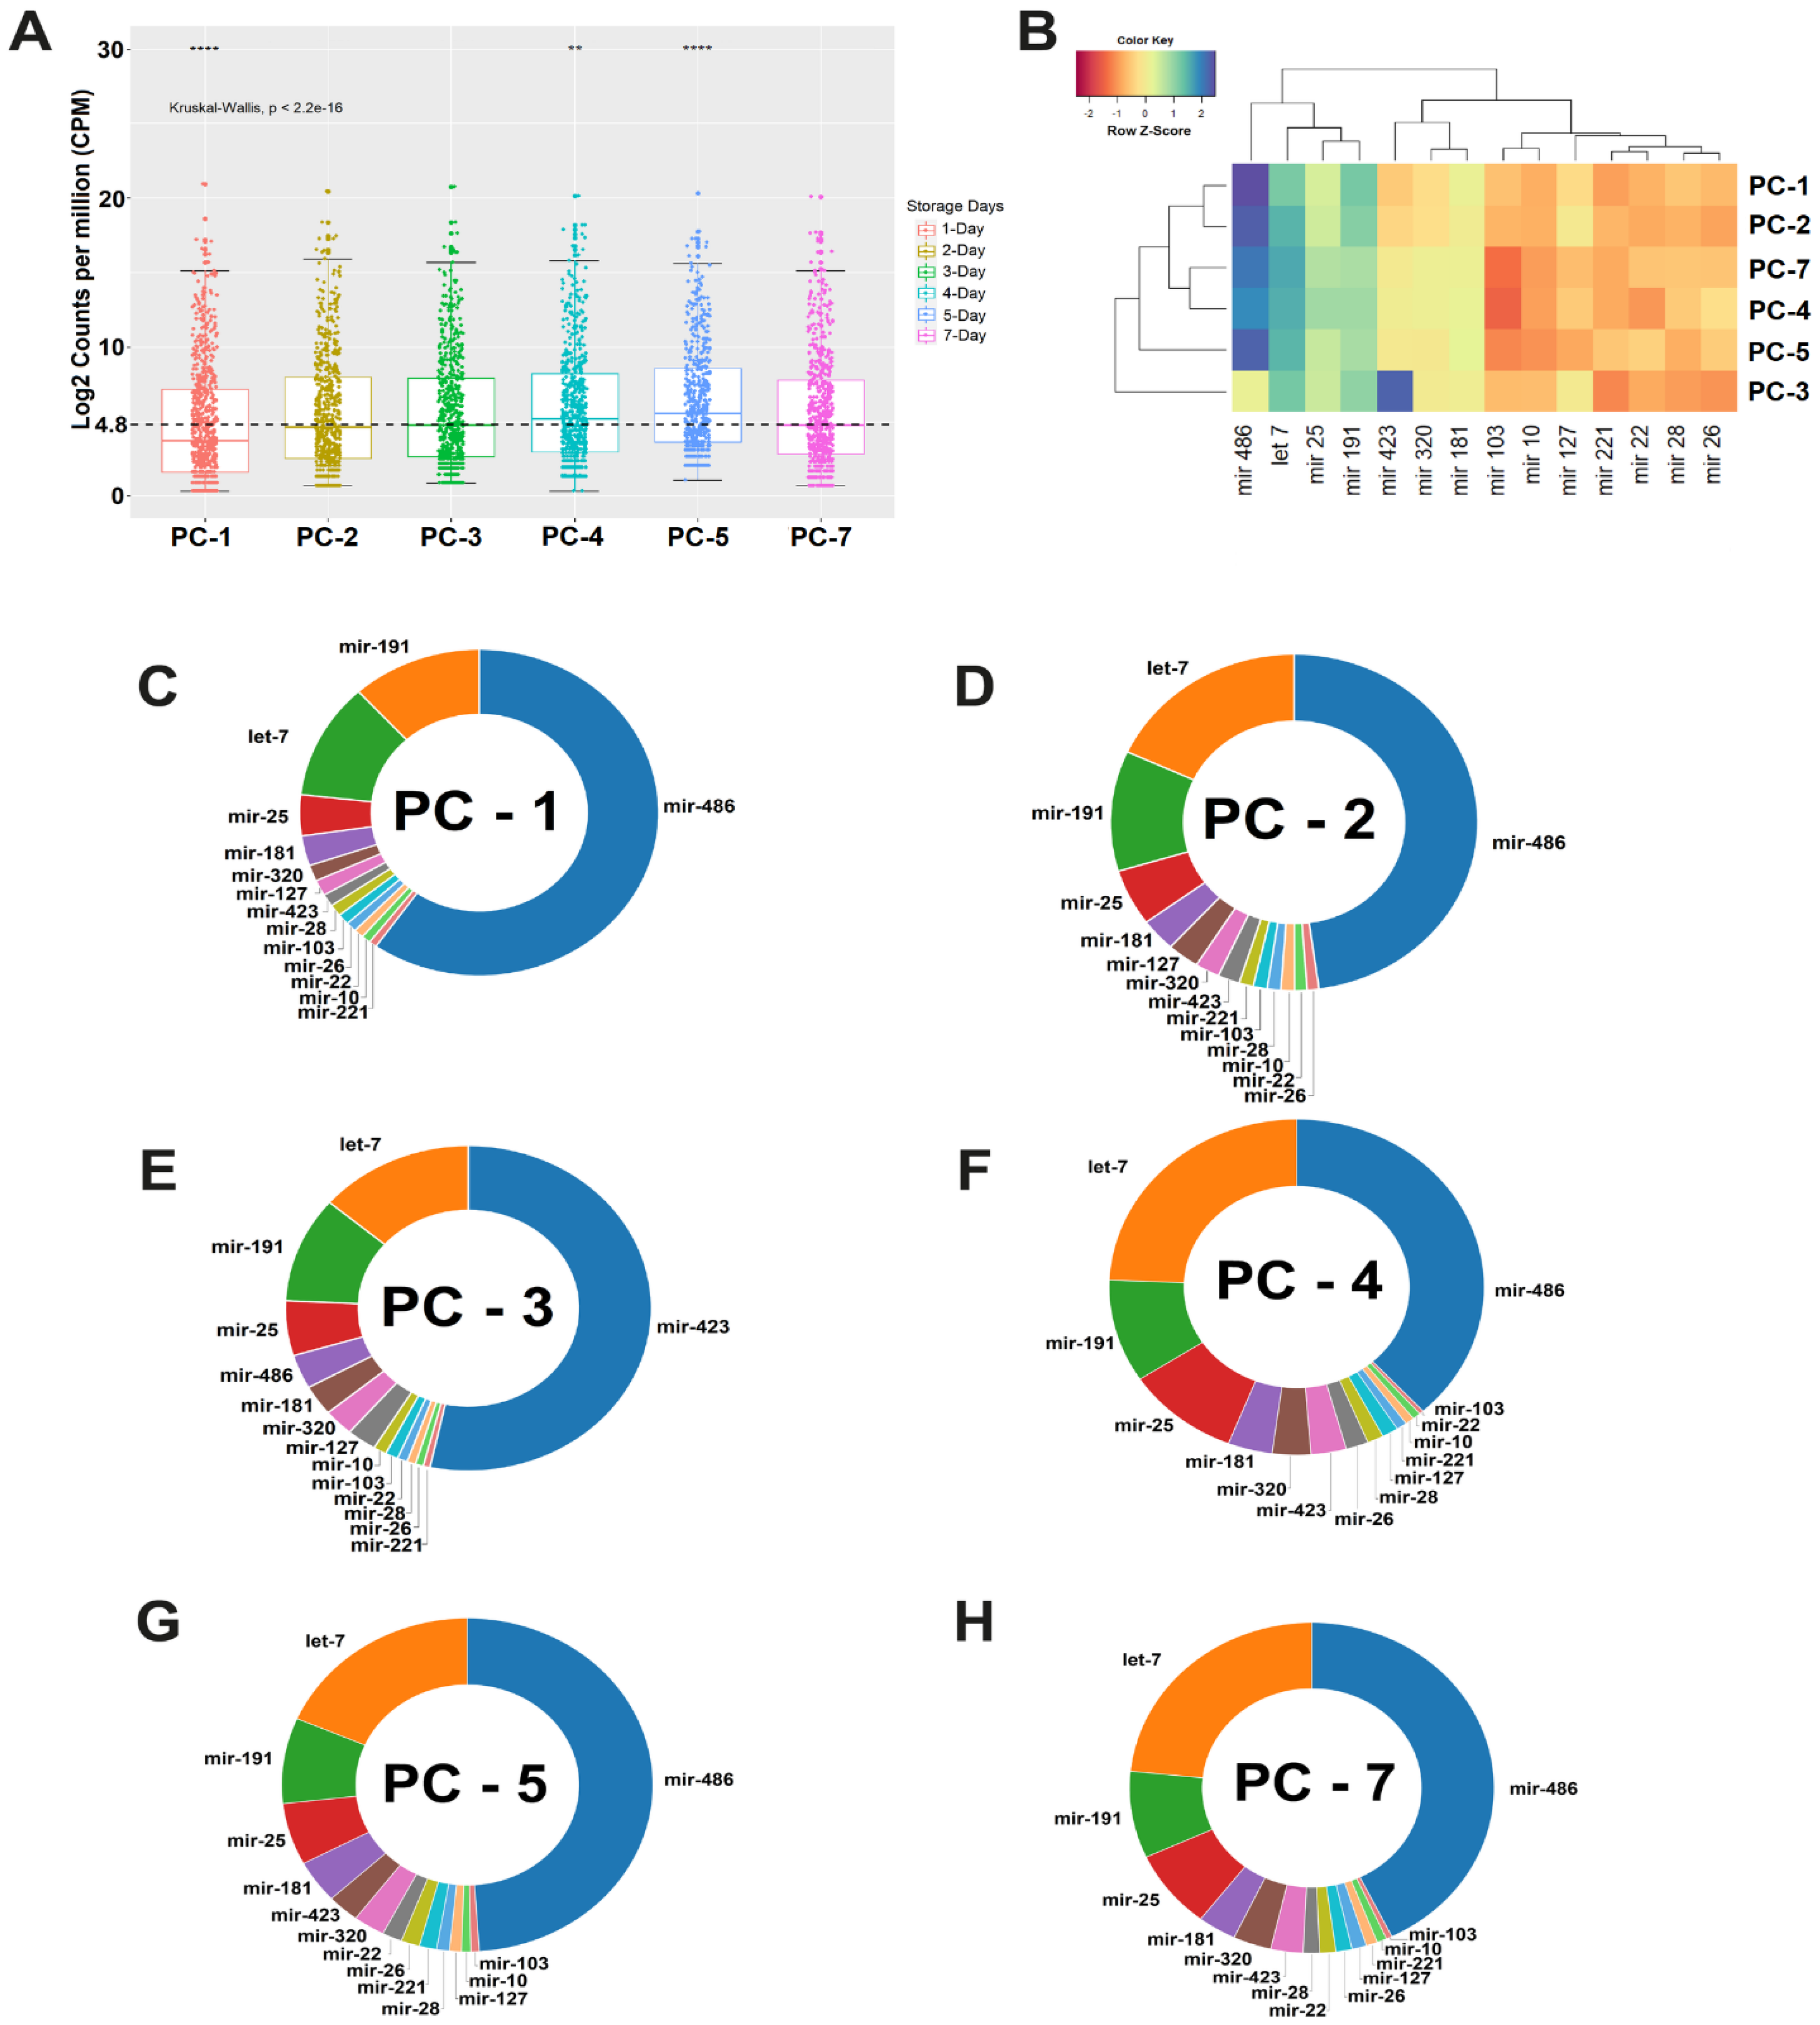
3.1. Data Preprocessing and Abundance of microRNAs in Platelet Concentrate
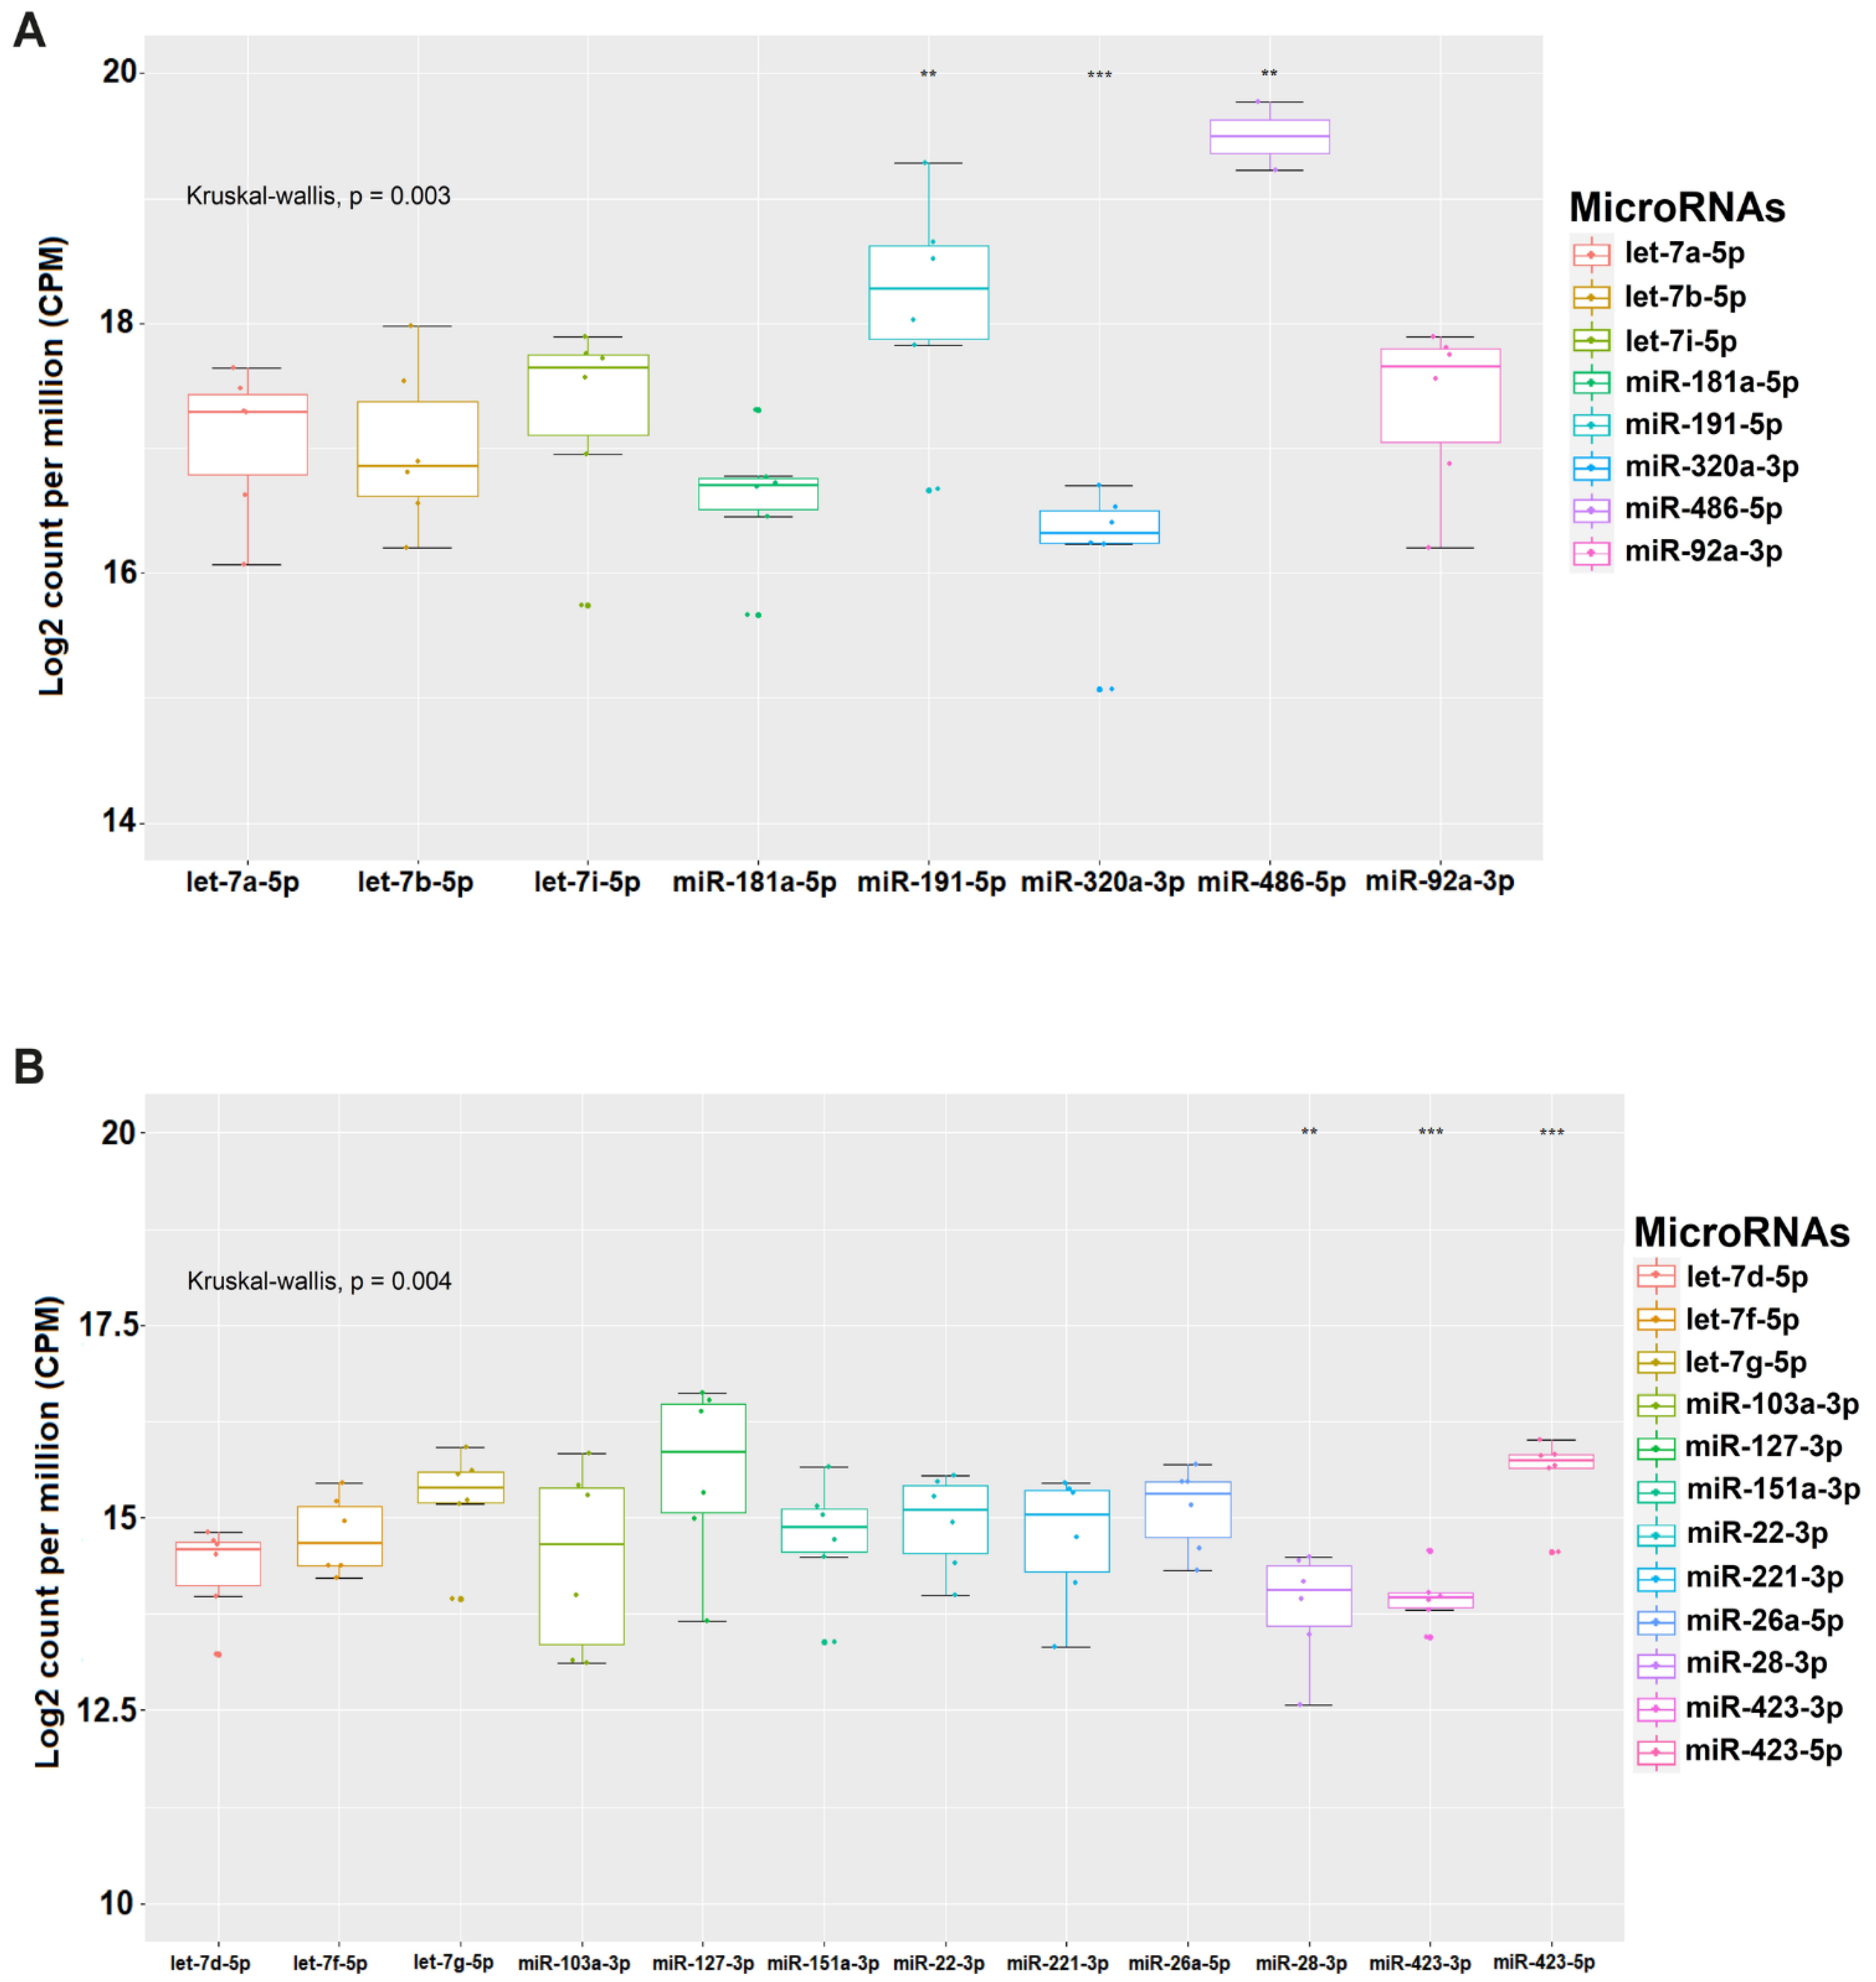
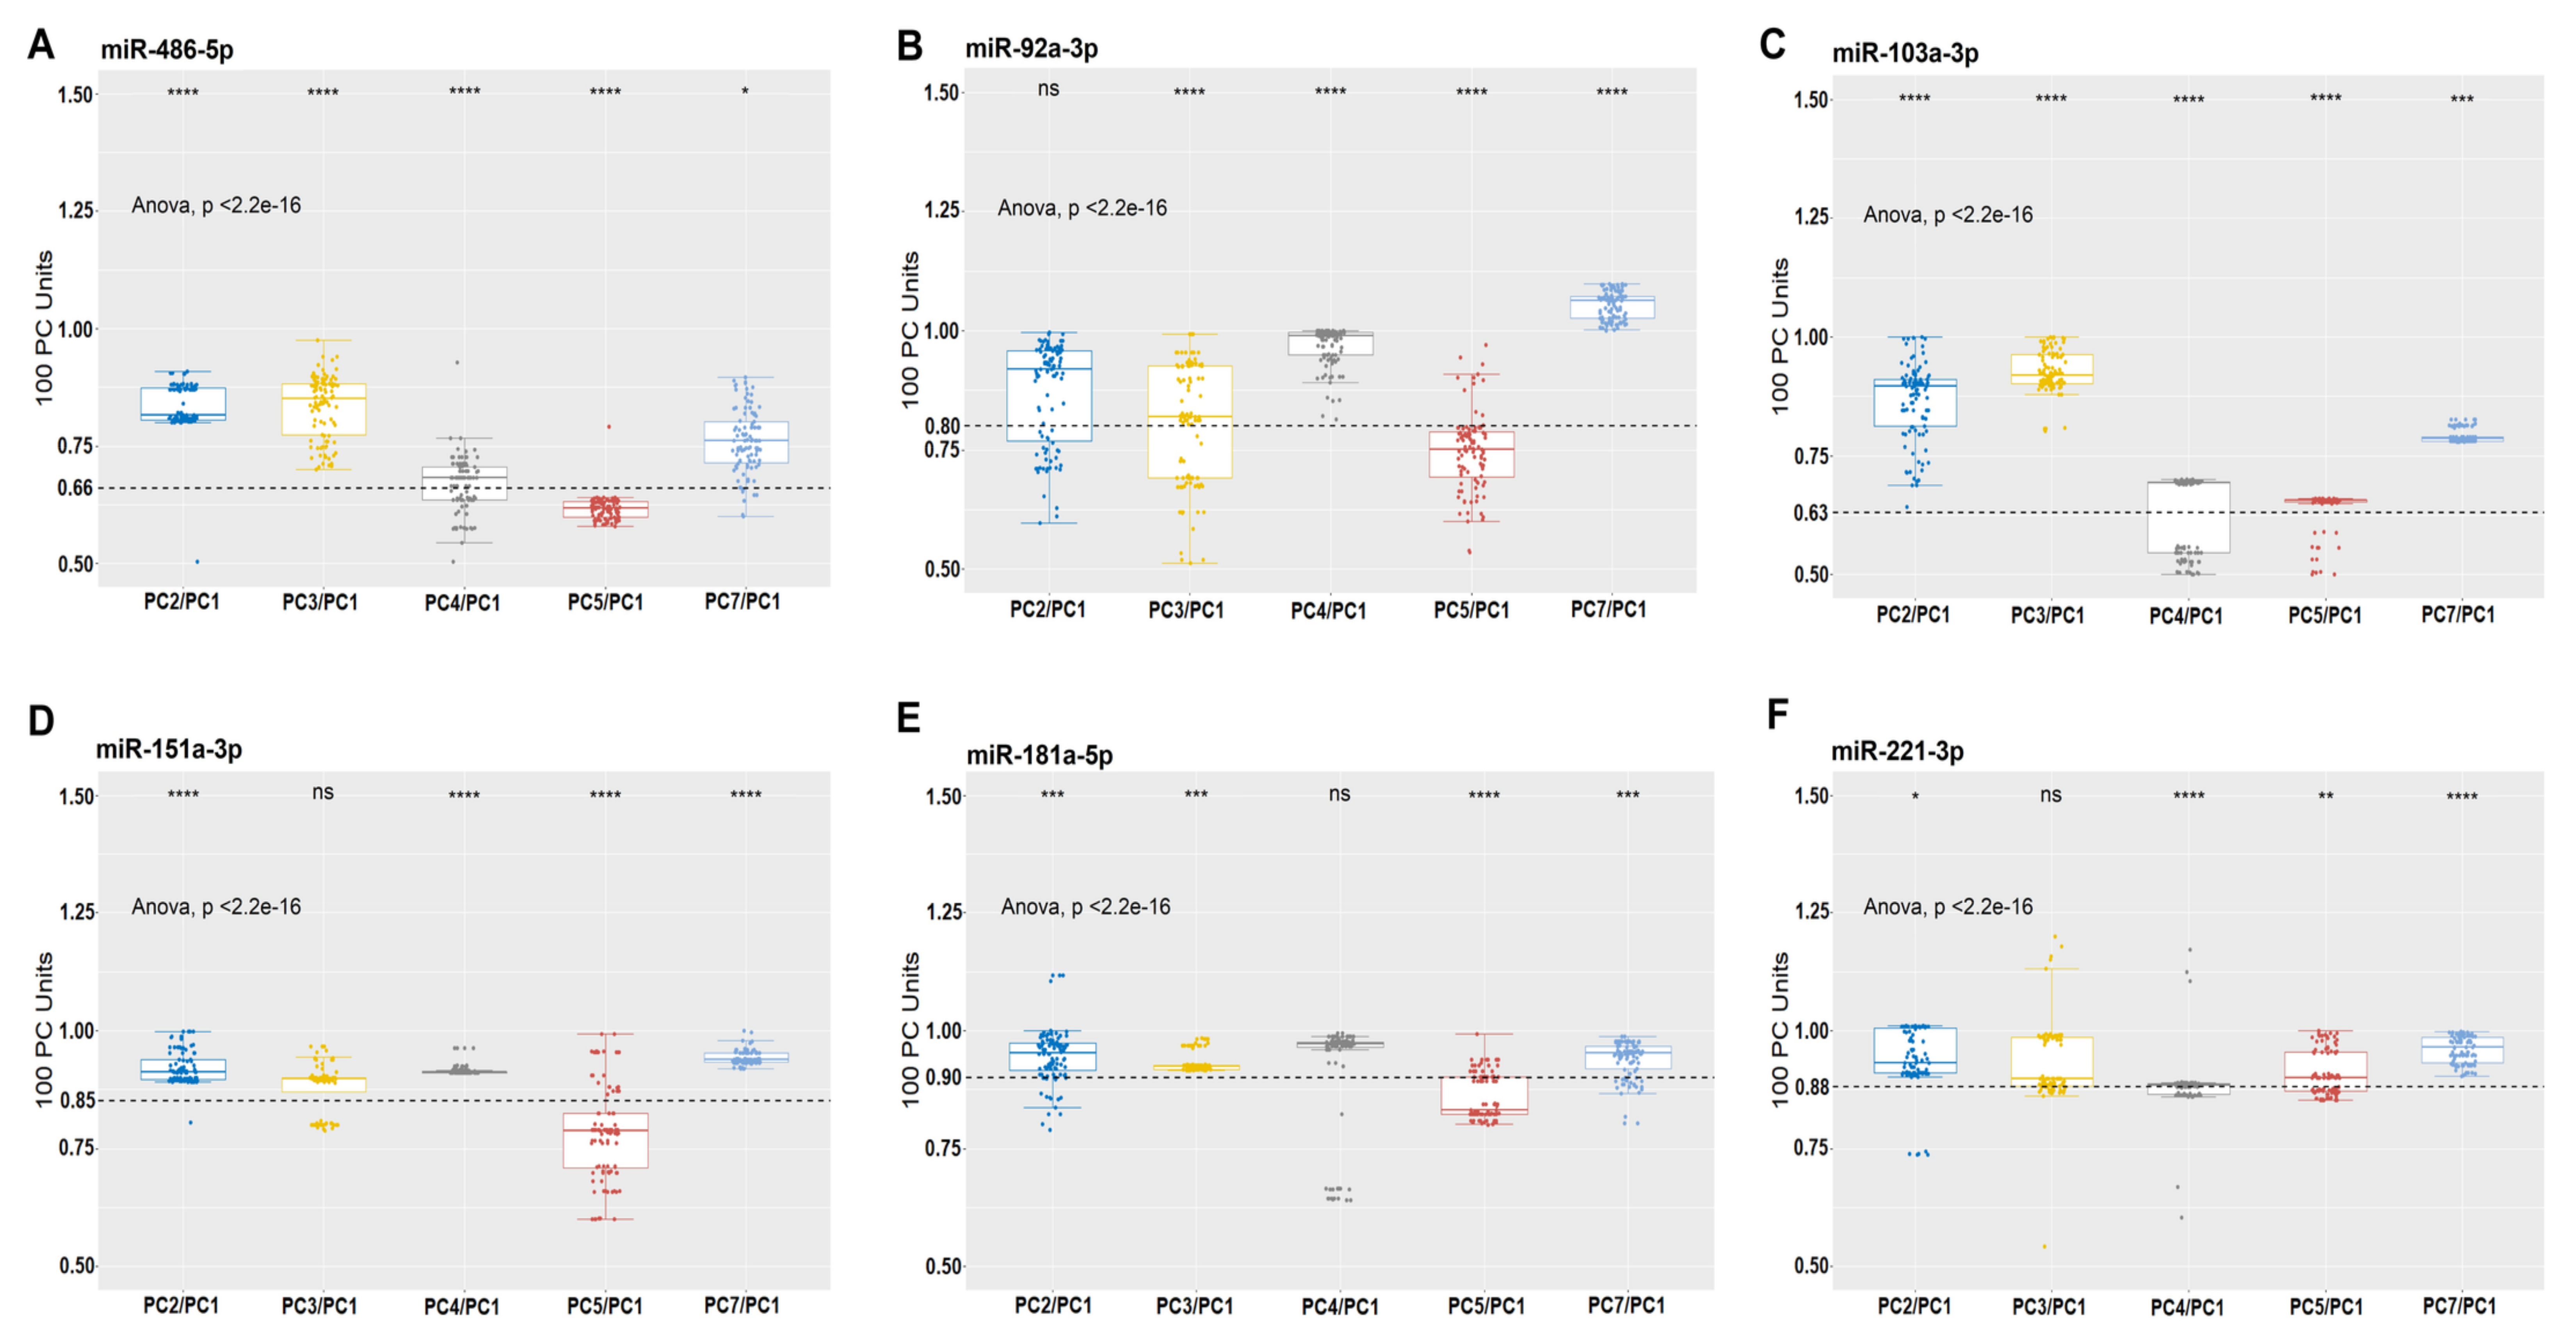
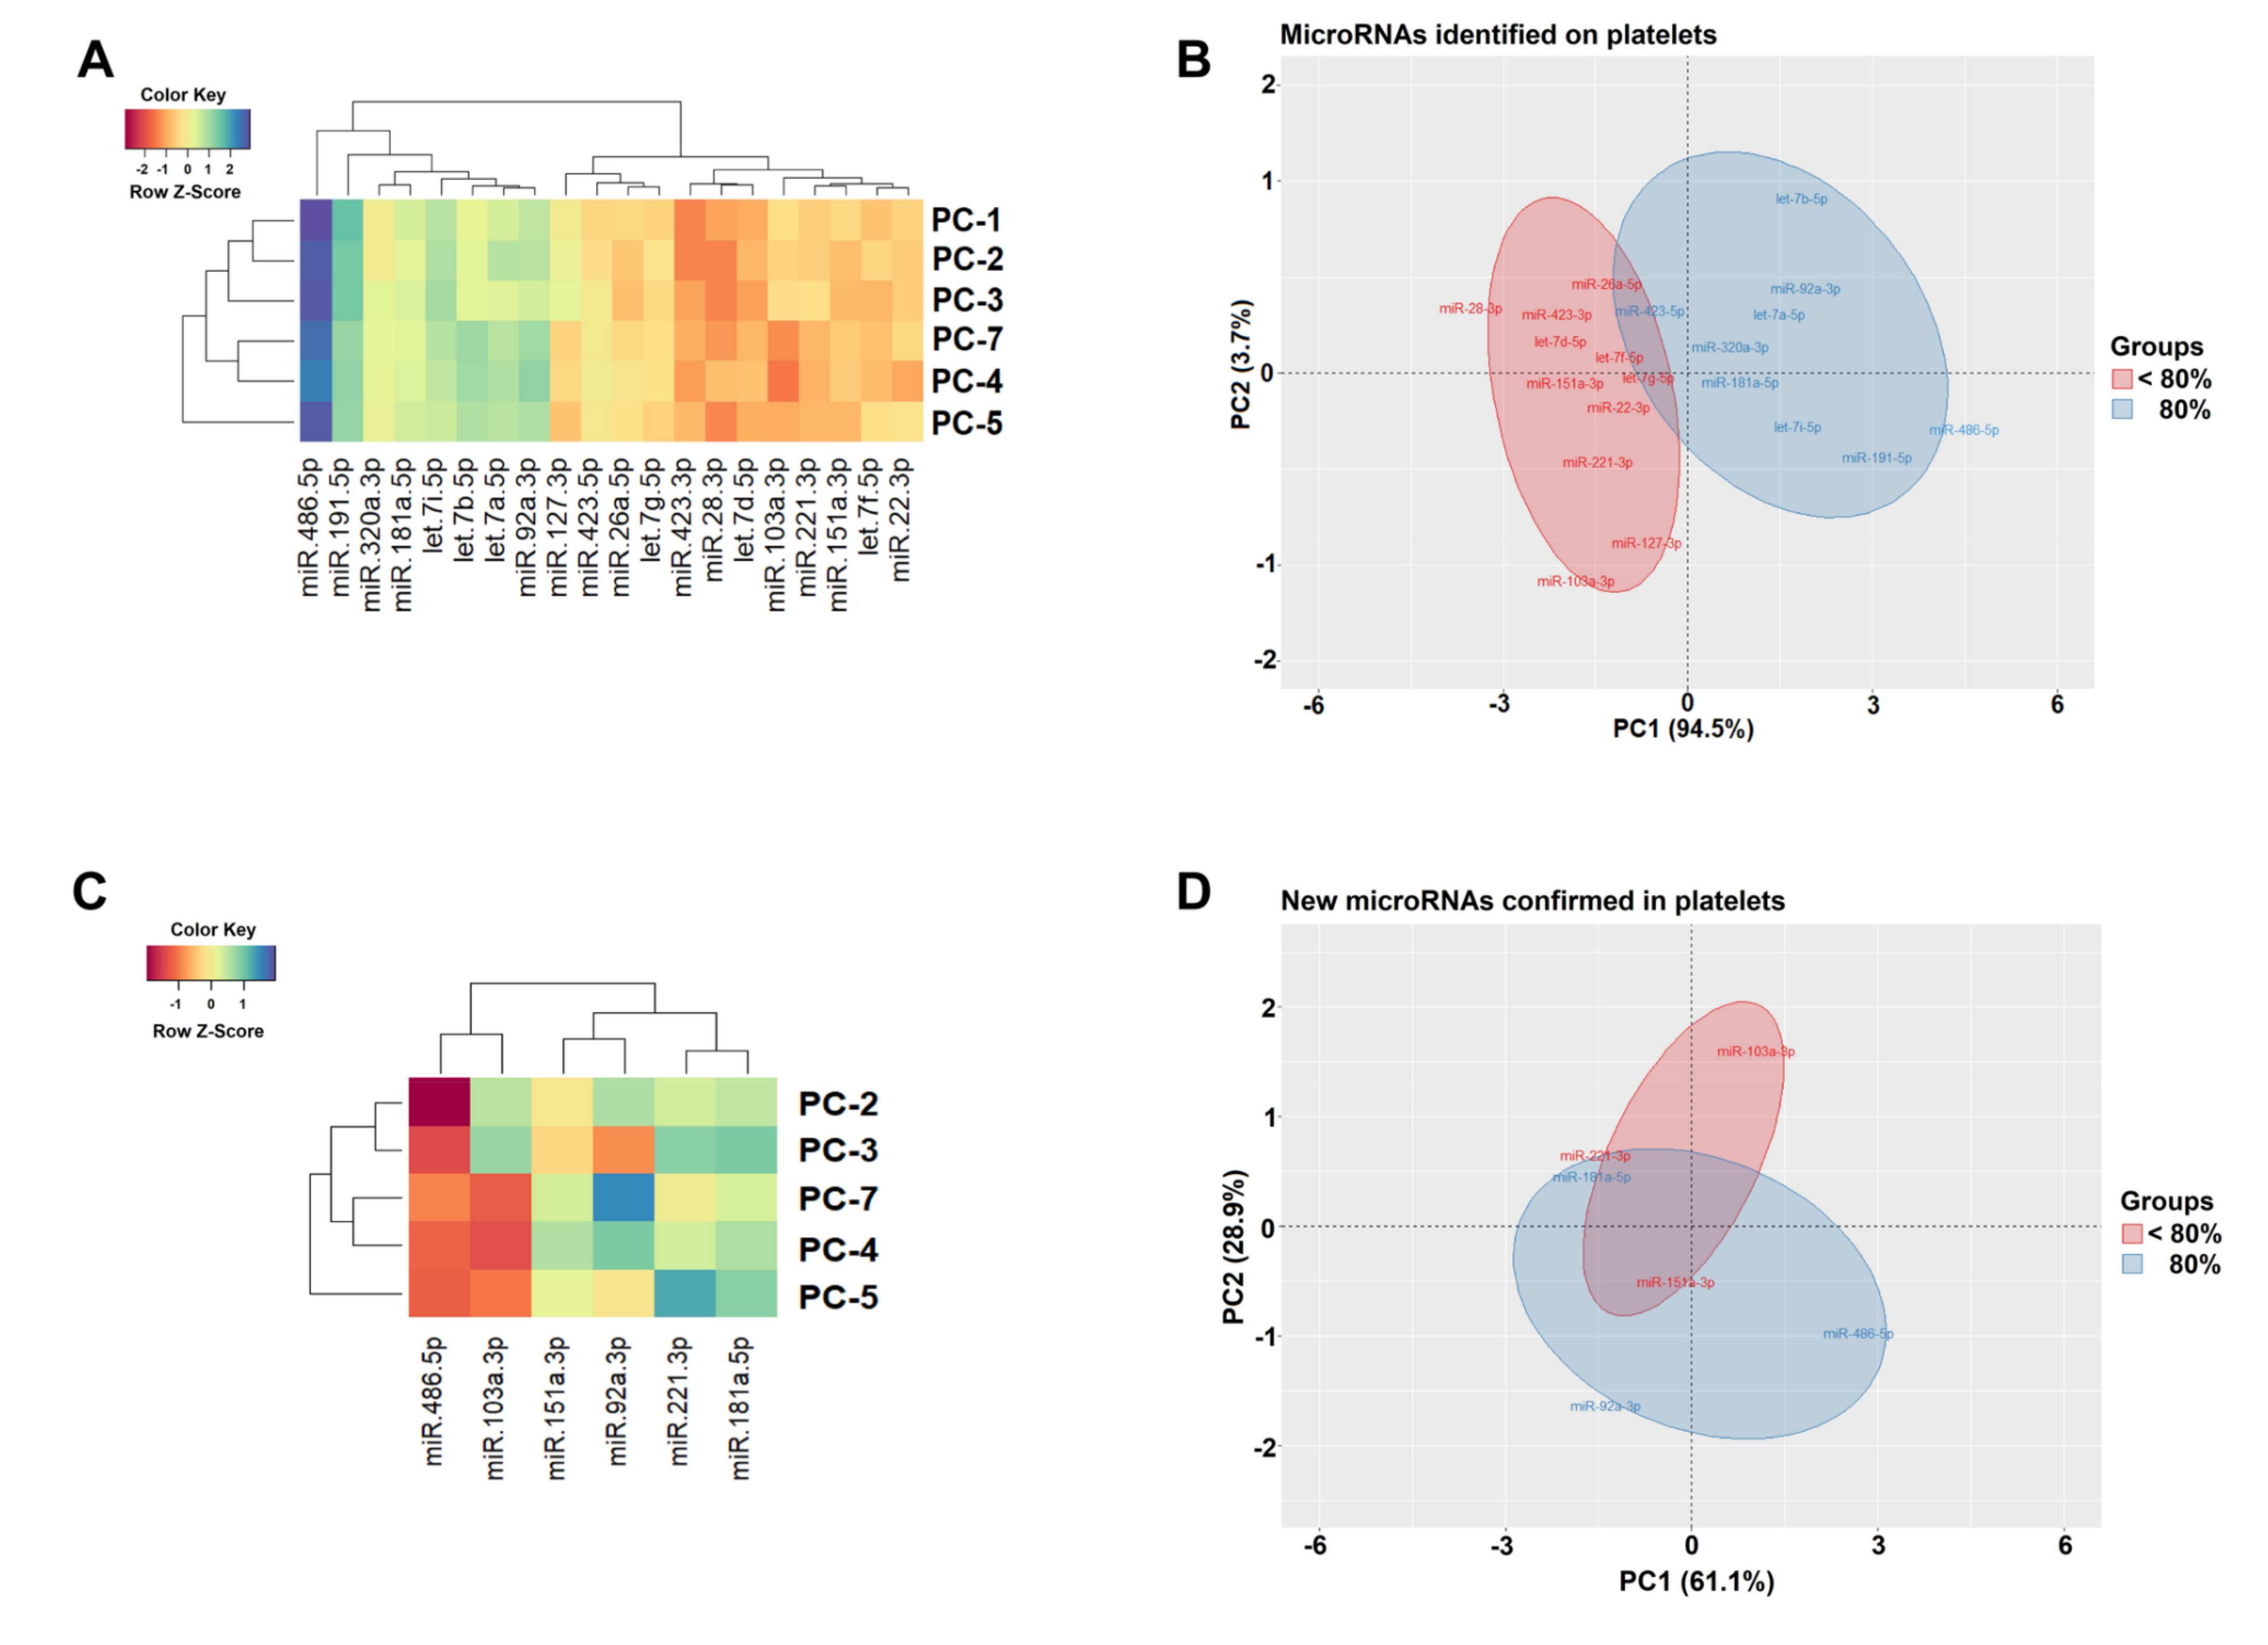
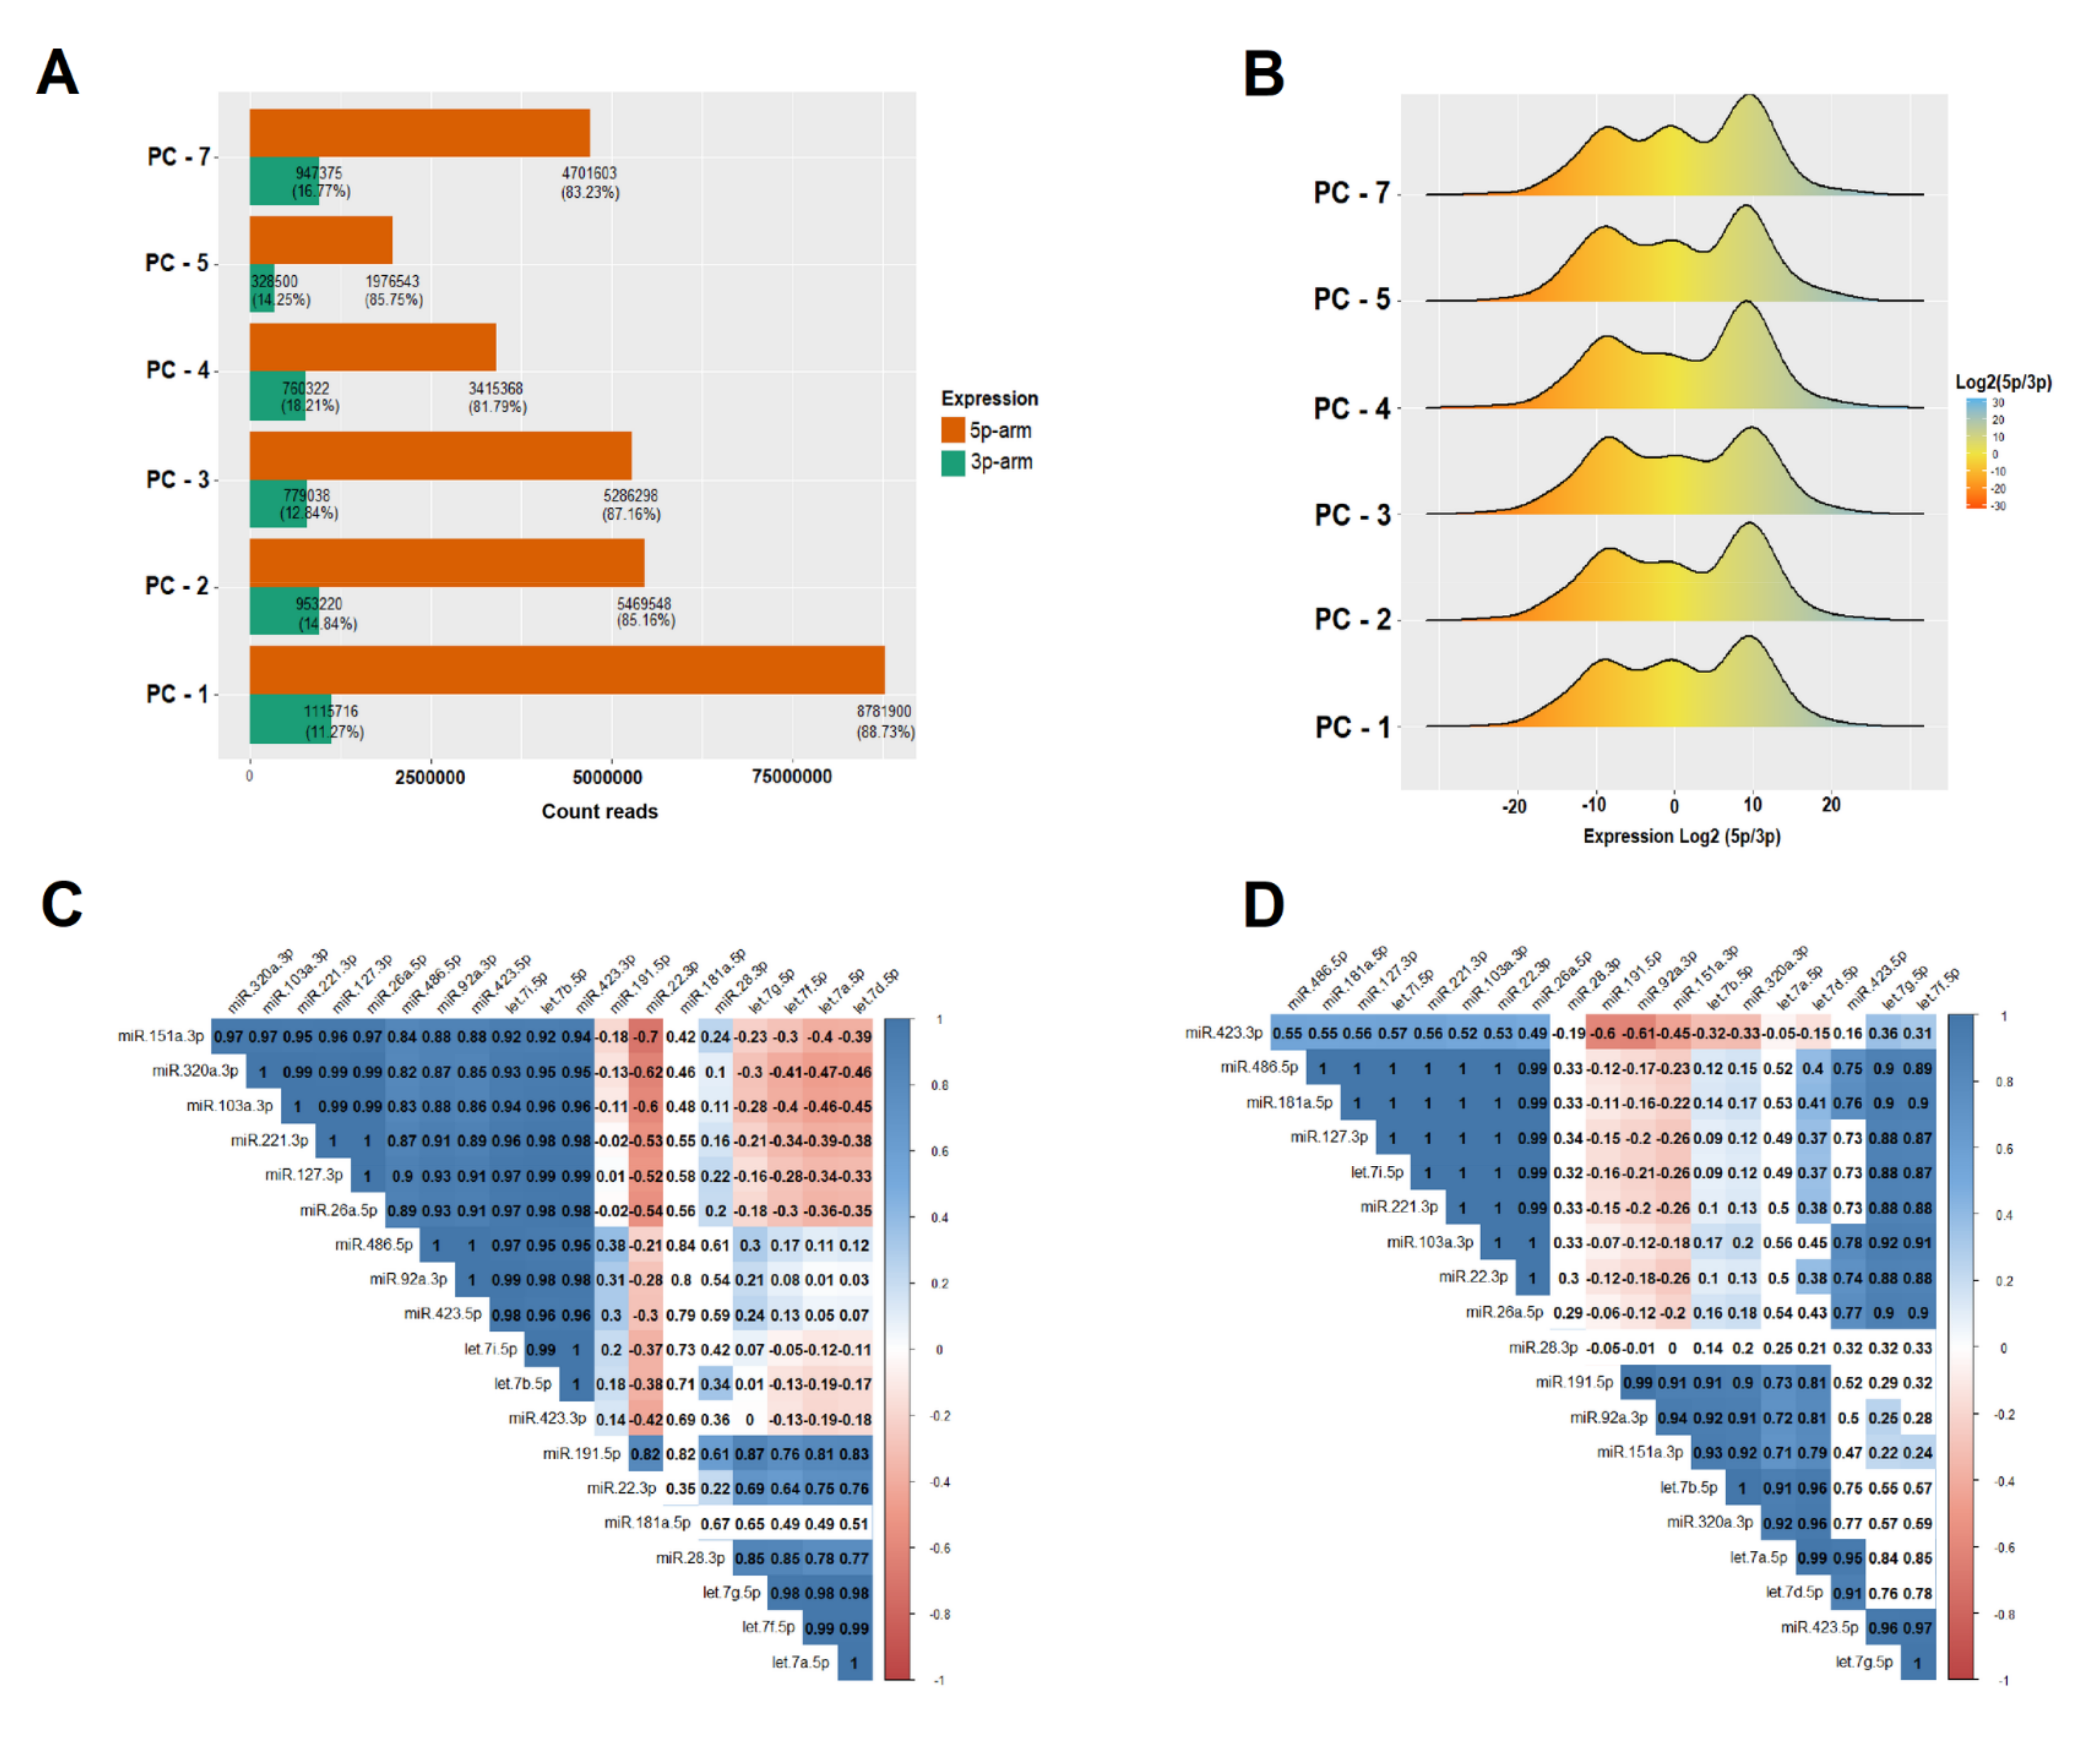
3.2. Measurement of microRNA Expression in PC
- i.
- Any of the following miRNAs (miR-127-3p, miR-423-5p, miR-26a-5p, let-7g-5p, miR-423-3p, miR-28-3p, let-7d-5p, miR-103a-3p, miR-221-3p, miR-151a-3p, let-7f-5p, and miR-22-3p) that have an expression level <80% in relation to one of the following (miR-486-5p, miR-191-5p, miR-320a-3p, miR-181a-5p, let-7i-5p, let-7b-5p, let-7a-5p, or miR-92a-3p), means that there is storage lesion and immediate blockage of the bag that can be tested at any time.
- ii.
- If in a PC bag the expression levels of (miR-127-3p, miR-423-5p, miR-26a-5p, let-7g-5p, miR-423-3p, miR-28-3p, let-7d-5p, miR-103a-3p, miR-221-3p, miR-151a-3p, let-7f-5p, and miR-22-3p) ≥80 in relation to one of the following (miR-486 -5p, miR-191-5p, miR-320a-3p, miR-181a-5p, let-7i-5p, let-7b-5p, let-7a-5p, or miR-92a-3p). It is considered that the PC bag can be used for transfusion, as there are no storage lesions.
3.3. IsomiR Quantification
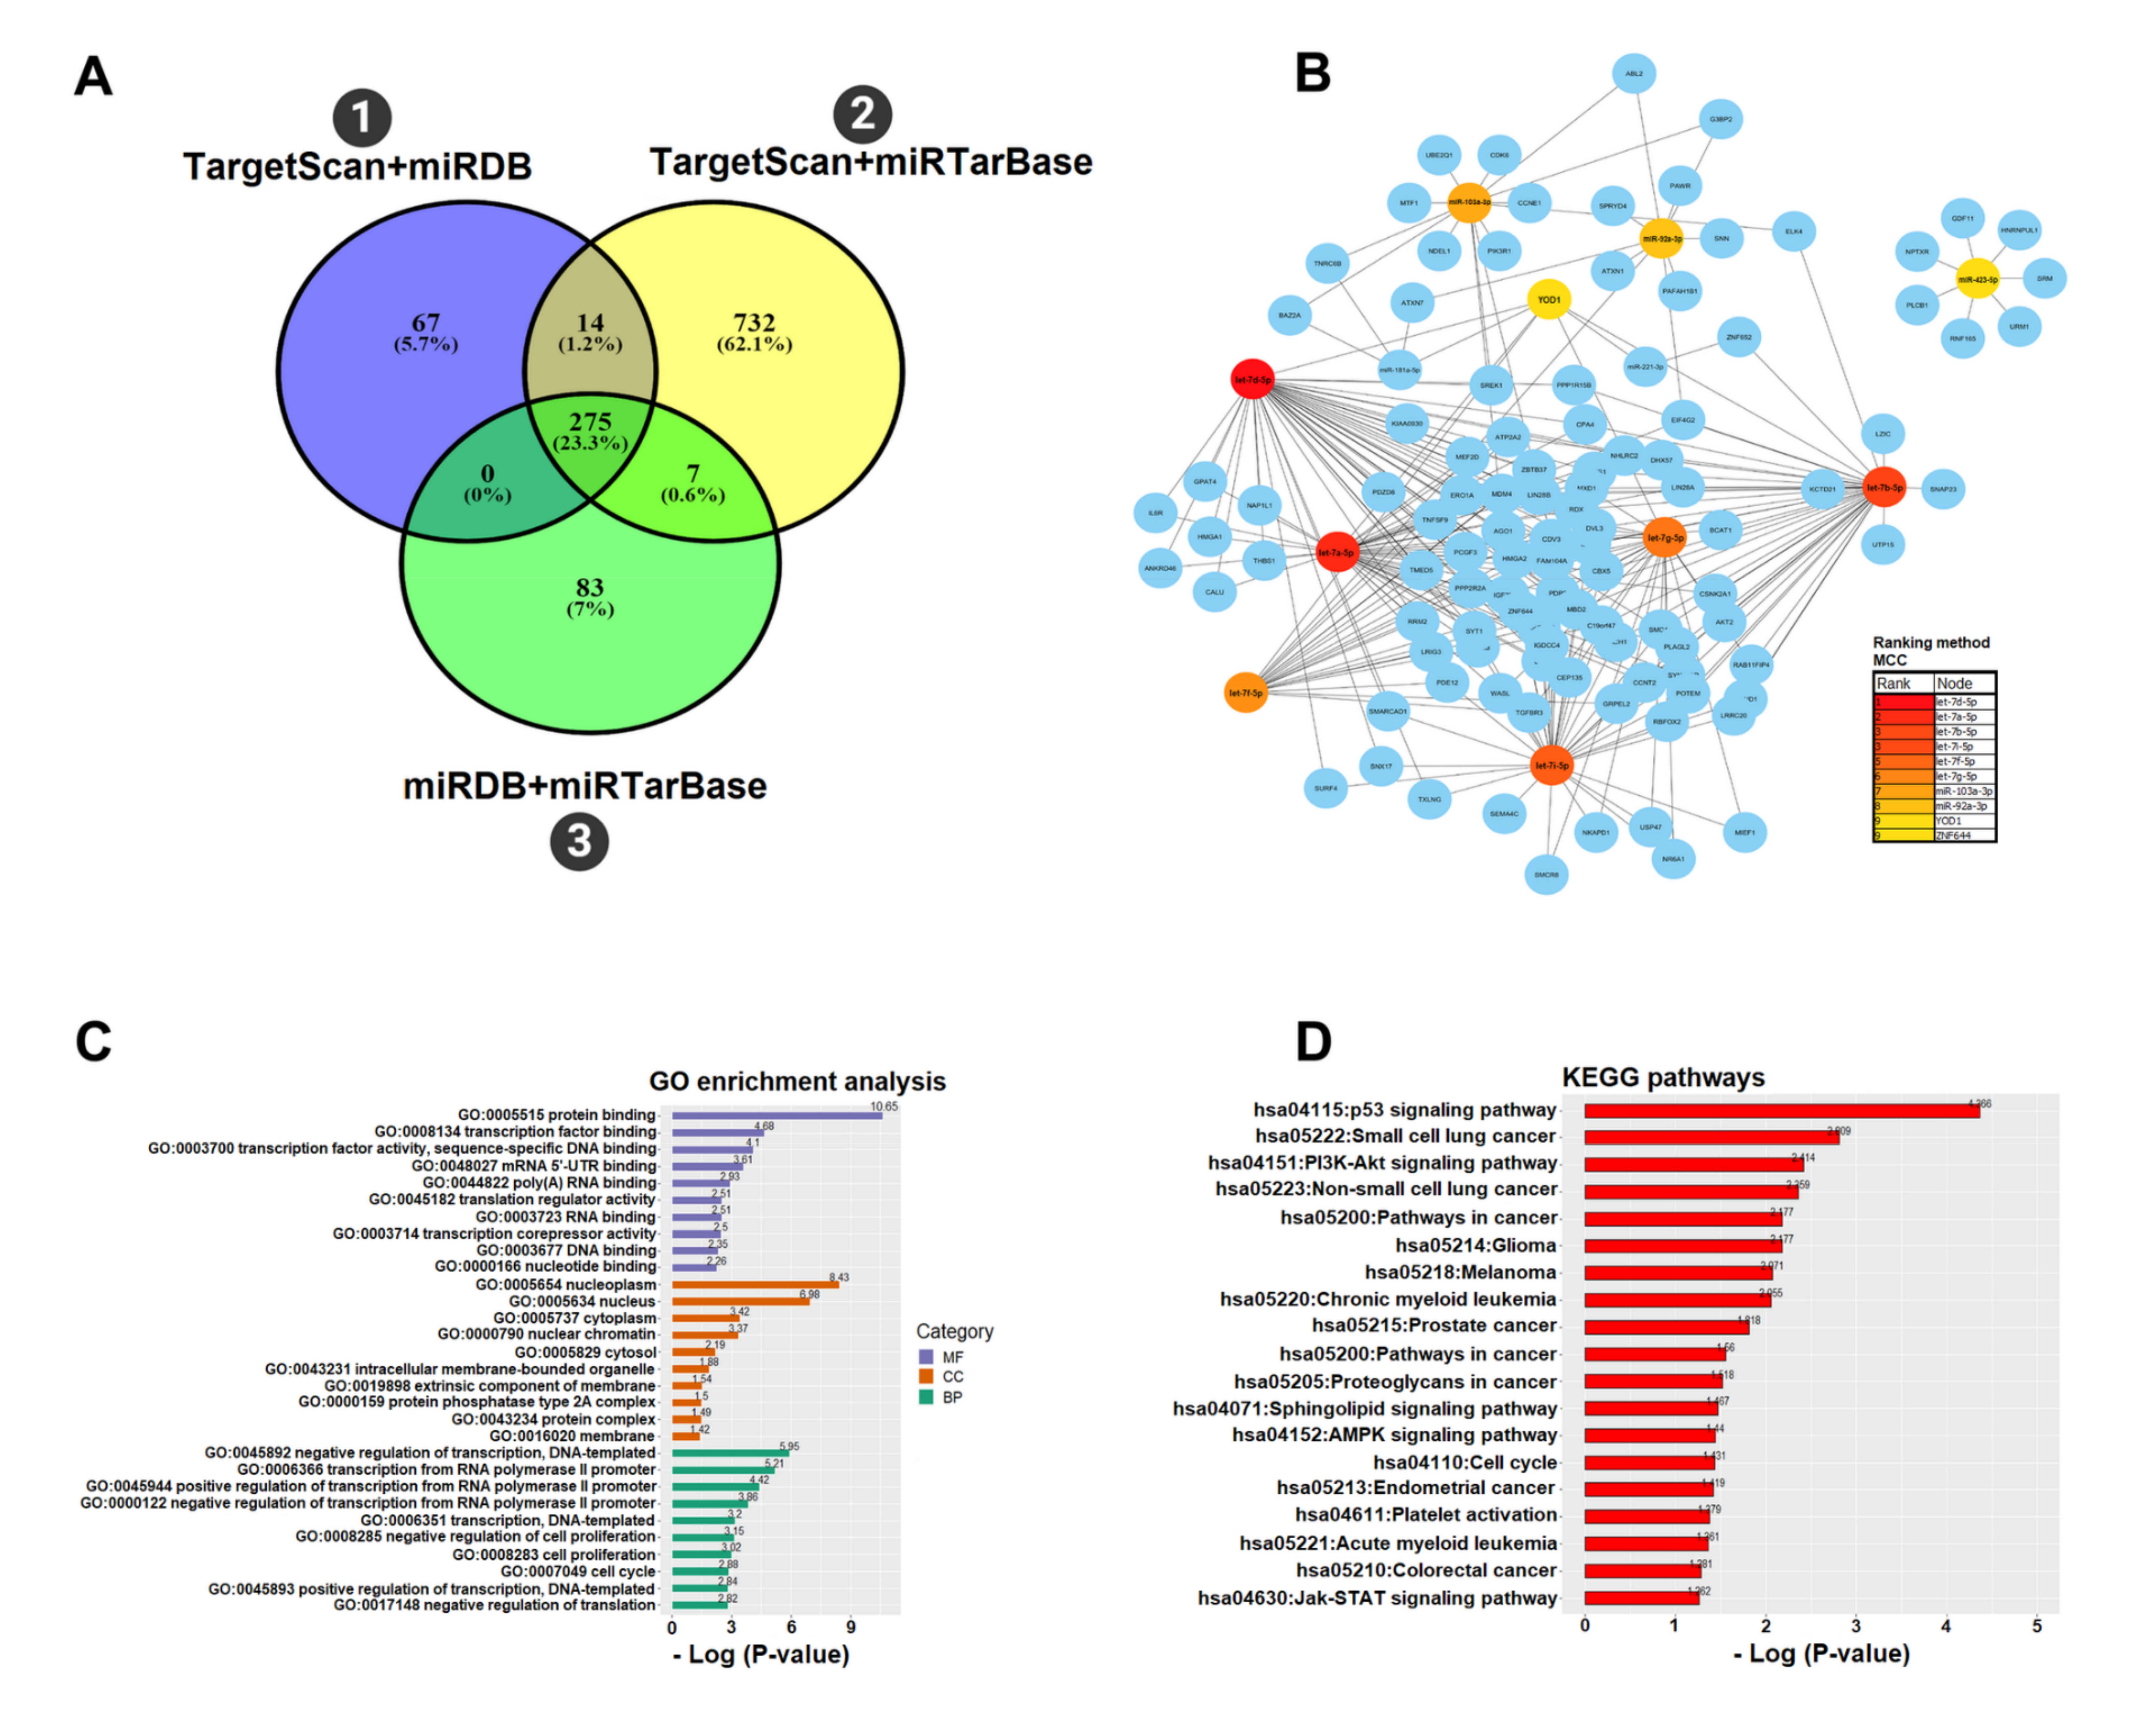
3.4. Functional microRNA-gene Interaction on the PC
4. Discussion
Supplementary Materials
Author Contributions
Funding
Conflicts of Interest
References
- Six, K.R.; Compernolle, V.; Feys, H.B. Platelet Biochemistry and Morphology after Cryopreservation. Int. J. Mol. Sci. 2020, 21, 935. [Google Scholar] [CrossRef] [PubMed] [Green Version]
- Murphy, S.; Gardner, F.H. Platelet storage at 22°C; metabolic, morphologic, and functional studies. J. Clin. Investig. 1971, 50, 370–377. [Google Scholar] [CrossRef] [PubMed] [Green Version]
- Handigund, M.; Bae, T.W.; Lee, J.; Cho, Y.G. Evaluation of in vitro storage characteristics of cold stored platelet concentrates with N acetylcysteine (NAC). Transfus. Apher. Sci. 2016, 54, 127–138. [Google Scholar] [CrossRef] [PubMed]
- Dasgupta, S.K.; Argaiz, E.R.; Mercado, J.E.C.; Maul, H.O.E.; Garza, J.; Enriquez, A.B.; Abdel-Monem, H.; Prakasam, A.; Andreeff, M.; Thiagarajan, P. Platelet senescence and phosphatidylserine exposure. Transfusion 2010, 50, 2167–2175. [Google Scholar] [CrossRef] [Green Version]
- Cho, J.; Kim, H.; Song, J.; Cheong, J.-W.; Shin, J.W.; Yang, W.I.; Kim, H.O. Platelet storage induces accelerated desialylation of platelets and increases hepatic thrombopoietin production. J. Transl. Med. 2018, 16, 199. [Google Scholar] [CrossRef]
- Ministério da Saúde Regulamento técnico de procedimentos hemoterápicos. Available online: http://bvsms.saude.gov.br/bvs/saudelegis/gm/2016/prt0158_04_02_2016.html (accessed on 11 May 2020).
- Yan, Y.; Zhang, J.; Zhang, Q.; Chen, Y.; Zhu, X.; Xia, R. The role of microRNAs in platelet biology during storage. Transfus. Apher. Sci. 2017, 56, 147–150. [Google Scholar] [CrossRef]
- Estcourt, L.J.; Malouf, R.; Hopewell, S.; Trivella, M.; Doree, C.; Stanworth, S.J.; Murphy, M.F. Pathogen-reduced platelets for the prevention of bleeding. Cochrane Database Syst. Rev. 2017, 2017. [Google Scholar] [CrossRef] [Green Version]
- Schubert, P.; Devine, D.V. Towards targeting platelet storage lesion-related signaling pathways. Blood Transfus. 2010, 8, 69–72. [Google Scholar] [CrossRef]
- Mittal, K.; Kaur, R. Platelet storage lesion: An update. Asian J. Transfus. Sci. 2015, 9, 1–3. [Google Scholar] [CrossRef]
- Laffont, B.; Corduan, A.; Ple, H.; Duchez, A.-C.; Cloutier, N.; Boilard, E.; Provost, P. Activated platelets can deliver mRNA regulatory Ago2.microRNA complexes to endothelial cells via microparticles. Blood 2013, 122, 253–261. [Google Scholar] [CrossRef] [Green Version]
- Boilard, E.; Belleannée, C. (Dicer)phering roles of microRNA in platelets. Blood 2016, 127, 1733–1734. [Google Scholar] [CrossRef] [PubMed] [Green Version]
- Diehl, P.; Fricke, A.; Sander, L.; Stamm, J.; Bassler, N.; Htun, N.; Ziemann, M.; Helbing, T.; El-Osta, A.; Jowett, J.B.M.; et al. Microparticles: Major transport vehicles for distinct microRNAs in circulation. Cardiovasc. Res. 2012, 93, 633–644. [Google Scholar] [CrossRef] [PubMed]
- Shrivastava, M. The platelet storage lesion. Transfus. Apher. Sci. 2009, 41, 105–113. [Google Scholar] [CrossRef] [PubMed]
- Van der Meer, P.F. Platelet concentrates, from whole blood or collected by apheresis? Transfus. Apher. Sci. 2013, 48, 129–131. [Google Scholar] [CrossRef] [PubMed]
- Ravi, S.; Chacko, B.; Sawada, H.; Kramer, P.A.; Johnson, M.S.; Benavides, G.A.; O’Donnell, V.; Marques, M.B.; Darley-Usmar, V.M. Metabolic plasticity in resting and thrombin activated platelets. PLoS ONE 2015, 10, e0123597. [Google Scholar] [CrossRef] [PubMed] [Green Version]
- Ravi, S.; Chacko, B.; Kramer, P.A.; Sawada, H.; Johnson, M.S.; Zhi, D.; Marques, M.B.; Darley-Usmar, V.M. Defining the effects of storage on platelet bioenergetics: The role of increased proton leak. Biochim. Biophys. Acta Mol. Basis Dis. 2015, 1852, 2525–2534. [Google Scholar] [CrossRef] [Green Version]
- Dahiya, N.; Sarachana, T.; Kulkarni, S.; Wood Iii, W.H.; Zhang, Y.; Becker, K.G.; Wang, B.-D.; Atreya, C.D. miR-570 interacts with mitochondrial ATPase subunit g (ATP5L) encoding mRNA in stored platelets. Platelets 2016, 7104, 1–8. [Google Scholar] [CrossRef]
- Bartel, D.P. Metazoan MicroRNAs. Cell 2018, 173, 20–51. [Google Scholar] [CrossRef]
- Pontes, T.B.; Moreira-Nunes, C.D.F.A.; Maués, J.H.D.S.; Lamarão, L.M.; De Lemos, J.A.R.; Montenegro, R.C.; Burbano, R.M.R. The miRNA Profile of Platelets Stored in a Blood Bank and Its Relation to Cellular Damage from Storage. PLoS ONE 2015, 10, e0129399. [Google Scholar] [CrossRef]
- Maués, J.H.D.S.; Moreira-Nunes, C.D.F.A.; Pontes, T.B.; Vieira, P.C.M.; Montenegro, R.C.; Lamarão, L.M.; Lima, E.M.; Burbano, R.M.R. Differential Expression Profile of MicroRNAs During Prolonged Storage of Platelet Concentrates as a Quality Measurement Tool in Blood Banks. OMICS A J. Integr. Biol. 2018, 22, 653–664. [Google Scholar] [CrossRef]
- Diallo, I.; Benmoussa, A.; Laugier, J.; Osman, A.; Hitzler, W.E.; Provost, P. Platelet Pathogen Reduction Technologies Alter the MicroRNA Profile of Platelet-Derived Microparticles. Front. Cardiovasc. Med. 2020, 7, 1–9. [Google Scholar] [CrossRef] [PubMed]
- Mukai, N.; Nakayama, Y.; Ishi, S.; Murakami, T.; Ogawa, S.; Kageyama, K.; Murakami, S.; Sasada, Y.; Yoshioka, J.; Nakajima, Y. Cold storage conditions modify microRNA expressions for platelet transfusion. PLoS ONE 2019, 14, e0218797. [Google Scholar] [CrossRef] [PubMed] [Green Version]
- Nagalla, S.; Shaw, C.; Kong, X.; Kondkar, A.A.; Edelstein, L.C.; Ma, L.; Chen, J.; McKnight, G.S.; López, J.A.; Yang, L.; et al. Platelet microRNA-mRNA coexpression profiles correlate with platelet reactivity. Blood 2011, 117, 5189–5197. [Google Scholar] [CrossRef] [PubMed]
- Teruel-Montoya, R.; Kong, X.; Abraham, S.; Ma, L.; Kunapuli, S.P.; Holinstat, M.; Shaw, C.A.; McKenzie, S.E.; Edelstein, L.C.; Bray, P.F. MicroRNA Expression Differences in Human Hematopoietic Cell Lineages Enable Regulated Transgene Expression. PLoS ONE 2014, 9, e102259. [Google Scholar] [CrossRef] [PubMed]
- Mukai, N.; Nakayama, Y.; Ishi, S.; Ogawa, S.; Maeda, S.; Anada, N.; Murakami, S.; Mizobe, T.; Sawa, T.; Nakajima, Y. Changes in MicroRNA Expression Level of Circulating Platelets Contribute to Platelet Defect After Cardiopulmonary Bypass. Crit. Care Med. 2018, 46, e761–e767. [Google Scholar] [CrossRef]
- Aparicio-Puerta, E.; Lebrón, R.; Rueda, A.; Gómez-Martín, C.; Giannoukakos, S.; Jaspez, D.; Medina, J.M.; Zubkovic, A.; Jurak, I.; Fromm, B.; et al. sRNAbench and sRNAtoolbox 2019: Intuitive fast small RNA profiling and differential expression. Nucleic Acids Res. 2019, 47, W530–W535. [Google Scholar] [CrossRef] [Green Version]
- Rueda, A.; Barturen, G.; Lebrón, R.; Gómez-Martín, C.; Alganza, Á.; Oliver, J.L.; Hackenberg, M. sRNAtoolbox: An integrated collection of small RNA research tools. Nucleic Acids Res. 2015, 43, W467–W473. [Google Scholar] [CrossRef] [Green Version]
- Kozomara, A.; Birgaoanu, M.; Griffiths-Jones, S. miRBase: From microRNA sequences to function. Nucleic Acids Res. 2019, 47, D155–D162. [Google Scholar] [CrossRef]
- Maués, J.H.D.S.; Aquino Moreira-Nunes, C.D.F.; Rodriguez Burbano, R.M. MicroRNAs as a Potential Quality Measurement Tool of Platelet Concentrate Stored in Blood Banks—A Review. Cells 2019, 8, 1256. [Google Scholar] [CrossRef] [Green Version]
- Morin, R.D.; O’Connor, M.D.; Griffith, M.; Kuchenbauer, F.; Delaney, A.; Prabhu, A.-L.; Zhao, Y.; McDonald, H.; Zeng, T.; Hirst, M.; et al. Application of massively parallel sequencing to microRNA profiling and discovery in human embryonic stem cells. Genome Res. 2008, 18, 610–621. [Google Scholar] [CrossRef] [Green Version]
- Langmead, B.; Trapnell, C.; Pop, M.; Salzberg, S.L. Ultrafast and memory-efficient alignment of short DNA sequences to the human genome. Genome Biol. 2009, 10, R25. [Google Scholar] [CrossRef] [PubMed] [Green Version]
- Agarwal, V.; Bell, G.W.; Nam, J.-W.; Bartel, D.P. Predicting effective microRNA target sites in mammalian mRNAs. Elife 2015, 4, 1–38. [Google Scholar] [CrossRef] [PubMed]
- Huang, H.-Y.; Lin, Y.-C.-D.; Li, J.; Huang, K.-Y.; Shrestha, S.; Hong, H.-C.; Tang, Y.; Chen, Y.-G.; Jin, C.-N.; Yu, Y.; et al. miRTarBase 2020: Updates to the experimentally validated microRNA–target interaction database. Nucleic Acids Res. 2019, 48, D148–D154. [Google Scholar] [CrossRef] [Green Version]
- Chen, Y.; Wang, X. miRDB: An online database for prediction of functional microRNA targets. Nucleic Acids Res. 2020, 48, D127–D131. [Google Scholar] [CrossRef] [PubMed] [Green Version]
- Ding, J.; Li, X.; Hu, H. TarPmiR: A new approach for microRNA target site prediction. Bioinformatics 2016, 32, 2768–2775. [Google Scholar] [CrossRef] [Green Version]
- Sticht, C.; De La Torre, C.; Parveen, A.; Gretz, N. miRWalk: An online resource for prediction of microRNA binding sites. PLoS ONE 2018, 13, e0206239. [Google Scholar] [CrossRef]
- Chin, C.H.; Chen, S.H.; Wu, H.H.; Ho, C.W.; Ko, M.T.; Lin, C.Y. cytoHubba: Identifying hub objects and sub-networks from complex interactome. BMC Syst. Biol. 2014, 8, S11. [Google Scholar] [CrossRef] [Green Version]
- Huang, D.W.; Sherman, B.T.; Lempicki, R.A. Systematic and integrative analysis of large gene lists using DAVID bioinformatics resources. Nat. Protoc. 2009, 4, 44–57. [Google Scholar] [CrossRef]
- Ashburner, M.; Ball, C.A.; Blake, J.A.; Botstein, D.; Butler, H.; Cherry, J.M.; Davis, A.P.; Dolinski, K.; Dwight, S.S.; Eppig, J.T.; et al. Gene Ontology: Tool for the unification of biology. Nat. Genet. 2000, 25, 25–29. [Google Scholar] [CrossRef] [Green Version]
- Kanehisa, M.; Sato, Y.; Furumichi, M.; Morishima, K.; Tanabe, M. New approach for understanding genome variations in KEGG. Nucleic Acids Res. 2019, 47, D590–D595. [Google Scholar] [CrossRef] [Green Version]
- Lê, S.; Josse, J.; Husson, F. FactoMineR: An R package for multivariate analysis. J. Stat. Softw. 2008, 25, 1–18. [Google Scholar] [CrossRef] [Green Version]
- Ovadya, Y.; Landsberger, T.; Leins, H.; Vadai, E.; Gal, H.; Biran, A.; Yosef, R.; Sagiv, A.; Agrawal, A.; Shapira, A.; et al. Impaired immune surveillance accelerates accumulation of senescent cells and aging. Nat. Commun. 2018, 9, 5435. [Google Scholar] [CrossRef] [PubMed] [Green Version]
- Sut, C.; Tariket, S.; Aubron, C.; Aloui, C.; Hamzeh-Cognasse, H.; Berthelot, P.; Laradi, S.; Greinacher, A.; Garraud, O.; Cognasse, F. The Non-Hemostatic Aspects of Transfused Platelets. Front. Med. 2018, 5, 42. [Google Scholar] [CrossRef] [PubMed]
- Delobel, J.; Rubin, O.; Prudent, M.; Crettaz, D.; Tissot, J.-D.; Lion, N. Biomarker analysis of stored blood products: Emphasis on pre-analytical issues. Int. J. Mol. Sci. 2010, 11, 4601–4617. [Google Scholar] [CrossRef] [PubMed]
- Cookson, P.; Sutherland, J.; Turner, C.; Bashir, S.; Wiltshire, M.; Hancock, V.; Smith, K.; Cardigan, R. Platelet apoptosis and activation in platelet concentrates stored for up to 12 days in plasma or additive solution. Transfus. Med. 2010, 20, 392–402. [Google Scholar] [CrossRef]
- Árnason, N.Á.; Sigurjónsson, Ó.E. New strategies to understand platelet storage lesion. ISBT Sci. Ser. 2017, 12, 496–500. [Google Scholar] [CrossRef]
- Edelstein, L.C.; Bray, P.F. MicroRNAs in platelet production and activation. Blood 2011, 117, 5289–5296. [Google Scholar] [CrossRef]
- Yang, A.; Troup, M.; Ho, J.W.K. Scalability and Validation of Big Data Bioinformatics Software. Comput. Struct. Biotechnol. J. 2017, 15, 379–386. [Google Scholar] [CrossRef]
- Plé, H.; Landry, P.; Benham, A.; Coarfa, C.; Gunaratne, P.H.; Provost, P. The Repertoire and Features of Human Platelet microRNAs. PLoS ONE 2012, 7, e50746. [Google Scholar] [CrossRef]
- Kannan, M.; Mohan, K.V.K.; Kulkarni, S.; Atreya, C. Membrane array-based differential profiling of platelets during storage for 52 miRNAs associated with apoptosis. Transfusion 2009, 49, 1443–1450. [Google Scholar] [CrossRef]
- Rowley, J.W.; Chappaz, S.; Corduan, A.; Chong, M.M.W.W.; Campbell, R.; Khoury, A.; Manne, B.K.; Wurtzel, J.G.T.T.; Michael, J.V.; Goldfinger, L.E.; et al. Dicer1-mediated miRNA processing shapes the mRNA profile and function of murine platelets. Blood 2016, 127, 1743–1752. [Google Scholar] [CrossRef] [PubMed] [Green Version]
- Atreya, C.D. Ingenuity Pathway Analysis of miRnas and mRNAs in Stored Platelets Identifies the Potential of miRNAs in Regulating Platelet Functions Relevant to Storage Lesions. Hematol. Blood Transfus. Disord. 2016, 3, 1–5. [Google Scholar] [CrossRef] [Green Version]
- Coenen-Stass, A.M.L.; Pauwels, M.J.; Hanson, B.; Martin Perez, C.; Conceição, M.; Wood, M.J.A.; Mäger, I.; Roberts, T.C. Extracellular microRNAs exhibit sequence-dependent stability and cellular release kinetics. RNA Biol. 2019, 16, 696–706. [Google Scholar] [CrossRef] [PubMed] [Green Version]
- Blondal, T.; Jensby Nielsen, S.; Baker, A.; Andreasen, D.; Mouritzen, P.; Wrang Teilum, M.; Dahlsveen, I.K. Assessing sample and miRNA profile quality in serum and plasma or other biofluids. Methods 2013, 59, S1–S6. [Google Scholar] [CrossRef]
- Wang, W.; Yan, Y. Suboptimal health: A new health dimension for translational medicine. Clin. Transl. Med. 2012, 1, 28. [Google Scholar] [CrossRef] [Green Version]
- Glade, M.J. Oxidative Telomere Attrition, Nutritional Antioxidants And Biological Aging. Int. J. Nutr. 2015, 1, 1–37. [Google Scholar] [CrossRef]
- Alzain, M.A.; Asweto, C.O.; Zhang, J.; Fang, H.; Zhao, Z.; Guo, X.; Song, M.; Zhou, Y.; Chang, N.; Wang, Y.; et al. Telomere Length and Accelerated Biological Aging in the China Suboptimal Health Cohort: A Case–Control Study. OMICS A J. Integr. Biol. 2017, 21, 333–339. [Google Scholar] [CrossRef]
- Jansen, F.; Yang, X.; Proebsting, S.; Hoelscher, M.; Przybilla, D.; Baumann, K.; Schmitz, T.; Dolf, A.; Endl, E.; Franklin, B.S.; et al. MicroRNA Expression in Circulating Microvesicles Predicts Cardiovascular Events in Patients With Coronary Artery Disease. J. Am. Heart Assoc. 2014, 3, e001249. [Google Scholar] [CrossRef] [Green Version]
- Gibbings, D.J.; Ciaudo, C.; Erhardt, M.; Voinnet, O. Multivesicular bodies associate with components of miRNA effector complexes and modulate miRNA activity. Nat. Cell Biol. 2009, 11, 1143–1149. [Google Scholar] [CrossRef]
- Griffiths-Jones, S.; Hui, J.H.L.; Marco, A.; Ronshaugen, M. MicroRNA evolution by arm switching. EMBO Rep. 2011, 12, 172–177. [Google Scholar] [CrossRef] [Green Version]
- Hu, W.; Wang, T.; Yue, E.; Zheng, S.; Xu, J.H. Flexible microRNA arm selection in rice. Biochem. Biophys. Res. Commun. 2014, 447, 526–530. [Google Scholar] [CrossRef] [PubMed]
- Ro, S.; Park, C.; Young, D.; Sanders, K.M.; Yan, W. Tissue-dependent paired expression of miRNAs. Nucleic Acids Res. 2007, 35, 5944–5953. [Google Scholar] [CrossRef] [PubMed]
- Dahiya, N.; Sarachana, T.; Vu, L.; Becker, K.G.; Wood, W.H.; Zhang, Y.; Atreya, C.D. Platelet MicroRNAs: An Overview. Transfus. Med. Rev. 2015, 29, 215–219. [Google Scholar] [CrossRef] [Green Version]
- Lindsay, C.; Edelstein, L. MicroRNAs in Platelet Physiology and Function. Semin. Thromb. Hemost. 2016, 42, 215–222. [Google Scholar] [CrossRef] [PubMed]
- Landry, P.; Plante, I.; Ouellet, D.L.; Perron, M.P.; Rousseau, G.; Provost, P. Existence of a microRNA pathway in anucleate platelets. Nat. Struct. Mol. Biol. 2009, 16, 961–966. [Google Scholar] [CrossRef] [Green Version]
- Willeit, P.; Zampetaki, A.; Dudek, K.; Kaudewitz, D.; King, A.; Kirkby, N.S.; Crosby-Nwaobi, R.; Prokopi, M.; Drozdov, I.; Langley, S.R.; et al. Circulating microRNAs as novel biomarkers for platelet activation. Circ. Res. 2013, 112, 595–600. [Google Scholar] [CrossRef] [Green Version]
- Zhang, Z.; Ran, Y.; Shaw, T.S.; Peng, Y. MicroRNAs 10a and 10b Regulate the Expression of Human Platelet Glycoprotein Ibα for Normal Megakaryopoiesis. Int. J. Mol. Sci. 2016, 17, 1873. [Google Scholar] [CrossRef] [Green Version]
- Yu, S.; Huang, H.; Deng, G.; Xie, Z.; Ye, Y.; Guo, R.; Cai, X.; Hong, J.; Qian, D.; Zhou, X.; et al. miR-326 Targets Antiapoptotic Bcl-xL and Mediates Apoptosis in Human Platelets. PLoS ONE 2015, 10, e0122784. [Google Scholar] [CrossRef]
- Edelstein, L.C.; McKenzie, S.E.; Shaw, C.; Holinstat, M.A.; Kunapuli, S.P.; Bray, P.F. MicroRNAs in platelet production and activation. J. Thromb. Haemost. 2013, 11, 340–350. [Google Scholar] [CrossRef]
- Yuan, Z.; Wu, Q.; Chen, X.; Wei, Y. Altered microRNA expression profiles are involved in Storage Lesions of Apheresis Platelet. BioRxiv 2018. [Google Scholar] [CrossRef]


| Preprocessing Summary (PC-Day) SRA: | PC-1 | PC-2 | PC-3 | PC-4 | PC-5 | PC-7 |
|---|---|---|---|---|---|---|
| SRX716593 | SRX716594 | SRX716595 | SRX716596 | SRX716597 | SRX716598 | |
| Raw input reads | 16,212,635 | 13,594,963 | 17,214,842 | 25,325,847 | 16,161,626 | 28,515,834 |
| Trimmed reads | 16,112,769 (99.38%) | 13,499,180 (99.29%) | 17,101,122 (99.33%) | 25,093,371 (99.08%) | 16,034,860 (99.21%) | 28,280,300 (99.17%) |
| Reads in analysis | 15,456,133 (95.33%) | 12,732,995 (93.65%) | 16,564,900 (96.22%) | 24,291,441 (95.91%) | 15,173,571 (93.88%) | 26,665,506 (93.51%) |
| Genome/Library mapping | ||||||
| Unique genome mapped reads | 83,673 (83.21%) | 94,716 (83.32%) | 129,731 (85.26%) | 219,742 (81.06%) | 176,766 (85.44%) | 256,859 (82.18%) |
| Genome mapped reads | 14,685,047 (95.01%) | 11,757,300 (92.34%) | 14,969,574 (90.37%) | 22,681,622 (93.37%) | 13,734,766 (90.52%) | 24,321,990 (91.21%) |
| MiR profiling results | ||||||
| • Reads mapped to miRbase hairpins | 5498 (0.09%) | 5509 (0.13%) | 6896 (0.16%) | 6232 (0.21%) | 4500 (0.26%) | 13,042 (0.30%) |
| Detected hairpin miR | 610 (31.82%) | 567 (29.58%) | 562 (29.32%) | 574 (29.94%) | 486 (25.35%) | 644 (33.59%) |
| • Reads mapped to mature miR | 6,042,081 (96.83%) | 3,997,760 (95.42%) | 3,812,542 (89.64%) | 2,643,351 (88.88%) | 1,420,368 (83.35%) | 3,586,353 (81.90%) |
| Detected mature miRNA | 916 (34.49%) | 842 (31.70%) | 834 (31.40%) | 825 (31.06%) | 711 (26.77%) | 939 (35.35%) |
| (1) Pre-microRNA | (2) Mature microRNA | ||||||||||||
|---|---|---|---|---|---|---|---|---|---|---|---|---|---|
| Gene Family | Coordinate String | Pre-microRNA | Unique Reads | Read Count (RC) | RPM (Lib) | RPM (Total) | Mature microRNA | Sequence: miR -5p/-3p Arms | Unique Reads | Read Count (RC) | RPM (Lib) | RPM (Total) | |
| PC-1 (SRX716593) | mir-486 | 8:hsa;mir-486-2,41660444,41660465,+ | mir-486-2 | 1292 | 3,255,194 | 538,264 | 221,667 | miR-486-5p | 5p-UCCUGUACUGAGCCGCCCCGAG | 1189 | 3,253,869 | 538,534 | 221,577 |
| mir-191 | 3:hsa;mir-191,49020633,49020655,- | mir-191 | 335 | 639,518 | 105,748 | 43,549 | miR-191-5p | 5p-CAACGGAAUCCCAAAAGCAGCUG | 318 | 639,420 | 105,828 | 43,542 | |
| let-7 | 12:hsa;let-7i,62603691,62603712,+ | let-7i | 205 | 243,758 | 40,307 | 16,599 | let-7i-5p | 5p-UGAGGUAGUAGUUUGUGCUGUU | 194 | 243,687 | 40,332 | 16,594 | |
| mir-25 | 13:hsa;mir-92a-1,91351361,91351382,+ | mir-92a-1 | 510 | 220,091 | 36,393 | 14,987 | miR-92a-3p | 3p-UAUUGCACUUGUCCCGGCCUGU | 497 | 220,034 | 36,417 | 14,984 | |
| mir-181 | 1:hsa;mir-181a-1,198859067,198859089,- | mir-181a-1 | 264 | 161,979 | 26,784 | 11,030 | miR-181a-5p | 5p-AACAUUCAACGCUGUCGGUGAGU | 254 | 161,722 | 26,766 | 11,013 | |
| let-7 | 9:hsa;let-7a-1,94175962,94175983,+ | let-7a-1 | 175 | 159,936 | 26,446 | 10,891 | let-7a-5p | 5p-UGAGGUAGUAGGUUGUAUAGUU | 173 | 159,928 | 26,469 | 10,891 | |
| let-7 | 22:hsa;let-7b,46113691,46113712,+ | let-7b | 304 | 121,975 | 20,169 | 8306 | let-7b-5p | 5p-UGAGGUAGUAGGUUGUGUGGUU | 286 | 121,845 | 20,166 | 8297 | |
| mir-320 | 8:hsa;mir-320a,22245007,22245028,- | mir-320a | 578 | 86,702 | 14,337 | 5904 | miR-320a-3p | 3p-AAAAGCUGGGUUGAGAGGGCGA | 561 | 86,637 | 14,339 | 5900 | |
| mir-127 | 14:hsa;mir-127,100883035,100883056,+ | mir-127 | 320 | 84,993 | 14,054 | 5788 | miR-127-3p | 3p-UCGGAUCCGUCUGAGCUUGGCU | 283 | 84,810 | 14,037 | 5775 | |
| mir-103 | 20:hsa;mir-103a-2,3917541,3917563,+ | mir-103a-2 | 188 | 58,511 | 9675 | 3984 | miR-103a-3p | 3p-AGCAGCAUUGUACAGGGCUAUGA | 181 | 58,469 | 9677 | 3982 | |
| mir-26 | 12:hsa;mir-26a-2,57824622,57824643,- | mir-26a-2 | 132 | 52,776 | 8727 | 3594 | miR-26a-5p | 5p-UUCAAGUAAUCCAGGAUAGGCU | 131 | 52,774 | 8734 | 3594 | |
| mir-28 | 8:hsa;mir-151a,140732610,140732630,- | mir-151a | 274 | 63,281 | 10,464 | 4309 | miR-151a-3p | 3p-CUAGACUGAAGCUCCUUGAGG | 221 | 51,561 | 8534 | 3511 | |
| mir-423 | 17:hsa;mir-423,30117095,30117117,+ | mir-423 | 433 | 66,631 | 11,018 | 4537 | miR-423-5p | 5p-UGAGGGGCAGAGAGCGAGACUUU | 213 | 51,007 | 8442 | 3473 | |
| let-7 | 3:hsa;let-7g,52268282,52268303,- | let-7g | 114 | 48,462 | 8013 | 3300 | let-7g-5p | 5p-UGAGGUAGUAGUUUGUACAGUU | 110 | 48,451 | 8019 | 3299 | |
| mir-22 | 17:hsa;mir-22,1713955,1713976,- | mir-22 | 88 | 48,146 | 7961 | 3279 | miR-22-3p | 3p-AAGCUGCCAGUUGAAGAACUGU | 81 | 48,015 | 7947 | 3270 | |
| mir-10 | X:hsa;mir-221,45746221,45746243,- | mir-221 | 190 | 45,199 | 7474 | 3078 | miR-221-3p | 3p-AGCUACAUUGUCUGCUGGGUUUC | 168 | 44,952 | 7440 | 3061 | |
| mir-221 | X:hsa;let-7f-2,53557199,53557220,- | let-7f-2 | 95 | 38,034 | 6289 | 2590 | let-7f-5p | 5p-UGAGGUAGUAGAUUGUAUAGUU | 94 | 38,032 | 6295 | 2590 | |
| let-7 | 9:hsa;let-7d,94178841,94178862,+ | let-7d | 125 | 29,204 | 4829 | 1989 | let-7d-5p | 5p-AGAGGUAGUAGGUUGCAUAGUU | 88 | 25,688 | 4252 | 1749 | |
| let-7 | 3:hsa;mir-28,188688834,188688855,+ | mir-28 | 154 | 23,667 | 3913 | 1612 | miR-28-3p | 3p-AAGGAGCUCACAGUCUAUUGAG | 134 | 23,057 | 3816 | 1570 | |
| mir-423 | 17:hsa;mir-423,30117131,30117153,+ | mir-423 | 433 | 66,631 | 11,018 | 4537 | miR-423-3p | 3p-AGCUCGGUCUGAGGCCCCUCAGU | 216 | 15,610 | 2584 | 1063 | |
| PC-2 (SRX716594) | 6209 | 5,514,688 | 911,884 | 375,531 | 5392 | 5,429,568 | 898,626 | 369,734 | |||||
| mir-486 | 8:hsa;mir-486-2,41660444,41660465,+ | mir-486-2 | 1048 | 1,706,986 | 426,398 | 145,185 | miR-486-5p | 5p-UCCUGUACUGAGCCGCCCCGAG | 995 | 1,705,861 | 426,704 | 145,090 | |
| mir-191 | 3:hsa;mir-191,49020633,49020655,- | mir-191 | 264 | 412698 | 103,090 | 35,101 | miR-191-5p | 5p-CAACGGAAUCCCAAAAGCAGCUG | 251 | 412,617 | 103,212 | 35,095 | |
| let-7 | 12:hsa;let-7i,62603691,62603712,+ | let-7i | 206 | 216,034 | 53,964 | 18,374 | let-7i-5p | 5p-UGAGGUAGUAGUUUGUGCUGUU | 195 | 215,993 | 54,029 | 18,371 | |
| let-7 | 9:hsa;let-7a-1,94175962,94175983,+ | let-7a-1 | 191 | 204,590 | 51,106 | 17,401 | let-7a-5p | 5p-UGAGGUAGUAGGUUGUAUAGUU | 186 | 204,568 | 51,171 | 17,399 | |
| mir-25 | 13:hsa;mir-92a-1,91351361,91351382,+ | mir-92a-1 | 476 | 193,534 | 48,344 | 16,461 | miR-92a-3p | 3p-UAUUGCACUUGUCCCGGCCUGU | 465 | 193,492 | 48,400 | 16,457 | |
| let-7 | 22:hsa;let-7b,46113691,46113712,+ | let-7b | 305 | 115,041 | 28,737 | 9785 | let-7b-5p | 5p-UGAGGUAGUAGGUUGUGUGGUU | 286 | 114,919 | 28,746 | 9774 | |
| mir-181 | 1:hsa;mir-181a-1,198859067,198859089,- | mir-181a-1 | 227 | 112,339 | 28,062 | 9555 | miR-181a-5p | 5p-AACAUUCAACGCUGUCGGUGAGU | 220 | 112,168 | 28,058 | 9540 | |
| mir-127 | 14:hsa;mir-127,100883035,100883056,+ | mir-127 | 358 | 100,453 | 25,093 | 8544 | miR-127-3p | 3p-UCGGAUCCGUCUGAGCUUGGCU | 325 | 100,285 | 25,085 | 8530 | |
| mir-320 | 8:hsa;mir-320a,22245007,22245028,- | mir-320a | 563 | 77,271 | 19,302 | 6572 | miR-320a-3p | 3p-AAAAGCUGGGUUGAGAGGGCGA | 549 | 77,217 | 19,315 | 6568 | |
| let-7 | 3:hsa;let-7g,52268282,52268303,- | let-7g | 114 | 61,357 | 15,327 | 5219 | let-7g-5p | 5p-UGAGGUAGUAGUUUGUACAGUU | 114 | 61,357 | 15,348 | 5219 | |
| mir-423 | 17:hsa;mir-423,30117095,30117117,+ | mir-423 | 429 | 68,554 | 17,125 | 5831 | miR-423-5p | 5p-UGAGGGGCAGAGAGCGAGACUUU | 230 | 52,321 | 13,088 | 4450 | |
| mir-221 | X:hsa;let-7f-2,53557199,53557220,- | let-7f-2 | 104 | 44,961 | 11,231 | 3824 | let-7f-5p | 5p-UGAGGUAGUAGAUUGUAUAGUU | 103 | 44,959 | 11,246 | 3824 | |
| mir-103 | 20:hsa;mir-103a-2,3917541,3917563,+ | mir-103a-2 | 173 | 43,831 | 10,949 | 3728 | miR-103a-3p | 3p-AGCAGCAUUGUACAGGGCUAUGA | 169 | 43,806 | 10,958 | 3726 | |
| mir-10 | X:hsa;mir-221,45746221,45746243,- | mir-221 | 165 | 42,299 | 10,566 | 3598 | miR-221-3p | 3p-AGCUACAUUGUCUGCUGGGUUUC | 155 | 42,203 | 10,557 | 3590 | |
| mir-22 | 17:hsa;mir-22,1713955,1713976,- | mir-22 | 80 | 39,426 | 9848 | 3353 | miR-22-3p | 3p-AAGCUGCCAGUUGAAGAACUGU | 76 | 39,365 | 9847 | 3348 | |
| mir-26 | 12:hsa;mir-26a-2,57824622,57824643,- | mir-26a-2 | 102 | 36,592 | 9141 | 3112 | miR-26a-5p | 5p-UUCAAGUAAUCCAGGAUAGGCU | 102 | 36,592 | 9153 | 3112 | |
| mir-28 | 8:hsa;mir-151a,140732610,140732630,- | mir-151a | 223 | 42,658 | 10,656 | 3628 | miR-151a-3p | 3p-CUAGACUGAAGCUCCUUGAGG | 173 | 33,633 | 8413 | 2861 | |
| let-7 | 9:hsa;let-7d,94178841,94178862,+ | let-7d | 128 | 33,592 | 8391 | 2857 | let-7d-5p | 5p-AGAGGUAGUAGGUUGCAUAGUU | 88 | 28,835 | 7213 | 2453 | |
| mir-423 | 17:hsa;mir-423,30117131,30117153,+ | mir-423 | 429 | 68,554 | 17,125 | 5831 | miR-423-3p | 3p-AGCUCGGUCUGAGGCCCCUCAGU | 194 | 16,218 | 4057 | 1379 | |
| let-7 | 3:hsa;mir-28,188688834,188688855,+ | mir-28 | 125 | 16,257 | 4061 | 1383 | miR-28-3p | 3p-AAGGAGCUCACAGUCUAUUGAG | 112 | 15,755 | 3941 | 1340 | |
| PC-3 (SRX716595) | 5710 | 3,637,027 | 908,514 | 309,342 | 4988 | 3,552,164 | 888,539 | 302,124 | |||||
| mir-486 | 8:hsa;mir-486-2,41660444,41660465,+ | mir-486-2 | 370 | 120,353 | 31,511 | 8040 | miR-486-5p | 5p-UCCUGUACUGAGCCGCCCCGAG | 982 | 1,894,623 | 496,945 | 126,565 | |
| mir-191 | 3:hsa;mir-191,49020633,49020655,- | mir-191 | 260 | 374,338 | 98,009 | 25,007 | miR-191-5p | 5p-CAACGGAAUCCCAAAAGCAGCUG | 249 | 374,253 | 98,164 | 25,001 | |
| let-7 | 12:hsa;let-7i,62603691,62603712,+ | let-7i | 186 | 221,365 | 57,957 | 14,788 | let-7i-5p | 5p-UGAGGUAGUAGUUUGUGCUGUU | 180 | 221,341 | 58,056 | 14,786 | |
| mir-25 | 13:hsa;mir-92a-1,91351361,91351382,+ | mir-92a-1 | 476 | 193,534 | 48,344 | 16,461 | miR-92a-3p | 3p-UAUUGCACUUGUCCCGGCCUGU | 357 | 120,306 | 31,555 | 8037 | |
| mir-181 | 1:hsa;mir-181a-1,198859067,198859089,- | mir-181a-1 | 219 | 106,232 | 27,814 | 7097 | miR-181a-5p | 5p-AACAUUCAACGCUGUCGGUGAGU | 212 | 106,081 | 27,824 | 7086 | |
| let-7 | 9:hsa;let-7a-1,94175962,94175983,+ | let-7a-1 | 138 | 100,930 | 26,425 | 6742 | let-7a-5p | 5p-UGAGGUAGUAGGUUGUAUAGUU | 136 | 100,925 | 26,472 | 6742 | |
| let-7 | 22:hsa;let-7b,46113691,46113712,+ | let-7b | 267 | 96,496 | 25,264 | 6446 | let-7b-5p | 5p-UGAGGUAGUAGGUUGUGUGGUU | 254 | 96,409 | 25,287 | 6440 | |
| mir-320 | 8:hsa;mir-320a,22245007,22245028,- | mir-320a | 605 | 94,553 | 24,756 | 6316 | miR-320a-3p | 3p-AAAAGCUGGGUUGAGAGGGCGA | 588 | 94,482 | 24,782 | 6312 | |
| mir-127 | 14:hsa;mir-127,100883035,100883056,+ | mir-127 | 348 | 93,636 | 24,516 | 6255 | miR-127-3p | 3p-UCGGAUCCGUCUGAGCUUGGCU | 320 | 93,488 | 24,521 | 6245 | |
| mir-423 | 17:hsa;mir-423,30117095,30117117,+ | mir-423 | 1053 | 1,895,916 | 496,386 | 126,651 | miR-423-5p | 5p-UGAGGGGCAGAGAGCGAGACUUU | 217 | 57,556 | 15,096 | 3845 | |
| mir-10 | X:hsa;mir-221,45746221,45746243,- | mir-221 | 173 | 41,049 | 10,747 | 2742 | miR-221-3p | 3p-AGCUACAUUGUCUGCUGGGUUUC | 161 | 40,980 | 10,749 | 2738 | |
| mir-103 | 20:hsa;mir-103a-2,3917541,3917563,+ | mir-103a-2 | 162 | 40,194 | 10,524 | 2685 | miR-103a-3p | 3p-AGCAGCAUUGUACAGGGCUAUGA | 156 | 40,167 | 10,535 | 2683 | |
| let-7 | 3:hsa;let-7g,52268282,52268303,- | let-7g | 89 | 37,080 | 9708 | 2477 | let-7g-5p | 5p-UGAGGUAGUAGUUUGUACAGUU | 88 | 37,076 | 9725 | 2477 | |
| mir-22 | 17:hsa;mir-22,1713955,1713976,- | mir-22 | 72 | 31,563 | 8264 | 2108 | miR-22-3p | 3p-AAGCUGCCAGUUGAAGAACUGU | 67 | 31,518 | 8267 | 2105 | |
| mir-26 | 12:hsa;mir-26a-2,57824622,57824643,- | mir-26a-2 | 85 | 24,891 | 6517 | 1663 | miR-26a-5p | 5p-UUCAAGUAAUCCAGGAUAGGCU | 85 | 24,891 | 6529 | 1663 | |
| mir-28 | 8:hsa;mir-151a,140732610,140732630,- | mir-151a | 184 | 27,165 | 7112 | 1815 | miR-151a-3p | 3p-CUAGACUGAAGCUCCUUGAGG | 142 | 23,095 | 6058 | 1543 | |
| mir-221 | X:hsa;let-7f-2,53557199,53557220,- | let-7f-2 | 59 | 21,314 | 5580 | 1424 | let-7f-5p | 5p-UGAGGUAGUAGAUUGUAUAGUU | 59 | 21,314 | 5591 | 1424 | |
| mir-423 | 17:hsa;mir-423,30117131,30117153,+ | mir-423 | 426 | 74,297 | 19,452 | 4963 | miR-423-3p | 3p-AGCUCGGUCUGAGGCCCCUCAGU | 206 | 16,734 | 4389 | 1118 | |
| let-7 | 9:hsa;let-7d,94178841,94178862,+ | let-7d | 107 | 20,065 | 5253 | 1340 | let-7d-5p | 5p-AGAGGUAGUAGGUUGCAUAGUU | 69 | 16,136 | 4232 | 1078 | |
| let-7 | 3:hsa;mir-28,188688834,188688855,+ | mir-28 | 105 | 11,734 | 3072 | 784 | miR-28-3p | 3p-AAGGAGCUCACAGUCUAUUGAG | 95 | 11,468 | 3008 | 766 | |
| PC-4 (SRX716596) | 5384 | 3,626,705 | 947,212 | 245,804 | 4623 | 3,422,843 | 897,785 | 228,653 | |||||
| mir-486 | 8:hsa;mir-486-2,41660444,41660465,+ | mir-486-2 | 935 | 894,301 | 337,525 | 39,428 | miR-486-5p | 5p-UCCUGUACUGAGCCGCCCCGAG | 873 | 893,294 | 337,940 | 39,384 | |
| mir-191 | 3:hsa;mir-191,49020633,49020655,- | mir-191 | 241 | 231,963 | 87,547 | 10,227 | miR-191-5p | 5p-CAACGGAAUCCCAAAAGCAGCUG | 231 | 231,904 | 87,731 | 10,224 | |
| mir-25 | 13:hsa;mir-92a-1,91351361,91351382,+ | mir-92a-1 | 564 | 229,695 | 86,691 | 10,127 | miR-92a-3p | 3p-UAUUGCACUUGUCCCGGCCUGU | 551 | 229,650 | 86,878 | 10,125 | |
| let-7 | 22:hsa;let-7b,46113691,46113712,+ | let-7b | 472 | 190,538 | 71,912 | 8401 | let-7b-5p | 5p-UGAGGUAGUAGGUUGUGUGGUU | 403 | 190,076 | 71,907 | 8380 | |
| let-7 | 9:hsa;let-7a-1,94175962,94175983,+ | let-7a-1 | 201 | 160,740 | 60,666 | 7087 | let-7a-5p | 5p-UGAGGUAGUAGGUUGUAUAGUU | 190 | 160,652 | 60,776 | 7083 | |
| let-7 | 12:hsa;let-7i,62603691,62603712,+ | let-7i | 193 | 127,164 | 47,994 | 5606 | let-7i-5p | 5p-UGAGGUAGUAGUUUGUGCUGUU | 182 | 127,135 | 48,096 | 5605 | |
| mir-181 | 1:hsa;mir-181a-1,198859067,198859089,- | mir-181a-1 | 215 | 89,739 | 33,869 | 3956 | miR-181a-5p | 5p-AACAUUCAACGCUGUCGGUGAGU | 200 | 89,565 | 33,883 | 3949 | |
| mir-320 | 8:hsa;mir-320a,22245007,22245028,- | mir-320a | 686 | 77,769 | 29,351 | 3429 | miR-320a-3p | 3p-AAAAGCUGGGUUGAGAGGGCGA | 653 | 77,613 | 29,362 | 3422 | |
| mir-423 | 17:hsa;mir-423,30117095,30117117,+ | mir-423 | 440 | 71,225 | 26,882 | 3140 | miR-423-5p | 5p-UGAGGGGCAGAGAGCGAGACUUU | 265 | 56,960 | 21,548 | 2511 | |
| mir-26 | 12:hsa;mir-26a-2,57824622,57824643,- | mir-26a-2 | 118 | 45,261 | 17,082 | 1995 | miR-26a-5p | 5p-UUCAAGUAAUCCAGGAUAGGCU | 118 | 45,261 | 17,123 | 1995 | |
| let-7 | 3:hsa;let-7g,52268282,52268303,- | let-7g | 104 | 38,106 | 14,382 | 1680 | let-7g-5p | 5p-UGAGGUAGUAGUUUGUACAGUU | 101 | 38,097 | 14,412 | 1680 | |
| mir-127 | 14:hsa;mir-127,100883035,100883056,+ | mir-127 | 236 | 32,655 | 12,325 | 1440 | miR-127-3p | 3p-UCGGAUCCGUCUGAGCUUGGCU | 210 | 32556 | 12,316 | 1435 | |
| mir-28 | 8:hsa;mir-151a,140732610,140732630,- | mir-151a | 214 | 32,928 | 12,428 | 1452 | miR-151a-3p | 3p-CUAGACUGAAGCUCCUUGAGG | 171 | 26,728 | 10,111 | 1178 | |
| let-7 | 9:hsa;let-7d,94178841,94178862,+ | let-7d | 135 | 30,214 | 11,403 | 1332 | let-7d-5p | 5p-AGAGGUAGUAGGUUGCAUAGUU | 82 | 23,494 | 8888 | 1036 | |
| let-7 | 3:hsa;mir-28,188688834,188688855,+ | mir-28 | 136 | 22,513 | 8497 | 993 | miR-28-3p | 3p-AAGGAGCUCACAGUCUAUUGAG | 125 | 22,352 | 8456 | 985 | |
| mir-221 | X:hsa;let-7f-2,53557199,53557220,- | let-7f-2 | 74 | 21,246 | 8019 | 937 | let-7f-5p | 5p-UGAGGUAGUAGAUUGUAUAGUU | 72 | 21,241 | 8036 | 936 | |
| mir-10 | X:hsa;mir-221,45746221,45746243,- | mir-221 | 112 | 18,302 | 6908 | 807 | miR-221-3p | 3p-AGCUACAUUGUCUGCUGGGUUUC | 105 | 18,262 | 6909 | 805 | |
| mir-22 | 17:hsa;mir-22,1713955,1713976,- | mir-22 | 52 | 16,322 | 6160 | 720 | miR-22-3p | 3p-AAGCUGCCAGUUGAAGAACUGU | 49 | 16,306 | 6169 | 719 | |
| mir-423 | 17:hsa;mir-423,30117131,30117153,+ | mir-423 | 440 | 71,225 | 26,882 | 3140 | miR-423-3p | 3p-AGCUCGGUCUGAGGCCCCUCAGU | 166 | 14,240 | 5387 | 628 | |
| mir-103 | 20:hsa;mir-103a-2,3917541,3917563,+ | mir-103a-2 | 109 | 8830 | 3333 | 389 | miR-103a-3p | 3p-AGCAGCAUUGUACAGGGCUAUGA | 108 | 8827 | 3339 | 389 | |
| PC-5 (SRX716597) | 5677 | 2,410,736 | 909,855 | 106,286 | 4855 | 2,324,213 | 879,268 | 102,471 | |||||
| mir-486 | 8:hsa;mir-486-2,41660444,41660465,+ | mir-486-2 | 683 | 615,100 | 431,689 | 44,784 | miR-486-5p | 5p-UCCUGUACUGAGCCGCCCCGAG | 652 | 614,560 | 432,677 | 44,745 | |
| mir-191 | 3:hsa;mir-191,49020633,49020655,- | mir-191 | 157 | 104,250 | 73,165 | 7590 | miR-191-5p | 5p-CAACGGAAUCCCAAAAGCAGCUG | 152 | 104,216 | 73,373 | 7588 | |
| let-7 | 22:hsa;let-7b,46113691,46113712,+ | let-7b | 249 | 75,462 | 52,961 | 5494 | let-7b-5p | 5p-UGAGGUAGUAGGUUGUGUGGUU | 230 | 75,389 | 53,077 | 5489 | |
| mir-25 | 13:hsa;mir-92a-1,91351361,91351382,+ | mir-92a-1 | 311 | 75,403 | 52,919 | 5490 | miR-92a-3p | 3p-UAUUGCACUUGUCCCGGCCUGU | 305 | 75,383 | 53,073 | 5488 | |
| let-7 | 9:hsa;let-7a-1,94175962,94175983,+ | let-7a-1 | 123 | 68,853 | 48,322 | 5013 | let-7a-5p | 5p-UGAGGUAGUAGGUUGUAUAGUU | 120 | 68,845 | 48,470 | 5012 | |
| let-7 | 12:hsa;let-7i,62603691,62603712,+ | let-7i | 117 | 54,798 | 38,458 | 3990 | let-7i-5p | 5p-UGAGGUAGUAGUUUGUGCUGUU | 113 | 54,789 | 38,574 | 3989 | |
| mir-181 | 1:hsa;mir-181a-1,198859067,198859089,- | mir-181a-1 | 157 | 51,930 | 36,445 | 3781 | miR-181a-5p | 5p-AACAUUCAACGCUGUCGGUGAGU | 147 | 51,833 | 36,493 | 3774 | |
| mir-423 | 17:hsa;mir-423,30117131,30117153,+ | mir-423 | 282 | 35,167 | 24,681 | 2560 | miR-423-3p | 3p-AGCUCGGUCUGAGGCCCCUCAGU | 130 | 11,232 | 7908 | 818 | |
| mir-423 | 17:hsa;mir-423,30117095,30117117,+ | mir-423 | 282 | 35,167 | 24,681 | 2560 | miR-423-5p | 5p-UGAGGGGCAGAGAGCGAGACUUU | 151 | 23,930 | 16,848 | 1742 | |
| mir-320 | 8:hsa;mir-320a,22245007,22245028,- | mir-320a | 377 | 34,546 | 24,245 | 2515 | miR-320a-3p | 3p-AAAAGCUGGGUUGAGAGGGCGA | 367 | 34,507 | 24,294 | 2512 | |
| mir-22 | 17:hsa;mir-22,1713955,1713976,- | mir-22 | 51 | 21,777 | 15,284 | 1586 | miR-22-3p | 3p-AAGCUGCCAGUUGAAGAACUGU | 68 | 10,244 | 7212 | 746 | |
| mir-26 | 12:hsa;mir-26a-2,57824622,57824643,- | mir-26a-2 | 77 | 20,298 | 14,246 | 1478 | miR-26a-5p | 5p-UUCAAGUAAUCCAGGAUAGGCU | 76 | 20,295 | 14,289 | 1478 | |
| mir-221 | X:hsa;let-7f-2,53557199,53557220,- | let-7f-2 | 64 | 18,956 | 13,304 | 1380 | let-7f-5p | 5p-UGAGGUAGUAGAUUGUAUAGUU | 64 | 18,956 | 13,346 | 1380 | |
| let-7 | 3:hsa;let-7g,52268282,52268303,- | let-7g | 56 | 15,713 | 11,028 | 1144 | let-7g-5p | 5p-UGAGGUAGUAGUUUGUACAGUU | 54 | 15,709 | 11,060 | 1144 | |
| mir-28 | 8:hsa;mir-151a,140732610,140732630,- | mir-151a | 139 | 13,978 | 9810 | 1018 | miR-151a-3p | 3p-CUAGACUGAAGCUCCUUGAGG | 109 | 10,663 | 7507 | 776 | |
| mir-127 | 14:hsa;mir-127,100883035,100883056,+ | mir-127 | 135 | 13,017 | 9136 | 948 | miR-127-3p | 3p-UCGGAUCCGUCUGAGCUUGGCU | 126 | 12,990 | 9146 | 946 | |
| let-7 | 9:hsa;let-7d,94178841,94178862,+ | let-7d | 75 | 11,189 | 7853 | 815 | let-7d-5p | 5p-AGAGGUAGUAGGUUGCAUAGUU | 51 | 9603 | 6761 | 699 | |
| mir-10 | X:hsa;mir-221,45746221,45746243,- | mir-221 | 75 | 10,284 | 7218 | 749 | miR-221-3p | 3p-AGCUACAUUGUCUGCUGGGUUUC | 47 | 21,761 | 15,321 | 1584 | |
| mir-103 | 20:hsa;mir-103a-2,3917541,3917563,+ | mir-103a-2 | 88 | 9053 | 6354 | 659 | miR-103a-3p | 3p-AGCAGCAUUGUACAGGGCUAUGA | 86 | 9049 | 6371 | 659 | |
| let-7 | 3:hsa;mir-28,188688834,188688855,+ | mir-28 | 82 | 6351 | 4457 | 462 | miR-28-3p | 3p-AAGGAGCUCACAGUCUAUUGAG | 73 | 6095 | 4291 | 444 | |
| PC-7 (SRX716598) | 3580 | 1,291,292 | 906,254 | 94016 | 3121 | 1,250,049 | 880,088 | 91,013 | |||||
| mir-486 | 8:hsa;mir-486-2,41660444,41660465,+ | mir-486-2 | 1130 | 1,350,603 | 375,231 | 55,530 | miR-486-5p | 5p-UCCUGUACUGAGCCGCCCCGAG | 1071 | 1,349,469 | 376,279 | 55,483 | |
| mir-191 | 3:hsa;mir-191,49020633,49020655,- | mir-191 | 277 | 267,823 | 74,408 | 11,012 | miR-191-5p | 5p-CAACGGAAUCCCAAAAGCAGCUG | 266 | 267,756 | 746,60 | 11,009 | |
| let-7 | 22:hsa;let-7b,46113691,46113712,+ | let-7b | 481 | 257,858 | 71,639 | 10,602 | let-7b-5p | 5p-UGAGGUAGUAGGUUGUGUGGUU | 439 | 257,625 | 71,835 | 10,592 | |
| mir-25 | 13:hsa;mir-92a-1,91351361,91351382,+ | mir-92a-1 | 589 | 243,120 | 67,545 | 9996 | miR-92a-3p | 3p-UAUUGCACUUGUCCCGGCCUGU | 574 | 243,075 | 67,778 | 9994 | |
| let-7 | 12:hsa;let-7i,62603691,62603712,+ | let-7i | 222 | 194,147 | 53,939 | 7982 | let-7i-5p | 5p-UGAGGUAGUAGUUUGUGCUGUU | 214 | 194,099 | 54,122 | 7980 | |
| let-7 | 9:hsa;let-7a-1,94175962,94175983,+ | let-7a-1 | 206 | 182,459 | 50,692 | 7502 | let-7a-5p | 5p-UGAGGUAGUAGGUUGUAUAGUU | 197 | 182,420 | 50,865 | 7500 | |
| mir-181 | 1:hsa;mir-181a-1,198859067,198859089,- | mir-181a-1 | 253 | 108,155 | 30,048 | 4447 | miR-181a-5p | 5p-AACAUUCAACGCUGUCGGUGAGU | 244 | 107,985 | 30,110 | 4440 | |
| mir-320 | 8:hsa;mir-320a,22245007,22245028,- | mir-320a | 813 | 106,945 | 29,712 | 4397 | miR-320a-3p | 3p-AAAAGCUGGGUUGAGAGGGCGA | 780 | 106,785 | 29,775 | 4390 | |
| mir-423 | 17:hsa;mir-423,30117095,30117117,+ | mir-423 | 492 | 90,138 | 25,043 | 3706 | miR-423-5p | 5p-UGAGGGGCAGAGAGCGAGACUUU | 267 | 65,916 | 18,380 | 2710 | |
| let-7 | 3:hsa;let-7g,52268282,52268303,- | let-7g | 104 | 50,033 | 13,900 | 2057 | let-7g-5p | 5p-UGAGGUAGUAGUUUGUACAGUU | 102 | 50,027 | 13,949 | 2057 | |
| mir-22 | 17:hsa;mir-22,1713955,1713976,- | mir-22 | 81 | 45,147 | 12,543 | 1856 | miR-22-3p | 3p-AAGCUGCCAGUUGAAGAACUGU | 78 | 45,115 | 12,580 | 1855 | |
| mir-26 | 12:hsa;mir-26a-2,57824622,57824643,- | mir-26a-2 | 135 | 44,947 | 12,487 | 1848 | miR-26a-5p | 5p-UUCAAGUAAUCCAGGAUAGGCU | 134 | 44,945 | 12,532 | 1848 | |
| mir-127 | 14:hsa;mir-127,100883035,100883056,+ | mir-127 | 299 | 40,887 | 11,359 | 1681 | miR-127-3p | 3p-UCGGAUCCGUCUGAGCUUGGCU | 276 | 40,818 | 11,381 | 1678 | |
| mir-28 | 8:hsa;mir-151a,140732610,140732630,- | mir-151a | 279 | 46,226 | 12,843 | 1901 | miR-151a-3p | 3p-CUAGACUGAAGCUCCUUGAGG | 221 | 36,268 | 10,113 | 1491 | |
| mir-221 | X:hsa;let-7f-2,53557199,53557220,- | let-7f-2 | 96 | 31,868 | 8854 | 1310 | let-7f-5p | 5p-UGAGGUAGUAGAUUGUAUAGUU | 95 | 31,865 | 8885 | 1310 | |
| mir-10 | X:hsa;mir-221,45746221,45746243,- | mir-221 | 178 | 27,407 | 7614 | 1127 | miR-221-3p | 3p-AGCUACAUUGUCUGCUGGGUUUC | 169 | 27,340 | 7623 | 1124 | |
| let-7 | 9:hsa;let-7d,94178841,94178862,+ | let-7d | 159 | 35,482 | 9858 | 1459 | let-7d-5p | 5p-AGAGGUAGUAGGUUGCAUAGUU | 104 | 26,539 | 7400 | 1091 | |
| mir-423 | 17:hsa;mir-423,30117131,30117153,+ | mir-423 | 492 | 90,138 | 25,043 | 3706 | miR-423-3p | 3p-AGCUCGGUCUGAGGCCCCUCAGU | 221 | 24,211 | 6751 | 995 | |
| let-7 | 3:hsa;mir-28,188688834,188688855,+ | mir-28 | 138 | 18,683 | 5191 | 768 | miR-28-3p | 3p-AAGGAGCUCACAGUCUAUUGAG | 123 | 18,324 | 5109 | 753 | |
| mir-103 | 20:hsa;mir-103a-2,3917541,3917563,+ | mir-103a-2 | 163 | 16,403 | 4557 | 674 | miR-103a-3p | 3p-AGCAGCAUUGUACAGGGCUAUGA | 159 | 16,386 | 4569 | 674 | |
| 6587 | 3,248,469 | 902,504 | 13,3561 | 5734 | 3,136,968 | 874,696 | 128,977 | ||||||
| (1) Quantification of IsomiR on Platelets Concentrates | |||||||||
|---|---|---|---|---|---|---|---|---|---|
| Samples | NTA n (%) | length Variants n (%) | |||||||
| NTA(A) | NTA(U) | NTA(C) | NTA(G) | lv3pE | lv3pT | lv5pE | lv5pT | mv | |
| PC-1: SRX716593 | 1,502,312 (37.44%) | 2,447,590 (60.99%) | 40,885 (1.02%) | 22,103 (0.55%) | 327,889 (23.06%) | 1,003,147 (70.57%) | 12,792 (0.90%) | 40,465 (2.85%) | 37,294 (2.62%) |
| PC-2: SRX716594 | 729,738 (32.24%) | 1,491,187 (65.88%) | 29,352 (1.30%) | 13,064 (0.58%) | 273,874 (26.53%) | 687,827 (66.62%) | 11,494 (1.11%) | 29,902 (2.90%) | 29,309 (2.84%) |
| PC-3: SRX716595 | 810,533 (32.93%) | 1,608,776 (65.37%) | 28,059 (1.14%) | 13,731 (0.56%) | 228,445 (25.58%) | 599,868 (67.17%) | 10,425 (1.17%) | 27,552 (3.09%) | 26,805 (3.0%) |
| PC-4: SRX716596 | 408,066 (30.47%) | 891,951 (66.59%) | 24,271 (1.81%) | 15,139 (1.13%) | 252,015 (32.18%) | 485,983 (62.06%) | 8226 (1.05%) | 13,027 (1.66%) | 23,772 (3.04%) |
| PC-5: SRX716597 | 248,172 (31.43%) | 524,128 (66.38%) | 11,835 (1.50%) | 5399 (0.68%) | 117,710 (28.07%) | 276,958 (66.05%) | 4360 (1.04%) | 8447 (2.01%) | 11,825 (2.82%) |
| PC-7: SRX716598 | 563,001 (30.42%) | 1,245,683 (67.31%) | 28,203 (1.52%) | 13,850 (0.75%) | 315,489 (30.11%) | 666,785 (63.64%) | 10,999 (1.05%) | 23,665 (2.26%) | 30,845 (2.94%) |
| (2) IsomiR quantification of miRNAs | |||||||||
| MicroRNAs | NTA(A) | NTA(U) | NTA(C) | NTA(G) | lv3pE | lv3pT | lv5pE | lv5pT | mv |
| Mean ± SD | Mean ± SD | Mean ± SD | Mean ± SD | Mean ± SD | Mean ± SD | Mean ± SD | Mean ± SD | Mean ± SD | |
| miR-486-5p | 309,714.33 ± 214,491.01 | 574,218.67 ± 322,270.07 | 5408.50 ± 2232.18 | 3203.00 ± 1596.31 | 8734.00 ± 6386.92 | 164,491.33 ± 70,125.67 | 0.00 ± 0.00 | 1229.17 ± 695.15 | 488.50 ± 291.12 |
| miR-92a-3p | 24,452.83 ± 11,342.48 | 53,794.17 ± 24,607.88 | 1299.67 ± 567.11 | 441.00 ± 198.83 | 15,592.33 ± 5685.46 | 2098.67 ± 1071.13 | 0.00 ± 0.00 | 4383.33 ± 2515.53 | 1046.33 ± 581.30 |
| miR-320a-3p | 70.00 ± 26.11 | 36,580.33 ± 11,751.30 | 3276.83 ± 1017.55 | 586.50 ± 196.71 | 11,801.83 ± 4316.82 | 4569.67 ± 1424.88 | 316.33 ± 109.64 | 601.67 ± 222.68 | 1153.83 ± 405.98 |
| miR-127-3p | 24,75.50 ± 1398.62 | 23,384.33 ± 14,379.70 | 528.67 ± 284.26 | 135.17 ± 68.68 | 69.67 ± 39.70 | 2250.83 ± 1379.51 | 1.00 ± 1.67 | 23.67 ± 12.20 | 51.33 ± 30.78 |
| let-7i-5p | 5077.67 ± 1715.29 | 15,656.33 ± 5569.34 | 244.67 ± 94.76 | 63.33 ± 27.44 | 271.33 ± 91.98 | 13,603.17 ± 6109.05 | 49.17 ± 30.21 | 73.00 ± 42.30 | 3.17 ± 5.45 |
| let-7b-5p | 4275.00 ± 2339.25 | 15,041.50 ± 8794.91 | 276.67 ± 107.23 | 1220.33 ± 447.08 | 42,038.67 ± 23925.81 | 13,505.17 ± 5057.22 | 0.33 ± 0.81 | 27.17 ± 19.67 | 89.00 ± 74.70 |
| miR-103a-3p | 19.00 ± 10.25 | 6990.67 ± 5086.50 | 427.00 ± 299.86 | 83.50 ± 62.05 | 399.83 ± 304.29 | 3527.33 ± 2085.80 | 0.00 ± 0.00 | 107.33 ± 60.68 | 16.50 ± 14.39 |
| miR-151a-3p | 1053.67 ± 520.25 | 5477.33 ± 2625.91 | 1695.17 ± 745.09 | 12.67 ± 8.35 | 12,337.17 ± 5300.43 | 194.83 ± 128.54 | 1263.83 ± 479.98 | 18.17 ± 15.14 | 489.50 ± 191.70 |
| miR-221-3p | 255.83 ± 92.34 | 5208.17 ± 2445.48 | 39.83 ± 18.62 | 98.50 ± 43.19 | 233.67 ± 103.63 | 8629.50 ± 3483.21 | 0.83 ± 1.32 | 31.83 ± 21.29 | 18.33 ± 11.37 |
| miR-26a-5p | 326.67 ± 140.92 | 2566.17 ± 947.53 | 202.00 ± 83.77 | 99.33 ± 64.75 | 98.00 ± 43.78 | 814.00 ± 251.09 | 0.00 ± 0.00 | 90.00 ± 31.56 | 3.00 ± 2.44 |
| miR-423-3p | 629.83 ± 262.84 | 2468.17 ± 523.97 | 42.33 ± 17.09 | 21.33 ± 6.71 | 34.50 ± 10.15 | 1111.50 ± 505.16 | 1174.50 ± 270.23 | 91.83 ± 30.45 | 244.00 ± 96.06 |
| miR-28-3p | 3834.83 ± 1724.38 | 2080.50 ± 861.14 | 1169.50 ± 506.45 | 9.83 ± 7.19 | 313.67 ± 176.53 | 451.17 ± 194.87 | 8.83 ± 3.86 | 88.33 ± 33.26 | 641.33 ± 309.20 |
| miR-423-5p | 1027.50 ± 347.28 | 1931.33 ± 692.43 | 246.67 ± 79.94 | 73.17 ± 28.13 | 8093.67 ± 2410.61 | 10,057.67 ± 3071.29 | 3.50 ± 3.72 | 56.00 ± 21.75 | 106.83 ± 42.37 |
| miR-181a-5p | 1010.00 ± 364.20 | 995.00 ± 335.88 | 64.17 ± 36.45 | 496.00 ± 211.93 | 4112.50 ± 2167.39 | 59,343.00 ± 22,151.37 | 24.17 ± 9.04 | 32.17 ± 13.25 | 147.00 ± 46.51 |
| miR-191-5p | 593.00 ± 377.16 | 354.17 ± 359.66 | 138.00 ± 61.92 | 394.33 ± 220.96 | 18,876.83 ± 8085.89 | 3657.83 ± 3352.16 | 0.00 ± 0.00 | 6858.50 ± 4181.14 | 688.33 ± 335.25 |
| let-7g-5p | 560.33 ± 291.29 | 102.83 ± 35.91 | 24.00 ± 13.08 | 87.17 ± 33.34 | 1824.00 ± 654.24 | 3554.83 ± 1964.37 | 193.67 ± 74.25 | 4.50 ± 5.35 | 33.67 ± 16.21 |
| let-7a-5p | 1487.17 ± 713.56 | 34.17 ± 15.19 | 112.67 ± 37.51 | 250.83 ± 85.09 | 13,054.83 ± 4155.43 | 10,072.00 ± 3754.47 | 3.83 ± 3.65 | 54.33 ± 51.65 | 44.17 ± 18.68 |
| let-7d-5p | 251.00 ± 93.41 | 9.33 ± 6.71 | 15.83 ± 8.97 | 45.50 ± 16.02 | 2268.83 ± 731.15 | 1409.00 ± 563.21 | 10.00 ± 4.00 | 74.83 ± 40.87 | 18.33 ± 10.23 |
| miR-22-3p | 63.00 ± 24.42 | 6.83 ± 6.17 | 5.17 ± 1.94 | 54.83 ± 20.99 | 60.83 ± 39.65 | 1100.67 ± 466.98 | 3.17 ± 2.85 | 79.83 ± 42.65 | 1.67 ± 1.50 |
| let-7f-5p | 343.50 ± 128.08 | 1.33 ± 2.42 | 25.33 ± 9.58 | 3.50 ± 3.20 | 1374.67 ± 384.31 | 2608.00 ± 1280.50 | 14.00 ± 7.07 | 16.00 ± 15.33 | 7.83 ± 5.34 |
© 2020 by the authors. Licensee MDPI, Basel, Switzerland. This article is an open access article distributed under the terms and conditions of the Creative Commons Attribution (CC BY) license (http://creativecommons.org/licenses/by/4.0/).
Share and Cite
Maués, J.H.d.S.; Moreira-Nunes, C.d.F.A.; Burbano, R.M.R. Computational Identification and Characterization of New microRNAs in Human Platelets Stored in a Blood Bank. Biomolecules 2020, 10, 1173. https://doi.org/10.3390/biom10081173
Maués JHdS, Moreira-Nunes CdFA, Burbano RMR. Computational Identification and Characterization of New microRNAs in Human Platelets Stored in a Blood Bank. Biomolecules. 2020; 10(8):1173. https://doi.org/10.3390/biom10081173
Chicago/Turabian StyleMaués, Jersey Heitor da Silva, Caroline de Fátima Aquino Moreira-Nunes, and Rommel Mário Rodriguez Burbano. 2020. "Computational Identification and Characterization of New microRNAs in Human Platelets Stored in a Blood Bank" Biomolecules 10, no. 8: 1173. https://doi.org/10.3390/biom10081173