Machine Learning-Empowered FTIR Spectroscopy Serum Analysis Stratifies Healthy, Allergic, and SIT-Treated Mice and Humans

 ,
,  and
and 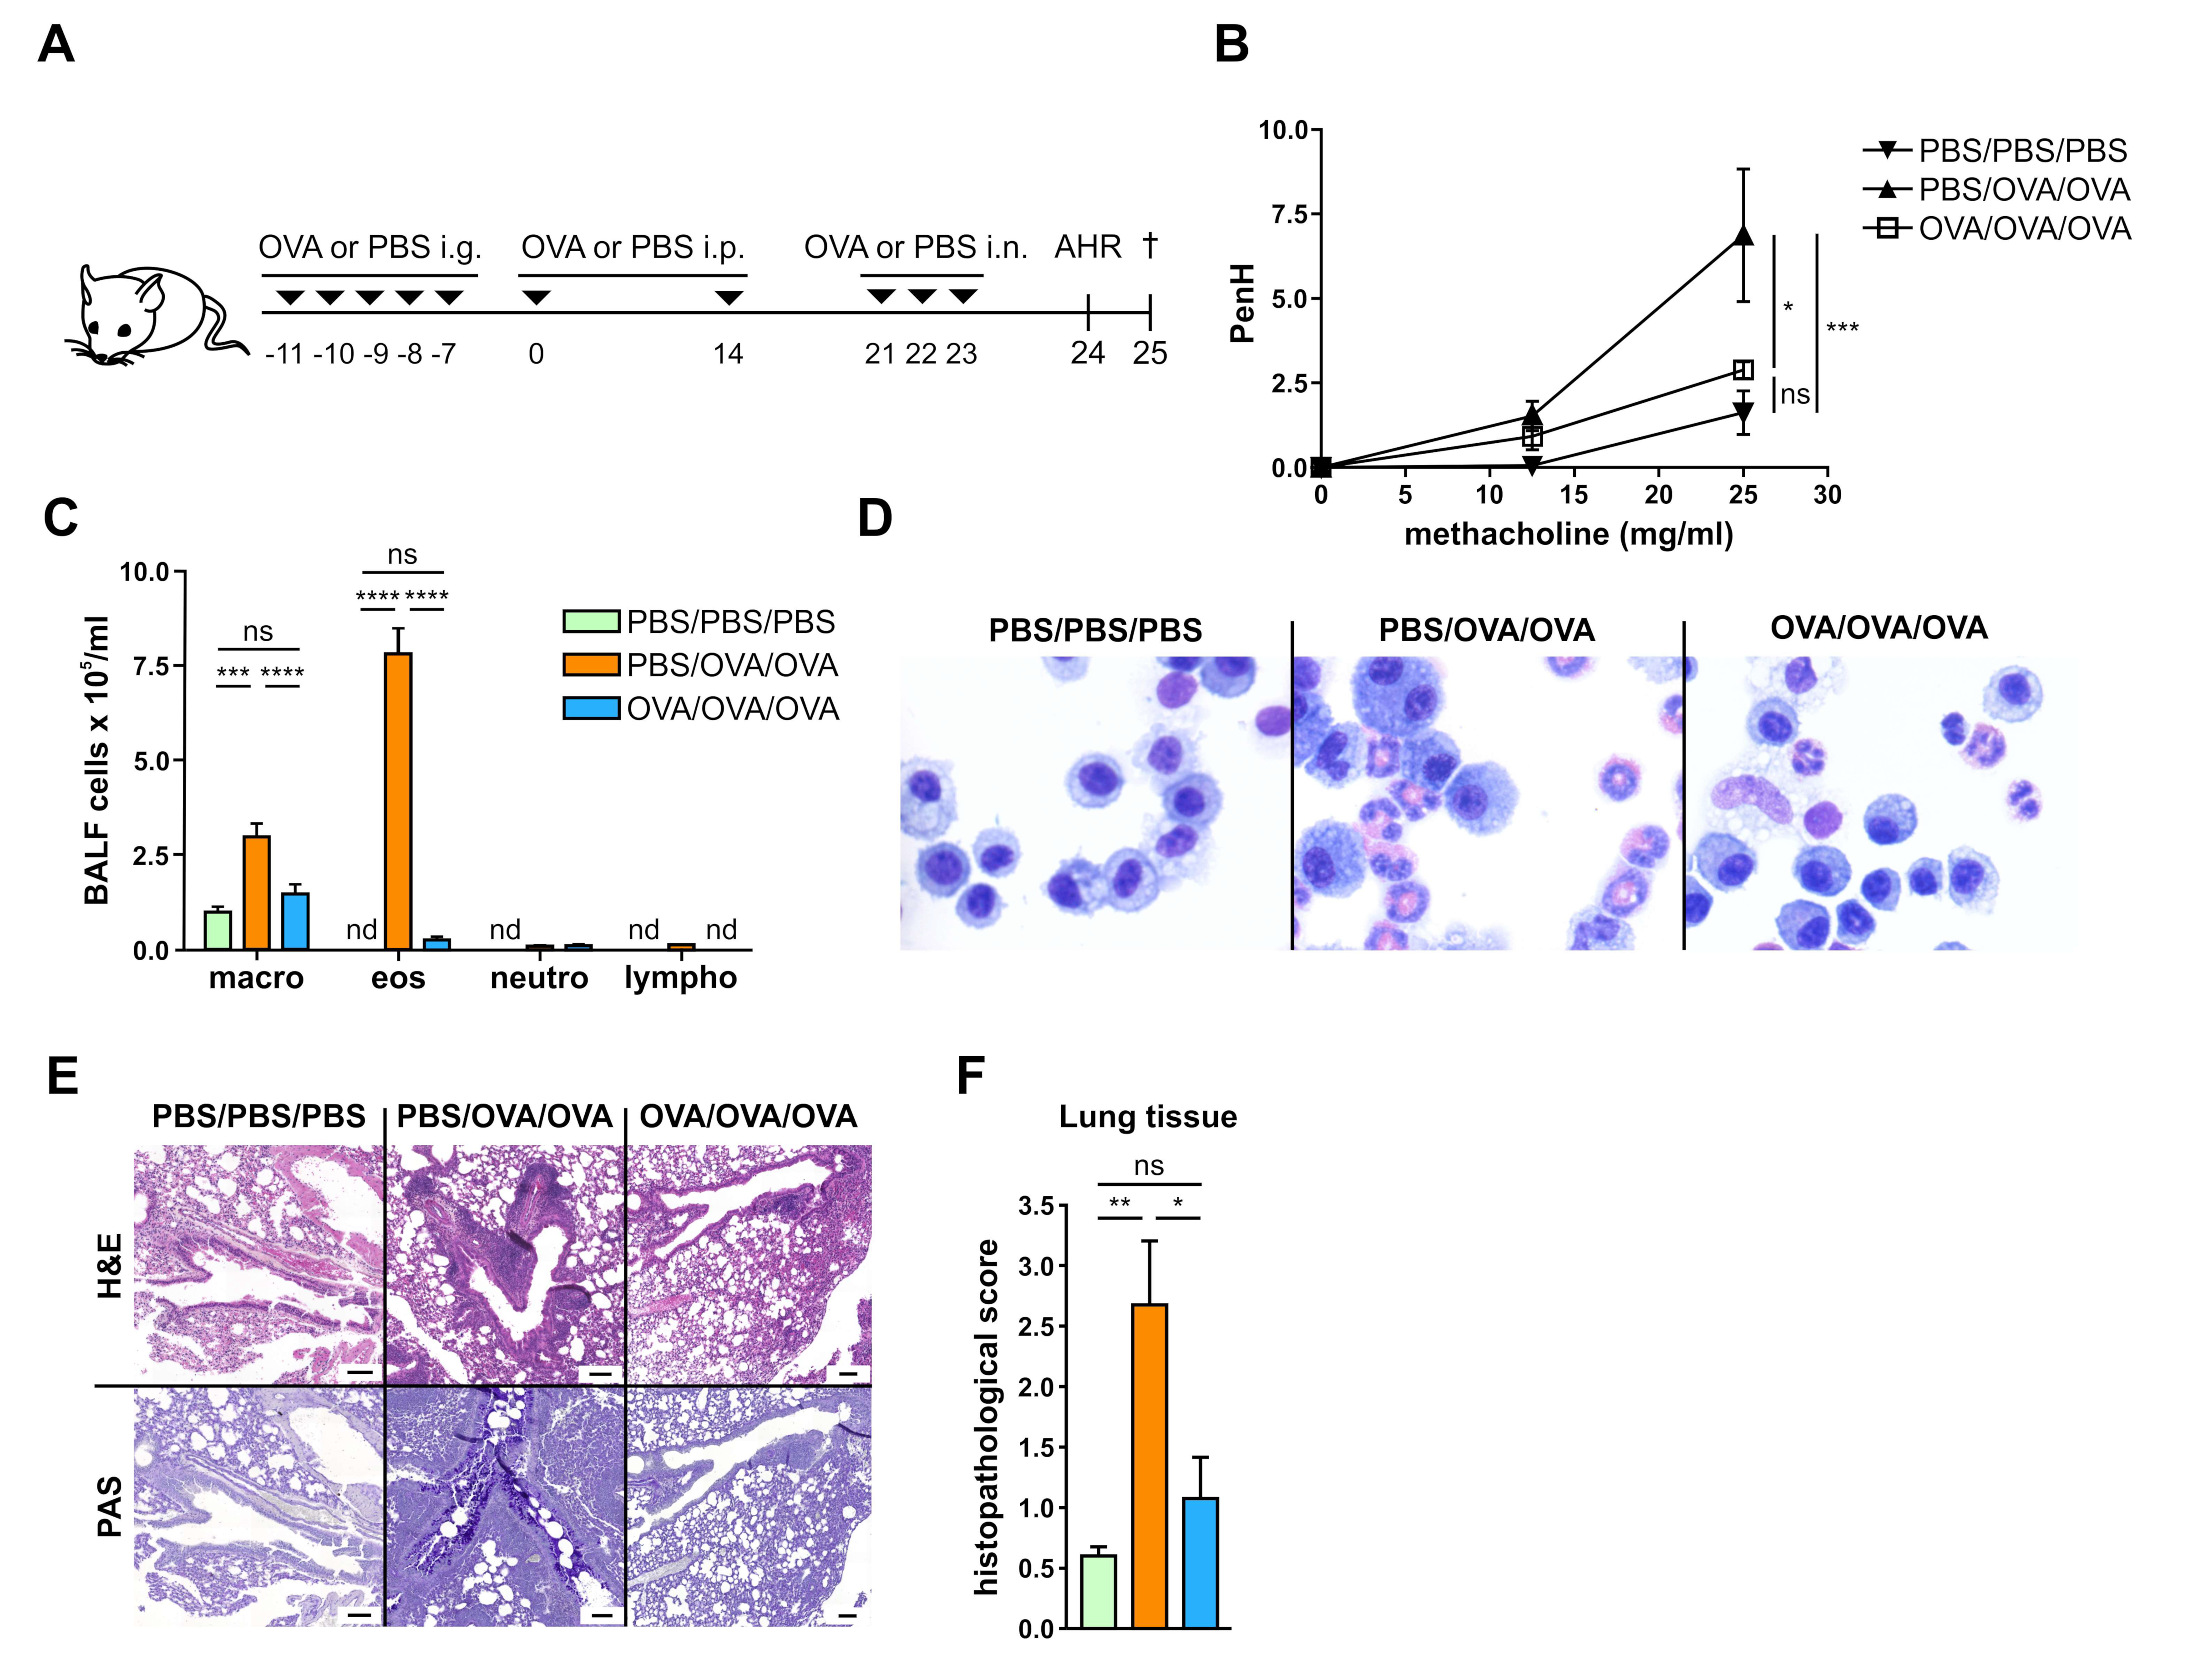
Abstract
:1. Introduction
2. Material and Methods
2.1. Mice
2.2. Experimental Design and Measurement of Airway Hyperresponsiveness
2.3. Allergen-Specific Tolerance Induction
2.4. Differential Cell counts in Bronchoalveolar Lavage Fluid (BALF)
2.5. Lung Cell Isolation and in Vitro Stimulation
2.6. Lung Histology
2.7. Collection of Serum
2.8. Detection of OVA-Specific Antibodies
2.9. Rat Basophil Leukemia (RBL) Cell-Based Assay
2.10. Human Serum Samples
2.11. Measurements of Serum Samples by FTIR Spectroscopy
2.12. Spectral Data Quality Assessment
2.13. Spectral Data Pre-Processing
2.14. Unsupervised Learning: Principal Component Analysis (PCA)
2.15. Supervised Learning: Deep Learning
2.16. Convolutional Neural Networks (CNN) Model Architecture
2.17. Statistics
3. Results
3.1. Allergen-Specific Oral Tolerization Reduces AHR to Methacholine and Suppresses Recruitment of Eosinophils to the Lung
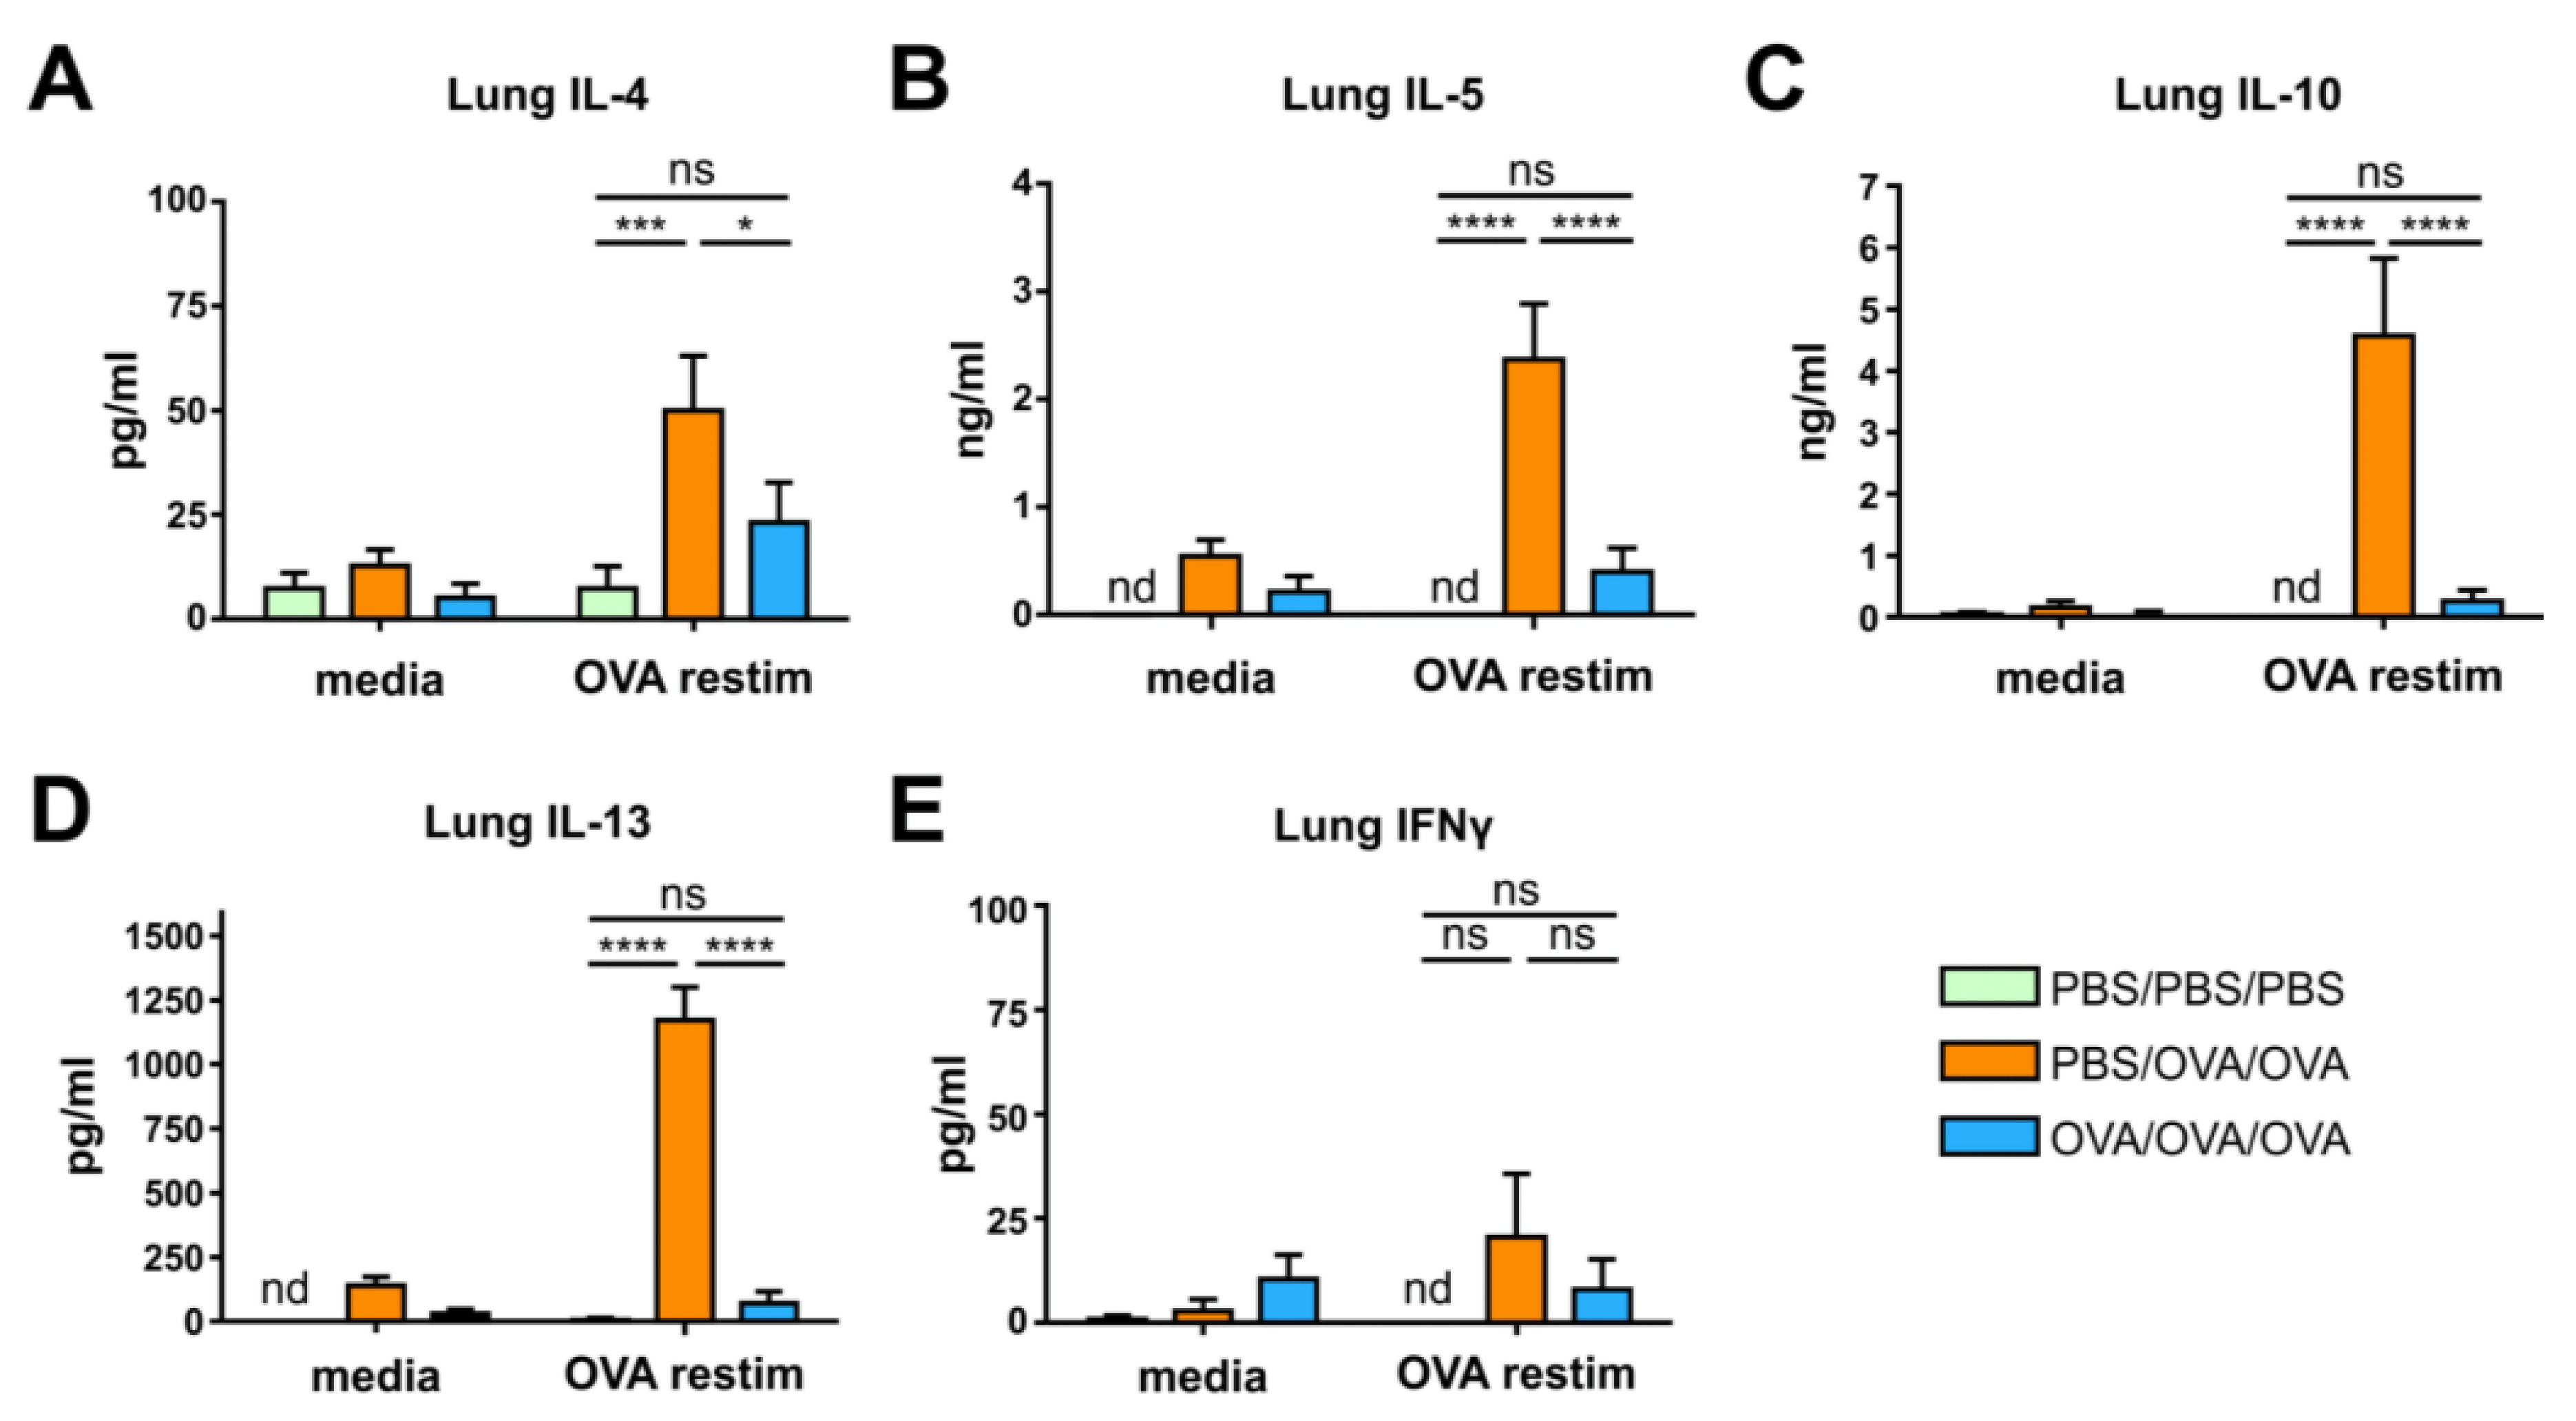
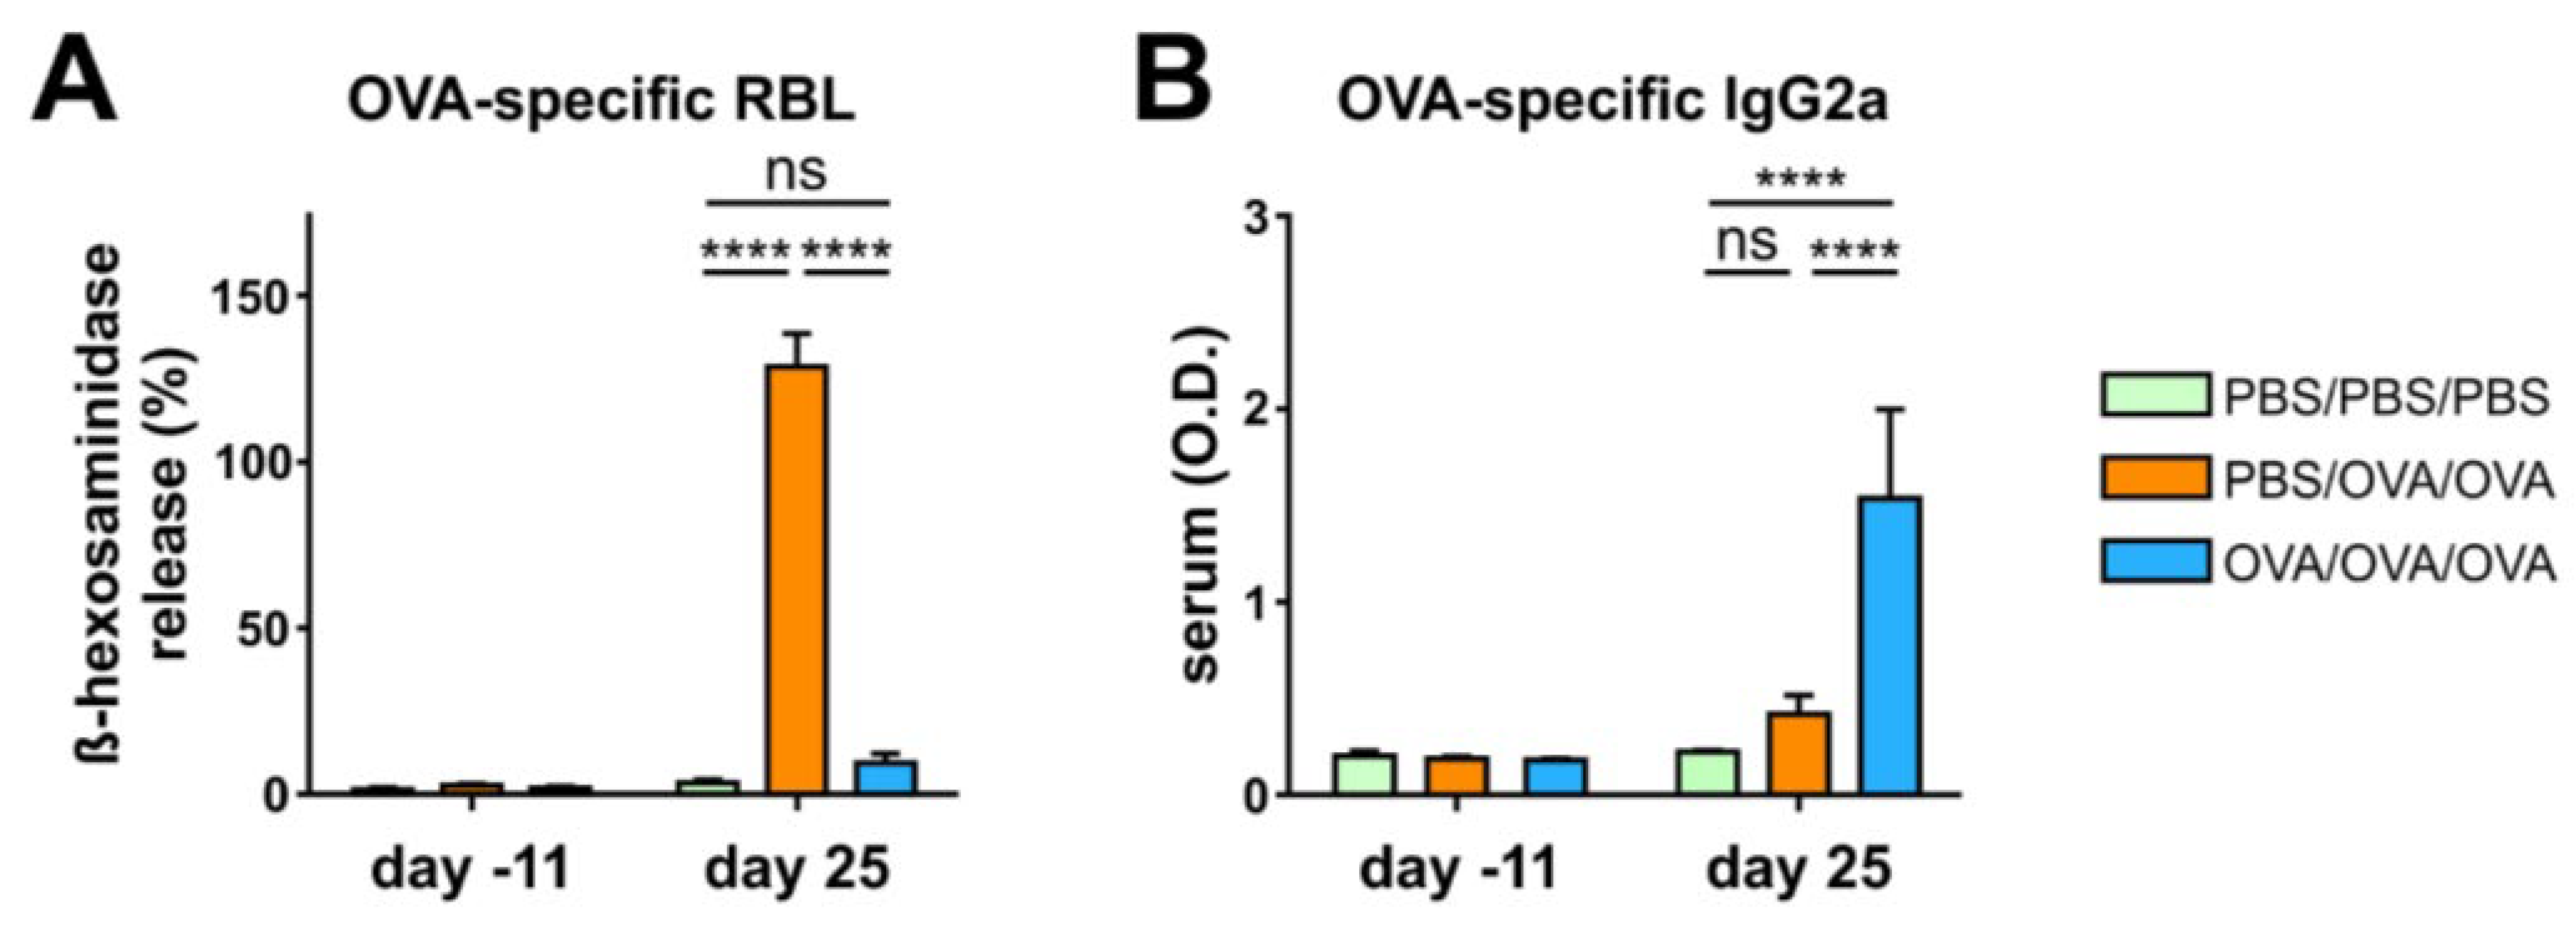
3.2. Allergen-Specific Oral Tolerization Reduces Th2 Cellular and Humoral Responses
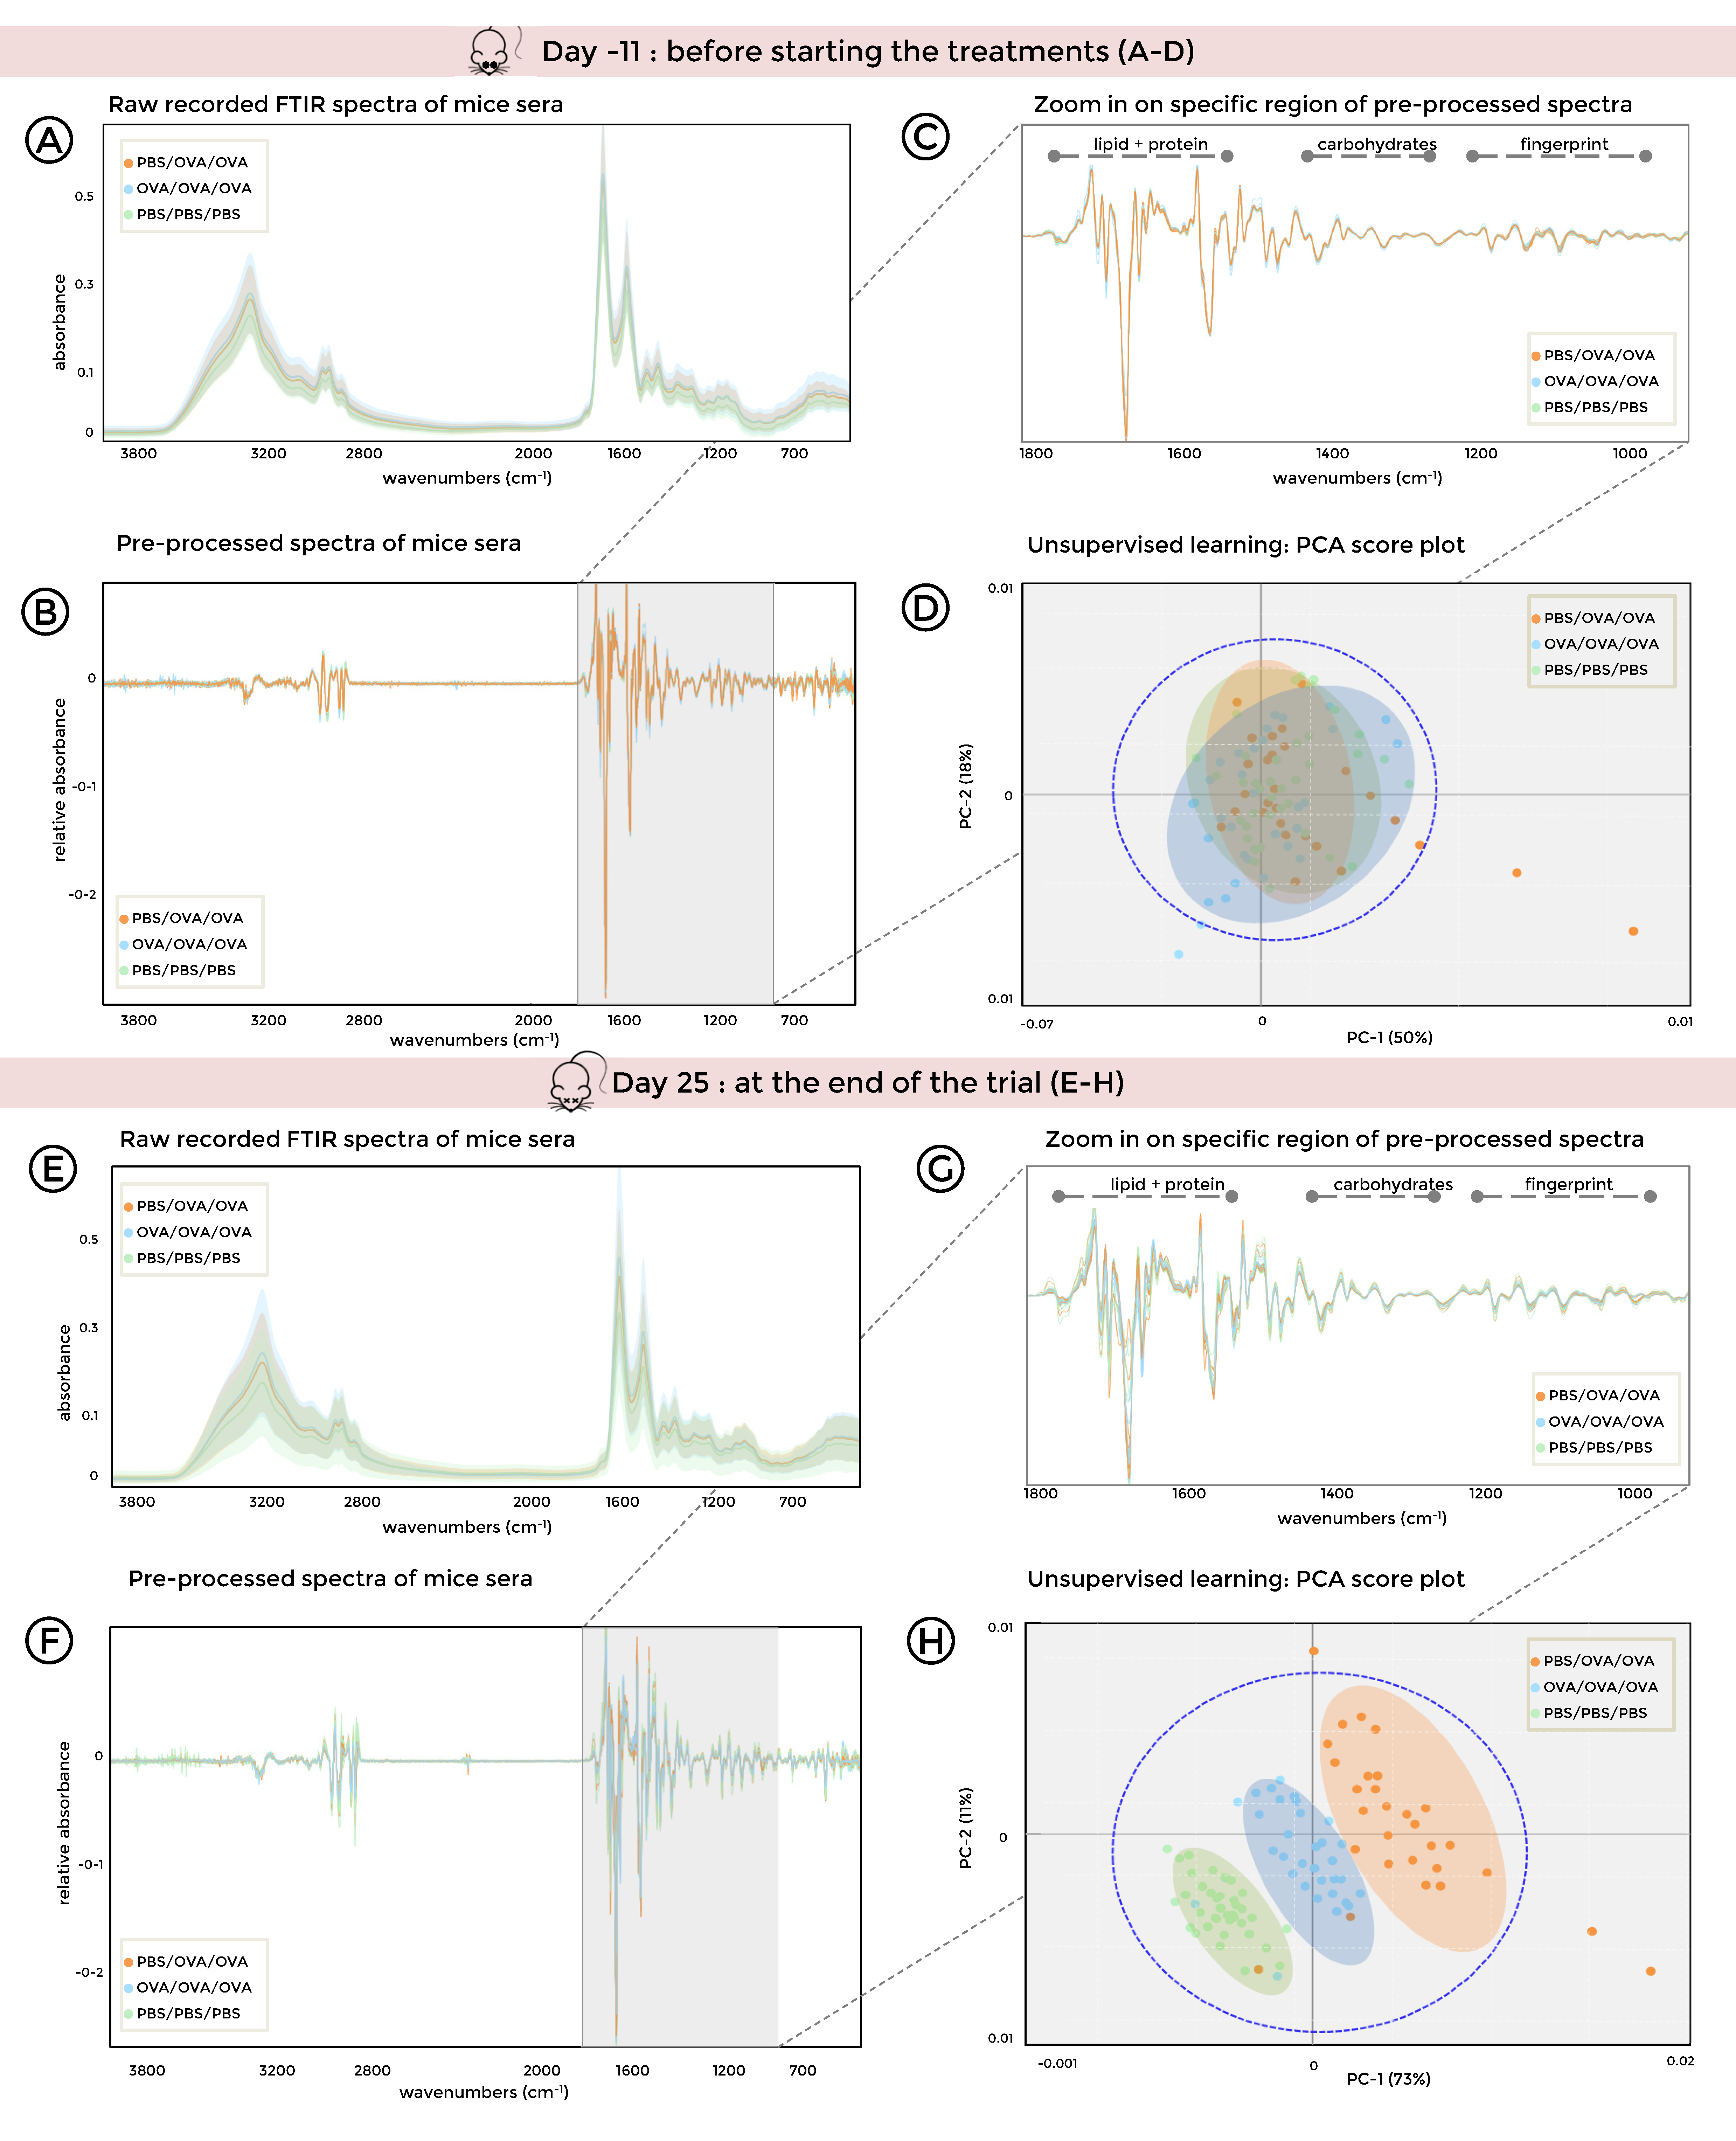
3.3. FTIR Spectroscopy Combined with Unsupervised Machine Learning of Serum Samples Stratifies Healthy, Allergic, and Tolerized Mice
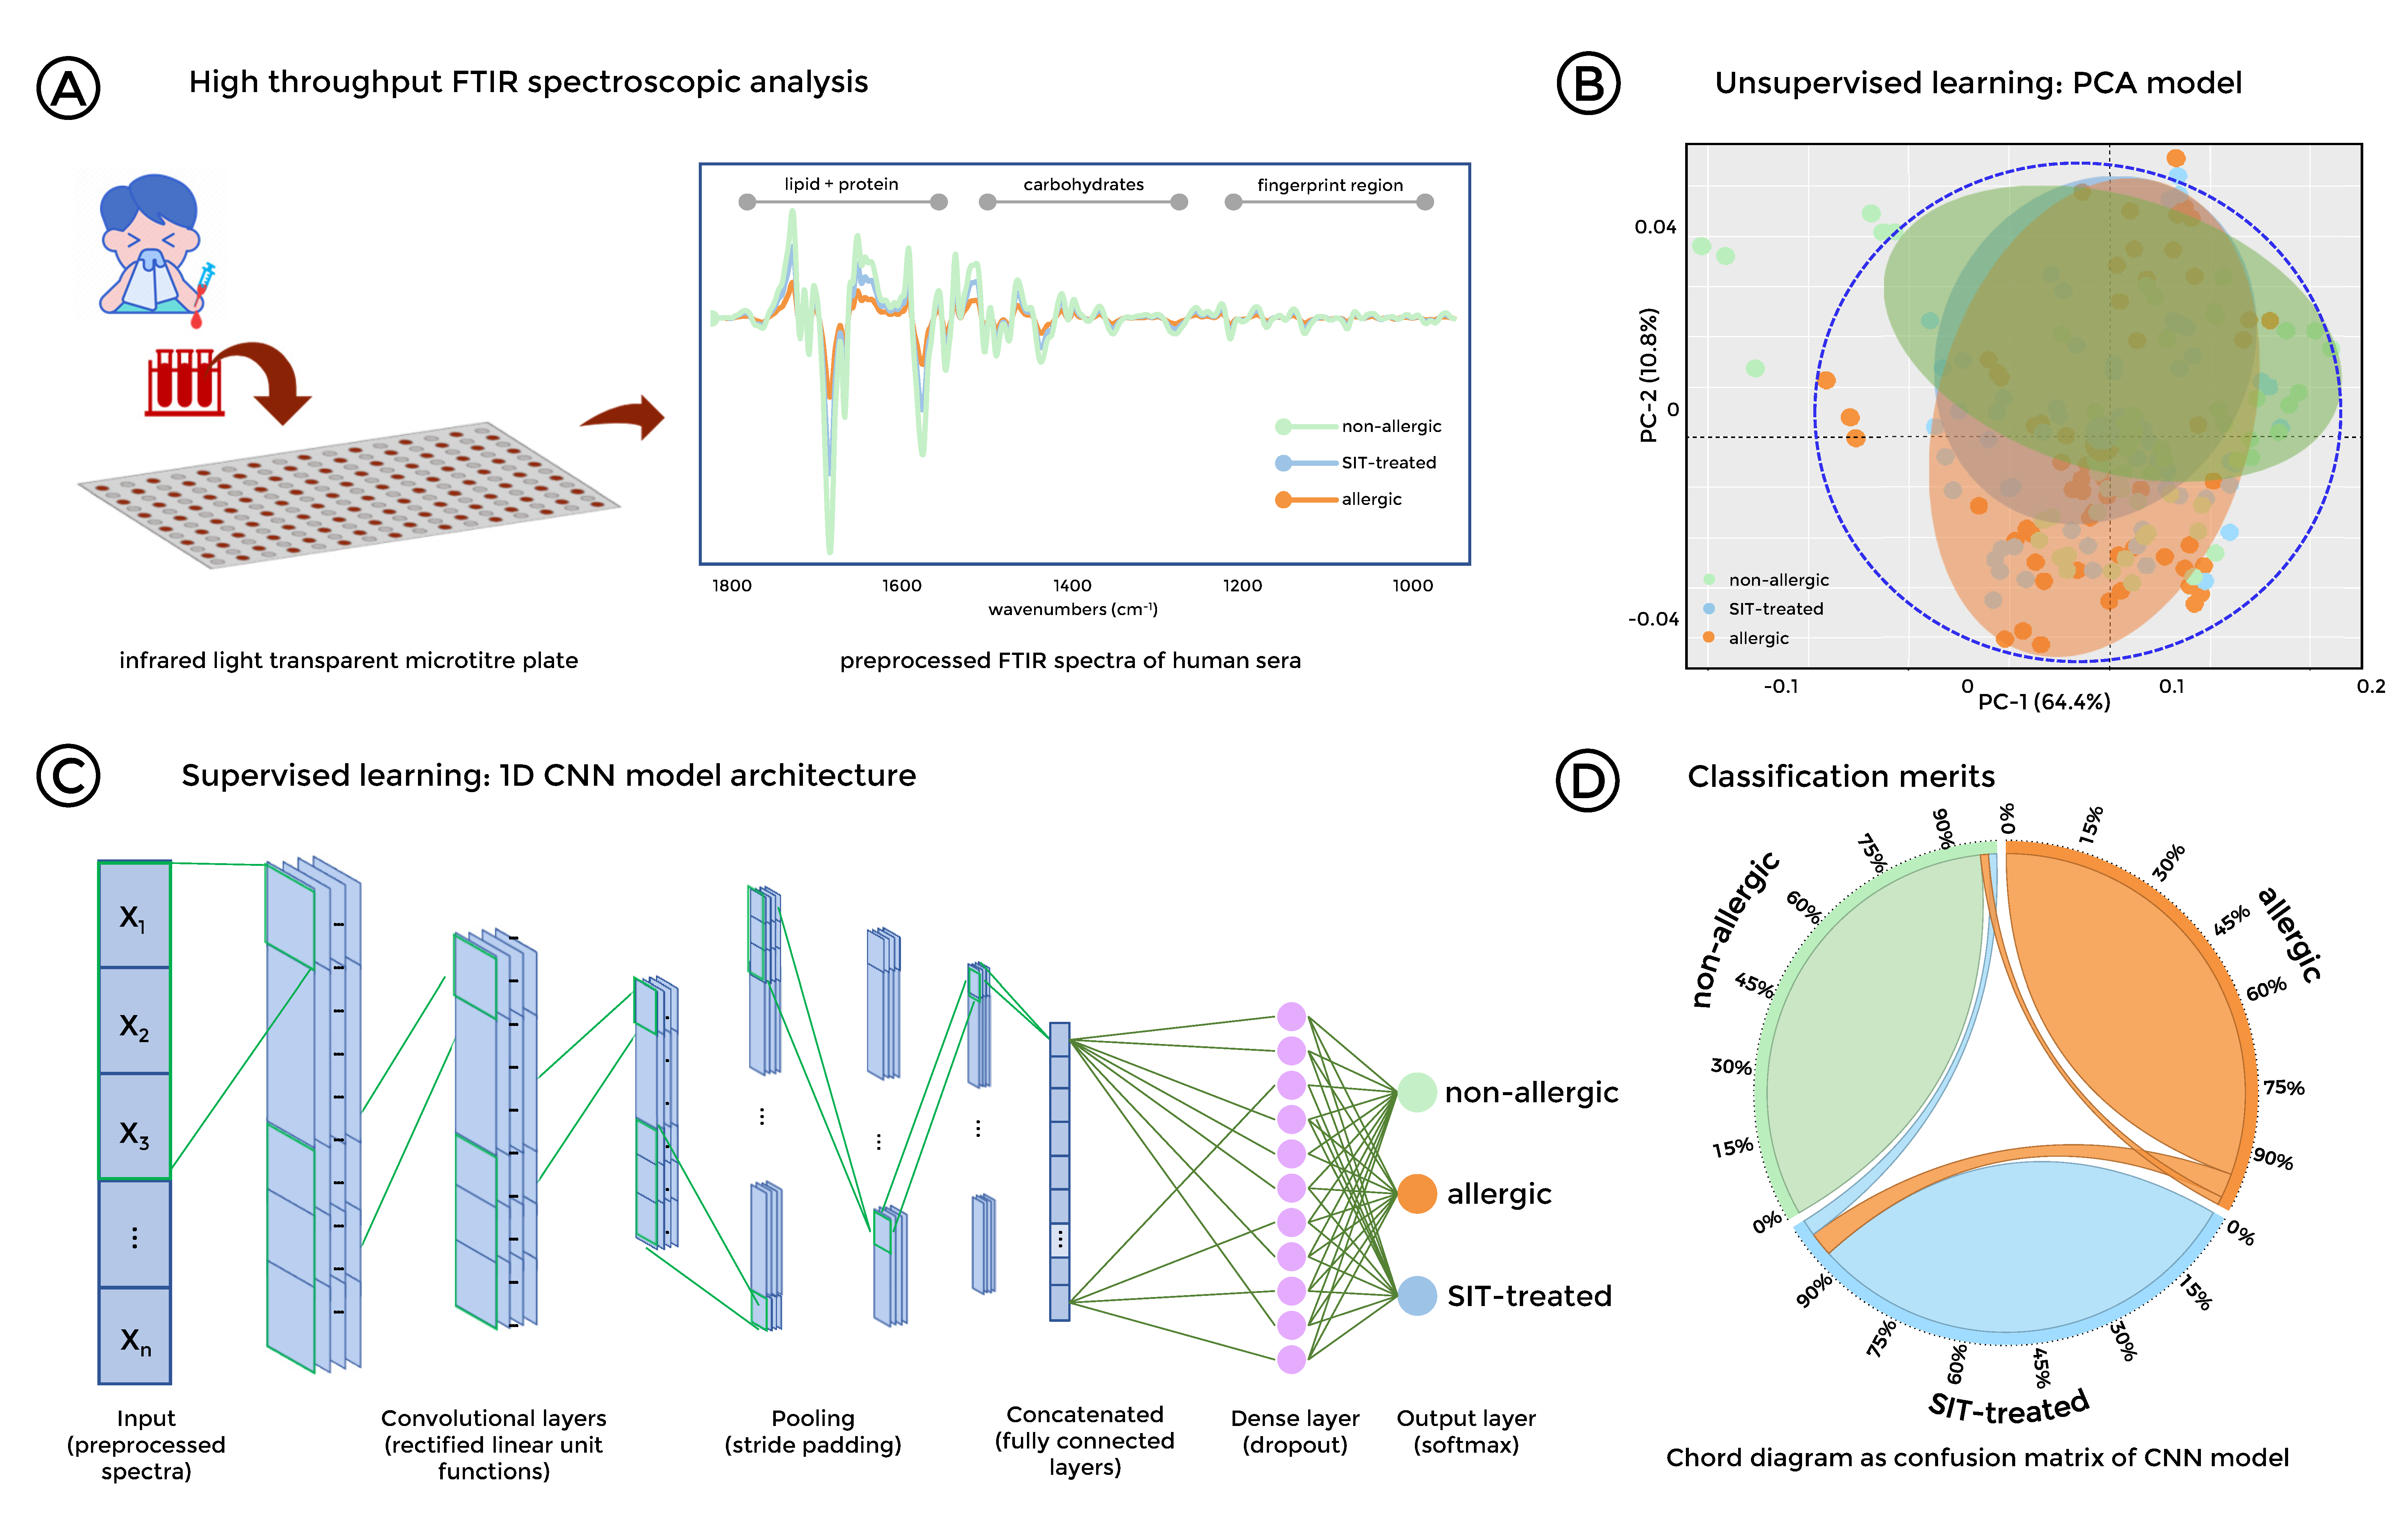
3.4. Stratification of Allergic, SIT-Treated Patients and Healthy Individuals was Enabled by FTIR Spectroscopy Combined with Deep Learning
4. Discussion
5. Conclusions
Supplementary Materials
Author Contributions
Funding
Acknowledgments
Conflicts of Interest
References
- Shamji, M.H.; Durham, S.R. Mechanisms of allergen immunotherapy for inhaled allergens and predictive biomarkers. J. Allzergy Clin. Immunol. 2017, 140, 1485–1498. [Google Scholar] [CrossRef] [Green Version]
- Skrindo, I.; Lupinek, C.; Valenta, R.; Hovland, V.; Pahr, S.; Baar, A.; Carlsen, K.H.; Mowinckel, P.; Wickman, M.; Melen, E.; et al. The use of the MeDALL-chip to assess IgE sensitization: A new diagnostic tool for allergic disease? Pediatric Allergy Immunol. Off. Publ. Eur. Soc. Pediatric Allergy Immunol. 2015, 26, 239–246. [Google Scholar] [CrossRef] [PubMed]
- Maggi, E. T-Cell responses induced by allergen-specific immunotherapy. Clin. Exp. Immunol. 2010, 161, 10–18. [Google Scholar] [CrossRef] [PubMed]
- Kim, S.J.; Shin, J.H.; Kim, S.C.; Park, C.K.; Kim, S.W. Preventive effects of oral tolerance on allergic inflammation and airway remodeling in a murine model. Am. J. Rhinol. Allergy 2013, 27, e11–e16. [Google Scholar] [CrossRef] [PubMed]
- Jung, J.; Kim, S.H.; Lee, H.S.; Choi, G.S.; Jung, Y.S.; Ryu, D.H.; Park, H.S.; Hwang, G.S. Serum metabolomics reveals pathways and biomarkers associated with asthma pathogenesis. Clin. Exp. Allergy J. Br. Soc. Allergy Clin. Immunol. 2013, 43, 425–433. [Google Scholar] [CrossRef] [PubMed]
- Baker, M.J.; Trevisan, J.; Bassan, P.; Bhargava, R.; Butler, H.J.; Dorling, K.M.; Fielden, P.R.; Fogarty, S.W.; Fullwood, N.J.; Heys, K.A.; et al. Using Fourier transform IR spectroscopy to analyze biological materials. Nat. Protoc. 2014, 9, 1771–1791. [Google Scholar] [CrossRef] [Green Version]
- Qamar, W.; Ahamad, S.R.; Ali, R.; Khan, M.R.; Al-Ghadeer, A.R. Metabolomic analysis of lung epithelial secretions in rats: An investigation of bronchoalveolar lavage fluid by GC-MS and FT-IR. Exp. Lung Res. 2014, 40, 460–466. [Google Scholar] [CrossRef]
- Johler, S.; Stephan, R.; Althaus, D.; Ehling-Schulz, M.; Grunert, T. High-Resolution subtyping of Staphylococcus aureus strains by means of Fourier-Transform infrared spectroscopy. Syst. Appl. Microbiol. 2016, 39, 189–194. [Google Scholar] [CrossRef] [Green Version]
- Johler, S.; Kalbhenn, E.M.; Heini, N.; Brodmann, P.; Gautsch, S.; Bagcioglu, M.; Contzen, M.; Stephan, R.; Ehling-Schulz, M. Enterotoxin Production of Bacillus thuringiensis Isolates From Biopesticides, Foods, and Outbreaks. Front. Microbiol. 2018, 9, 1915. [Google Scholar] [CrossRef] [Green Version]
- Lasch, P.; Stammler, M.; Zhang, M.; Baranska, M.; Bosch, A.; Majzner, K. FT-IR Hyperspectral Imaging and Artificial Neural Network Analysis for Identification of Pathogenic Bacteria. Anal. Chem. 2018, 90, 8896–8904. [Google Scholar] [CrossRef]
- Lin, H.; Luo, Y.; Sun, Q.; Deng, K.; Chen, Y.; Wang, Z.; Huang, P. Determination of causes of death via spectrochemical analysis of forensic autopsies-Based pulmonary edema fluid samples with deep learning algorithm. J. Biophotonics 2020, 13, e201960144. [Google Scholar] [CrossRef] [PubMed]
- Bagcioglu, M.; Fricker, M.; Johler, S.; Ehling-Schulz, M. Detection and Identification of Bacillus cereus, Bacillus cytotoxicus, Bacillus thuringiensis, Bacillus mycoides and Bacillus weihenstephanensis via Machine Learning Based FTIR Spectroscopy. Front. Microbiol. 2019, 10, 902. [Google Scholar] [CrossRef] [PubMed]
- Roy, S.; Perez-Guaita, D.; Bowden, S.; Heraud, P.; Wood, B.R. Spectroscopy goes viral: Diagnosis of hepatitis B and C virus infection from human sera using ATR-FTIR spectroscopy. Clin. Spectrosc. 2019, 1, 100001. [Google Scholar] [CrossRef]
- Elmi, F.; Movaghar, A.F.; Elmi, M.M.; Alinezhad, H.; Nikbakhsh, N. Application of FT-IR spectroscopy on breast cancer serum analysis. Spectrochim. Acta. Part A Mol. Biomol. Spectrosc. 2017, 187, 87–91. [Google Scholar] [CrossRef] [PubMed]
- Butler, H.J.; Brennan, P.M.; Cameron, J.M.; Finlayson, D.; Hegarty, M.G.; Jenkinson, M.D.; Palmer, D.S.; Smith, B.R.; Baker, M.J. Development of high-throughput ATR-FTIR technology for rapid triage of brain cancer. Nat. Commun. 2019, 10, 4501. [Google Scholar] [CrossRef] [Green Version]
- Chong, B.T.; Agrawal, D.K.; Romero, F.A.; Townley, R.G. Measurement of bronchoconstriction using whole-Body plethysmograph: Comparison of freely moving versus restrained guinea pigs. J. Pharmacol. Toxicol. Methods 1998, 39, 163–168. [Google Scholar] [CrossRef]
- Lajoie, S.; Lewkowich, I.; Herman, N.S.; Sproles, A.; Pesce, J.T.; Wynn, T.A.; Grusby, M.J.; Hamid, Q.; Wills-Karp, M. IL-21 receptor signalling partially mediates Th2-mediated allergic airway responses. Clin. Exp. Allergy J. Br. Soc. Allergy Clin. Immunol. 2014, 44, 976–985. [Google Scholar] [CrossRef] [Green Version]
- Zaiss, M.M.; Rapin, A.; Lebon, L.; Dubey, L.K.; Mosconi, I.; Sarter, K.; Piersigilli, A.; Menin, L.; Walker, A.W.; Rougemont, J.; et al. The Intestinal Microbiota Contributes to the Ability of Helminths to Modulate Allergic Inflammation. Immunity 2015, 43, 998–1010. [Google Scholar] [CrossRef] [Green Version]
- Repa, A.; Grangette, C.; Daniel, C.; Hochreiter, R.; Hoffmann-Sommergruber, K.; Thalhamer, J.; Kraft, D.; Breiteneder, H.; Mercenier, A.; Wiedermann, U. Mucosal co-application of lactic acid bacteria and allergen induces counter-regulatory immune responses in a murine model of birch pollen allergy. Vaccine 2003, 22, 87–95. [Google Scholar] [CrossRef]
- Garner-Spitzer, E.; Seidl-Friedrich, C.; Zwazl, I.; Hofer, M.; Kinaciyan, T.; Jarisch, R.; Stiasny, K.; Zlabinger, G.J.; Kundi, M.; Wiedermann, U. Allergic patients with and without allergen-Specific immunotherapy mount protective immune responses to tick-Borne encephalitis vaccination in absence of enhanced side effects or propagation of their Th2 bias. Vaccine 2018, 36, 2816–2824. [Google Scholar] [CrossRef]
- Mecklin, C.J.; Mundfrom, D.J. An Appraisal and Bibliography of Tests for Multivariate Normality. Internat. Statist. Rev. 2004, 72, 15. [Google Scholar] [CrossRef]
- Zwicker, C.; Sarate, P.; Drinic, M.; Ambroz, K.; Korb, E.; Smole, U.; Kohler, C.; Wilson, M.S.; Kozakova, H.; Sebo, P.; et al. Prophylactic and therapeutic inhibition of allergic airway inflammation by probiotic Escherichia coli O83. J. Allergy Clin. Immunol. 2018, 142, 1987–1990. [Google Scholar] [CrossRef] [PubMed] [Green Version]
- LeCun, Y.; Bengio, Y.; Hinton, G. Deep learning. Nature 2015, 521, 436–444. [Google Scholar] [CrossRef] [PubMed]
- Asher, M.I.; Montefort, S.; Bjorksten, B.; Lai, C.K.; Strachan, D.P.; Weiland, S.K.; Williams, H.; Group, I.P.T.S. Worldwide time trends in the prevalence of symptoms of asthma, allergic rhinoconjunctivitis, and eczema in childhood: ISAAC Phases One and Three repeat multicountry cross-Sectional surveys. Lancet 2006, 368, 733–743. [Google Scholar] [CrossRef]
- To, T.; Stanojevic, S.; Moores, G.; Gershon, A.S.; Bateman, E.D.; Cruz, A.A.; Boulet, L.P. Global asthma prevalence in adults: Findings from the cross-Sectional world health survey. BMC Public Health 2012, 12, 204. [Google Scholar] [CrossRef] [Green Version]
- Sicherer, S.H.; Sampson, H.A. Food allergy. J. Allergy Clin. Immunol. 2010, 125, S116–S125. [Google Scholar] [CrossRef]
- Kay, A.B. Allergy and allergic diseases. First of two parts. New Engl. J. Med. 2001, 344, 30–37. [Google Scholar] [CrossRef]
- Chelladurai, Y.; Suarez-Cuervo, C.; Erekosima, N.; Kim, J.M.; Ramanathan, M.; Segal, J.B.; Lin, S.Y. Effectiveness of subcutaneous versus sublingual immunotherapy for the treatment of allergic rhinoconjunctivitis and asthma: a systematic review. J. Allergy Clin. Immunol. Pract. 2013, 1, 361–369. [Google Scholar] [CrossRef]
- Bohle, B.; Kinaciyan, T.; Gerstmayr, M.; Radakovics, A.; Jahn-Schmid, B.; Ebner, C. Sublingual immunotherapy induces IL-10-Producing T regulatory cells, allergen-Specific T-Cell tolerance, and immune deviation. J. Allergy Clin. Immunol. 2007, 120, 707–713. [Google Scholar] [CrossRef]
- Holgate, S.T.; Polosa, R. Treatment strategies for allergy and asthma. Nat. Rev. Immunol. 2008, 8, 218–230. [Google Scholar] [CrossRef]
- Nials, A.T.; Uddin, S. Mouse models of allergic asthma: Acute and chronic allergen challenge. Dis. Models Mech. 2008, 1, 213–220. [Google Scholar] [CrossRef] [PubMed] [Green Version]
- Akdis, C.A.; Blaser, K. Role of IL-10 in allergen-specific immunotherapy and normal response to allergens. Microbes Infect. 2001, 3, 891–898. [Google Scholar] [CrossRef]
- Jutel, M.; Akdis, M.; Budak, F.; Aebischer-Casaulta, C.; Wrzyszcz, M.; Blaser, K.; Akdis, C.A. IL-10 and TGF-beta cooperate in the regulatory T cell response to mucosal allergens in normal immunity and specific immunotherapy. Eur. J. Immunol. 2003, 33, 1205–1214. [Google Scholar] [CrossRef]
- Francis, J.N.; Till, S.J.; Durham, S.R. Induction of IL-10+CD4+CD25+ T cells by grass pollen immunotherapy. J. Allergy Clin. Immunol. 2003, 111, 1255–1261. [Google Scholar] [CrossRef] [PubMed]
- Hoflehner, E.; Hufnagl, K.; Schabussova, I.; Jasinska, J.; Hoffmann-Sommergruber, K.; Bohle, B.; Maizels, R.M.; Wiedermann, U. Prevention of birch pollen-Related food allergy by mucosal treatment with multi-allergen-chimers in mice. PLoS ONE 2012, 7, e39409. [Google Scholar] [CrossRef] [PubMed] [Green Version]
- Drinic, M.; Wagner, A.; Sarate, P.; Zwicker, C.; Korb, E.; Loupal, G.; Peschke, R.; Joachim, A.; Wiedermann, U.; Schabussova, I. Toxoplasma gondii tachyzoite-Extract acts as a potent immunomodulator against allergic sensitization and airway inflammation. Sci. Rep. 2017, 7, 15211. [Google Scholar] [CrossRef] [PubMed] [Green Version]
- Daniel, C.; Repa, A.; Wild, C.; Pollak, A.; Pot, B.; Breiteneder, H.; Wiedermann, U.; Mercenier, A. Modulation of allergic immune responses by mucosal application of recombinant lactic acid bacteria producing the major birch pollen allergen Bet v 1. Allergy 2006, 61, 812–819. [Google Scholar] [CrossRef] [PubMed]
- Wagner, A.; Forster-Waldl, E.; Garner-Spitzer, E.; Schabussova, I.; Kundi, M.; Pollak, A.; Scheiner, O.; Joachim, A.; Wiedermann, U. Immunoregulation by Toxoplasma gondii infection prevents allergic immune responses in mice. Int. J. Parasitol. 2009, 39, 465–472. [Google Scholar] [CrossRef]
- Davoine, F.; Lacy, P. Eosinophil cytokines, chemokines, and growth factors: Emerging roles in immunity. Front. Immunol. 2014, 5, 570. [Google Scholar] [CrossRef] [Green Version]
- Lee, Y.C.; Lee, K.H.; Lee, H.B.; Rhee, Y.K. Serum levels of interleukins (IL)-4, IL-5, IL-13, and interferon-gamma in acute asthma. J. Asthma Off. J. Assoc. Care Asthma 2001, 38, 665–671. [Google Scholar] [CrossRef]
- Lloyd, C. Chemokines in allergic lung inflammation. Immunology 2002, 105, 144–154. [Google Scholar] [CrossRef] [PubMed]
- Pease, J.E.; Williams, T.J. Eotaxin and asthma. Curr. Opin. Pharmacol. 2001, 1, 248–253. [Google Scholar] [CrossRef]
- Trompette, A.; Gollwitzer, E.S.; Yadava, K.; Sichelstiel, A.K.; Sprenger, N.; Ngom-Bru, C.; Blanchard, C.; Junt, T.; Nicod, L.P.; Harris, N.L.; et al. Gut microbiota metabolism of dietary fiber influences allergic airway disease and hematopoiesis. Nat. Med. 2014, 20, 159–166. [Google Scholar] [CrossRef] [PubMed]
- Yu, M.; Cui, F.X.; Jia, H.M.; Zhou, C.; Yang, Y.; Zhang, H.W.; Ding, G.; Zou, Z.M. Aberrant purine metabolism in allergic asthma revealed by plasma metabolomics. J. Pharm. Biomed. Anal. 2016, 120, 181–189. [Google Scholar] [CrossRef]
- Reinke, S.N.; Gallart-Ayala, H.; Gomez, C.; Checa, A.; Fauland, A.; Naz, S.; Kamleh, M.A.; Djukanovic, R.; Hinks, T.S.; Wheelock, C.E. Metabolomics analysis identifies different metabotypes of asthma severity. Eur. Respir. J. 2017, 49. [Google Scholar] [CrossRef] [Green Version]
- Gomes-Alves, P.; Imrie, M.; Gray, R.D.; Nogueira, P.; Ciordia, S.; Pacheco, P.; Azevedo, P.; Lopes, C.; de Almeida, A.B.; Guardiano, M.; et al. SELDI-TOF biomarker signatures for cystic fibrosis, asthma and chronic obstructive pulmonary disease. Clin. Biochem. 2010, 43, 168–177. [Google Scholar] [CrossRef]
- Peeters, K.A.; Lamers, R.J.; Penninks, A.H.; Knol, E.F.; Bruijnzeel-Koomen, C.A.; van Nesselrooij, J.H.; Knulst, A.C. A search for biomarkers as diagnostic tools for food allergy: A pilot study in peanut-Allergic patients. Int. Arch. Allergy Immunol. 2011, 155, 23–30. [Google Scholar] [CrossRef]
- Akdis, M.; Blaser, K.; Akdis, C.A. T regulatory cells in allergy: Novel concepts in the pathogenesis, prevention, and treatment of allergic diseases. J. Allergy Clin. Immunol. 2005, 116, 961–968; quiz 969. [Google Scholar] [CrossRef]
- Hufnagl, K.; Winkler, B.; Focke, M.; Valenta, R.; Scheiner, O.; Renz, H.; Wiedermann, U. Intranasal tolerance induction with polypeptides derived from 3 noncross-reactive major aeroallergens prevents allergic polysensitization in mice. J. Allergy Clin. Immunol. 2005, 116, 370–376. [Google Scholar] [CrossRef]
- Fehrenbach, H.; Wagner, C.; Wegmann, M. Airway remodeling in asthma: What really matters. Cell Tissue Res. 2017, 367, 551–569. [Google Scholar] [CrossRef] [Green Version]
- Lloyd, C.M.; Robinson, D.S. Allergen-Induced airway remodelling. Eur. Respir. J. 2007, 29, 1020–1032. [Google Scholar] [CrossRef]
- Shifren, A.; Witt, C.; Christie, C.; Castro, M. Mechanisms of remodeling in asthmatic airways. J. Allergy 2012, 2012, 316049. [Google Scholar] [CrossRef] [Green Version]
- Rael, E.L.; Lockey, R.F. Interleukin-13 signaling and its role in asthma. World Allergy Organ. J. 2011, 4, 54–64. [Google Scholar] [CrossRef] [PubMed] [Green Version]
- Sarate, P.J.; Heinl, S.; Poiret, S.; Drinic, M.; Zwicker, C.; Schabussova, I.; Daniel, C.; Wiedermann, U. E. coli Nissle 1917 is a safe mucosal delivery vector for a birch-Grass pollen chimera to prevent allergic poly-Sensitization. Mucosal Immunol. 2019, 12, 132–144. [Google Scholar] [CrossRef]
- Metzger, W.J.; Richerson, H.B.; Worden, K.; Monick, M.; Hunninghake, G.W. Bronchoalveolar lavage of allergic asthmatic patients following allergen bronchoprovocation. Chest 1986, 89, 477–483. [Google Scholar] [CrossRef] [PubMed]
- Pue, C.A.; Pacht, E.R. Complications of fiberoptic bronchoscopy at a university hospital. Chest 1995, 107, 430–432. [Google Scholar] [CrossRef] [Green Version]
- Leiten, E.O.; Martinsen, E.M.; Bakke, P.S.; Eagan, T.M.; Gronseth, R. Complications and discomfort of bronchoscopy: A systematic review. Eur. Clin. Respir. J. 2016, 3, 33324. [Google Scholar] [CrossRef]
- Cruickshank-Quinn, C.; Powell, R.; Jacobson, S.; Kechris, K.; Bowler, R.P.; Petrache, I.; Reisdorph, N. Metabolomic similarities between bronchoalveolar lavage fluid and plasma in humans and mice. Sci. Rep. 2017, 7, 5108. [Google Scholar] [CrossRef] [PubMed]
- Mariey, L.; Signolle, J.; Amiel, C.; Travert, J. Discrimination, classification, identification of microorganisms using FTIR spectroscopy and chemometrics. Vib. Spectrosc. 2001, 26, 151–159. [Google Scholar] [CrossRef]
- Blat, A.; Wiercigroch, E.; Smeda, M.; Wislocka, A.; Chlopicki, S.; Malek, K. Fourier transform infrared spectroscopic signature of blood plasma in the progression of breast cancer with simultaneous metastasis to lungs. J. Biophotonics 2019, 12, e201900067. [Google Scholar] [CrossRef]
- Gajjar, K.; Trevisan, J.; Owens, G.; Keating, P.J.; Wood, N.J.; Stringfellow, H.F.; Martin-Hirsch, P.L.; Martin, F.L. Fourier-Transform infrared spectroscopy coupled with a classification machine for the analysis of blood plasma or serum: a novel diagnostic approach for ovarian cancer. Anal. 2013, 138, 3917–3926. [Google Scholar] [CrossRef] [PubMed]
- Bunyavanich, S.; Schadt, E.E. Systems biology of asthma and allergic diseases: A multiscale approach. J. Allergy Clin. Immunol. 2015, 135, 31–42. [Google Scholar] [CrossRef] [Green Version]
- Oluwagbemigun, K.; Foerster, J.; Watkins, C.; Fouhy, F.; Stanton, C.; Bergmann, M.M.; Boeing, H.; Nothlings, U. Dietary Patterns Are Associated with Serum Metabolite Patterns and Their Association Is Influenced by Gut Bacteria among Older German Adults. J. Nutr. 2020, 150, 149–158. [Google Scholar] [CrossRef] [PubMed]
- Kang, C.M.; Yun, B.; Kim, M.; Song, M.; Kim, Y.H.; Lee, S.H.; Lee, H.; Lee, S.M. Postoperative serum metabolites of patients on a low carbohydrate ketogenic diet after pancreatectomy for pancreatobiliary cancer: A nontargeted metabolomics pilot study. Sci. Rep. 2019, 9, 16820. [Google Scholar] [CrossRef] [Green Version]
- Schmidt, J.A.; Rinaldi, S.; Ferrari, P.; Carayol, M.; Achaintre, D.; Scalbert, A.; Cross, A.J.; Gunter, M.J.; Fensom, G.K.; Appleby, P.N.; et al. Metabolic profiles of male meat eaters, fish eaters, vegetarians, and vegans from the EPIC-Oxford cohort. Am. J. Clin. Nutr. 2015, 102, 1518–1526. [Google Scholar] [CrossRef] [PubMed] [Green Version]
- Wikoff, W.R.; Anfora, A.T.; Liu, J.; Schultz, P.G.; Lesley, S.A.; Peters, E.C.; Siuzdak, G. Metabolomics analysis reveals large effects of gut microflora on mammalian blood metabolites. Proc. Natl. Acad. Sci. USA 2009, 106, 3698–3703. [Google Scholar] [CrossRef] [Green Version]
- Lambrecht, B.N.; Hammad, H. The immunology of the allergy epidemic and the hygiene hypothesis. Nat. Immunol. 2017, 18, 1076–1083. [Google Scholar] [CrossRef]
- Noverr, M.C.; Huffnagle, G.B. The “microflora hypothesis” of allergic diseases. Clin. Exp. Allergy J. Br. Soc. Allergy Clin. Immunol. 2005, 35, 1511–1520. [Google Scholar] [CrossRef]
- Trangsrud, A.J.; Whitaker, A.L.; Small, R.E. Intranasal corticosteroids for allergic rhinitis. Pharmacotherapy 2002, 22, 1458–1467. [Google Scholar] [CrossRef] [PubMed]
- Barnes, P.J. Molecular mechanisms of corticosteroids in allergic diseases. Allergy 2001, 56, 928–936. [Google Scholar] [CrossRef] [PubMed] [Green Version]
- Kornel, L.; Miyabo, S.; Saito, Z.; Cha, R.W.; Wu, F.T. Corticosteroids in human blood. VIII. Cortisol metabolites in plasma of normotensive subjects and patients with essential hypertension. J. Clin. Endocrinol. Metab. 1975, 40, 949–958. [Google Scholar] [CrossRef] [PubMed]
- Nicolas, J.M. The metabolic profile of second-Generation antihistamines. Allergy 2000, 55 (Suppl. 60), 46–52. [Google Scholar] [CrossRef] [PubMed]


© 2020 by the authors. Licensee MDPI, Basel, Switzerland. This article is an open access article distributed under the terms and conditions of the Creative Commons Attribution (CC BY) license (http://creativecommons.org/licenses/by/4.0/).
Share and Cite
Korb, E.; Bağcıoğlu, M.; Garner-Spitzer, E.; Wiedermann, U.; Ehling-Schulz, M.; Schabussova, I. Machine Learning-Empowered FTIR Spectroscopy Serum Analysis Stratifies Healthy, Allergic, and SIT-Treated Mice and Humans. Biomolecules 2020, 10, 1058. https://doi.org/10.3390/biom10071058
Korb E, Bağcıoğlu M, Garner-Spitzer E, Wiedermann U, Ehling-Schulz M, Schabussova I. Machine Learning-Empowered FTIR Spectroscopy Serum Analysis Stratifies Healthy, Allergic, and SIT-Treated Mice and Humans. Biomolecules. 2020; 10(7):1058. https://doi.org/10.3390/biom10071058
Chicago/Turabian StyleKorb, Elke, Murat Bağcıoğlu, Erika Garner-Spitzer, Ursula Wiedermann, Monika Ehling-Schulz, and Irma Schabussova. 2020. "Machine Learning-Empowered FTIR Spectroscopy Serum Analysis Stratifies Healthy, Allergic, and SIT-Treated Mice and Humans" Biomolecules 10, no. 7: 1058. https://doi.org/10.3390/biom10071058