
The Impact of GRBs on Exoplanetary Habitability


1
Dipartimento di Scienza e Alta Tecnologia, Università degli Studi dell’Insubria, via Valleggio 11, 22100 Como, Italy
2
INAF—Osservatorio Astronomico di Brera, via E. Bianchi 46, 23807 Merate, Italy
3
INFN—Sezione di Milano-Bicocca, Piazza della Scienza 3, 20126 Milano, Italy
*
Author to whom correspondence should be addressed.
†
These authors contributed equally to this work.
Universe 2023, 9(2), 60; https://doi.org/10.3390/universe9020060
Submission received: 14 November 2022
/
Revised: 22 December 2022
/
Accepted: 26 December 2022
/
Published: 17 January 2023
(This article belongs to the Special Issue GRBs Phenomenology, Models and Applications: A Beginner Guide)
Abstract
:Can high-energy transient events affect life on a planet? We provide a review of the works that have tried to answer this question. It is argued that that gamma ray bursts, specifically those of the long class, are among the most dangerous astrophysical sources for biotic life and may exert evolutionary pressure on possible life forms in the universe. Their radiation can be directly lethal for biota or induce extinction by removing most of the protective atmospheric ozone layer on terrestrial planets. Since the rate of long gamma ray bursts is proportional to the birth rate of stars but is reduced in metal rich regions, the evolution of the “safest place” to live in our galaxy depended on the past 12 billion years of evolution of the star formation rate and relative metal pollution of the interstellar medium. Until 6 billion years ago, the outskirts of the galaxy were the safest places to live, despite the relatively low density of terrestrial planets. In the last 5 billion years, regions between 2 and 8 kiloparsecs from the center, featuring a higher density of terrestrial planets, gradually became the best places for safe biotic life growth.
1. Introduction
The search for life in the universe represents the milestone of modern astronomy. If Copernicus displaced humans from the physical center of the universe and Darwin placed them firmly within the natural world, then the eventual discovery of life outside the terrestrial biosphere would represent another great revolution for mankind.
Since the discovery of the first exoplanet orbiting around a main sequence star [1], different observational techniques and the advent of dedicated satellites (e.g., Kepler) [2] have been providing an astonishing and growing number of discovered exoplanets, reaching up to more than 5000 at present1. We are now starting to understand exoplanetary populations and, in particular, the frequency of Earth-like exoplanets in the universe. For example, population studies (e.g., [3,4,5,6]) suggest that each M-dwarf star (0.1–0.8 M⊙), which is the most abundant stellar population in the universe (∼75% [7]), hosts one small (R = 0.5–2.0 R⊕) rocky planet.
Understanding how life can emerge and develop on exoplanets is one of the major challenges. Indeed, there are at least two factors which contribute to creating favorable conditions for the development of life as we know it: (1) the planetary physical and geological properties, such as plate tectonics providing long-term regulation of heat and chemical budgets and generating magnetic fields that protect the planet from atmospheric stripping [8,9,10,11], and (2) the environment on the planetary system scale where the planet was formed. The latter is in part related to the properties of the planetary system to which the planet belongs (e.g., [12]) and in part related to the emission properties (e.g., the irradiance and spectrum) of the host star [13,14].
The planetary properties and the environment can, however, also have another effect. If life can emerge and develop, then there can be catastrophic events related to the planetary system scale which can destroy it. Among these are large-scale volcanic eruptions (e.g., [15,16,17]), dramatic changes in the continent distribution due to plate tecnonics (e.g., [18,19]), a change in the emission properties of the host star or an encounter with debris of the protoplanetary disk [17,20,21,22].
It is well known that in the last 500 Myrs, the history of life on Earth was characterized by five events, called mass extinctions (MEs), corresponding to the disappearance over a short geological era of a large fraction of existing species [23,24,25]. These events are interspersed with other distinguishable minor extinction episodes. Figure 1 (black histogram) shows the number of genera (in units of thousands) over time for the 17,797 well-resolved marine animal genera of Sepkoski’s Compendium of Fossil Marine Animal Genera [26]. The green curve is a third-order polynomial fit obtained by minimizing the variance of the difference between the curve and the data [27]. Purple arrows show the five MEs (≥40% marine genera extinctions) in the last 500 Myr.
The origins of the five MEs are debated. Paleontologists ascribed mass extinctions to climate changes induced by endogenous phenomena such as volcanic eruptions, plate tectonics and glaciation (e.g., see [28]). Starting in 1980, with the proposal by Alvarez et al. [20] of the large asteroid impact event as the cause of the most recent mass extinction marking the end of the Cretaceous (∼66 Myr ago), the extra-terrestrial origin of mass extinction events was considered. The hypothesis was confirmed in 1991 by the discovery [29] of a crater 180 km in diameter in the Yucatan Peninsula, which is now considered the impact site of the asteroid or comet proposed by Alvarez et al. [20]. Although still debated (e.g., [30]), the 1991 discovery confirmed the possibility that astrophysical events can affect the evolution of life on Earth.
In addition to meteoric impacts and possible variations in Earth’s orbit, the other possible astrophysical origin of ME events is related to substantial variations in the irradiance of the planet. The emission properties (spectrum and luminosity) of the host star are the closest source of habitat changes for the planets orbiting around it. Planetary habitability can also be influenced by the radiation produced on the larger scales (from parsecs to kiloparsecs) within the galaxy. Indeed, intense radiation fluxes, when also over relatively short timescales, can produce major changes in the protective layer of the planet atmosphere, thus causing changes and eventually being lethal for the biota. Many works suggested that cosmic rays or high-energy transient events such as supernovae (SNe) and gamma ray bursts (GRBs) may play a crucial role in shaping habitability in the universe [31,32,33,34,35].
The habitability of an exoplanet is therefore the result of at least two competing processes, namely the emergence and growth of life and the lethal events which can destroy a large fraction of its biota. It is possible that the same effect (e.g., the changing of the radiative conditions of the host star) may have a role on both sides of this competition. For example, UV or X-ray radiation may cause atmospheric erosion [36], biomolecule destruction [37] and damage to various species of proteins and lipids [38]. On the other hand, experimental studies (e.g., [39,40,41,42,43,44]) demonstrated that UV light is a crucial ingredient for pre-biotic photochemistry, namely for the synthesis of ribonucleic acid (RNA) (i.e., the building blocks for the emergence of life). Massive life extinction may represent also a step toward the evolution of life on exoplanets. As for our planet, the five MEs which occurred in the last 0.5 billion years have contributed to the development of our planet’s life as it is today. Indeed, as shown in Figure 1, the threats corresponding to the ME events were followed by a rapid rise in the genera number which could exceed the average trend (shown by the green line), thus increasing the biodiversity. This idea has led several biologists [45,46,47,48,49] to consider MEs and the following evolutionary bursts one of the main factors in modeling macroevolution. In this context, the incredible growth in biodiversity that began 250 million years ago is emblematic. It began after extinction, signaling the end of the Permian, which was the most severe of the five MEs.
In this paper, we will concentrate on the life-threatening effects and particularly those originating from distance scales much larger than the planetary system and smaller than the galaxy scale. We will focus on the most powerful transient sources capable of releasing energies up to 10 ergs. In this category, we include long gamma ray bursts but also account for the less energetic short-duration GRBs and for the even less powerful but more frequent supernovae. The first part of the manuscript deals with the effects on a planet’s atmosphere induced by the deposition of a large amount of energy by such events if they happen within a dangerous distance (Section 2 and Section 3). In Section 4, we provide a review of the main results published in the literature on this topic and discuss them while considering their different assumptions and main limitations. In Section 5, we present, in a pedagocical approach, our recent studies [50]. We provide an extended discussion on the possible limitations and draw our conclusions in Section 6 and Section 7, respectively. In Section 8, we review the studies concerning the extension of the concept of habitability to cosmological distance scales.
2. Life-Threatening High-Energy Transients
Powerful astrophysical transient sources of high energy radiation, such as GRBs and SNe, can be life-threatening and potential causes of mass extinction [31,32,33,34,35].
GRBs (e.g., see Kumar & Zhang [51] for a recent review) are made of two subclasses: long events (lasting >2 s) and short-duration events (<2 s). Long and short GRBs are the result of the core collapse of massive stars or the merger of compact object binaries (hosting at least one neutron star), respectively. The formed central object is responsible for the emission of bipolar powerful jets with a typical aperture of a few degrees, which emit in rays by releasing energies erg2 on the second and minute duration timescales. When considering the average properties, short GRBs are slightly less energetic (e.g., Ghirlanda et al. [52]) and less frequent up to a factor of ∼4 than long-duration events [53,54,55,56]. The short-duration emission of X/ rays in GRBs in the energy range from 0.1 keV to 1 MeV are accompanied by emissions extending over the full electromagnetic spectrum (the afterglow), which fade over months and release in the very early stages after the burst approximately 1/1000 of the energy characterizing the ray energy. Supernovae (SNe), also associated with the end stages of stellar evolution, come in two flavors (based on their progenitors): type Ia, which are produced by thermonuclear explosions in binary accreting systems hosting a degenerate star, and types Ib, Ic and II, which are the outcomes of the core collapse of massive ( M) stars.
SNe release a small fraction of energy in X- or rays (one million less than GRBs), but their rate is much higher [57,58]. GRBs are approximately one million times more energetic than SNe, but their rate is 10,000 times lower (Section 5.1). Owing to their stellar origin, the rates of GRBs and SNe are primarily linked to star formation activity within galaxies. The larger the fraction of gas converted into stars, the larger the fraction of binaries (able to produce Type Ia SNe and SGRBs) and the fraction of massive stars (able to produce Type Ibc SNe and GRBs). However, several other factors contribute to the fate of binaries and massive stars eventually producing SNe and GRBs. In particular, the probability that massive enough stars (see Heger et al. [59]) can lead to long GRBs depends on the star’s metallicity. Theoretical studies [60,61] have shown that a low enough metallicity for the progenitor star limits the mass loss, thus allowing for a quickly rotating core at the time of collapse. The formation through a collapse of a quickly spinning black hole seems to favor the launch and powering of the relativistic bipolar jet from the accretion disc-BH system. The requirement of a low metallicity progenitor seems to be confirmed by direct studies of long GRB host galaxies [62,63,64] and most population studies [56]. In addition, for Type Ib,c and IIp SNe, there is a dependence on the progenitor metallicity (see, e.g., [59,65]). The environment metallicity seems to also influence the probability of forming Earth-like planets. Metal-poor environments (e.g., the galactic halo) are unfavorable for forming planets lacking the solid constituents to accrete matter (e.g., [66]). A high-metallicity environment seems to favor the formation of gas giants (e.g., [67]), which hinders the formation of Earth-sized planets by accreting most of the metals in their massive proto-cores [68]. As such, the probability of forming Earth-like rocky planets might be limited to high-metallicity environments [69] and inhibited in too-metal-poor ones. Therefore, the threats posed by GRBs and SNe to the emergence and development of life in the Milky Way (MW) depend on a non-obvious method from the past 12 billion years of evolution of the star formation rate and the relative metal pollution of the interstellar medium (in Section 5.2).
In the next sections, we present the basic ingredients of a model which aims at describing how the habitability of the MW evolved through cosmic epochs. We estimate where and when life on Earth-like planets had the best chances to evolve safe from atmospherically induced effects due to high-energy transient explosions. This is obtained by combining our state-of-the-art knowledge of the properties of the most powerful high-energy transients of stellar origin, namely GRBs and SNe, with a simplified model of the Milky Way which captures the basic ingredients (star formation and metallicity) that influence the probability of occurrence of such high-energy transients.
3. Ozone Depletion and Critical Distance to High-Energy Transients
A typical GRB emitting an isotropic equivalent energy ∼10 erg s can illuminate a planet at one kiloparsec distance with a -ray (i.e., keV–MeV) fluence of ∼100 kJ m. This is able to destroy most of the ozone layer of an Earth-like atmosphere [70] and thus expose the biota to harmful UVB radiation from the parent star (Figure 2). Intense UVB radiation could also be lethal to surface marine life such as phytoplankton, which is fundamental to the food chain and oxygen production. Moreover, the opacity of the NO produced in the stratosphere would reduce the visible sunlight that reaches the surface, causing global cooling. Melott et al. [71] proposed that the late Ordovician ME event (∼445 Myr ago), which is one of the five great mass extinctions on Earth, was triggered by a GRB. Despite this kind of event being very “clean” (i.e., it does not generate radioisotopes with long lifetimes), this hypothesis is supported by some clues. For example, Herrmann & Patzkowsky [72] and Herrmann et al. [73] showed that in order to explain the late Ordovician climatic conditions, a “push” was required, such as an extra-terrestrial agent [35,74,75], which was able to induce the glaciation that occurred in that period. Moreover, for the late Ordovician ME, a decrease in extinction intensity was observed with the increase in water depth [71]. This is in agreement with the scenario where UV radiation played a crucial role in this extinction, strongly damaging the organisms living on the surface of the ocean which were directly exposed to sunlight and unprotected by a thick layer of water. Brenchley et al. [76] showed that the Ordovician extinction of graptolites took place before the Ordovician glaciation and the drop in sea levels. Additionally, this phenomenon is coherent with the GRB scenario, as the immediate effect of a GRB is the depletion of the ozone layer, and as a consequence, larger UVB flux can reach the Earth’s surface, and chemical changes in the atmosphere lead to glaciation. Melott & Thomas [77] showed that the geographical pattern (latitudinal differential extinction rates) of the Orodovician extinction is consistent with the radiation of a GRB primarily illiminating the South Pole.
Thomas et al. [70] estimated, through a 2D atmospheric model, that a ray fluence (i.e., energy per unit area) 100 kJ m (i.e., ∼10 erg cm) can trigger a ∼91% local depletion (∼36% global average) of the ozone layer of an Earth-like atmosphere on a time scale of ∼1 month.
The ozone layer which envelopes the Earth is distributed at altitudes between 30 and 40 km. The minimum wavelength for O photodissociation is 320 nm (corresponding to ∼38 eV). A large fluence of X and rays initiates a series of reactions which leads to ozone depletion. In particular, the photodissociation of N in the stratosphere, which recombines with O atoms, leads to the formation of NO and NO primarly. These NO compounds are catalysts for a series of reactions which deplete O. Most relevant reactions (e.g., [78]) are the following:
- NO+O→ NO+O;
- −
- NO+O → NO+O;
- *
- N+O→ NO+O;
- ·
- N+NO→ N+O.
where the first reaction of the cycle is responsible for O depletion. Indeed, the net effect of the first two reactions of this cycle is O + O = O + O. The last reaction is the limiting one, where the replenishment of N molecules quenches the production of NO (through the third reaction), which is the catalyst to start the cycle. The rate of the last reaction is relatively low compared with the short duration of the high-energy photon source, such as a GRB. As a consequence, the stratospheric concentration of NO increases considerably before being limited by N production.
The effects induced on the atmosphere by the impact of a 100 kJ m burst of rays are shown in Figure 3. The shaded region shows the envelope of the curves obtained by considering different latitudes of impact. On short timescales, the global reduction of the ozone column density is as large as 30–40%. This condition may affect the atmosphere for up to a couple of years. A recovery phase then starts which can bring the situation back to the pre-burst ozone concentration within a decade. Indeed, ozone is progressively replenished at lower altitudes due to the penetration of the Sun’s UV radiation3. The ozone depletion is seasonal and latitude-dependent, owing to the different atmospheric stratification and its circulation. Thomas & Melott [74] showed that a burst (with a fluence of 10 kJ m) impacting the equator would produce a smaller local depletion (28%) than if it impacted at high latitudes >±45 (38%). However, atmospheric circulation would redistribute the effect at all latitudes in the former case (with 16% depletion on a global scale) rather than being localized only in one hemisphere (13% depletion) in the latter scenario. The seasonal effects are mainly due to the Earth’s rotation axis inclination.
The first effect of ozone depletion would be the damage to DNA. Thomas et al. [70] estimated that a 50% reduction of the O layer would already increase the UVB (280–315 nm) radiation flux on the ground by a factor of ∼3 (which would be detrimental to, among other organisms, phytoplankton, thus affecting the food chain base) with respect to the normal value4. The effect of a larger incident fluence is that of dissociating a larger fraction of O despite, in the case of a transient lasting from a few minutes to a few weeks, how the atmospheric circulation may mitigate the effect by reducing the O depletion by a factor of ∼2. Thomas et al. [70] reported the pointwise (−64%, −91% and −98%) and globally (−16%, −36% and −65%) maximum averaged percent change in the fraction of ozone depletion after 1 month from the burst as a function of the fluence reaching the top of the atmosphere (10 J m, 100 J m and 1000 J m, respectively).
Based on these studies, we define astrophysical “lethal events” as those transients capable of delivering a fluence onto a planetary atmosphere [35,70,75]. The fluence value depends on the intrinsic energy output E of the astrophysical transient and on its distance to the planet. Therefore, we can identify the hazard distanced d as the maximum distance within which the fluence experienced by any planet from an astrophysical source emitting E is larger than the critical value :
The shaded regions in Figure 4 represent the hazard distance (right y-axis) as a function of the critical fluence when considering different high-energy transients. The curves were obtained through Equation (1) by assuming the characteristic energy (central solid lines) and a factor 10 variation around this value (shaded regions). The potentially dangerous effects of transients depend on their emitted total energy. GRBs, with a typical energy of , erg can be lethal (i.e., produce more than 90% of O by irradiating with a fluence kJ m out to 1 kpc), while SNe can only produce such effects if located within 1 pc from the planet.
This simple estimate shows that more powerful events can be lethal for a planet over larger distances. However, the other key ingredient is the rate of such events. Indeed, in general, a high event rate can reduce the ability of the planet to recover from the environmental effects induced by radiation even for a moderately energetic output. In the next section, we introduce a concept which is related to the intrinsic properties of the population of high-energy transients considered.
4. Galactic Habitability
Seminal works proposing a possible cause–effect relation between most powerful astrophysical events and Earth’s atmosphere changes considered nearby supernovae [31,80] and stimulated follow-up papers (e.g., [81,82]) refining the initial estimates and considering radiation-induced ozone depletion as one of the major effects threatening planetary habitability. Thorsett [32] extended the cause–effect paradigm by including GRBs (just few years before the afterglow discovery by van Paradijs et al. [83] and Costa et al. [84]). A typical GRB releasing erg which was located at ≤1 kpc would illuminate Earth’s atmosphere with erg cm, corresponding to ≈30 times the chemical energy of the ozone layer (∼300 megatons of trinitrotoluene (TNT) [85]). While most of this radiation would not harmfully penetrate the thick atmosphere of Earth ([86], but see also [87]), it would rather reduce the ozone layer and, as a consequence, induce an increase in the Sun’s UVB radiation flux reaching the ground (e.g., [70,74]).
GRB-induced effects, coupled with the order of magnitude estimates of the burst’s rate, led to proposing that they may have had a major role in the mass extinction event ending the Ordovician era on Earth [71] ∼450 Myr ago (see Figure 2). Attempts to model the impact of high-energy ionizing radiation on Earth’s atmosphere ([34,70,71,78,87,88], and see [74] for a review) highlighted how different properties of the target (i.e., the planet), such as its air mass circulation and axis inclination, have a major role in global ozone depletion and its consequences on the biota (see also Figure 3). Among the most notable source properties, the high variability and short duration of GRB emissions (compared with SNe) seem to be less important than the spectral hardness of the emitted radiation, owing to the higher penetration depth of higher-energy photons [78].
The natural extensions of these works were aimed at studying the galaxy as a whole, thus constraining the regions and cosmic epochs where life may have been less subject to threatening astrophysical high-energy transients. Piran & Jimenez [35] combined the rate and luminosity function of long GRBs (which are most lethal to life, owing to the larger released power) to estimate the probability within the MW of having at least one lethal GRB (with a fluence >100 J m) in the last 0.5–5 Gyrs. They concluded that the inner regions of the galaxy, at distances <2 kpc from the center, are mostly dominated by life-threatening GRBs, owing to the larger stellar density5. The outskirts of the galaxy, at distances kpc, should rather be the safest places, with a relatively small probability of having powerful, long GRBs over the past 5 Gyrs. Extension to larger distances excludes that extragalctic GRBs from galaxies in the local group (even those with large star formation rates such as the Large Magellanic Cloud) may be dangerous to life in the MW. Therefore, the outskirts of large galaxies in low galaxy density groups seem to be the best place for preserving life according to Piran & Jimenez [35]. With some refinement to the GRB rate estimate based on the metal aversion, Li & Zhang [75] reached similar conclusions for the MW. In particular, Li & Zhang [75] identified a region <8 kpc from the galactic center which may have experienced ∼1 lethal, long GRB in the last 500 Myr.
Clearly, the assessment of the “sustainability” of life is subject to uncertainties which include several processes leading to its rise, evolution, and possible extinction on planets (see, e.g., [89] for a review). The Galactic Habitable Zone (GHZ6) definition is further complicated by small-scale conditions. Habitable environments are customarily defined by considering the surface biota and, for example, ignoring the possible resilience of submarine species. In an assumption with an Earth-like basis, most studies trying to define the habitable zones within the Milky Way should also consider, in addition to the threatening effects of powerful transients (such as GRBs and SNe), the conditions favoring the formation of terrestrial planets [66] and the properties of the host star. By considering these combined effects (though only SNe as threatening events), Lineweaver et al. [68] studied the combined probability of having terrestrial planets and life-threatening SNe and concluded that the GHZ should lie, at present, between 7 and 9 kpc from the galactic center (however, see [90]). The inner boundary is set by too large of a frequency of lethal SNe coupled with too large of a metallicity (favoring the presence of gas giants rather than Earth-like planets). Interestingly, the innermost galactic regions are made hostile by too large of a frequency for SNe in the early epochs (up to ∼6 Gyrs ago), and it has been mainly limited in the last ∼6 Gyrs by the increased metallicity. The outer boundary of the GHZ defined by Lineweaver et al. [68] is primarily determined by a metallicity that is too low for (any size of) planet formation. A similar conclusion was proposed by Spitoni et al. [91,92], where detailed models for the chemical evolution of the MW were considered in deriving terrestrial planet formation and SNe events were the limiting factor to life development on such planets. With a more sophisticated approach, Gowanlock et al. [93] simulated the MW galaxy (following the model of Naab & Ostriker [94], which evolves the star formation and metallicity of the MW) and the galactic stellar population by assigning planets to each star (determined by the metallicity) and the probability of ending as SNe7. Morrison & Gowanlock [95] extended this study to also account for the probability of life development in the time windows between sterilizing SNe events. The main outcome from these studies was that the inner regions of the galaxy have the largest density of habitable planets, and even when accounting for the larger sterilizing SN rates, there are more chances for life development and resilience in the inner galaxy than in the outskirts. These works show that the evolution of the galaxy, and in particular its two main features of the star formation rate and the metallicity, are the drivers to define where an when the MW is better suited to host life. Among the several simplifying assumptions, it is often assumed that the MW is an azimuthally symmetric disk. More detailed 3D galactic modeling of the MW, including the effects of its build up by interactions within the local group [96], seems to point toward a present-day GHZ comprised at 2–13 kpc, while the N-body simulations of a Milky Way galactic prototype [97] seem to favor the outskirts.
Table 1 summarizes the main papers defining the GHZ which appeared in the literature in the last 18 years. The main assumptions are compared in the columns. The chronological order shows a progressive tendency to refine the studies with an increasing number of effects considered. There is a large dispersion of the main conclusions as far as the GHZ is concerned. In general, works favoring the outskirts of the galaxy either did not consider the lower probability of having habitable Earth-like planets [35,75] or did not consider the dominating lethal effects of GRBs [93,95,97]. Only Piran & Jimenez [35], Li & Zhang [75] considered GRBs to be threatening events given their larger emitted energy, which compensates for their lower rates (compared with, e.g., SNe). GRBs may be one of the key elements accounting for the different conclusions of other studies with respect to these two. However, the importance of the chemical evolution of the galaxy in determining the formation of Earth-like planets has been clearly highlighted in all other works (e.g., [91,93]). Moreover, both theoretical and observational studies [56,60,61,62,63,64] have suggested that the long GRB rate is biased (favored) by low-metallicity progenitors. By putting together all the ingredients, namely (1) GRBs and SNe as lethal events (and accounting for their dependence on the metallicity and star formation within the galaxy), (2) the probability of forming terrestrial planets (and its dependence on the metallicity), and (3) accouting for the spatial and temporal (R,t) evolution of the star formation and metallicity in the MW, Spinelli et al. [50] derived the GHZ as detailed in the following sections.
5. Lethal Transient Rate
For our purpose of defining the GHZ and its evolution over cosmic time, first, we need to define the rate of lethal events and how it changes over time within the galaxy. As outlined in Section 3, the lethal effects of the biosphere induced by high-energy transients depends on the energy they release which, combined with the distance to the planet, define the hazard distance (see Section 3). A useful function for describing the demographic evolution of a generic population of astrophysical sources is (i.e., the event rate per comoving volume as a function of cosmic time (or redshift z) per unit luminosity L). This is usually refereed to as the source “luminosity function”.
Long and short GRBs have thus far been detected only in relatively distant galaxies. As of today, the closest short GRB 170817 [98,99] at ∼43 Mpc, associated with the first gravitational wave event produced by the merger of neutron stars in a binary system, competes with the closest long GRB 980425 at a similar distance, associated with a broad line supernova event [100]. Instead, SNe are well-detected within the galaxy. This difference is mainly determined by the quite different event rates being a factor ∼ larger for SNe with respect to GRBs. The event rates of both GRBs and SNe are inferred from available observations and are often subject, mostly in the case of GRBs, to extrapolations to the local cosmic unit volume (Gpc in size), where the few events detected make the estimates quite uncertain. Therefore, we can rescale the local rate of GRBs and SNe to the cosmological volume occupied by our galaxy: , where is the (redshift-dependent8) mass in the stars of the galaxy and is the (comoving) mass density of the stars in the universe. We assume Gpc, following [75,101]. represents the event rate in the MW of a given source class per unit of luminosity.
We are interested in assessing, along the cosmic history of the MW, the rate of lethal events for a planet located at a galactocentric distance R (i.e., the rate of transients occurring within a distance d from R). To this aim, we compute the portion of the galaxy which is potentially dangerous (i.e., the fraction of the MW disk within a distance d from R, ), and then estimate the rate of events occurring there. Assuming that GRBs and SNe do follow the stellar distribution within the MW, can be readily calculated by integrating the MW stellar surface density within a distance d from the planet’s position. Since the rate of a specific type of transient may depend on the time-dependent properties of the local interstellar medium (i.e., star formation rate and metallicity), we introduce two dimensionless factors, and , describing the local conditions normalized to cosmological values (see the next sections for details). is the area in danger around the position R for an event with a luminosity L. The energy or luminosity of a given transient event determines (see Section 3) the outward distance d to which it can be lethal (according to the fluence limit criterion we defined in Section 3). The number of lethal events per unit of cosmic time (or redshift z) for a planet at a distance R from the galactic center is
where the integral is performed over the entire luminosity distribution, and we have expressed the dependence of the lethal distance d on the event luminosity L. In the next sections, we discuss the various terms in Equation (2).
5.1. High-Energy Transient Events
It is customary to factorize , where describes the luminosity distribution of the event rate at while the dimensionless function is its redshift evolution9. The luminosity distribution of long and short GRBs is described well by a broken power law [53,55,102,103,104,105] defined between a minimum and maximum luminosity and , respectively:
where is the present day () rate of events with . GRBs have narrowly collimated (opening angle of a few degrees; see Frail et al. [106]) jets [107]. As a consequence, lethal bursts are those whose jets are pointed at the planet. is the local rate of such events (i.e., representing only a fraction ∼ of the full population). L represents the isotropic equivalent luminosity, computed assuming that the observed energy is emitted over the full solid angle and thus a factor ∼ larger than what is realistically emitted within the jet.
We adopted the parameters derived in Wanderman & Piran [53] and Ghirlanda et al. [55] for long and short GRBs, respectively (Table 2). Note that since the event lethality depends upon the fluence rather than the flux (Section 2), we needed to assign a characteristic duration to the transients. Long and short GRBs have distributions of duration centered around 20 s and 1 s, respectively [108]. Adopting a toy model for the lightcurve shape, we assigned to a GRB of a luminosity L an energy output .
For SNe, we considered the rate at of Maoz & Mannucci [57] and Li et al. [58]. The distribution of the energy output of SNe could be described by a Gaussian function [109,110,111,112,113], whose parameters are reported in Table 3. We distinguished among SNe Ia, Ibc, and IIp.
Long GRBs and SN Ibc and IIp are linked to the fates of massive stars e.g., [117]. It is then conceivable to assume that the rate of such sources evolves over time as the cosmic star formation rate (SFR; see, e.g., Madau & Dickinson [118] and Hopkins & Beacom [119]). However, different from SN Ibc and IIp, it is believed that the progenitors of LGRBs must possess a low metallicity. This argument qualitatively agrees with the observed preference of long GRBs to occur in relatively low-metallicity host galaxies (e.g., [64]) and would also explain the steeper increase in the rate of long GRBs compared with the cosmic SFR in the redshift range [102,120,121,122,123,124]. Population studies suggest that such a metallicity bias occurs for long GRBs below a threshold in the range 0.3–0.6 [125,126]. We then assumed an intermediate threshold value 0.4 for the occurrence of long GRBs [124,127]. The redshift evolution of the rate can then be expressed as follows:
where
is the cosmic star formation rate history from Madau & Dickinson [118] and represents the (redshift-dependent) fraction of stars with a metallicity in the universe. The factorization of Equation (5) produces an increase with the redshift of the GRB cosmic rate (e.g., normalized to the cosmic star formation), owing to the decrease in the universe’s metallicity. The GRB rate peaks at relatively larger redshifts () than the cosmic star formation rate. This is what has been found by different studies on the population of long GRBs (e.g., [56]).
Short GRBs are produced by the merger of compact objects, as was recently proven by the association of the gravitational wave event GW170817 with the short event GRB170817 [98,99]. It is expected that the redshift distribution of short GRBs does not directly follow the cosmic SFR because of the delay between the epoch of the binary formation and that of the merger [104,128]. Ghirlanda et al. [55] derived the formation rate of short GRBs from available observational constraints and found that, indeed, it is consistent with a delayed cosmic SFR history. Here, we adopt the parametric function given in [55]:
Finally, for SNIa, which also had binary progenitors, we assumed the redshift distribution derived by Maoz & Mannucci [57], corresponding to the convolution of the star formation history of Madau & Dickinson [118] with a distribution of time delays . Such a time delay distribution provided an excellent fit with the observed SN rates and supported the hypothesis of a double-degenerate progenitor origin (i.e., a merger of two WDs) for SNe Ia [129]. As a result of the delays, the cosmic rates of short GRBs and SNe Ia peaked at a lower redshift (∼1.5–2) compared with the cosmic SFR history (∼2.5).
5.2. Galactic Model and Environmental Factors
The rates of transients we discussed in the previous section are “cosmological” by nature. Therefore, we needed to adapt them to the specific case of the MW. To this aim, we adopted the simple inside-out formation model for the MW proposed in [130], which is able to reproduce several key properties of the present time galaxy (Table 4). In brief, it was assumed that the formation and evolution of the MW proceeded in two distinct phases. During the first phase (for cosmic time <2.5 Gyrs), the galaxy was coupled to the hierarchical growth of the large-scale structure, and a bulge was formed. After that, the dark matter (DM) halo evolved in isolation, and the disk formed. The gas surface densities of the bulge and disk initially had exponential profiles. After bulge and disk formation, stars started to form following the standard Kennicutt law [131] with a star formation efficiency of .
In order to compute the time-evolving surface stellar density and metallicity radial distributions, Naab & Ostriker [130] adopted a simple model for the chemical enrichment of the galaxy [132] which assumes an instantaneous metal injection in the ISM from massive stars and a delayed injection from low-mass stars, neglecting large-scale radial flows of gas altogether (see Naab & Ostriker [94] for details). Figure 5 (left) shows the star formation surface density rate as a function of the position within the galaxy (i.e., the galactocentric radius R) versus the lookback time. The density contours clearly show the increase in the star formation rate from the inner part of the galaxy toward the peripheral regions (inside-out star formation), and while the innermost part of the galaxy shows little if not null evolution of the star formation over time, the outskirts experienced an increase of several orders of magnitude. Figure 5 (right) shows instead the evolution over time of the radial profile of the gas metallicity (in logarithmic scale (left colored bar)). Consistent with the increase in star formation in the outskirts, the metallicity at larger distances from the galaxy’s center also increased over the last Gyrs.
In order to account for the preference of long GRBs and core collapse SNe (Ib, Ic, or IIp and CCSNe) occurring in regions characterized by high star formation rates, we define (similar to Li & Zhang [75]) the specific SFR correction factor in Equation (2) as follows:
Here, is the (redshift-dependent) specific star formation rate within the MW (as a function of the location R), while is its cosmological analogue at the very same epoch. The local star formation rate is estimated through the MW model presented above [94,130], while . Note that, as expected, when we combined Equation (7) with Equation (4), the term was canceled out (i.e., the global cosmological evolution of the star formation rate was irrelevant when we considered a specific galaxy), and only the present day value was entered as a normalization factor.
In order to account for the preference of long GRBs to occur in low-metallicity environments, we define the metallicity correction factor in Equation (2) as follows:
where, analogous to Equation (7), the upper term specifically refers to the MW, while the lower term is its cosmological analogue. Note again that when combining Equations (2) and (8), the term cancels out, and only the cosmological value at is relevant. We estimated under the assumption that the metallicity in the local universe had a Gaussian distribution with a mean = −0.006 and dispersion equal to 0.22 [118,133]. The definition given by Equation (8) is similar to that of Li & Zhang [75], but here, we considered the metallicity profile and its time evolution within the MW. While long GRBs (rapidly rotating massive stars) prefer high star formation, low-metallicity environments, there is no such evidence for short GRBs. Therefore, we assumed and . The same holds for SNIa. Finally, for CCSNe, we assumed and . This latter assumption was due to the fact that the properties of SNe with progenitors are independent upon their metal content [59].
Figure 6 shows the individual contribution of LGRB (left) and SGRBs+SNe (right). Short GRBs and SNe were concentrated in the central regions of the galaxy due to the large star formation and stellar density, and their occurrence was independent of the metallicity of the environment. On the other hand, the incidence of long GRBs as lethal events developed along the MW’s history with an inside–out pattern. They dominated the rate of lethal events in the early stages of the MW’s evolution in the central regions where most of the stars were formed, but they were progressively suppressed due to the increase in the metallicity and became more prominent toward the outskirts, where the star formation was relatively higher and the metal pollution was not yet dramatic.
5.3. Terrestrial Planet Formation
A planet is typically defined as “terrestrial” (terrestrial planets (TPs)) when it has a solid surface and its radius and mass lie in the ranges of 0.5–2.0 and 0.5–10 , respectively (where and are the Earth’s radius and mass, respectively). TPs could potentially develop habitable conditions [134]. In order to estimate the surface number density of TPs within the MW as a function of the cosmic time and galactocentric distance, we adoptrf the model of Zackrisson et al. [69]. As simulations and observations (radial velocity and transit survey) suggest, close-orbit giants (Hot Jupyters (HJs)) form in metal-enriched environments, while in very low-metallicity environments, planet formation is inhibited. The model, based on the assumption that HJs inhibit the formation of TPs, gives the probabilities of forming TPs () and HJs () as a function of the local gas metallicity. We then followed Lineweaver et al. [68] and assigned the probability of forming HJs as a function of the metallicity (Fe/H) and the stellar mass [135] as follows:
where is a constant pre-factor (0.08) and the parameter values suggested are a = 1.8 (1.06) for FGK (M dwarf) stars and b = 1 [135]. The probability of forming terrestrial planets is [69]
with 0.4 (1) for FGK (M dwarf) stars, while k(Z) is a function with a cut-off at low metallicity values [69]:
By combining these equations with the galaxy model of Naab & Ostriker [130], we could compute the probability of habitable terrestrial planets , by accounting for the metallicity radial distribution and its cosmic evolution within the galaxy at the same time. The surface number density of TPs as a function of time across the MW was computed using the star formation surface density derived in the previous section. Assuming a Salpeter initial mass function, we estimated the fraction of M dwarfs (with masses in the range 0.1–0.6 ) and FGK stars (with masses in the range 0.6–1.2 ). Then, by adopting an average mass for M dwarfs of and for FGK stars, we finally estimated the surface number density of TPs:
where is the formation redshift of the MW in the model of Naab & Ostriker [130].
6. Milky Way Habitability
In the local universe, the long GRBs had an observed rate (i.e., not collimation-corrected) of Gpc yr, while the short GRBs were slightly rarer (i.e., ∼0.3 Gpc yr) [53,55]. These rates corresponded to the GRBs we could see because their narrow jet points toward the Earth. The long and short GRBs owned similar luminosities distributed in the range – erg s, while their energetics differed by a factor comparable to their typical durations (e.g., Ghirlanda et al. [52], Table 2). All three classes of SNe—Ia (produced in binaries) Ib,c, or IIp (from a single massive star progenitor)—had similar rates of 2–3 Gpc yr[57,58] (Table 3) and much lower energies (10 erg) compared with the GRBs [114,115,116]. The energetics and the rate are key features for evaluating the lethal effects of the different subclasses of transients, where more energetic events, such as long GRBs, can irradiate with a fluence >100 kJ m (i.e., enough to destroy more than 90% of the ozone layer on a terrestrial planet [70]) a larger portion of their host galaxy. More frequent albeit dimmer events such as SNe can repeatedly prevent the growth of life on smaller distance scales though.
We modeled the lethal effect of GRBs and SNe by scaling their cosmic rates to the MW (see Section 5.1 and Section 5.2 GRBs and all SNe rates proportional to the gas-to-stars conversion rate within galaxies). In the galaxy, the conversion of gas into stars increased over the past 12 billion years from the center toward the outskirts. The metallicity of newly born stars followed a similar inside-out evolution (Figure 5) [94,130].
In the early stages of the MW evolution (from its formation up to 6 billion years ago), the largest portion of the galaxy out to 10 kpc from the center was unsuitable for life growth due to the high frequency of lethal events (i.e., more than 30 every 500 million years). These were short GRBs and, to a lower extent, SNe in the inner regions within kpc from the center and long GRBs out to 10 kpc. Although the MW outskirts appear to be a safer place to live (green contours in Figure 7), the low density (<0.1 pc) of the terrestrial planets around stars of the spectral types FGK and M (dashed and solid blue contours in Figure 7, respectively) makes life emergence comparatively unlikely.
Starting around 6–7 Gyrs ago, owing to their energetics, long GRBs became the dominant lethal sources for life within the MW, with an increasing number of lethal events toward the galaxy’s periphery (red-to-orange contours in Figure 7). This was due to the increased conversion rate of relatively less metal-polluted gas into massive stars in the outer regions of the MW. Such a global trend determined the formation of an increasingly larger and safer region of the MW centered around 2.5–3 kpc (green contours in Figure 7), where biological complexes could possibly develop on the large population of terrestrial planets present there. The role of GRBs and SNe in the evolution of life within the last 500 Myrs in our galaxy is shown in Figure 8.
Up to 2.5 kpc from the center, the inhabitability of the MW was due to the high rate of short GRBs (and to a lesser extent SNe). Long GRBs made the outskirts of the galaxy similarly unsafe, leaving a region between 2 and 8 kpc as the best place where biological systems had time to develop. We estimated ∼1 long GRB occurred in the last half billion years within a few tens of kpc from the Sun, an event possibly associated with the late Ordovician mass extinction. A search for exoplanets harboring lifeforms sheltered from high-energy transient events should have more chances of success when looking in the direction of the Galactic center within kpc from the Sun due to the combined effect of a higher density of terrestrial planets (dashed lines in Figure 8) and the lower occurrence of lethal transients (solid red line in Figure 8).
7. Discussion
By considering the event rate and energetics of the most powerful transient events, we estimated the regions and epochs where and when exoplanets in the MW were likely spared from massive extinctions. To this aim, we combined several ingredients and information belonging to different fields of research in astrophysics. In this section, we summarize the main assumptions we made and the results of our approach.
One key parameter we used was the critical fluence, defined as the energy incident on the planet. We adopted a typical value of 100 kJ m [35,70,75], which was able to induce more than 90% ozone depletion in the stratosphere of the planet. Direct incidence of rays (e.g., in the case of a plane without the protecting ozone layer) would cause major damage to eucaryots (for critial fluence >10 erg cm [86]) and prokaryots (>10 erg cm [136]). Such threshold fluence values, however, would be relatively inefficient in removing the bulk of the ozone protection of a planet with an atmosphere. Therefore, our assumption of 100 kJ m also included lethal effects by transients on planets without atmospheres. The interaction of rays with the atmosphere would also produce a UV flash at the planet’s surface, which can be lethal (DNA damages) for several biota. A 100 kJ m fluence incident on the outer atmosphere would induce a considerable reduction in phytoplankton on the planet’s surface [137], a harmful result for the food chain. Accounting for this additional effect might allow for a slightly smaller fluence threshold which produces similar results in terms of event rates. Overall, it should be noted that a different assumption for the fluence threshold or the inclusion of other secondary effects produced by the incidence of rays would only change the rate of lethal events, while the pattern that we derived for the GHZ would remain the same. A similar consideration would hold if a different luminosity function for short or long GRBs was assumed. In particular, while for long GRBs there seems to be a general consensus on the shape and characteristic values of the luminosity function [56,102,103], for short GRBs, Wanderman & Piran [53] argued in favor of a steeper (than what we assumed from [55]) faint end of the luminosity function of short GRBs. If we modified this assumption, then we would derive a slightly larger rate of short GRBs, but given their relatively small harmful distance and the predominance of the effects induced by long GRBs, our conclusions would be unaltered.
A different choice for the metallicity threshold, which affects both the long GRB rate and, to a lesser extent, the rocky planet formation probability in our model, could modify the pattern of the GHZ. For a (0.5), we obtained an increase (reduction) in the lethal LGRB number at R = 8 kpc by 25% (20%) with respect to the value obtained with . In the MW outskirts, on the contrary, there would be a reduction (increase) of approximately 45% (40%). Recently, population studies of LGRBs [56] have found that a metallicity threshold of 0.3 should be more appropriate to describe the GRB cosmic formation rate consistently with the host metallicity measurements.
The metallicity also affects the probability of forming terrestrial planets. We accounted for the presence and spatial density of terrestrial planets across the galaxy by adopting the model of Zackrisson et al. [69], where terrestrial planets preferentially form in intermediate metallicity environments. Metallicities that were too large tended to form gas giants and hot Jupiters, which limited the formation of TPs. However, counterexamples of planetary system hosting do exist (e.g., see [138,139]).
The simplified model of the galaxy we considered is axisymmetric with a uniform disk. We neglected the possible presence of a central bar which would enhance the inhospitality of the central region. In addition to this, the central massive black hole activity (through, e.g., tidal distruption events (TDEs) [140] or their natural activity [136]) might also contribute to reducing the habitability of the bulge. On the contrary, the presence of a thick disk, which was not accounted for in our model, would mainly contribute low-mass stars, which should not substantially increase high-energy transients such as GRBs and SNe.
The motion of the Sun through the galaxy and terrestrial mass extinctions or climate change have been linked in a number of studies during the past 30 years (see [141] for a review). The Sun’s transit through the spiral arms and the galactic plane are some of the mechanisms that have been proposed. These arguments are frequently cited to support the alleged (and debated) periodicity in the fossil record and impact cratering dates in the past 500 Myrs. Another hypothesis used to explain the claimed 26 Myr periodicity in the extinction rate [142] is that the Sun is a star in a binary system, with an M dwarf companion (named Nemesis) in a wide orbit (Davis 1984 [143]). The effect of this companion is to perturb the Oort cloud during the perihelion passages, with a consequence of an ejection of several comets toward the Earth. However, through a rigorous examination of time series analysis and hypothesis testing, Bailer-Jones [141] concluded that there is little evidence of intrinsic periodicity in the extinction rate, impact cratering, or climate changes from the last 500 Myrs. This work suggests that the transit in the galactic mid-plane and spiral arms does not have a large impact on biodiversity, while the contingency of more non-periodic mechanisms (astrophysical and terrestrial) is, most likely, the cause of mass extinctions. The non-periodic pattern of transient lethal astrophysical events such as GRBs and SNe is consistent with this conclusion.
8. Cosmic Habitability
The study of the habitability within our galaxy can be extended to any galaxy at any cosmic time. Li & Zhang [75] applied their galactic recipe to the galaxies in the Sloan Digital Sky Survey (at different redshifts). They evaluated the habitability of each galaxy by calculating the number of lethal events at its half-mass radius (N). They argued that at high redshifts, the number of lethal events at the half-mass radius generally increases, owing to the increase in star formation and the decrease in metallicity, altough at z = 1.5 (3), ∼50% (10%) of SDSS galaxies have N < 1.
Dayal et al. [144] investigated the cosmic habitability through the mass–SFR–metallicity relations inferred in the local universe. They suggest that giant elliptical galaxies, owing to the low star formation and high metallicity, are the safest places to live nowadays. To evaluate habitability over time, Dayal,Ward, & Cockell [145] extended their study using the star formation cosmic history [118]. They concluded that SNe dominate the lethal effects on habitability at any time in the cosmic history and that habitability is progressively increasing over cosmic time. The number of unsterilized planets today is 2.5–20 times larger than it was 4 Gyrs ago. Their claim about the dominant effect of SNe is based, however, on the assumption that all transient events irradiate the same cosmic volume. Stanway et al. [146], by combining a galactic semi-analytic model and dark matter halo merger trees (Millenium Simulation [147]), argued that the 18% (50% and 95%) of the stellar mass today (z = 0.5, z > 2) in the universe may have been irradiated in the previous 260 Myrs by a high-energy event, with a dominant role for GRBs. Moreover, they concluded that the specific merger (and related star formation) history of each galaxy is the crucial element for assessing its habitability.
The results of Dayal, Ward, & Cockell [145] were discussed by Gobat & Hong [148]. Using an analytical approach which combined the galactic mass-dependent star formation history Béthermin, Doré, & Lagache [149], an initial stellar mass function [150], and the observed galaxy mass functions [151], they confirmed that the habitability of passive galaxies is slightly but systematically higher. However, they suggested that the overall habitability of galaxies has not changed significantly in the last 8 Gyrs. This result, however, does not include GRBs as possible cosmic events threatening habitability.
Piran et al. [152] suggested that the parameter that determines how hostile the universe is to life development and resilience is the cosmological constant. The accelerated expansion, caused by a cosmological constant, is opposed to the growth of cosmic structures. It increases the mean separation between galaxies and thus reduces the number of nearby satellites hosting catastrophic GRBs. CDM universes (where the expansion is determined by the cosmological constant with cold dark matter) with very low or negative cosmological constant values would not be able to create safe regions for galaxies able to harbor advanced forms of life.
In this review, we have shown that life on exoplanets can be threatened by transient, powerful astrophysical events. Among these, GRBs, specifically the long ones produced by massive stars, should be more catastrophic due to their large energy, despite having a lower rate with respect to other less energetic transients such as SNe. During the preparation of this work, the extraordinarily energetic GRB221009A was detected by all orbiting satellites (Fermi [153,154,155,156,157], Swift [158], Integral [159], Agile [160], Konus [161], GRBalpha [162], STOsat-6 [163], and HEBS [164]). Given the relatively small distance of the event, at [165], corresponding to 0.718 Gpc, the source isotropic prompt emission ray energy was estimated to be between and erg [159]. These values should be considered the lower limits, because most detectors that triggered GRB221009A were saturated by its outstanding photon flux. By considering an intermediate value of the isotropic energy erg, the hazard distance within which it would create a substantial depletion of the O3 Earth layer would be quite large, corresponding to ≈15 kpc. Therefore, an event with such a large energy value would be able to affect most of the habitable planets within the galaxy out to its periphery if, for example, happening close to the galactic center. However, current estimates of the event rate suggest that it should be a relatively rare but not unexpected event. When considering the population model of [56], the expected rate of events as luminous as GRB221009A and within its distance volume (i.e., 1.55 Gpc) should be approximately <1 event per century.
We conclude this discussion by reiterating that the role of catastrophes in the study of biological macroevolution is heavily debated. As pointed out by several works [45,46,47,48,49], catastrophes occurring at the “right” rate could have played a pivotal role in the long-term growth of biodiversity on Earth.
Author Contributions
R.S. developed the code for the estimate of the lethal transient rate estimate. R.S. and G.G. contributed equally to the writing of the manuscript. All authors have read and agreed to the published version of the manuscript.
Funding
This research was partly supported by research grant PRIN (21079ZF5KS) and ASI/INAF I/037/12/0.
Acknowledgments
We are thankful to F. Borsa, F. Haardt, and G. Ghisellini for stimulating discussions on the subject of this review.
Conflicts of Interest
The authors declare no conflict of interest.
Abbreviations
The following abbreviations are used in this manuscript:
| GRB | Gamma ray burst |
| MW | Milky Way |
| kJ | Kilojoule |
| DNA | Deoxyribonucleic acid |
| RNA | Ribonucleic acid |
| UV | Ultra violet |
| SFR | Star formation rate |
| SN | Supernova |
| CDM | Cold dark matter |
| ME | Mass extinction |
| TNT | Trinitrotoluene |
| GHZ | Galactic habitable zone |
| TP | Terrestrial planet |
| HJ | Hot Jupiter |
| 1 | https://exoplanetarchive.ipac.caltech.edu/, accessed on 20 December 2022. |
| 2 | This value corresponds to the so-called isotropic equivalent energy. |
| 3 | Thomas & Goracke [79] estimated that the low altitude O production is not detrimental to the biosphere. |
| 4 | Such effects would be enhanced at low latitudes, owing to the Earth’s inclination. |
| 5 | In their work, Piran & Jimenez [35] assumed an average reduction factor for long-GRB high-metallicity aversion. |
| 6 | Gonzalez et al. [66] defined the GHZ by considering primarily the physical conditions for the formation of Earth-like planets. |
| 7 | Spinelli et al. [50] followed a similar approach by developing a semi-analytical model and including the combined effects of GRBs and SNe. This work will be described in detail in the following sections. |
| 8 | In dealing with the MW properties, we used the redshift z, which corresponds to the cosmic time as the coordinate expressing the evolution of the galaxy. This was motivated by the use of the z coordinate to express other properties, such as the GRB cosmic rate, often expressed as a function of z. |
| 9 | This assumption states the absence of a possible evolution of the source luminosity with the redshift. This is a debated topic and recent findings, such as those of Ghirlanda & Salvaterra [56], seem to suggest this may not hold. |
References
- Mayor, M.; Queloz, D. A Jupiter-mass companion to a solar-type star. Nature 1995, 378, 355. [Google Scholar] [CrossRef]
- Borucki, W.J.; Koch, D.G.; Dunham, E.W.; Jenkins, J.M. Planets Beyond the Solar System and the Next Generation of Space Missions. ASP Conf. Ser. 1997, 119, 153. [Google Scholar]
- Bonfils, X.; Delfosse, X.; Udry, S.; Forveille, T.; Mayor, M.; Perrier, C.; Bouchy, F.; Gillon, M.; Lovis, C.; Pepe, F. The HARPS search for southern extra-solar planets. XXXI. The M-dwarf sample. Astron. Astrophys. 2013, 549, A109. [Google Scholar] [CrossRef]
- Dressing, C.D.; Charbonneau, D. The Occurrence rate of small planets around small stars. Astrophys. J. 2013, 767, 95. [Google Scholar] [CrossRef] [Green Version]
- Dressing, C.D.; Charbonneau, D. The occurrence of potentially habitable planets orbiting M dwarfs estimated from the full Kepler dataset and and empirical measurement of the detection sensitivity. Astrophys. J. 2015, 807, 45. [Google Scholar] [CrossRef] [Green Version]
- Tuomi, M.; Jones, H.R.A.; Barnes, J.R.; Anglada-Escudé, G.; Jenkins, J.S. Bayesian search for low-mass planets around nearby M dwarfs—Estimates for occurrence rate based on global detectability statistics. Mon. Not. R. Astron. Soc. 2014, 441, 1545. [Google Scholar] [CrossRef] [Green Version]
- Bochanski, J.J.; Hawley, S.L.; Covey, K.R.; West, A.A.; Reid, I.N.; Golimowski, D.A.; Ivezić, Z. The luminosity and mass functions of low-mass stars in the galactic disk. II. The field. Astrophys. J. 2010, 139, 2679. [Google Scholar] [CrossRef]
- Driscoll, P.E.; Barnes, R. Tidal Heating of Earth-like Exoplanets around M Stars: Thermal, Magnetic, and Orbital Evolutions. Astrobiology 2015, 15, 739. [Google Scholar] [CrossRef] [Green Version]
- Meadows, V.S.; Barnes, R.K. Factors affecting exoplanet habitability. In Handbook of Exoplanets; Springer: Berlin/Heidelberg, Germany, 2018; Volume 57. [Google Scholar] [CrossRef]
- Walker, J.C.G.; Hays, P.B.; Kasting, J.F. A negative feedback mechanism for the long-term stabilization of Earth’s surface temperature. J. Geophys. Res. 1981, 86, 9776. [Google Scholar] [CrossRef]
- Lenardic, A.; Hoeink, T.; Jellinek, M.; Johnson, C.L.; Cowan, N.B.; Pierrehumbert, R.; Stamenkovic, V.; O’Neill, C.; Dasgupta, R. AGU Fall Meeting Abstracts. 2014. Available online: https://agu.confex.com/agu/fm14/meetingapp.cgi/Paper/7564 (accessed on 13 November 2022).
- Pilat-Lohinger, E. The role of dynamics on the habitability of an Earth-like planet. Int. J. Astrobiol. 2015, 14, 145. [Google Scholar] [CrossRef]
- Segura, A. Star-planet interactions and habitability: Radiative effects. In Handbook of Exoplanets; Springer: Berlin/Heidelberg, Germany, 2018; Volume 73. [Google Scholar] [CrossRef]
- Haqq-Misra, J. Does the Evolution of Complex Life Depend on the Stellar Spectral Energy Distribution? Astrobiology 2019, 19, 1292. [Google Scholar] [CrossRef] [PubMed] [Green Version]
- Wignall, P.B. Large igneous provinces and mass extinctions. Earth Sci. Rev. 2001, 53, 1. [Google Scholar] [CrossRef]
- Self, S.; Widdowson, M.; Thordarson, T.; Jay, A.E. Volatile fluxes during flood basalt eruptions and potential effects on the global environment: A Deccan perspective. Earth Planet. Sci. Lett. 2006, 248, 518. [Google Scholar] [CrossRef]
- Rampino, M.R. AGU Fall Meeting Abstracts. 2019. Available online: https://agu.confex.com/agu/fm19/webprogrampreliminary/Session75942.html (accessed on 13 November 2022).
- Li, D.J. The tectonic cause of mass extinctions and the genomic contribution to biodiversification. arXiv 2012, arXiv:1212.4229. [Google Scholar]
- Snakin, V.V. Lithospheric plate tectonics and mass extinctions of biological species. IOP Conf. Ser. Earth Environ. Sci. 2021, 946, 012009. [Google Scholar] [CrossRef]
- Alvarez, L.W.; Alvarez, W.; Asaro, F.; Michel, H.V. Extraterrestrial Cause for the Cretaceous-Tertiary Extinction. Science 1980, 208, 1095. [Google Scholar] [CrossRef] [Green Version]
- Covey, C. Global climatic effects of atmospheric dust from an asteroid or comet impact on Earth. Glob. Planet. Chang. 1994, 9, 263. [Google Scholar] [CrossRef]
- Pope, K.O.; Baines, K.H.; Ocampo, A.C.; Ivanov, B.A. Impact winter and the Cretaceous/Tertiary extinctions: Results of a Chicxulub asteroid impact model. Earth Planet. Sci. Lett. 1994, 128, 719. [Google Scholar] [CrossRef] [PubMed]
- Raup, D.M.; Sepkoski, J.J. Mass Extinctions in the Marine Fossil Record. Science 1982, 215, 1501. [Google Scholar] [CrossRef] [Green Version]
- Jablonski, D. Extinctions in the Fossil Record. Philos. Trans. R. Soc. Lond. Ser. B 1994, 344, 11. [Google Scholar]
- Barnosky, A.D.; Matzke, N.; Tomiya, S.; Wogan, G.O.U.; Swartz, B.; Quental, T.B.; Marshall, C.; McGuire, J.L.; Lindsey, E.L.; Maguire, K.C.; et al. Has the Earth’s sixth mass extinction already arrived? Nature 2011, 471, 51. [Google Scholar] [CrossRef] [PubMed]
- Sepkoski, J.J., Jr. A Compendium of Fossil Marine Animal Genera; Jablonski, D., Foote, M., Eds.; Bulletins of American Paleontology: Ithaca, NY, USA, 2002; Volume 363, 563p. [Google Scholar]
- Rohde, R.A.; Muller, R.A. Cycles in fossil diversity. Nature 2005, 434, 208. [Google Scholar] [CrossRef] [PubMed]
- Hallam, A. Evolution: The causes of mass extinctions. Nature 1984, 308, 686. [Google Scholar] [CrossRef] [PubMed]
- Hildebrand, A.R.; Penfield, G.T.; Kring, D.A.; Pilkington, M.; Camargo, Z.A.; Jacobsen, S.B.; Boynton, W.V. Chicxulub Crater: A possible Cretaceous/Tertiary boundary impact crater on the Yucatán Peninsula, Mexico. Geology 1991, 19, 867. [Google Scholar] [CrossRef]
- Courtillot, V.; Fluteau, F. Cretaceous extinctions: The volcanic hypothesis. Science 2010, 328, 973–974. [Google Scholar] [CrossRef]
- Ruderman, M.A. Possible Consequences of Nearby Supernova Explosions for Atmospheric Ozone and Terrestrial Life. Science 1974, 184, 1079. [Google Scholar] [CrossRef]
- Thorsett, S.E. Terrestrial Implications of Cosmological Gamma-Ray Burst Models. Astrophys. J. Lett. 1995, 444, L53. [Google Scholar] [CrossRef] [Green Version]
- Gehrels, N.; Laird, C.M.; Jackman, C.H.; Cannizzo, J.K.; Mattson, B.J.; Chen, W. Ozone Depletion from Nearby Supernovae. Astrophys. J. 2003, 585, 1169. [Google Scholar] [CrossRef]
- Melott, A.L.; Thomas, B.C. Astrophysical ionizing radiation and Earth: A brief review and census of intermittent intense sources. Astrobiology 2011, 11, 343. [Google Scholar] [CrossRef]
- Piran, T.; Jimenez, R. Possible Role of Gamma Ray Bursts on Life Extinction in the Universe. Phys. Rev. Lett. 2014, 113, 231102. [Google Scholar] [CrossRef] [Green Version]
- Sanz-Forcada, J.; Ribas, I.; Micela, G.; Pollock, A.M.T.; García-Álvarez, D.; Solano, E.; Eiroa, C. A scenario of planet erosion by coronal radiation. Astron. Astrophys. 2010, 511, L8. [Google Scholar] [CrossRef]
- Sagan, C. Ultraviolet selection pressure on the earliest organisms. J. Theor. Biol. 1973, 39, 195. [Google Scholar] [CrossRef] [PubMed] [Green Version]
- Buccino, A.P.; Lemarchand, G.A.; Mauas, P.J.D. UV habitable zones around M stars. Icarus 2007, 192, 582. [Google Scholar] [CrossRef] [Green Version]
- Toupance, G.; Bossard, A.; Raulin, F. Far UV irradiation of model prebiotic atmospheres. Orig. Life 1977, 8, 259. [Google Scholar] [CrossRef] [PubMed]
- Powner, M.W.; Gerland, B.; Sutherland, J.D. Synthesis of activated pyrimidine ribonucleotides in prebiotically plausible conditions. Nature 2009, 459, 239. [Google Scholar] [CrossRef]
- Ritson, D.; Sutherland, J.D. Prebiotic synthesis of simple sugars by photoredox systems chemistry. Nat. Chem. 2012, 4, 895. [Google Scholar] [CrossRef] [Green Version]
- Patel, B.H.; Percivalle, C.; Ritson, D.J.; Duffy, C.D.; Sutherland, J.D. Common origins of RNA, protein and lipid precursors in a cyanosulfidic protometabolism. Nat. Chem. 2015, 7, 301. [Google Scholar] [CrossRef] [Green Version]
- Xu, J.; Ritson, D.J.; Ranjan, S.; Todd, Z.R.; Sasselov, D.D.; Sutherland, J.D. Photochemical reductive homologation of hydrogen cyanide using sulfite and ferrocyanide. Chem. Commun. 2018, 54, 44. [Google Scholar] [CrossRef]
- Rimmer, P.B.; Xu, J.; Thompson, S.J.; Gillen, E.; Sutherland, J.D.; Queloz, D. The origin of RNA precursors on exoplanets. The origin of RNA precursors on exoplanets. Sci. Adv. 2018, 4, eaar3302. [Google Scholar] [CrossRef] [Green Version]
- Sepkoski, J.J. The Search for Extraterrestrial Life: Recent Developments. Int. Astron. Union Symp. 1985, 112, 223. [Google Scholar] [CrossRef] [Green Version]
- Raup, D.M. The role of extinction in evolution. Proc. Natl. Acad. Sci. USA 1994, 91, 6758–6763. [Google Scholar] [CrossRef] [PubMed]
- Jablonski, D. Lessons from the past: Evolutionary impacts of mass extinctions. Proc. Natl. Acad. Sci. USA 2001, 98, 5393–5398. [Google Scholar] [CrossRef] [PubMed] [Green Version]
- Krug, A.Z.; Jablonski, D. Long-term origination rates are reset only at mass extinctions. Geology 2012, 40, 731. [Google Scholar] [CrossRef]
- Stroud, J.T.; Losos, J.N. Ecological Opportunity and Adaptive Radiation. Annu. Rev. Ecol. Evol. Syst. 2016, 47, 507–532. [Google Scholar] [CrossRef]
- Spinelli, R.; Ghirlanda, G.; Haardt, F.; Ghisellini, G.; Scuderi, G. The best place and time to live in the Milky Way. Astron. Astrophys. 2021, 647, A41. [Google Scholar] [CrossRef]
- Kumar, P.; Zhang, B. The physics of gamma-ray bursts & relativistic jets. Phys. Rep. 2015, 561, 1. [Google Scholar] [CrossRef] [Green Version]
- Ghirlanda, G.; Nava, L.; Ghisellini, G.; Celotti, A.; Firmani, C. Short versus long gamma-ray bursts: Spectra, energetics, and luminosities. Astron. Astrophys. 2009, 496, 585. [Google Scholar] [CrossRef]
- Wanderman, D.; Piran, T. The luminosity function and the rate of Swift’s gamma-ray bursts. Mon. Not. R. Astron. Soc. 2010, 406, 1944. [Google Scholar] [CrossRef] [Green Version]
- Wanderman, D.; Piran, T. The rate, luminosity function and time delay of non-Collapsar short GRBs. Mon. Not. R. Astron. Soc. 2015, 448, 3026. [Google Scholar] [CrossRef] [Green Version]
- Ghirlanda, G.; Salafia, O.S.; Pescalli, A.; Ghisellini, G.; Salvaterra, R.; Chassande-Mottin, E.; Colpi, M.; Nappo, F.; D’Avanzo, P.; Melandri, A.; et al. Short gamma-ray bursts at the dawn of the gravitational wave era. Astron. Astrophys. 2016, 594, A84. [Google Scholar] [CrossRef] [Green Version]
- Ghirlanda, G.; Salvaterra, R. The Cosmic History of Long Gamma-Ray Bursts. Astrophys. J. 2022, 932, 10. [Google Scholar] [CrossRef]
- Maoz, D.; Mannucci, F. Type-Ia Supernova Rates and the Progenitor Problem: A Review. Publ. Astron. Soc. Aust. 2012, 29, 447. [Google Scholar] [CrossRef] [Green Version]
- Li, W.; Leaman, J.; Chornock, R.; Filippenko, A.V.; Poznanski, D.; Ganeshalingam, M.; Wang, X.; Modjaz, M.; Jha, S.; Foley, R.J.; et al. Nearby supernova rates from the Lick Observatory Supernova Search—II. The observed luminosity functions and fractions of supernovae in a complete sample. Mon. Not. R. Astron. Soc. 2011, 412, 1441. [Google Scholar] [CrossRef]
- Heger, A.; Fryer, C.L.; Woosley, S.E.; Langer, N.; Hartmann, D.H. How Massive Single Stars End Their Life. Astrophys. J. 2003, 591, 288. [Google Scholar] [CrossRef] [Green Version]
- MacFadyen, A.I.; Woosley, S.E. Collapsars: Gamma-Ray Bursts and Explosions in “Failed Supernovae”. Astrophys. J. 1999, 524, 262. [Google Scholar] [CrossRef] [Green Version]
- Yoon, S.-C.; Langer, N.; Norman, C. Single star progenitors of long gamma-ray bursts. I. Model grids and redshift dependent GRB rate. Astron. Astrophys. 2006, 460, 199. [Google Scholar] [CrossRef]
- Vergani, S.D.; Salvaterra, R.; Japelj, J.; Le Floc’h, E.; D’Avanzo, P.; Fernandez-Soto, A.; Krühler, T.; Melandri, A.; Boissier, S.; Covino, S.; et al. Are long gamma-ray bursts biased tracers of star formation? Clues from the host galaxies of the Swift/BAT6 complete sample of LGRBs. Astron. Astrophys. 2015, 581, A102. [Google Scholar] [CrossRef] [Green Version]
- Perley, D.A.; Tanvir, N.R.; Hjorth, J.; Laskar, T.; Berger, E.; Chary, R.; de Ugarte Postigo, A.; Fynbo, J.P.U.; Krühler, T.; Levan, A.; et al. The Swift GRB Host Galaxy Legacy Survey—II. Rest-Frame NIR Luminosity Distribution and Evidence for a Near-Solar Metallicity Threshold. Astrophys. J. 2016, 817, 8. [Google Scholar] [CrossRef] [Green Version]
- Palmerio, J.T.; Vergani, S.D.; Salvaterra, R.; Sanders, R.L.; Japelj, J.; Vidal-García, A.; D’Avanzo, P.; Corre, D.; Perley, D.A.; Shapley, A.E.; et al. Are long gamma-ray bursts biased tracers of star formation? Clues from the host galaxies of the Swift/BAT6 complete sample of bright LGRBs. Astron. Astrophys. 2019, 623, A26. [Google Scholar] [CrossRef] [Green Version]
- Woosley, S.E.; Heger, A. The Progenitor Stars of Gamma-Ray Bursts. Astrophys. J. 2006, 637, 914. [Google Scholar] [CrossRef] [Green Version]
- Gonzalez, G.; Brownlee, D.; Ward, P. The Galactic Habitable Zone: Galactic Chemical Evolution. Icarus 2001, 152, 185. [Google Scholar] [CrossRef]
- Fischer, D.A.; Valenti, J. The Planet-Metallicity Correlation. Astrophys. J. 2005, 622, 1102. [Google Scholar] [CrossRef]
- Lineweaver, C.H.; Fenner, Y.; Gibson, B.K. The Galactic Habitable Zone and the Age Distribution of Complex Life in the Milky Way. Science 2004, 303, 59. [Google Scholar] [CrossRef] [PubMed] [Green Version]
- Zackrisson, E.; Calissendorff, P.; González, J.; Benson, A.; Johansen, A.; Janson, M. Terrestrial Planets across Space and Time. Astrophys. J. 2016, 833, 214. [Google Scholar] [CrossRef] [Green Version]
- Thomas, B.C.; Jackman, C.H.; Melott, A.L.; Laird, C.M.; Stolarski, R.S.; Gehrels, N.; Cannizzo, J.K.; Hogan, D.P. Gamma-Ray Bursts and the Earth: Exploration of Atmospheric, Biological, Climatic, and Biogeochemical Effects. Astrophys. J. 2005, 622, L153. [Google Scholar] [CrossRef] [Green Version]
- Melott, A.L.; Lieberman, B.S.; Laird, C.M.; Martin, L.D.; Medvedev, M.V.; Thomas, B.C.; Cannizzo, J.K.; Gehrels, N.; Jackman, C.H. Did a gamma-ray burst initiate the late Ordovician mass extinction? Int. J. Astrobiol. 2004, 3, 55. [Google Scholar] [CrossRef]
- Herrmann, A.D.; Patzkowsky, M.E. Modeling the response of the Late Ordovician climate system to different forcing factors. Astrobiology 2002, 2, 560–561. [Google Scholar]
- Herrmann, A.D.; Patzkowsky, M.E.; Pollard, D. Obliquity forcing with 8–12 times preindustrial levels of atmospheric pCO2 during the Late Ordovician glaciation. Geology 2003, 31, 485. [Google Scholar] [CrossRef]
- Thomas, B.C.; Melott, A.L. Gamma-ray bursts and terrestrial planetary atmospheres. New J. Phys. 2006, 8, 120. [Google Scholar] [CrossRef]
- Li, Y.; Zhang, B. Can life survive Gamma-Ray bursts in the high-redshift universe? Astrophys. J. 2015, 810, 41. [Google Scholar] [CrossRef] [Green Version]
- Brenchley, P.J.; Carden, G.A.; Hints, L.; Kaljo, D.; Marshall, J.D.; Martma, T.; Meidla, T.; Nõlvak, J. High-resolution stable isotope stratigraphy of Upper Ordovician sequences: Constraints on the timing of bioevents and environmental changes associated with mass extinction and glaciation. GSA Bull. 2003, 115, 89–104. [Google Scholar] [CrossRef]
- Melott, A.L.; Thomas, B.C. Late Ordovician geographic patterns of extinction compared with simulations of astrophysical ionizing radiation damage. arXiv 2008, arXiv:0809.0899. [Google Scholar] [CrossRef]
- Ejzak, L.M.; Melott, A.L.; Medvedev, M.V.; Thomas, B.C. Terrestrial Consequences of Spectral and Temporal Variability in Ionizing Photon Events. Astrophys. J. 2007, 654, 373. [Google Scholar] [CrossRef] [Green Version]
- Thomas, B.C.; Goracke, B.D. Ground-Level Ozone Following Astrophysical Ionizing Radiation Events: An Additional Biological Hazard? Astrobiology 2016, 16, 1–6. [Google Scholar] [CrossRef] [PubMed] [Green Version]
- Whitten, R.C.; Cuzzi, J.; Borucki, W.J.; Wolfe, J.H. Effect of nearby supernova explosions on atmospheric ozone. Nature 1976, 263, 398. [Google Scholar] [CrossRef]
- Clark, D.H.; McCrea, W.H.; Stephenson, F.R. Frequency of nearby supernovae and climatic and biological catastrophes. Nature 1977, 265, 318. [Google Scholar] [CrossRef]
- Reid, G.C.; McAfee, J.R.; Crutzen, P.J. Effects of intense stratospheric ionisation events. Nature 1978, 275, 489. [Google Scholar] [CrossRef]
- van Paradijs, J.; Groot, P.J.; Galama, T.; Kouveliotou, C.; Strom, R.G.; Telting, J.; Rutten, R.G.M.; Fishman, G.J.; Meegan, C.A.; Pettini, M. Transient optical emission from the error box of the γ-ray burst of 28 February 1997. Nature 1997, 386, 686. [Google Scholar] [CrossRef] [Green Version]
- Costa, E.; Frontera, F.; Heise, J.; Feroci, M.; in’t Zand, J.; Fiore, F.; Cinti, M.N.; Dal Fiume, D.; Nicastro, L.; Orlandini, M. Discovery of an X-ray afterglow associated with the γ-ray burst of 28 February 1997. Nature 1997, 387, 783. [Google Scholar] [CrossRef]
- Hampson, J. Photochemical war on the atmosphere. Nature 1974, 250, 189–191. [Google Scholar] [CrossRef]
- Scalo, J.; Wheeler, J.C. Short-term effects of gamma ray bursts on Earth. Astrophys. J. 2002, 566, 723. [Google Scholar] [CrossRef] [Green Version]
- Martín, O.; Galante, D.; Cárdenas, R.; Horvath, J.E. Short-term effects of gamma ray bursts on Earth. Astrophys. Space Sci. 2009, 321, 161–167. [Google Scholar] [CrossRef]
- Beech, M. The past, present and future supernova threat to Earth’s biosphere. Astrophys. Space Sci. 2011, 336, 287. [Google Scholar] [CrossRef]
- Gowanlock, M.G.; Morrison, I.S. The Habitability of our Evolving Galaxy. arXiv 2018, arXiv:1802.07036. [Google Scholar] [CrossRef]
- Prantzos, N. On the “Galactic Habitable Zone”. Space Sci. Rev. 2008, 135, 313. [Google Scholar] [CrossRef]
- Spitoni, E.; Matteucci, F.; Sozzetti, A. The galactic habitable zone of the Milky Way and M31 from chemical evolution models with gas radial flows. Mon. Not. R. Astron. Soc. 2014, 440, 2588. [Google Scholar] [CrossRef] [Green Version]
- Spitoni, E.; Gioannini, L.; Matteucci, F. Galactic habitable zone around M and FGK stars with chemical evolution models that include dust. Astron. Astrophys. 2017, 605, A38. [Google Scholar] [CrossRef] [Green Version]
- Gowanlock, M.G.; Patton, D.R.; McConnell, S.M. A model of habitability within the Milky Way galaxy. Astrobiology 2011, 11. [Google Scholar] [CrossRef] [PubMed] [Green Version]
- Naab, T.; Ostriker, J.P. A simple model for the evolution of disc galaxies: The Milky Way. Mon. Not. R. Astron. Soc. 2006, 366, 899. [Google Scholar] [CrossRef]
- Morrison, I.S.; Gowanlock, M.G. Extending Galactic Habitable Zone Modeling to Include the Emergence of Intelligent Life. Astrobiology 2015, 15, 683. [Google Scholar] [CrossRef] [Green Version]
- Forgan, D.; Dayal, P.; Cockell, C.; Libeskind, N. Evaluating galactic habitability using high-resolution cosmological simulations of galaxy formation. Int. J. Astrobiol. 2017, 16, 60. [Google Scholar] [CrossRef] [Green Version]
- Vukotić, B.; Steinhauser, D.; Martinez-Aviles, G.; Ćirković, M.M.; Micic, M.; Schindler, S. ‘Grandeur in this view of life’: N-body simulation models of the Galactic habitable zone. Mon. Not. R. Astron. Soc. 2016, 459, 3512. [Google Scholar] [CrossRef]
- Abbott, B.P.; Abbott, R.; Abbott, T.D.; Acernese, F.; Ackley, K.; Adams, C.; Adams, T.; Addesso, P.; Adhikari, R.X.; Adya, V.B.; et al. GW170817: Observation of Gravitational Waves from a Binary Neutron Star Inspiral. Phys. Rev. Lett. 2017, 119, 161101. [Google Scholar] [CrossRef] [Green Version]
- Abbott, B.P.; Abbott, R.; Abbott, T.D.; Acernese, F.; Ackley, K.; Adams, C.; Adams, T.; Addesso, P.; Adhikari, R.X.; Adya, V.B.; et al. GW170814: A Three-Detector Observation of Gravitational Waves from a Binary Black Hole Coalescence. Phys. Rev. Lett. 2017, 119, 141101. [Google Scholar] [CrossRef] [Green Version]
- Galama, T.J.; Vreeswijk, P.M.; van Paradijs, J.; Kouveliotou, C.; Augusteijn, T.; Böhnhardt, H.; Brewer, J.P.; Doublier, V.; Gonzalez, J.-F.; Leibundgut, B.; et al. An unusual supernova in the error box of the γ-ray burst of 25 April 1998. Nature 1998, 395, 670. [Google Scholar] [CrossRef]
- Mortlock, A.; Conselice, C.J.; Hartley, W.G.; Duncan, K.; Lani, C.; Ownsworth, J.R.; Almaini, O.; Wel, A.; Huang, K.-H.; Ashby, M.L.N.; et al. Deconstructing the galaxy stellar mass function with UKIDSS and CANDELS: The impact of colour, structure and environment. Mon. Not. R. Astron. Soc. 2015, 447, 2. [Google Scholar] [CrossRef]
- Salvaterra, R.; Campana, S.; Vergani, S.D.; Covino, S.; D’Avanzo, P.; Fugazza, D.; Ghirlanda, G.; Ghisellini, G.; Melandri, A.; Nava, L.; et al. A complete sample of bright Swift Long Gamma-Ray Bursts: Sample presentation, Luminosity Function and evolution. Astrophys. J. 2012, 749, 68. [Google Scholar] [CrossRef] [Green Version]
- Pescalli, A.; Ghirlanda, G.; Salvaterra, R.; Ghisellini, G.; Vergani, S.D.; Nappo, F.; Salafia, O.S.; Melandri, A.; Covino, S.; Götz, D. The rate and luminosity function of long gamma ray bursts. Astron. Astrophys. 2016, 587, A40. [Google Scholar] [CrossRef] [Green Version]
- Guetta, D.; Piran, T. The luminosity and redshift distributions of short-duration GRBs. Astron. Astrophys. 2005, 435, 421–426. [Google Scholar] [CrossRef]
- D’Avanzo, P.; Salvaterra, R.; Bernardini, M.G.; Nava, L.; Campana, S.; Covino, S.; D’Elia, V.; Ghirlanda, G.; Ghisellini, G.; Melandri, A.; et al. A complete sample of bright Swift short Gamma-Ray Bursts. Mon. Not. R. Astron. Soc. 2014, 442, 2342. [Google Scholar] [CrossRef] [Green Version]
- Frail, D.A.; Kulkarni, S.R.; Sari, R.; Djorgovski, S.G.; Bloom, J.S.; Galama, T.J.; Reichart, D.E.; Berger, E.; Harrison, F.A.; Price, P.A.; et al. Beaming in Gamma-Ray Bursts: Evidence for a Standard Energy Reservoir. Astrophys. J. Lett. 2001, 562, L55. [Google Scholar] [CrossRef] [Green Version]
- Ghirlanda, G.; Ghisellini, G.; Lazzati, D. The Collimation-corrected Gamma-Ray Burst Energies Correlate with the Peak Energy of Their νFν Spectrum. Astrophys. J. 2004, 616, 331. [Google Scholar] [CrossRef]
- Kouveliotou, C.; Meegan, C.A.; Fishman, G.J.; Bhat, N.P.; Briggs, M.S.; Koshut, T.M.; Paciesas, W.S.; Pendleton, G.N. Identification of two classes of gamma-ray bursts. Astrophys. J. Lett. 1993, 413, L101. [Google Scholar] [CrossRef]
- Hatano, K.; Fisher, A.; Branch, D. On the spatial distribution and occurrence rate of Galactic classical novae. Mon. Not. R. Astron. Soc. 1997, 290, 360. [Google Scholar] [CrossRef] [Green Version]
- Cappellaro, E.; Evans, R.; Turatto, M. A new determination of supernova rates and a comparison with indicators for galactic star formation. Astron. Astrophys. 1999, 351, 459. [Google Scholar] [CrossRef]
- Richardson, D.; Branch, D.; Casebeer, D.; Millard, J.; Thomas, R.C.; Baron, E. A Comparative Study of the Absolute Magnitude Distributions of Supernovae. Astrophys. J. 2002, 123, 745. [Google Scholar] [CrossRef] [Green Version]
- Barris, B.J.; Tonry, J.L.; Blondin, S.; Challis, P.; Chornock, R.; Clocchiatti, A.; Filippenko, A.V.; Garnavich, P.; Holland, S.T.; Jha, S.; et al. Twenty-Three High-Redshift Supernovae from the Institute for Astronomy Deep Survey: Doubling the Supernova Sample at z > 0.7. Astrophys. J. 2004, 602, 571. [Google Scholar] [CrossRef] [Green Version]
- Botticella, M.T.; Riello, M.; Cappellaro, E.; Benetti, S.; Altavilla, G.; Pastorello, A.; Turatto, M.; Greggio, L.; Patat, F.; Valenti, S.; et al. Supernova rates from the Southern inTermediate Redshift ESO Supernova Search (STRESS). Astron. Astrophys. 2008, 479, 49. [Google Scholar] [CrossRef] [Green Version]
- Höflich, P.; Schaefer, B.E. X-ray and Gamma-Ray flashes frin Type Ia supernovae? Astrophys. J. 2009, 705, 483. [Google Scholar] [CrossRef] [Green Version]
- Soderberg, A.M.; Berger, E.; Page, K.L.; Schady, P.; Parrent, J.; Pooley, D.; Wang, X.-Y.; Ofek, E.O.; Cucchiara, A.; Rau, A.; et al. An extremely luminous X-ray outburst at the birth of a supernova. Nature 2008, 453, 469. [Google Scholar] [CrossRef] [Green Version]
- Schawinski, K.; Justham, S.; Wolf, C.; Podsiadlowski, P.; Sullivan, M.; Steenbrugge, K.C.; Bell, T.; Röser, H.-J.; Walker, E.S.; Astier, P.; et al. Supernova Shock Breakout from a Red Supergiant. Science 2008, 321, 223. [Google Scholar] [CrossRef] [Green Version]
- Woosley, S.E.; Langer, N.; Weaver, T.A. The Evolution of Massive Stars Including Mass Loss: Presupernova Models and Explosion. Astrophys. J. 1993, 411, 823. [Google Scholar] [CrossRef]
- Madau, P.; Dickinson, M. Cosmic Star-Formation History. Annu. Rev. Astron. Astrophys. 2014, 52, 415. [Google Scholar] [CrossRef] [Green Version]
- Hopkins, A.M.; Beacom, J.F. On the Normalization of the Cosmic Star Formation History. Astrophys. J. 2006, 651, 142. [Google Scholar] [CrossRef] [Green Version]
- Daigne, F.; Rossi, E.M.; Mochkovitch, R. The redshift distribution of SWIFT Gamma-Ray Bursts: Evidence for evolution. Mon. Not. R. Astron. Soc. 2006, 372, 1034. [Google Scholar] [CrossRef]
- Le Floc’h, E.; Charmandaris, V.; Forrest, W.J.; Mirabel, I.F.; Armus, L.; Devost, D. Probing the cosmic star formation using long Gamma-Ray Bursts: New constraints from the Spitzer Space Telescope. Astrophys. J. 2006, 642, 636. [Google Scholar] [CrossRef]
- Guetta, D.; Della Valle, M. On the Rates of Gamma-Ray Bursts and Type Ib/c Supernovae. Astrophys. J. Lett. 2007, 657, L73. [Google Scholar] [CrossRef]
- Kistler, M.D.; Yüksel, H.; Beacom, J.F.; Hopkins, A.M.; Wyithe, J.S.B. The star formation rate in the reionization era as indicated by gamma-ray bursts. Astrophys. J. Lett. 2009, 705, L104. [Google Scholar] [CrossRef] [Green Version]
- Virgili, F.J.; Zhang, B.; Nagamine, K.; Choi, J.-H. Gamma-ray burst rate: High-redshift excess and its possible origins. Mon. Not. R. Astron. Soc. 2011, 417, 3025. [Google Scholar] [CrossRef] [Green Version]
- Bignone, L.A.; Tissera, P.B.; Pellizza, L.J. The metallicity and star formation activity of long gamma-ray burst hosts for z < 3: Insights from the Illustris simulation. Mon. Not. R. Astron. Soc. 2017, 469, 4921. [Google Scholar] [CrossRef] [Green Version]
- Bignone, L.A.; Pellizza, L.J.; Tissera, P.B. Metallicity effects in long gamma-ray burst populations in a ΛCDM Universe. New Astron. 2018, 65, 73. [Google Scholar] [CrossRef] [Green Version]
- Bertelli, G.; Bressan, A.; Chiosi, C.; Fagotto, F.; Nasi, E. Theoretical isochrones from models with new radiative opacities. Astron. Astrophys. Suppl. 1994, 106, 275. [Google Scholar]
- Guetta, D.; Piran, T. The BATSE-Swift luminosity and redshift distributions of short-duration GRBs. Astron. Astrophys. 2006, 453, 823. [Google Scholar] [CrossRef]
- Webbink, R.F. Double white dwarfs as progenitors of R Coronae Borealis stars and type I supernovae. Astrophys. J. 1984, 277, 355. [Google Scholar] [CrossRef]
- Naab, T.; Ostriker, J.P. Minor Mergers and the Size Evolution of Elliptical Galaxies. Astrophys. J. 2009, 690, 1452. [Google Scholar] [CrossRef]
- Kennicutt, R.C. The Global Schmidt Law in Star-forming Galaxies. Astrophys. J. 1998, 498, 541. [Google Scholar] [CrossRef] [Green Version]
- Ostriker, J.P.; Tinsley, B.M. Is deuterium of cosmological or galactic origin? Astrophys. J. Lett. 1975, 201, L51. [Google Scholar] [CrossRef]
- Gallazzi, A.; Brinchmann, J.; Charlot, S.; White, S.D.M. A census of metals and baryons in stars in the local Universe. Mon. Not. R. Astron. Soc. 2008, 383, 1439. [Google Scholar] [CrossRef] [Green Version]
- Alibert, Y. Imaging Extrasolar Giant Planets. Astron. Astrophys. 2014, 561, A41. [Google Scholar] [CrossRef] [Green Version]
- Gaidos, E.; Mann, A.W. M Dwarf Metallicities and Giant Planet Occurrence: Ironing Out Uncertainties and Systematics. Astrophys. J. 2014, 791, 54. [Google Scholar] [CrossRef] [Green Version]
- Balbi, A.; Tombesi, F. The habitability of the Milky Way during the active phase of its central supermassive black hole. Sci. Rep. 2017, 7, 16626. [Google Scholar] [CrossRef] [PubMed] [Green Version]
- Rodríguez-López, L.; Cardenas, R.; González-Rodríguez, L.; Guimarais, M.; Horvath, J. Influence of a Galactic Gamma-Ray Burst on Ocean Plankton. arXiv 2020, arXiv:2011.08433. [Google Scholar] [CrossRef]
- Steffen, J.H.; Ragozzine, D.; Fabrycky, D.C.; Carter, J.A.; Ford, E.B.; Holman, M.J.; Rowe, J.F.; Welsh, W.F.; Borucki, W.J.; Boss, A.P.; et al. Kepler constraints on planets near hot Jupiters. Proc. Natl. Acad. Sci. USA 2012, 109, 7982. [Google Scholar] [CrossRef] [PubMed]
- Huang, C.; Wu, Y.; Triaud, A.H.M.J. Warm Jupiters are less lonely than hot Jupiters: Close neighbours. Astrophys. J. 2016, 825, 98. [Google Scholar] [CrossRef] [Green Version]
- Pacetti, E.; Balbi, A.; Lingam, M.; Tombesi, F.; Perlman, E. The impact of tidal disruption events on galactic habitability. Mon. Not. R. Astron. Soc. 2020. [Google Scholar] [CrossRef]
- Bailer-Jones, C.A.L. The evidence for and against astronomical impacts on climate change and mass extinctions: A review. Int. J. Astrobiol. 2009, 8, 213. [Google Scholar] [CrossRef] [Green Version]
- Raup, D.M.; Sepkoski, J.J. Periodicity of extinctions in the geologic past. Proc. Natl. Acad. Sci. USA 1984, 81, 801. [Google Scholar] [CrossRef] [Green Version]
- Whitmire, D.P.; Jackson, A.A. Are periodic mass extinctions driven by a distant solar companion? Nature 1984, 308, 713. [Google Scholar] [CrossRef]
- Dayal, P.; Cockell, C.; Rice, K.; Mazumdar, A. The quest for cradles of life: Using the fundamental metallicity relation to hunt for the most habitable type of galaxy. Astrophys. J. Lett. 2015, 810, L2. [Google Scholar] [CrossRef] [Green Version]
- Dayal, P.; Ward, M.; Cockell, C. The habitability of the Universe through 13 billion years of cosmic time. arXiv 2016, arXiv:1606.09224. [Google Scholar]
- Stanway, E.R.; Hoskin, M.J.; Lane, M.A.; Brown, G.C.; Childs, H.J.T.; Greis, S.M.L.; Levan, A.J. Exploring the cosmic evolution of habitability with galaxy merger trees. Mon. Not. R. Astron. Soc. 2018, 475, 1829. [Google Scholar] [CrossRef] [Green Version]
- Springel, V.; White, S.D.M.; Jenkins, A.; Frenk, C.S.; Yoshida, N.; Gao, L.; Navarro, J.; Navarro, J.; Thacker, R.; Croton, D.; et al. Simulations of the formation, evolution and clustering of galaxies and quasars. Nature 2005, 435, 629. [Google Scholar] [CrossRef] [PubMed] [Green Version]
- Gobat, R.; Hong, S.E. Evolution of galaxy habitability. Astron. Astrophys. 2016, 592, A96. [Google Scholar] [CrossRef] [Green Version]
- Béthermin, M.; Doré, O.; Lagache, G. Where stars form and live at high redshift: Clues from the infrared. Astron. Astrophys. 2012, 537, L5. [Google Scholar] [CrossRef]
- Kroupa, P.; Bouvier, J.; Duchêne, G.; Moraux, E. On the universal outcome of star formation: Is there a link between stars and brown dwarfs? Mon. Not. R. Astron. Soc. 2003, 346, 354. [Google Scholar] [CrossRef] [Green Version]
- Ilbert, O.; McCracken, H.J.; Le Fèvre, O.; Capak, P.; Dunlop, J.; Karim, A.; Renzini, M.A.; Caputi, K.; Boissier, S.; Arnouts, S.; et al. Mass assembly in quiescent and star-forming galaxies since z ≃ 4 from UltraVISTA. Astron. Astrophys. 2013, 556, A55. [Google Scholar] [CrossRef] [Green Version]
- Piran, T.; Jimenez, R.; Cuesta, A.J.; Simpson, F.; Verde, L. Cosmic Explosions, Life in the Universe, and the Cosmological Constant. Phys. Rev. Lett. 2016, 116, 081301. [Google Scholar] [CrossRef]
- Veres, P.; Burns, E.; Bissaldi, E.; Lesage, S.; Roberts, O.; et al. [Fermi GBM Team]. Available online: https://ui.adsabs.harvard.edu/abs/2022GCN.32636....1V/abstract (accessed on 13 November 2022).
- Bissaldi, E.; Omodei, N.; Kerr, M.; et al. [Fermi-LAT Team]. Available online: https://ui.adsabs.harvard.edu/abs/2022GCN.32637....1B/abstract (accessed on 13 November 2022).
- Lesage, S.; Veres, P.; Roberts, O.J.; Burns, E.; Bissaldi, E.; et al. [Fermi GBM Team]. Available online: https://ui.adsabs.harvard.edu/abs/2022GCN.32642....1L/abstract (accessed on 13 November 2022).
- Pillera, R.; Bissaldi, E.; Omodei, N.; La Mura, G.; Longo, F.; et al. [Fermi-LAT Team]. Available online: https://ui.adsabs.harvard.edu/abs/2022GCN.32658....1P/abstract (accessed on 13 November 2022).
- Omodei, N.; Di Lalla, N.; Pillera, R.; et al. [Fermi-LAT Team]. Available online: https://ui.adsabs.harvard.edu/abs/2022GCN.31659....1O/abstract (accessed on 13 November 2022).
- Krimm, H.A.; Barthelmy, S.D.; Dichiara, S.; Laha, S.; Lien, A.Y.; Markwardt, C.B.; Palmer, D.M.; Parsotan, T.; Sakamoto, T.; Stamatikos, M. GRB 221009A (Swift J1913.1+1946): Swift-BAT Refined Analysis. Available online: https://ui.adsabs.harvard.edu/abs/2022GCN.32688....1K/abstract (accessed on 13 November 2022).
- Gotz, D.; Mereghetti, S.; Savchenko, V.; Ferrigno, C.; Bozzo, E.; et al. [IBAS Team]. Available online: https://ui.adsabs.harvard.edu/abs/2022GCN.32660....1G/abstract (accessed on 13 November 2022).
- Piano, G.; Verrecchia, F.; Bulgarelli, A.; Ursi, A.; Panebianco, G.; Pittori, C.; Tavani, M.; Argan, A.; et al. [Agile Team]. Available online: https://ui.adsabs.harvard.edu/abs/2022GCN.32657....1P/abstract (accessed on 13 November 2022).
- Frederiks, D.; et al. [Konus-Wind Team]. Available online: https://gcn.gsfc.nasa.gov/gcn3/32668.gcn3 (accessed on 13 November 2022).
- Ripa, J.; et al. [GRBalpha Collaboration]. Available online: https://ui.adsabs.harvard.edu/abs/2022GCN.32685....1R/abstract (accessed on 13 November 2022).
- Mitchell, L.J.; Phlips, B.F.; Johnson, W.N. GRB 221009A: Gamma-Ray Detection by SIRI-2. Available online: https://ui.adsabs.harvard.edu/abs/2022GCN.32746....1M/abstract (accessed on 13 November 2022).
- Liu, J.C.; et al. [GECAM and HEBS Teams]. Available online: https://ui.adsabs.harvard.edu/abs/2022GCN.32751 (accessed on 13 November 2022).
- de Ugarte Postigo, A.; et al. [Stargate Collaboration]. Available online: https://ui.adsabs.harvard.edu/abs/2022GCN.32648....1D/abstract (accessed on 13 November 2022).
Figure 1.
Number of genera (black histogram) over time for the 17,797 well-resolved known marine animal genera of Sepkoski’s Compendium of Fossil Marine Animal Genera [26]. The green curve is a least square fit to the data points, and vertical triangles mark the 5 MEs which occurred on Earth in the last 500 Myr.

Figure 2.
Effect of a gamma ray burst on an Earth-like planet. Before the GRB, the ozone (O)-rich external atmosphere layer (blue circle) shields the planet from UV radiation emitted by its host star. The incidence of a relatively large (with fluence (see text)) amount of X-ray and ray radiation destroys the O and N molecules, which recombine, producing nitrogen compounds (NO and NO mainly). The latter are catalysts for the depletion of O. As a consequence (after), the host star light can penetrate the atmosphere, reaching the planet surface and thus inducing DNA modification. Side effects are induced by the increased opacity of the atmoshpere to visible light (due to the increase in NO), which would induce a global cooling effect and the precipitation of NO as acid rains which would damage plants, thus breaking fundamental biological chains.

Figure 3.
Global percentage reduction of the O column density. The shaded region is the envelope of the curves computed by Thomas & Melott [74] by considering different latitudes .
Figure 3.
Global percentage reduction of the O column density. The shaded region is the envelope of the curves computed by Thomas & Melott [74] by considering different latitudes .

Figure 4.
The lethal distance as a function of the fluence, shown by the colored solid lines for GRBs (red) and SNe (green and pink lines for Ibc and IIp, respectively). The shaded regions are obtained assuming a factor 10 variation on the assumed energy. The curves are derived from Equation (1), assuming the characteristic energy E was as labeled.

Figure 5.
Evolution of the galactic model’s radial distribution of the star formation surface density (left) and the metallicity (right). As a function of the galactocentric radius R and lookback time, the color codes are in units of and (both in logarithmic scale, as shown by the vertical color bars).

Figure 6.
Galactic distribution (as a function of the galacticentric radius and lookback time) of the number of lethal LGRBs (left) and combined SGRBs and SNe (right). The color coding refers to the vertical bar representing, at a linear scale, the number of events per bin of 0.5 Gyrs.
Figure 6.
Galactic distribution (as a function of the galacticentric radius and lookback time) of the number of lethal LGRBs (left) and combined SGRBs and SNe (right). The color coding refers to the vertical bar representing, at a linear scale, the number of events per bin of 0.5 Gyrs.

Figure 7.
Number of lethal events (combining GRBs, both long and short, and SNe) as a function of the galactocentrinc radius and lookback time (left panel). The shaded contours (referred to as the color bar on top of the plot) show the number of lethal events per bin of 0.5 Gyrs. The line contours (corresponding to the color bar at the bottom of the plot) show the surface number density of terrestrial planets around M stars (solid lines) and FGK stars (dashed lines). The current position of the solar system is marked by the yellow dot. The three right panels are artistic representations of the galaxy habitability in three representative epochs with a similar color cording for the upper bar (i.e., representing the number of lethal events).

Figure 8.
Number of lethal astrophysical transient events (solid red line) in the past 500 Myrs as a function of distance from the galactic center. The individual contributions of SGRBs (solid green line), LGRBs (solid yellow line), and SNe (solid orange line) are shown. The surface number densities of TPs around M stars (dashed dark blue line) and around FGK stars (dashed light blue line) are reported (right vertical axis). The vertical solid black line at 8 kpc marks the position of the solar system at which the total number of lethal events (predominantly LGRBs) is ∼1.3.


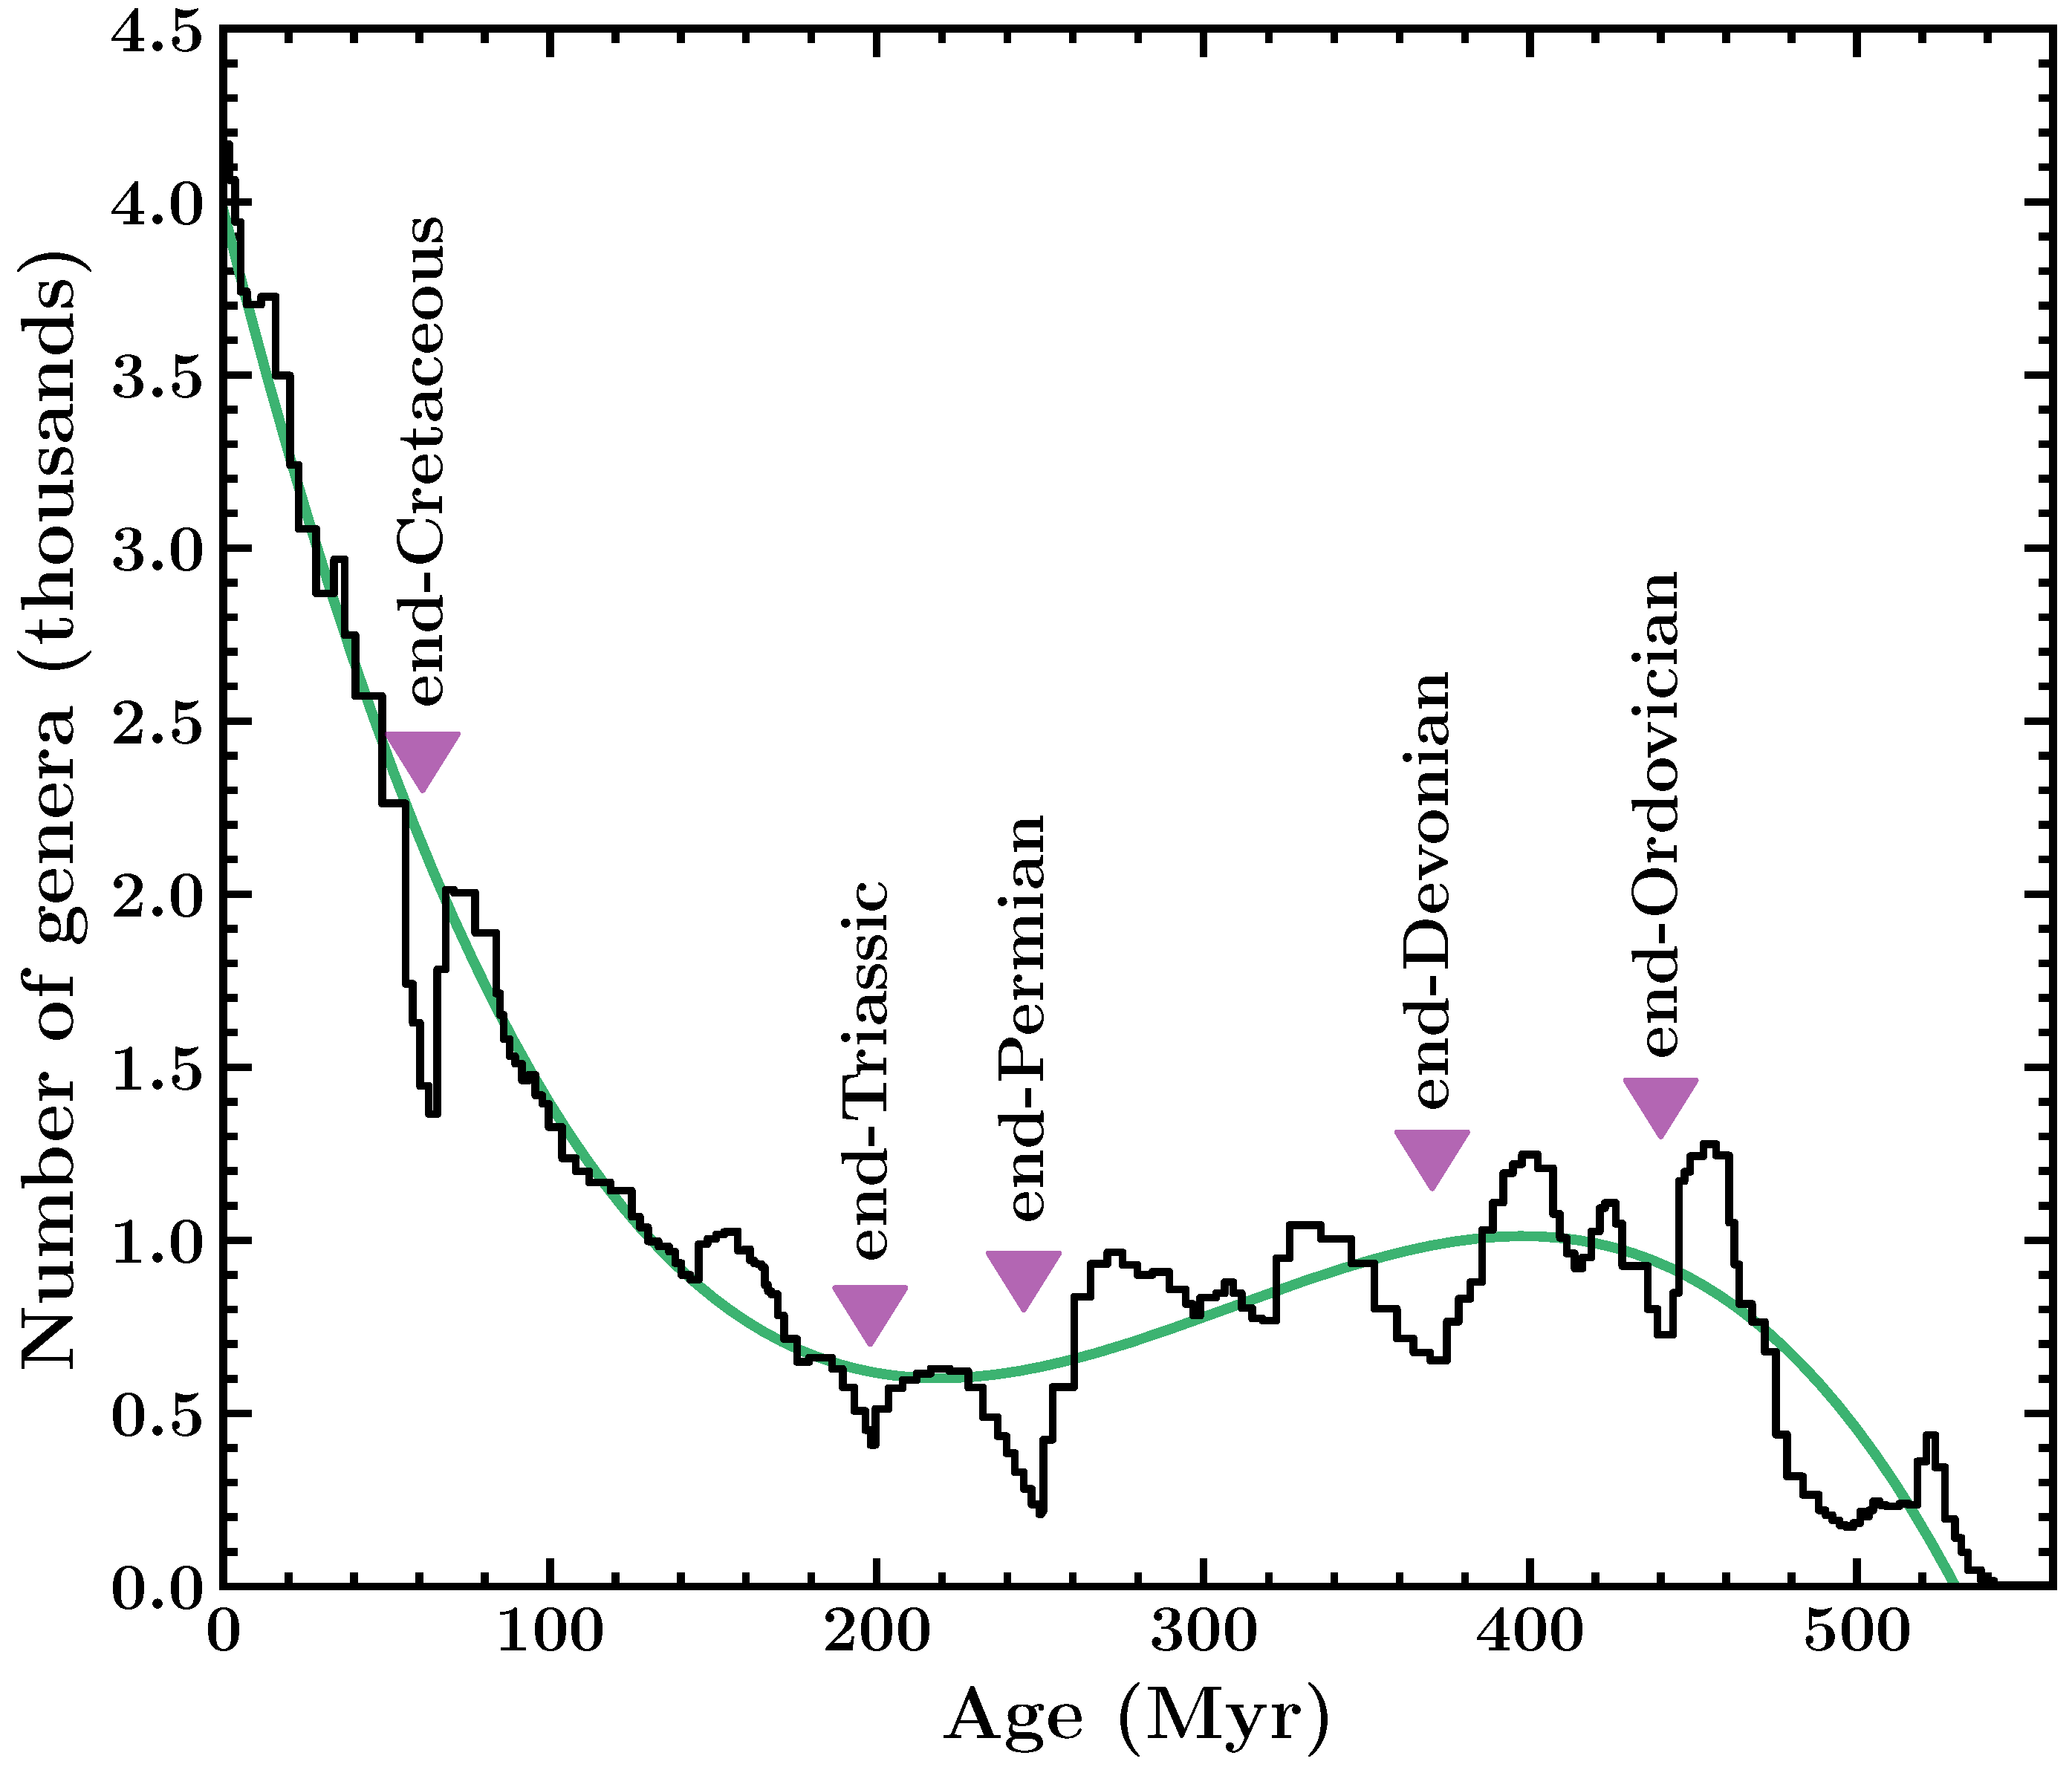
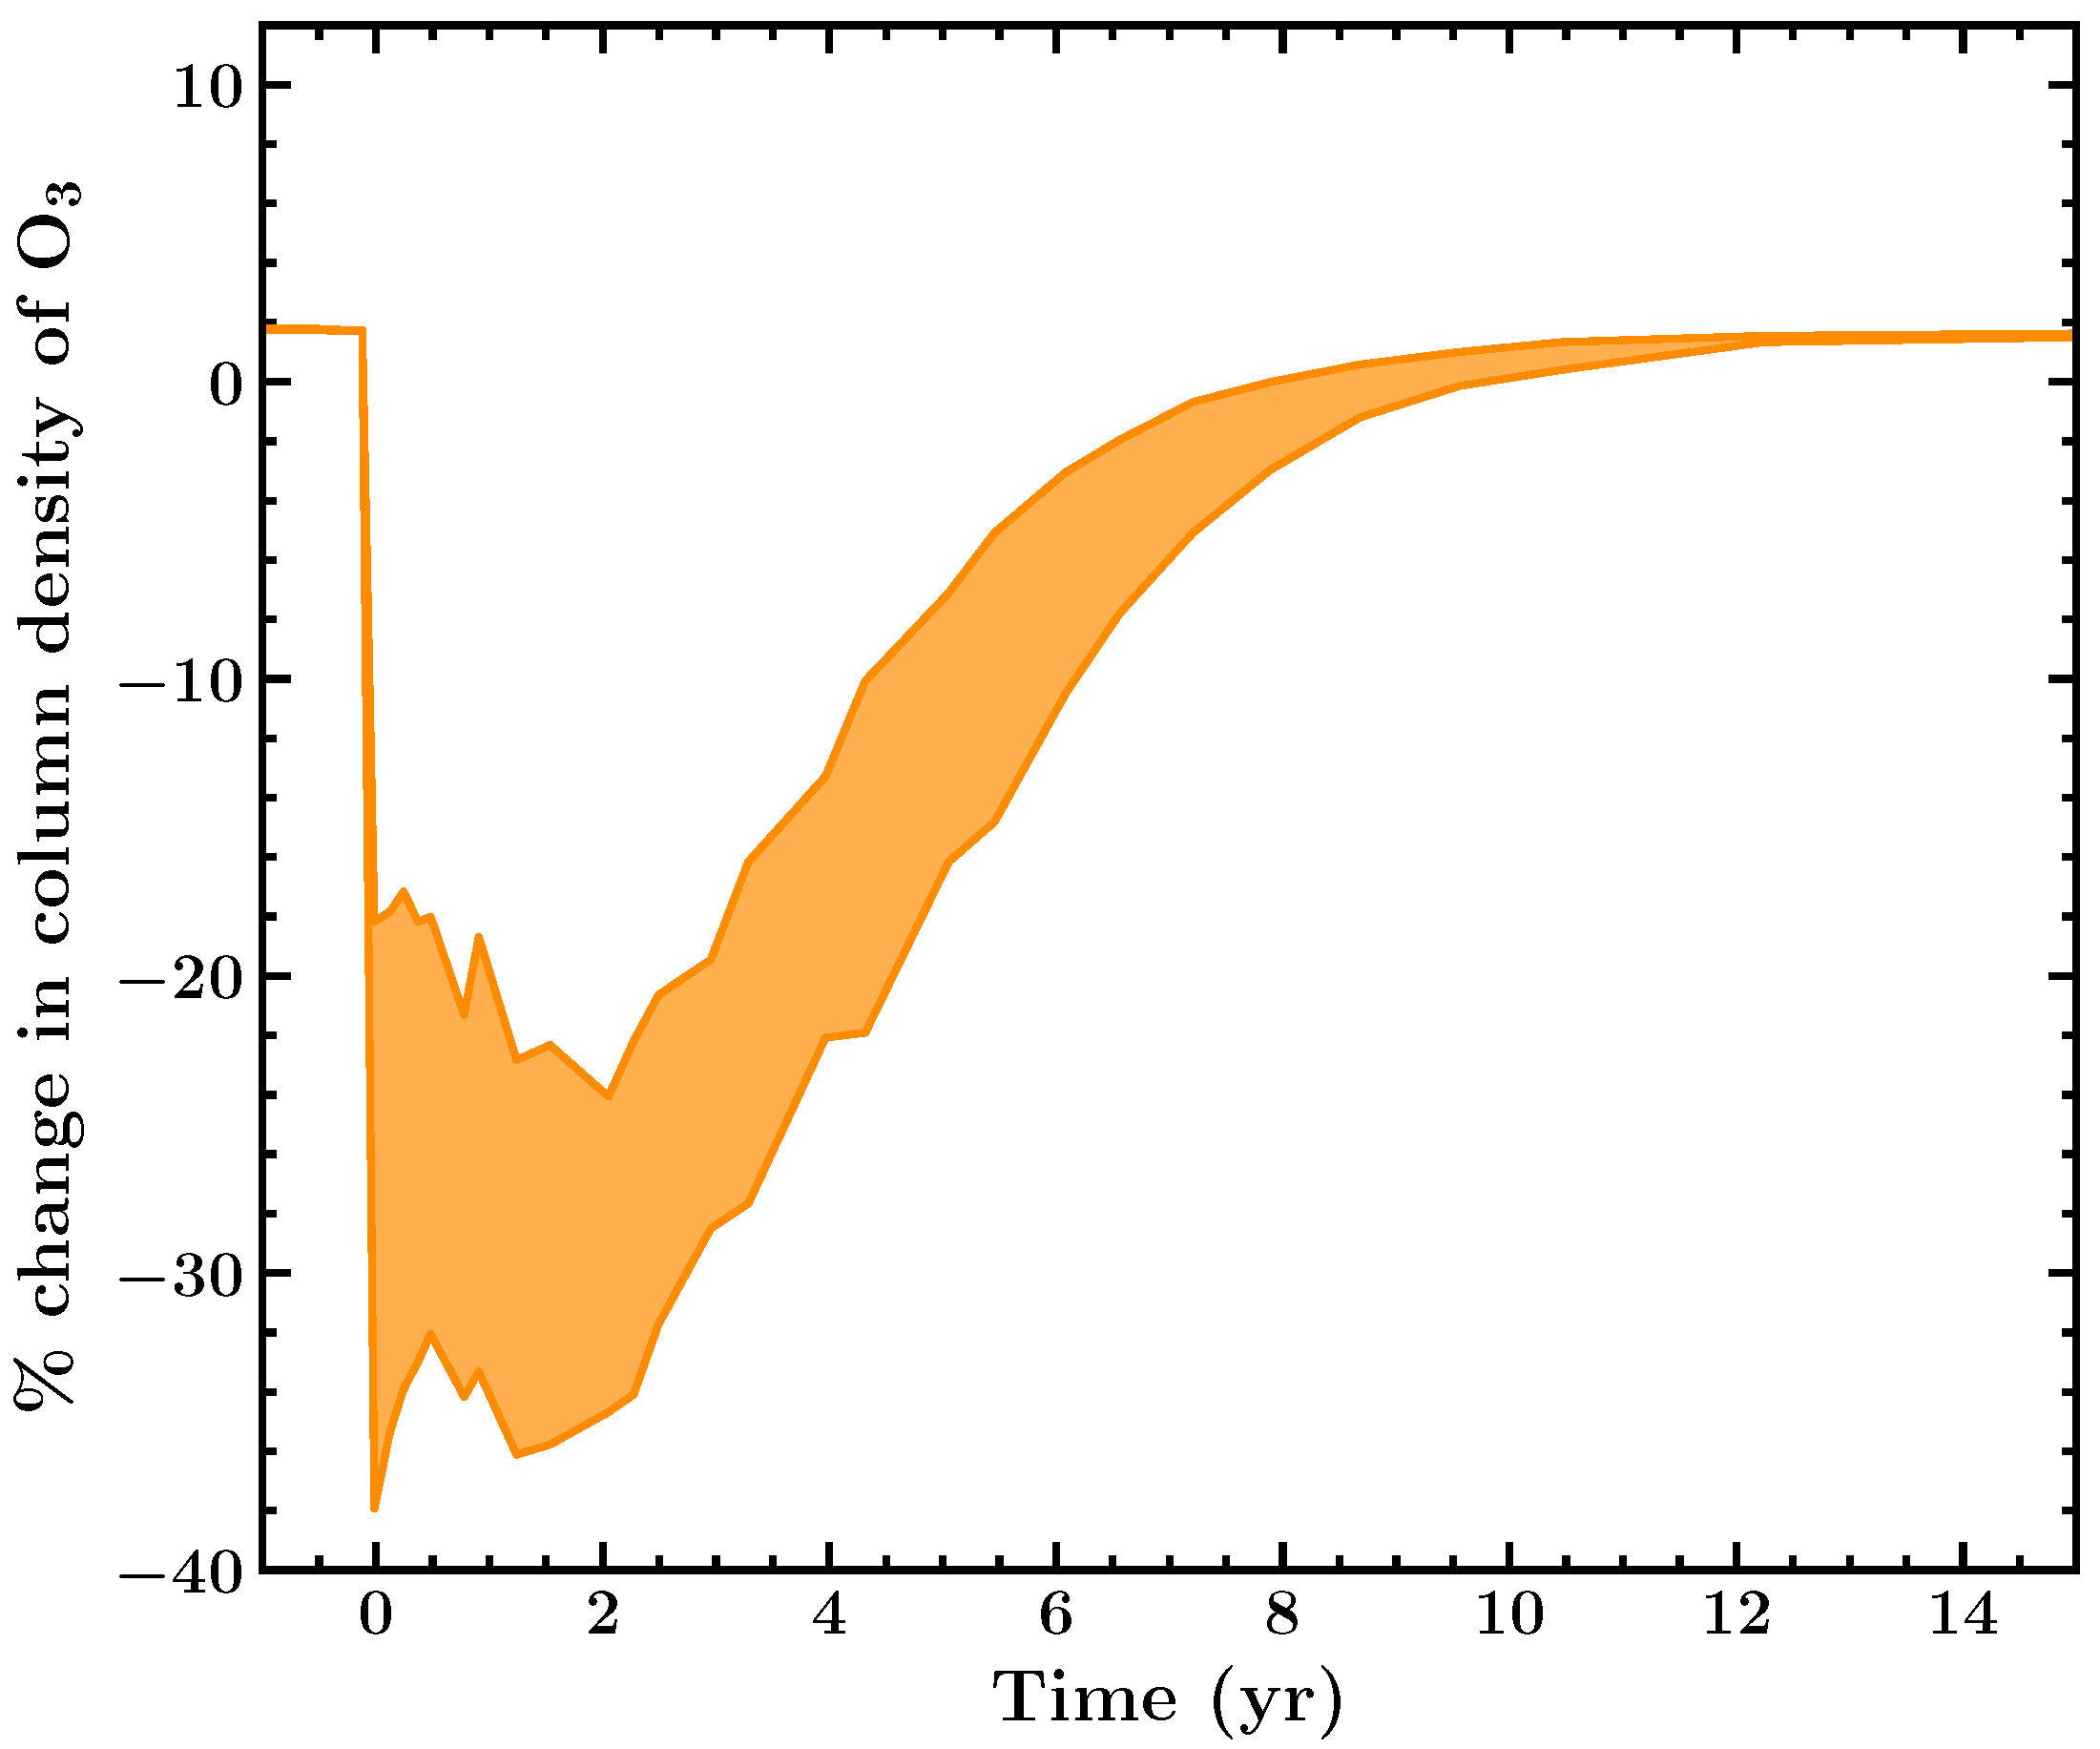
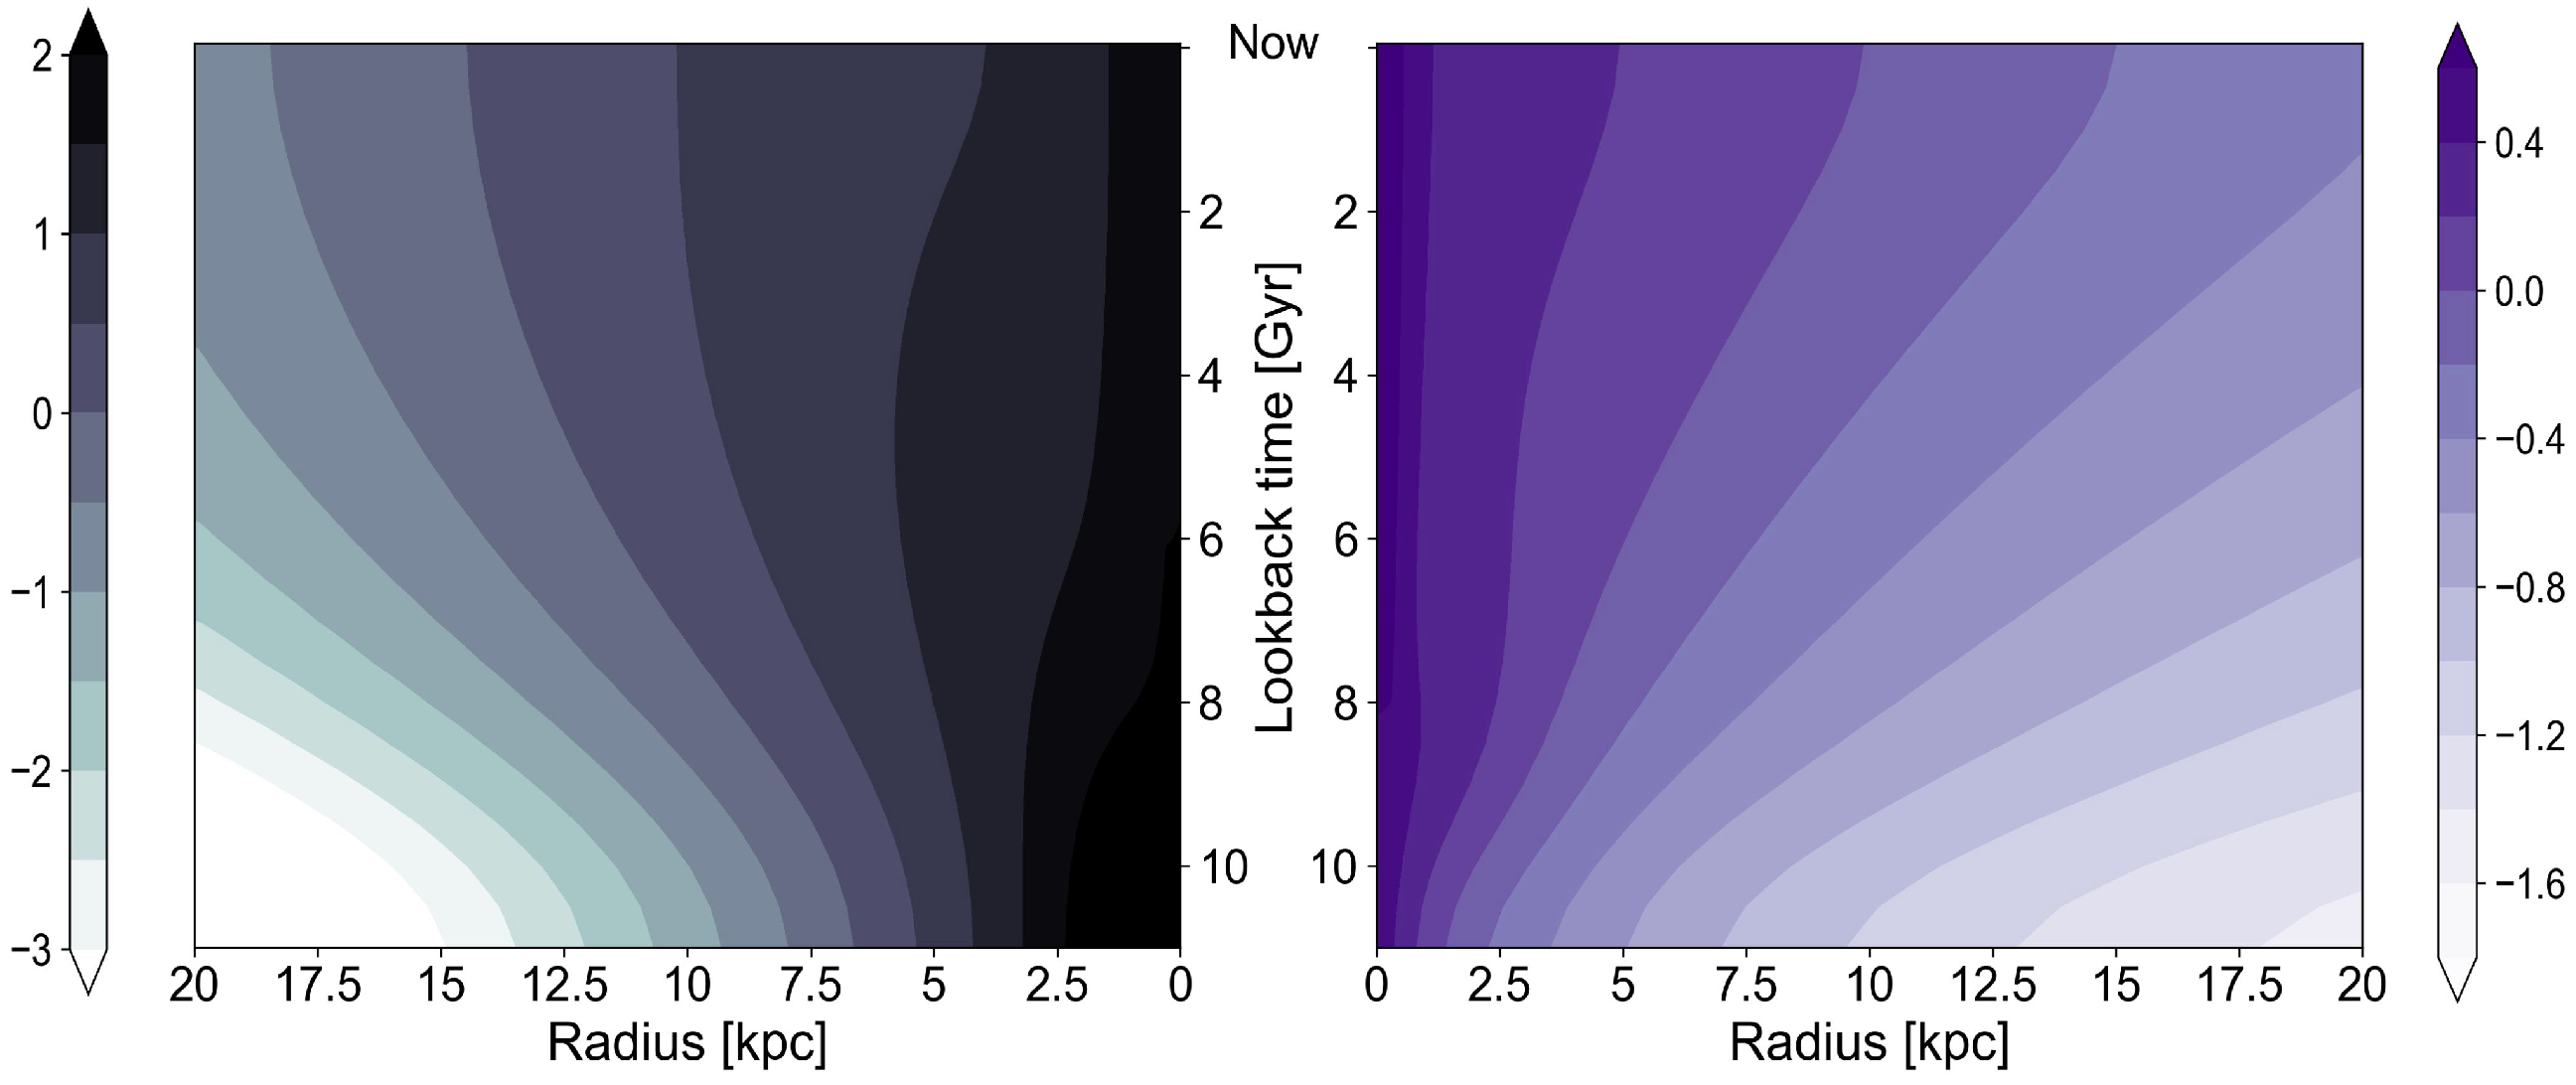
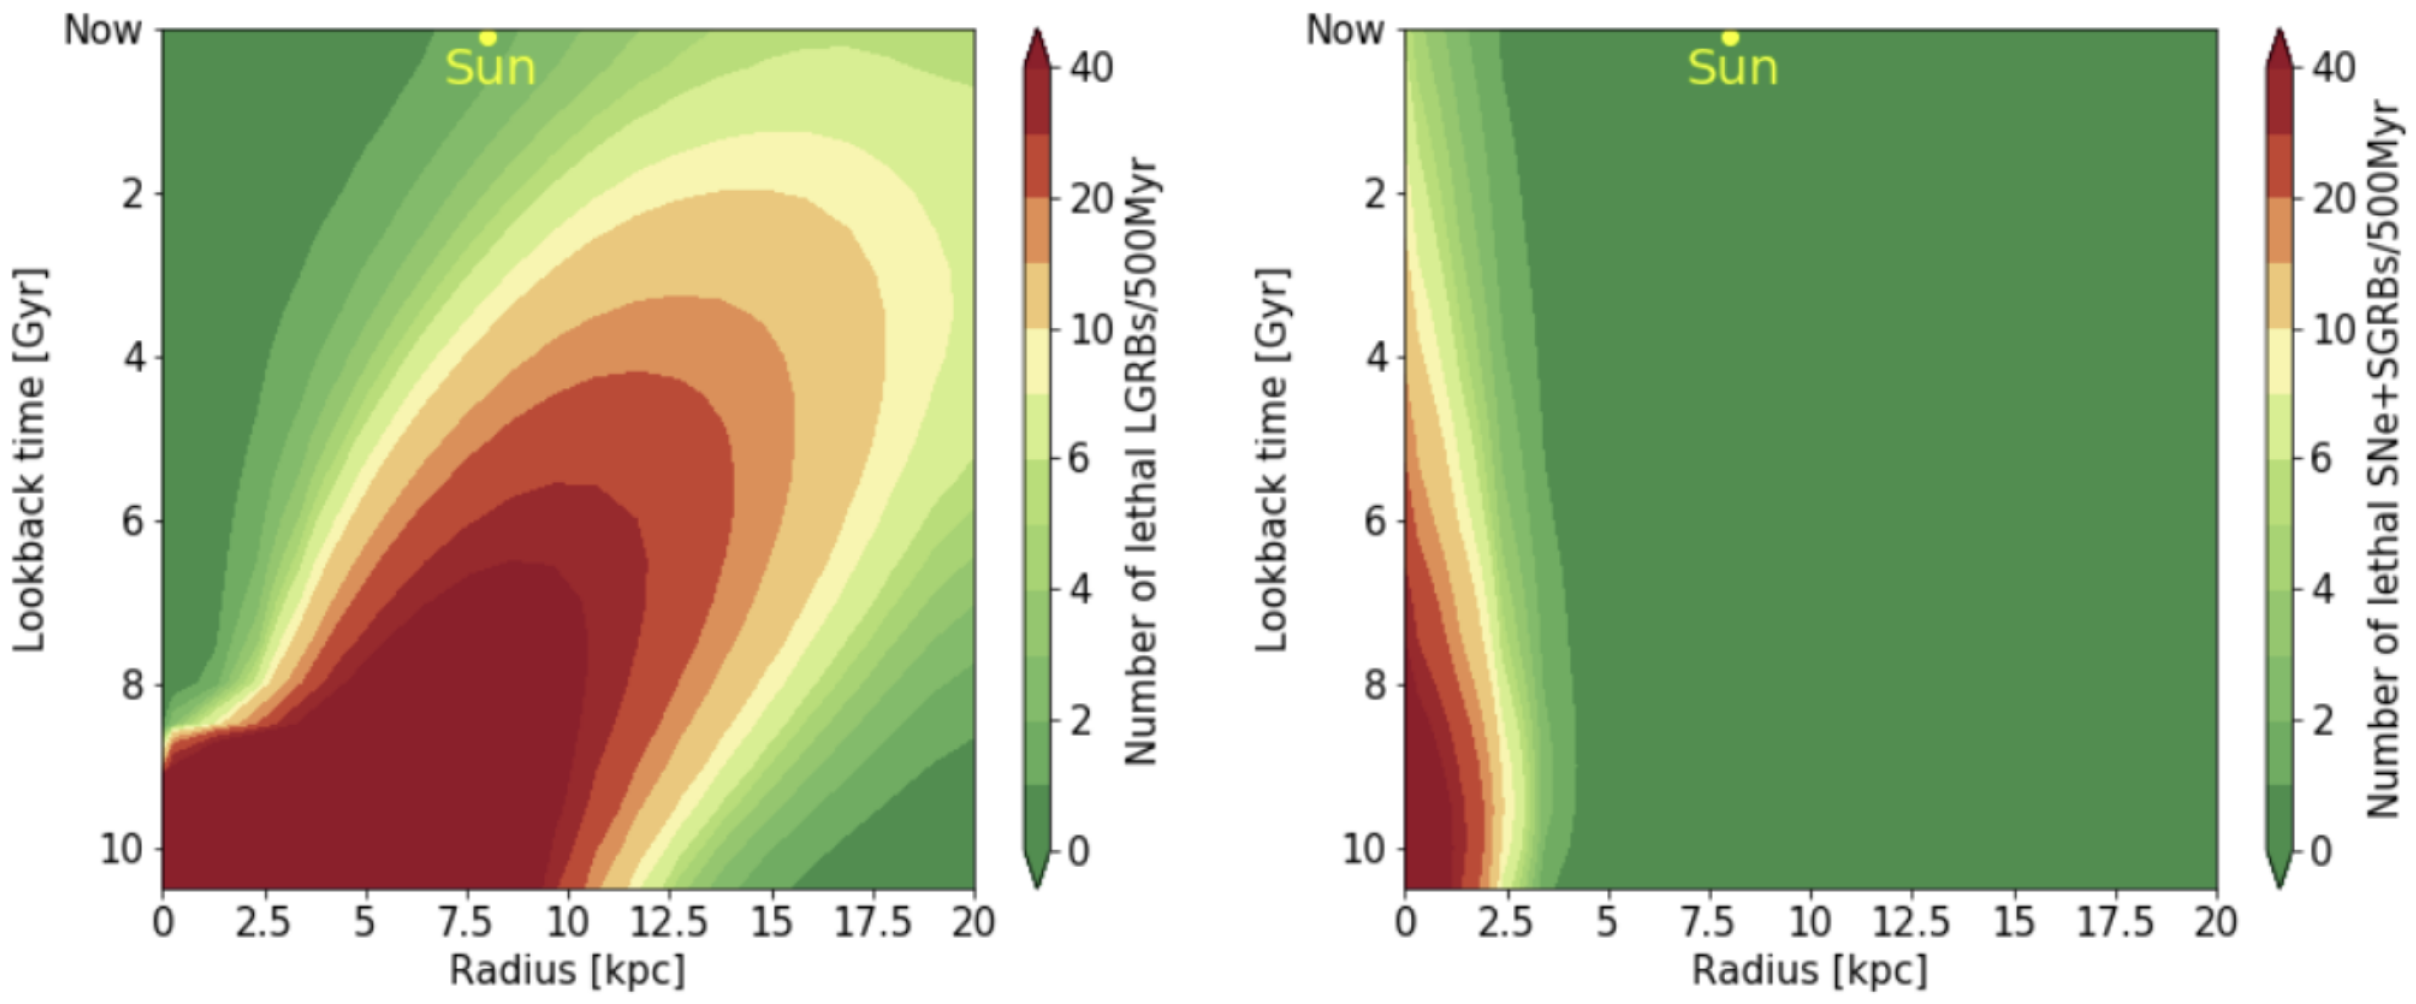
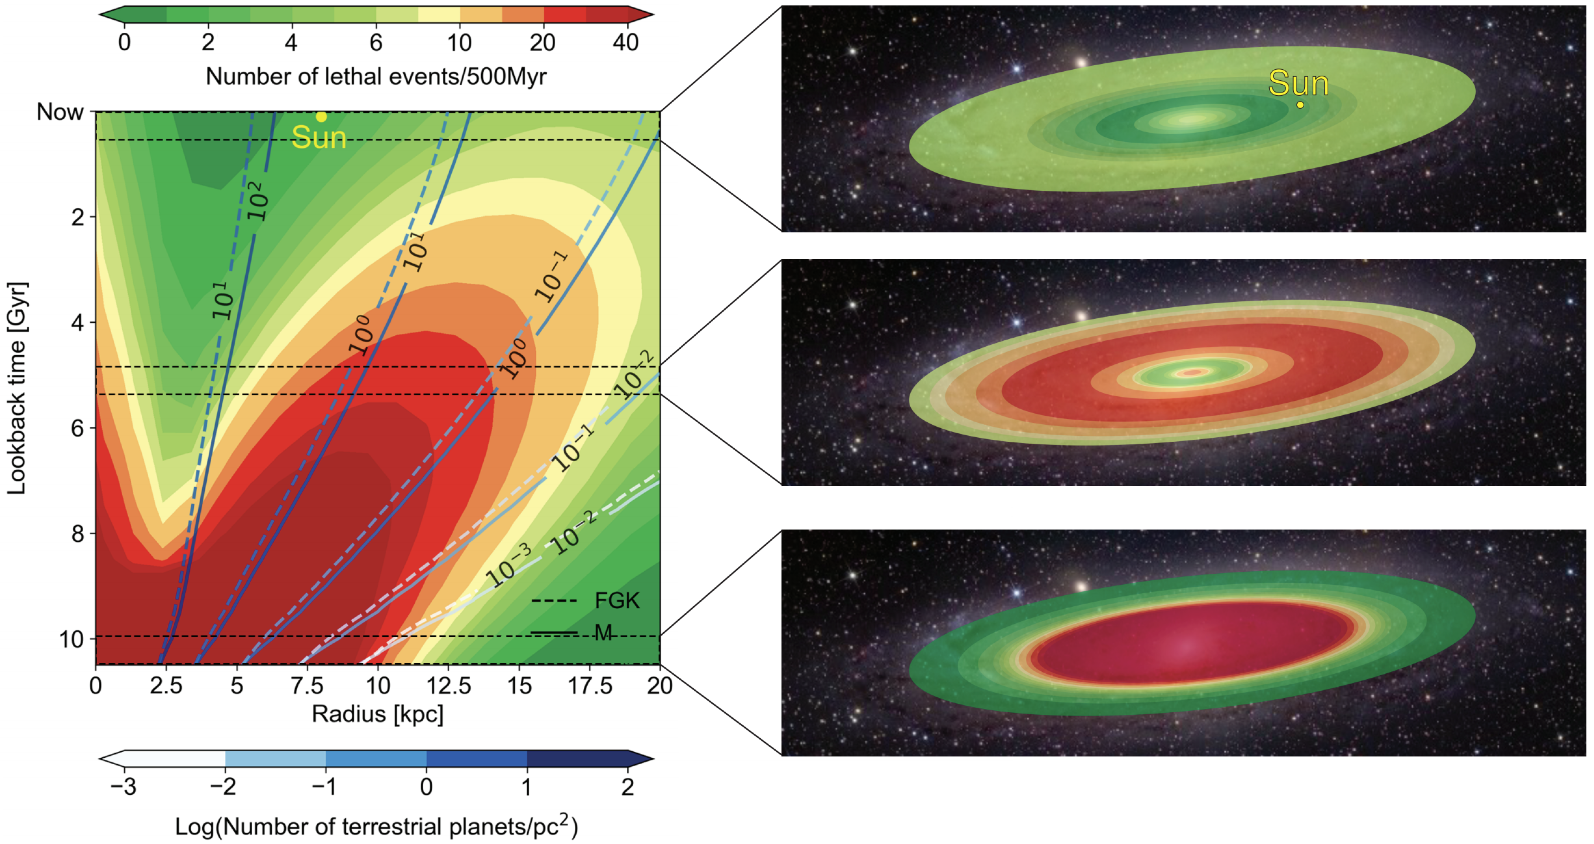
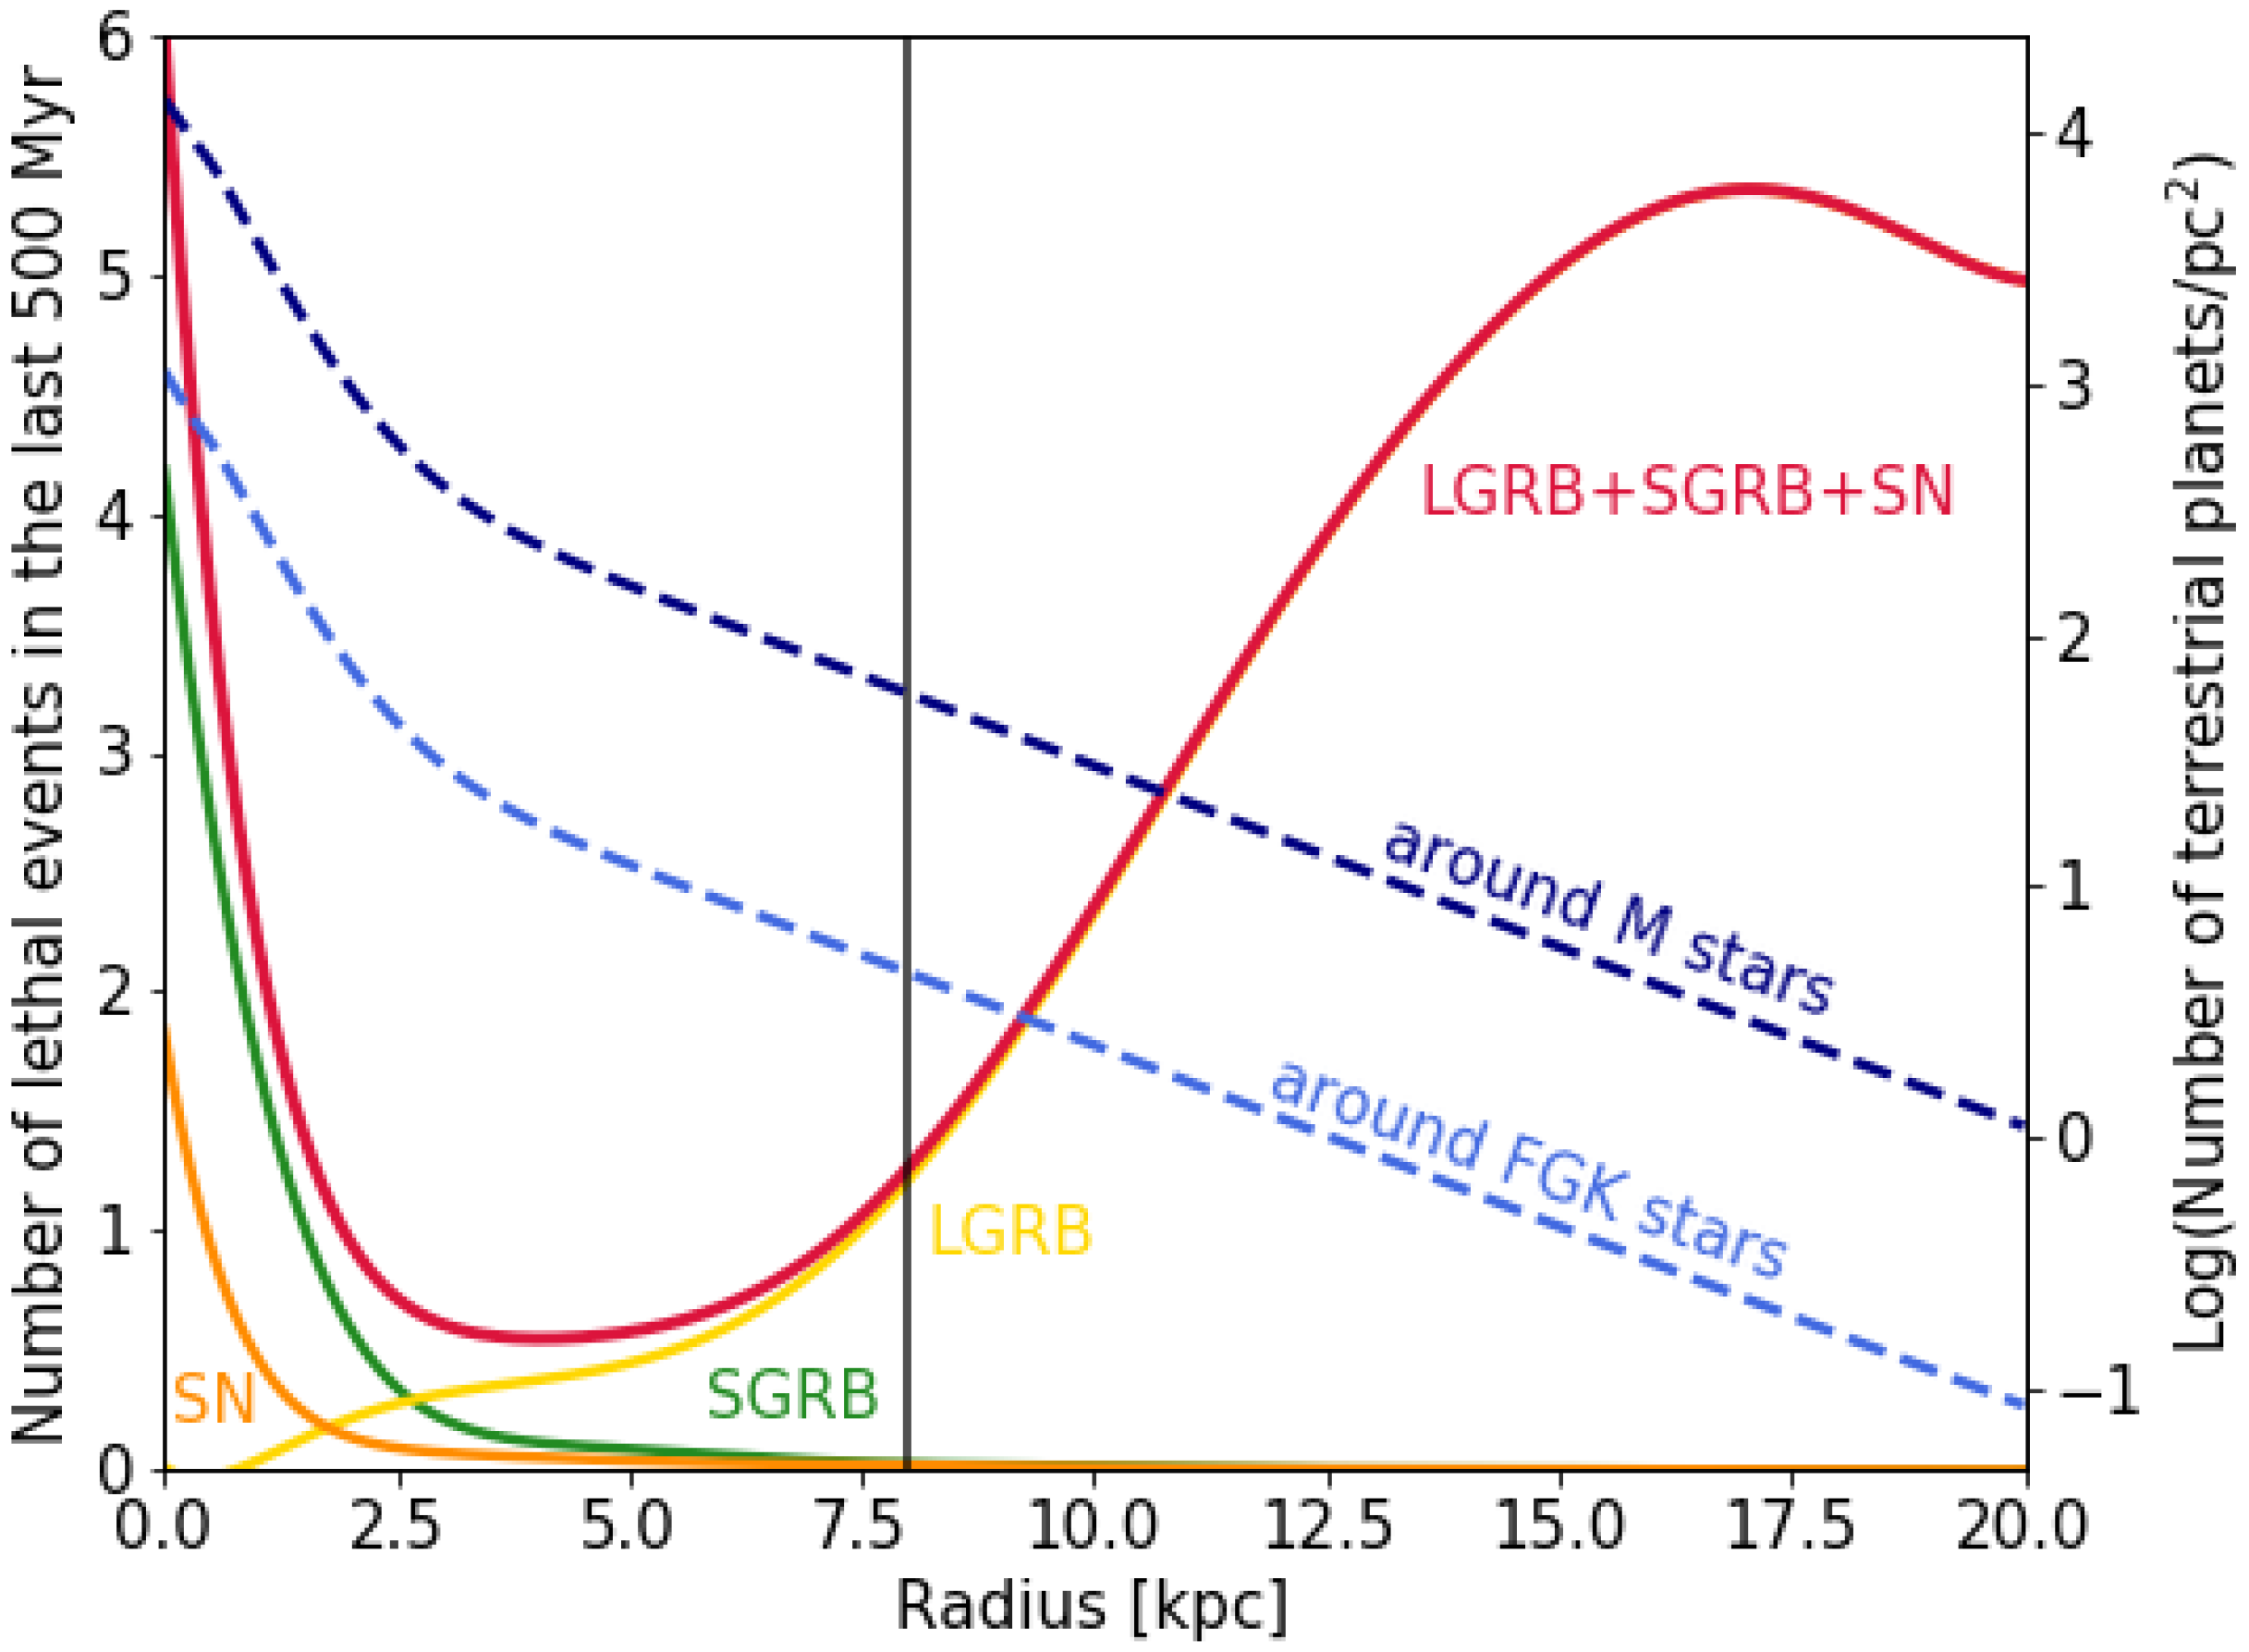
Table 1.
Summary of the most relevant literature dealing with the definition of the GHZ. The different effects of life-threatening events (GRBs and SNe) and the probability of forming terrestrial planets are accounted for (✔) or not (×) as marked. The assumptions for the spatial and temporal evolution of the star formation rate (SFR) and metallicity are also reported (ignored ×, assumed constant, or evolving with galacto-centric distance R and cosmic time t).
| Reference | GRBs | SNe | PF | SFR | Metallicity | GHZ (kpc) |
|---|---|---|---|---|---|---|
| Lineweaver et al. [68] | × | ✔ | ✔ | (R,t) | (R,t) | 7–9 |
| Prantzos [90] | × | ✔ | ✔ | (R,t) | (R,t) | Disk |
| Gowanlock et al. [93] | × | ✔ | ✔ | (R,t) | (R,t) | Outskirt |
| Spitoni et al. [91,92] | × | ✔ | ✔ | (R,t) | (R,t) | 9–11 |
| Piran Jimenez [35] | ✔ | × | × | × | Const | Outskirt |
| Li & Zhang [75] | ✔ | × | × | Const | Const | Outskirt |
| Morrison & Gowanlock [95] | × | ✔ | ✔ | (R,t) | (R,t) | ≈2.5 |
| Vukotić et al. [97] | × | ✔ | ✔ | (R,t) | (R,t) | Outskirt |
| Forgan et al. [96] | × | ✔ | ✔ | (R,t) | (R,t) | 2–13 |
| Spinelli et al. [50] | ✔ | ✔ | ✔ | (R,t) | (R,t) | 5–7 |
Table 2.
Parameters of the LGRB and SGRB broken power law luminosity function [53,55] and burst durations. is the rate density at .
| b | |||||||
|---|---|---|---|---|---|---|---|
| (Gpc yr) | (erg s) | (erg s) | (erg s) | (s) | |||
| LGRB | 1.3 ± 0.6 | 1.2 ± 0.9 | 2.4 ± 0.77 | 10 | 10 | 10 | 20 |
| SGRB | 0.3 ± 0.06 | 0.53 ± 0.88 | 3.4 ± 2.2 | (2.8 ± 2.1) × 10 | 5 × 10 | 10 | 2 |
Table 3.
Parameters to estimate lethal number of SNe: cosmic rate and burst energy () for each SN type, as reported in [34,57,58,114,115,116].
| SN Type | Rate (z = 0) | Burst Energy |
|---|---|---|
| (erg) | ||
| Ia | 2.2 ± 0.3 | 10 |
| Ibc | 2.6 ± 0.4 | 10 |
| IIp | 3.1 ± 0.5 | 10 |
Table 4.
Present-day Milky Way properties reproduced by the model: total mass in stars, total mass in gas, stellar surface density at the solar radius, gas surface density at the solar radius, and global star formation rate.
Table 4.
Present-day Milky Way properties reproduced by the model: total mass in stars, total mass in gas, stellar surface density at the solar radius, gas surface density at the solar radius, and global star formation rate.
| Property | Value |
|---|---|
| M | M |
| M | M |
| 35 M | |
| 15 M | |
| SFR | 3 M |
Disclaimer/Publisher’s Note: The statements, opinions and data contained in all publications are solely those of the individual author(s) and contributor(s) and not of MDPI and/or the editor(s). MDPI and/or the editor(s) disclaim responsibility for any injury to people or property resulting from any ideas, methods, instructions or products referred to in the content. |
© 2023 by the authors. Licensee MDPI, Basel, Switzerland. This article is an open access article distributed under the terms and conditions of the Creative Commons Attribution (CC BY) license (https://creativecommons.org/licenses/by/4.0/).
Share and Cite
MDPI and ACS Style
Spinelli, R.; Ghirlanda, G. The Impact of GRBs on Exoplanetary Habitability. Universe 2023, 9, 60. https://doi.org/10.3390/universe9020060
AMA Style
Spinelli R, Ghirlanda G. The Impact of GRBs on Exoplanetary Habitability. Universe. 2023; 9(2):60. https://doi.org/10.3390/universe9020060
Chicago/Turabian StyleSpinelli, Riccardo, and Giancarlo Ghirlanda. 2023. "The Impact of GRBs on Exoplanetary Habitability" Universe 9, no. 2: 60. https://doi.org/10.3390/universe9020060
Note that from the first issue of 2016, this journal uses article numbers instead of page numbers. See further details here.