Article

Evaluating the Factors Affecting QoE of 360-Degree Videos and Cybersickness Levels Predictions in Virtual Reality

1
School of Information and Electronics, Beijing Institute of Technology, Beijing 100080, China
2
Department of Computer Science, Bahria University Karachi Campus, Karachi 75260, Pakistan
3
Faculty of Computing, Riphah International University, Faisalabad 38000, Pakistan
*
Author to whom correspondence should be addressed.
Current address: Department of Electrical Engineering, University of Science and Technology Bannu, Khyber Pakhtunkhwa 28100, Pakistan.
Electronics 2020, 9(9), 1530; https://doi.org/10.3390/electronics9091530
Submission received: 10 August 2020 / Revised: 11 September 2020 / Accepted: 15 September 2020 / Published: 18 September 2020
(This article belongs to the Section Computer Science & Engineering)

Abstract

:
360-degree Virtual Reality (VR) videos have already taken up viewers’ attention by storm. Despite the immense attractiveness and hype, VR conveys a loathsome side effect called “cybersickness” that often creates significant discomfort to the viewers. It is of great importance to evaluate the factors that induce cybersickness symptoms and its deterioration on the end user’s Quality-of-Experience (QoE) when visualizing 360-degree videos in VR. This manuscript’s intent is to subjectively investigate factors of high priority that affect a user’s QoE in terms of perceptual quality, presence, and cybersickness. The content type (fast, medium, and slow), the effect of camera motion (fixed, horizontal, and vertical), and the number of moving targets (none, single, and multiple) in a video can be the factors that may affect the QoE. The significant effect of such factors on end-user QoE under various stalling events (none, single, and multiple) is evaluated in a subjective experiment. The results from subjective experiments show a notable impact of these factors on end-user QoE. Finally, to label the viewing safety concern in VR, we propose a neural network-based QoE prediction method that can predict the degree of cybersickness influenced by 360-degree videos under various stalling events in VR. The performance accuracy of the proposed method is then compared against well-known Machine Learning (ML) algorithms and existing QoE prediction models. The proposed method achieved a 90% prediction accuracy rate and performed well against existing models and other ML methods.

1. Introduction

With the cost decrease of Head Mounted Displays (HMD) and the growing attention of Virtual Reality (VR) videos, fascination in 360-degree videos has been escalating on popular streaming and content providing platforms such as YouTube and Facebook. Such videos watched through HMD allows users to view the vast region of 360-degree videos and to immerse oneself in a VR environment fully. However, streaming these videos is challenging for service and content providers because 360-degree videos require full spherical coverage and should have 4K or higher resolution to offer a satisfactory level of Quality-of-Experience (QoE) for end-user. Therefore, streaming and processing 360-degree video in VR is ambitious.
QoE is the degree of delight or annoyance of the user of an application or service. It results from the fulfillment of his or her expectations with respect to the utility and/or enjoyment of the application or service in the light of the user’s personality and current state [1]. Various factors influence QoE and it is vital to comprehend and evaluate the QoE-affecting factors of 360-degree videos. Since it is puzzling that not all affecting factors can be identified in a single research study, an essential set of affecting factors should be addressed and evaluated in terms of their influence on end-user QoE. Many research studies evaluated various factors that affect the QoE of traditional 2D videos [2,3,4]. Key QoE aspects such as perceptual quality has been the focus of research while investigating the QoE of traditional video. Perceptual quality indicates the viewer’s perception and satisfaction about video quality being watched. QoE evaluation of 360-degree video is different in many aspects from traditional videos; two key QoE-aspects such as presence and cybersickness should be investigated. Cybersickness is the feeling of nausea or dizziness while presence indicates the “sense of being there” in a VR environment. To evaluate QoE cybersickness is the main difference between traditional and 360-degree videos. Both cybersickness and presence are the main different QoE-aspects of the viewer’s experience between watching traditional videos and 360-degree videos. Therefore, in this manuscript, we also addressed the presence and cybersickness aspects of QoE along with perceptual quality.
Cybersickness happens when the viewers immerse themselves in the VR and visually perceive that they are moving through a virtual environment, even though they are physically stationary. Different methods have been used in the literature [5,6] to calculate cybersickness, but the most comprehensive is the Simulator Sickness Questionnaire (SSQ) presented in [5]. Therefore, to offer satisfactory VR services to end-users, the rendering safety of 360-degree videos in VR is a critical concern. It is significant to develop a predictive technique that can predict the level of cybersickness and to evaluate the problem of viewing safety in VR.
In recent years, the most promising technique for most of the video-on-demand services and video sharing websites is HTTP-based video streaming [2]. Unlike User Datagram Protocol (UDP)-based streaming, Transmission Control Protocol (TCP)-based streaming avoids packet loss and minimizes the quality degradation of video while it frees the video decoder. However, due to bandwidth limitations and network fluctuation, unexpected playback interruption occurs also called stalling [7], which can significantly affect the end-user QoE [8,9,10,11]. Although several HTTP Adaptive Streaming (HAS) methods have been developed to overcome the risk of stalling through bitrate adaptation, HTTP-based streaming technology has still failed to mitigate stalling during playback [12] totally. Viewport adaptive streaming is a prevalent technique used for 360-degree video. This technique reserves high-quality videos for viewport while other parts are delivered in lower quality [13]. A tile-based streaming method is a widespread technique and has been used for viewport adaptive streaming [14,15,16,17], this technique splits the video frame into multiple tiles (blocks) in space and these tiles are then encoded into various bitrate segments. Tile-based streaming is more flexible and still failed to deliver 360-degree videos in high QoE. Stalling is the main issue that arises from the tile-based streaming method under a small playback buffer due to the short-term constraint of viewport prediction. Stalling is unacceptable compared to frame reduction [18]. In addition, viewers are more sensitive and less tolerant to stalling while more tolerant about an increase in the rate of quantization parameters [19]. Hence, researchers must investigate the critical QoE-affecting factors under different stalling events for 360-degree videos. Therefore, we also address the effect of various stalling events on users QoE in terms of presence, perceptual quality, and cybersickness.
Studies on 360-degree videos QoE-aspects and affecting factors in the existing literature [20,21,22,23] is still minimal. The majority of the existing research focus on perceptual quality [20,24]. In addition, some work targeted the cybersickness aspect [24,25,26,27] and presence aspect [28]. These studies evaluated the impact of various QoE-affecting factors on perceptual quality, presence, and cybersickness. These research mentioned above will be discussed in detail in Section 2. So far, no existing study has evaluated the impact of content type, camera motion, and moving targets under various stalling events. However, the influence of various stalling events on cybersickness has not been investigated in the literature. How much the impact of these factors affecting the users QoE while watching 360-degree videos in VR is still unclear, but expectations are incredibly high. Therefore, it is entirely meaningful to consider and address the impact of these factors on users QoE for 360-degree videos in VR. In this manuscript, we aim to investigate the influence of significant QoE-affecting factors on users QoE under various stalling events (no stalling, single long stalling, and multiple short stalling) in VR. These factors include content type (fast, medium, and slow), camera motion (fixed, vertical, and horizontal), and the number of moving targets (no target, single target, and multiple targets). We evaluate the impact of these factors on three key QoE-aspects: Cybersickness, perceptual quality, and presence. Our primary focus is to investigate various QoE-affecting factors on user’s cybersickness level under different stalling events. We aim to propose a method that predicts the effect of these factors on QoE in terms of cybersickness. Our main contributions are threefold.
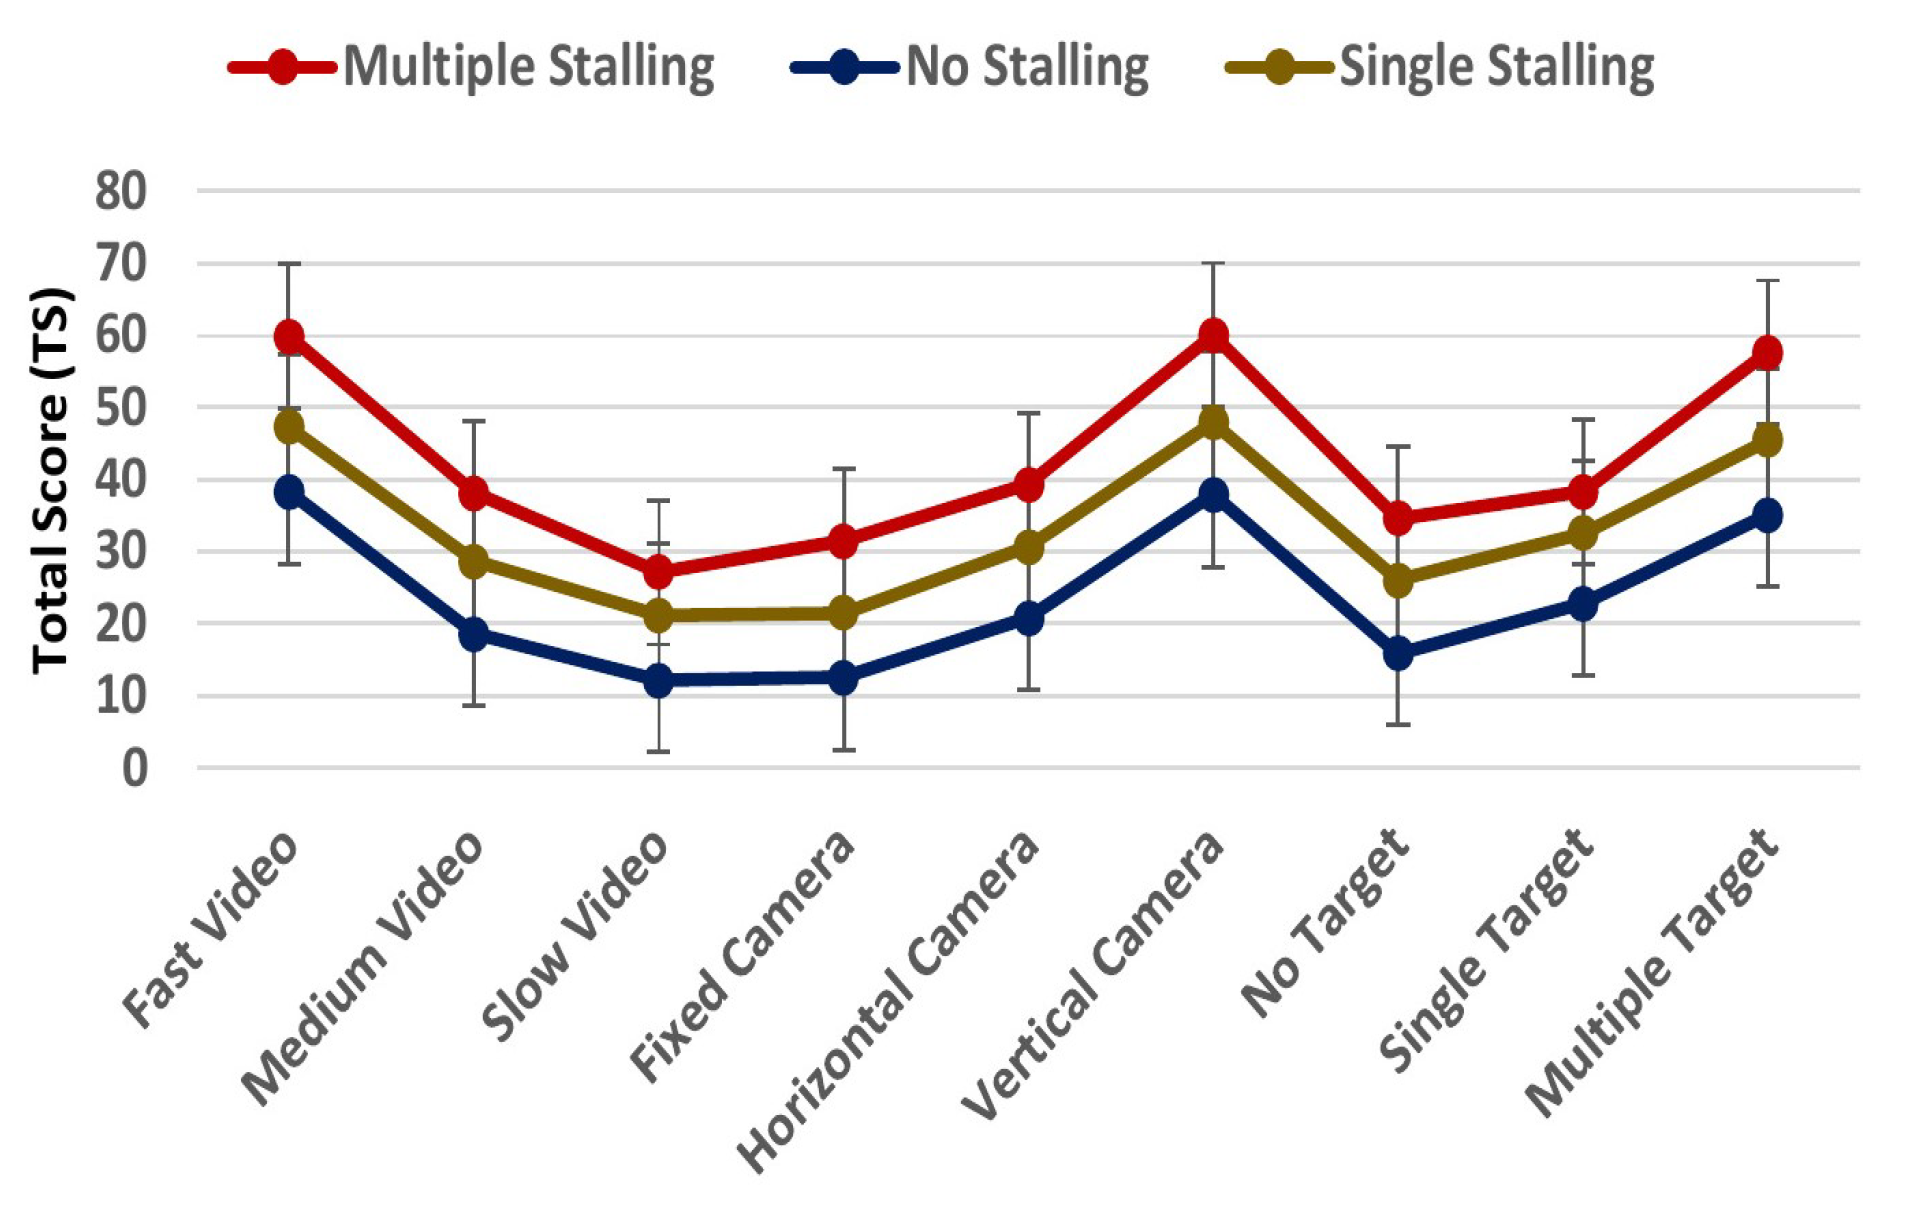
  • First, we simulate two different types of stalling events including one long stalling of 9-s and three short stalling of 3-s each ( 3 × 3 s) in nine different types of 360-degree videos to cover various influencing factors that affect the users QoE in the VR. The impact of these factors under various stalling events on users’ QoE is investigated. To the best of our knowledge, no previous studies have addressed the effect of stalling on the user’s cybersickness level for 360-degree videos in VR;
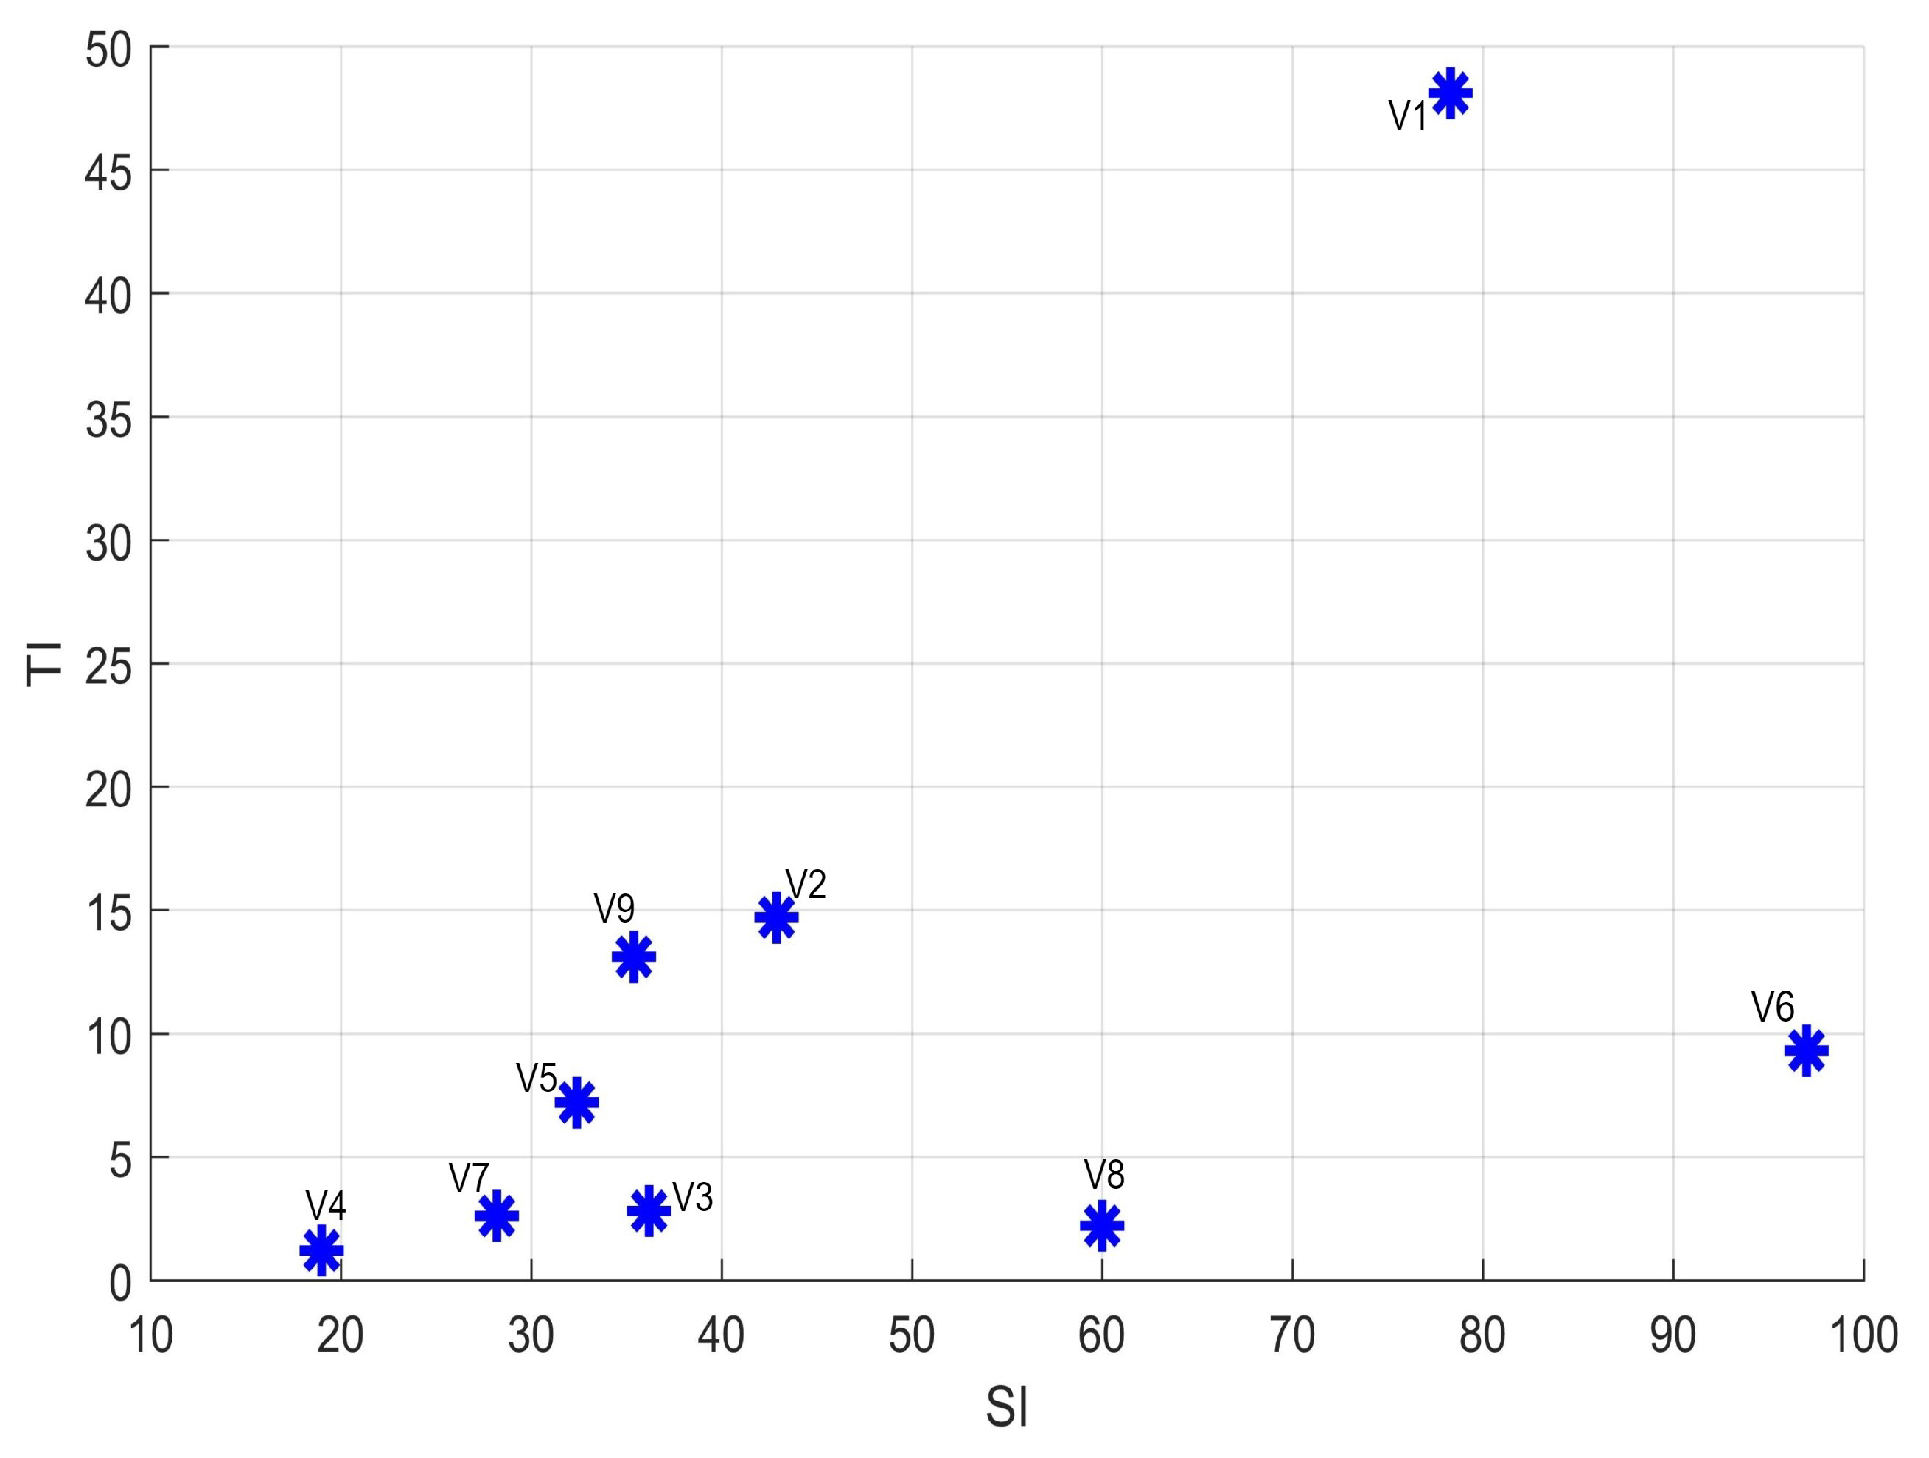
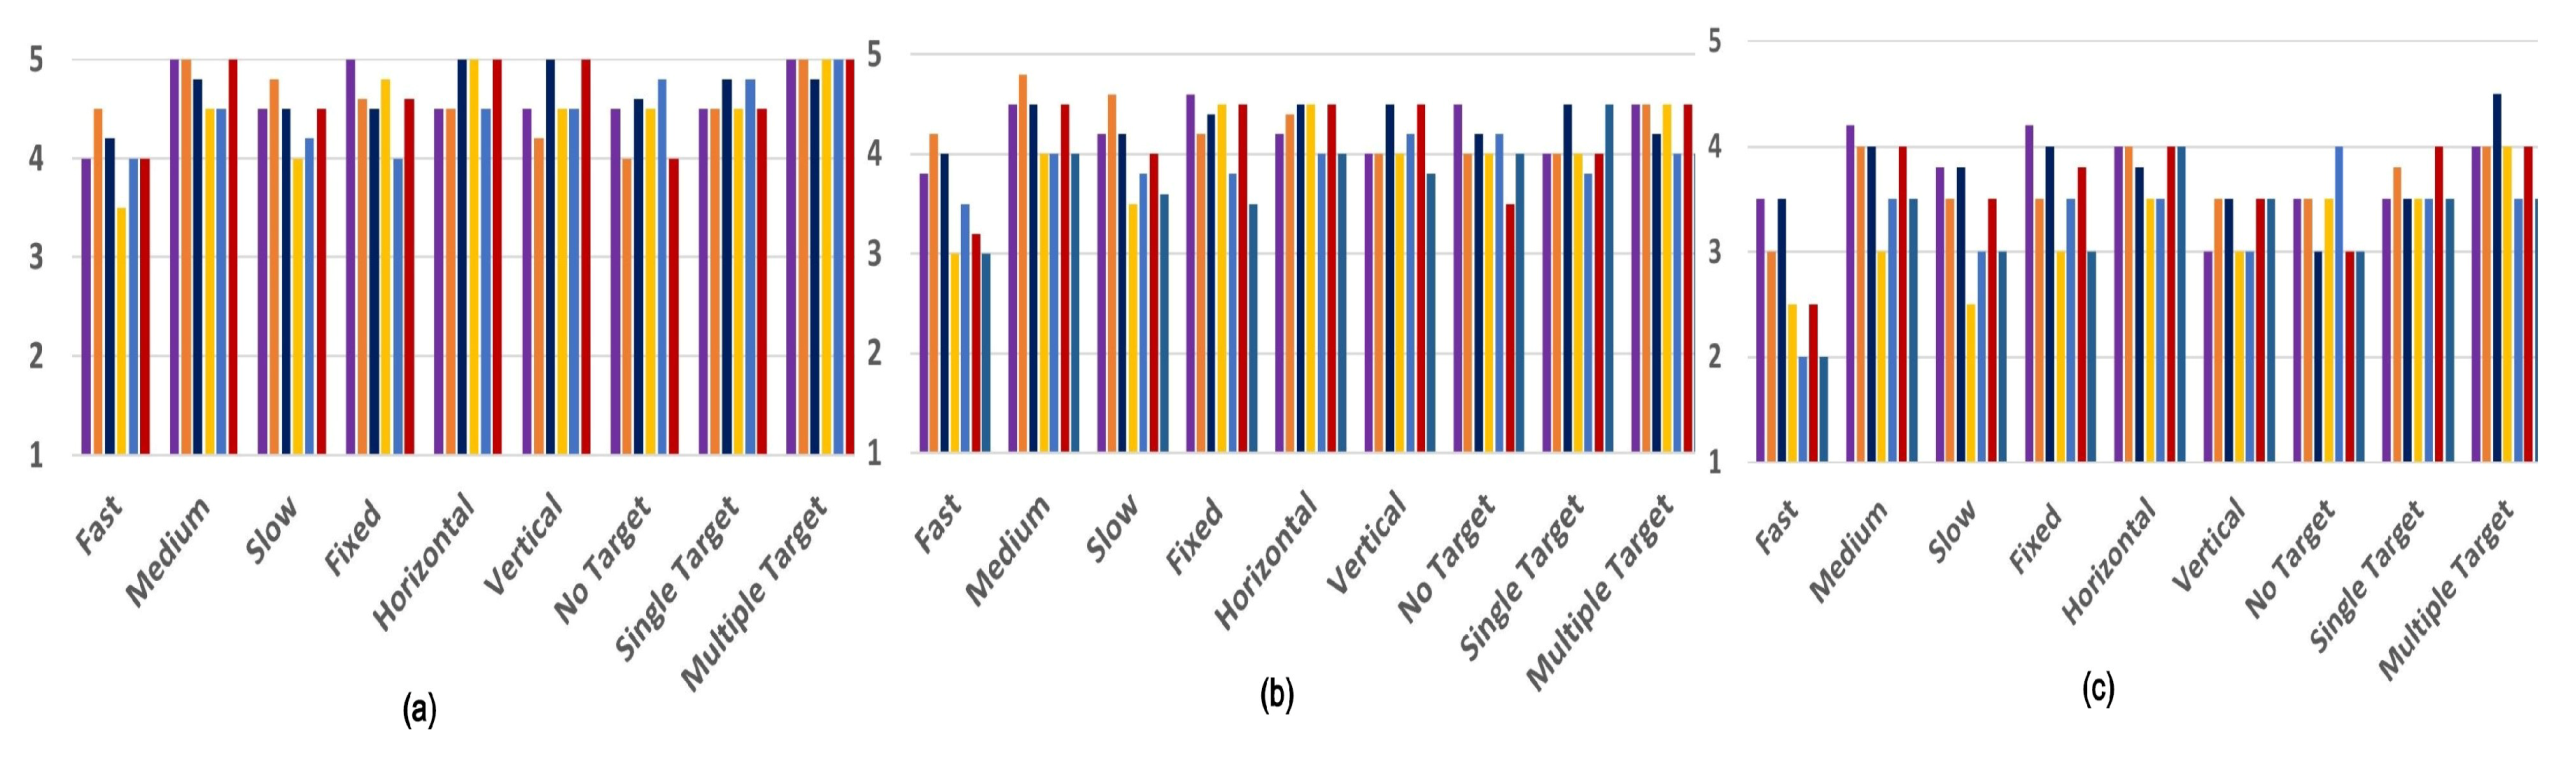
  • Second, we conduct a subjective experiment including 40 subjects and investigate the impact of content type (fast, medium, and slow), camera motion (fixed, vertical, and horizontal), and the number of moving targets (no target, single target, and multiple targets) on users’ QoE. The QoE is then evaluated in terms of three significant aspects, such as perceptual quality, presence, and cybersickness;
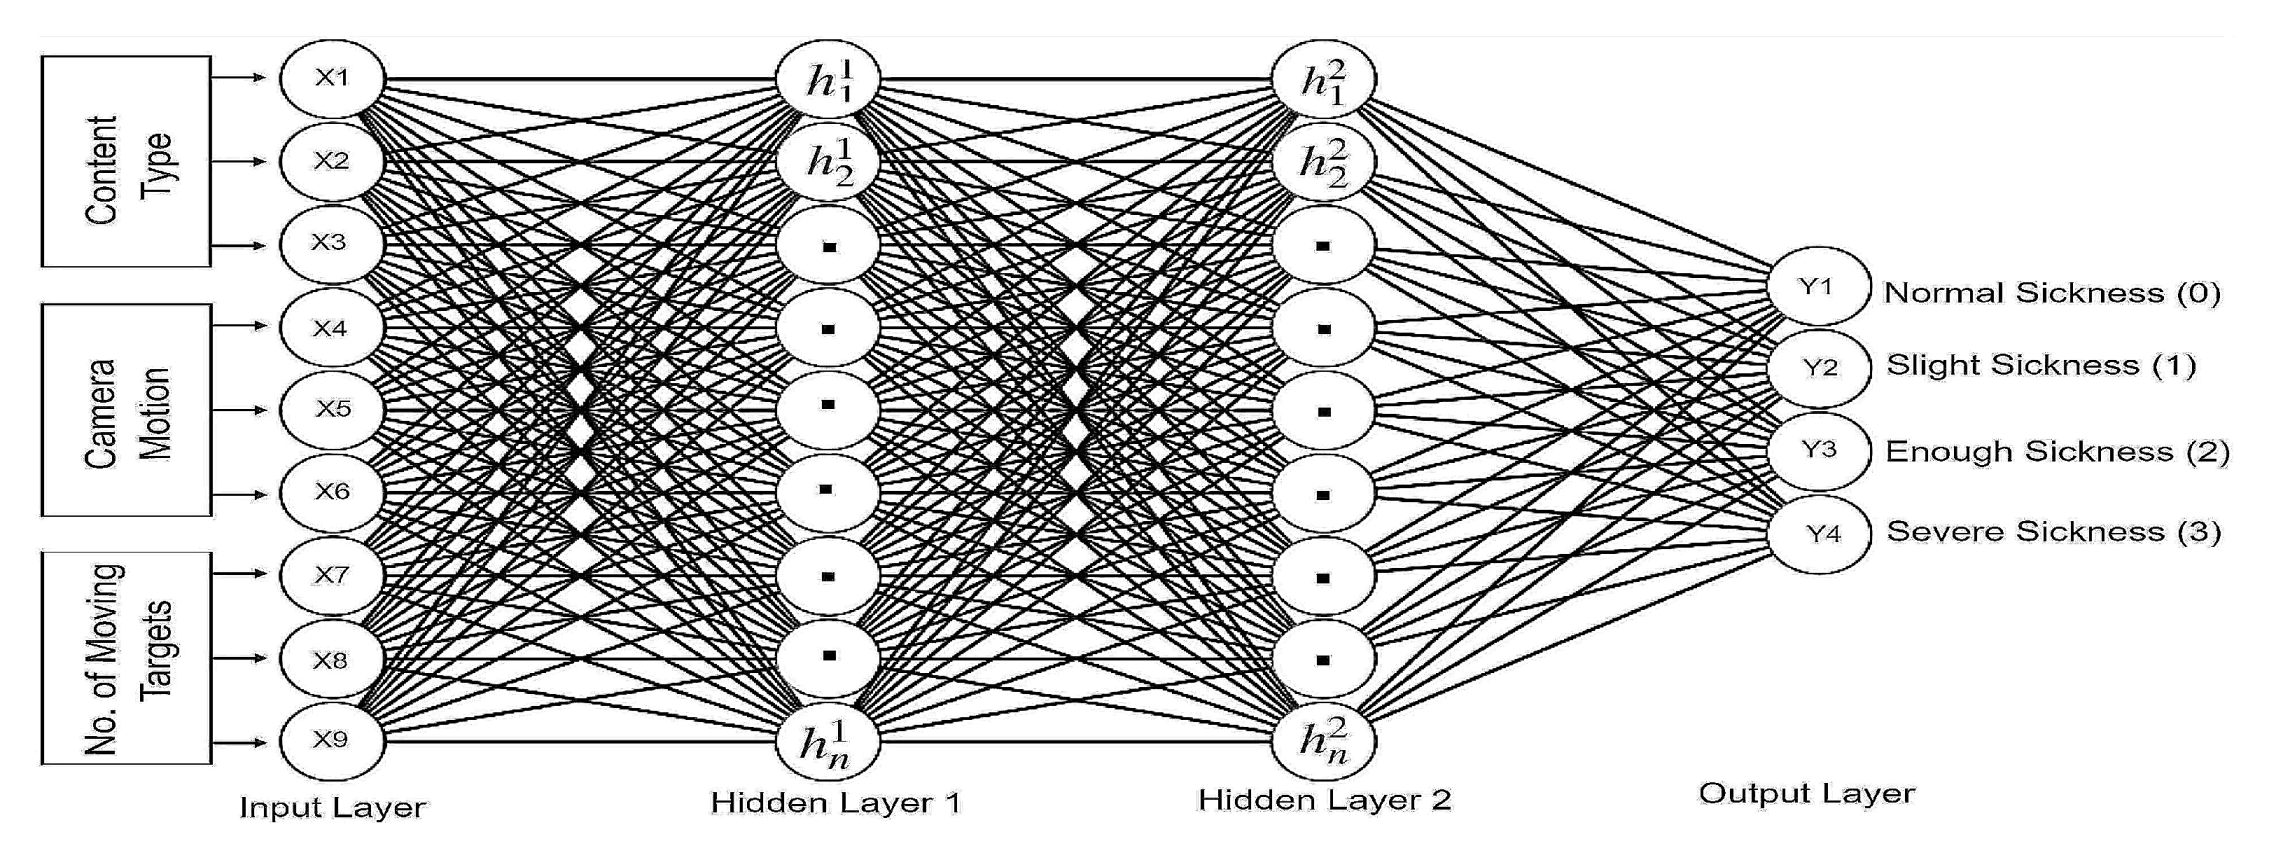
  • Third, to evaluate the viewing safety concerns in VR, we propose a neural network-based QoE prediction technique that predicts and examines the degree of cybersickness induced by the 360-degree videos under various stalling events in VR. The prediction accuracy of the proposed method performs well against well-known ML methods such as Support Vector Machine (SVM), K-Nearest Neighbors (KNN), and Decision Tree (DT). Our proposed method outperforms existing QoE methods.
The remainder of this manuscript is structured as follows: The related work significant to the subject of this manuscript is presented in Section 2. In Section 3, we explain the experimental setup and subjective experiment conducted in this manuscript. Section 4 provides the subjective results and analysis in detail. The QoE prediction method is included in Section 5. The performance comparison and accuracy of the proposed method is presented in Section 6. Finally, Section 7 concludes the manuscript.

2. Related Work

In this section, we discuss the existing related work in the literature relevant to our work, starting with studies on various QoE-affecting factors that affect the QoE of 360-degree videos in different aspects. The main focus is on studies regarding the improvement of end-user QoE in a virtual environment such as the user’s “sense of being there” in VR, the user’s perception about the quality of the video, and the viewer’s cybersickness level in VR. Many research works addressed the QoE-affecting factors and end-user QoE in various aspects [29,30,31,32]. A comprehensive study and understanding of relevant QoE is an essential prerequisite for QoE improvement.
Regarding the perceptual quality of the 360-degree video, the authors in [29] subjectively evaluate the impact of encoding parameters (quantization parameters and resolution), content type (interesting and non-interesting videos), and device type (HTC Vive and Google cardboard) on QoE by considering the user’s profile. The study concludes that users are less sensitive and more tolerant about the encoding rate while watching an interesting 360-degree video in VR compared to the non-interesting video. Their study claims that viewers are concerned about device type and recorded higher MOS scores while watching in HTC Vive compared to Google cardboard. Several research studies explore the influence of encoding parameters on perceptual quality such as resolutions [20,24,29,33,34], Quantization Parameter (QP) [29,35], bitrate [30,36], and frame rate [34] have shown significant impact on end-user QoE. The effect of the encoding parameter on perceptual quality is concluded in [34], the study shows that frame rate and resolution have a severe effect on perceptual quality than that of bitrate. The considerable effect of content motion on perceptual quality has shown in [20]. However, their study lacks the impact of camera motion and moving objects in the video. In a recent subjective study [37], the authors investigated the impact of the Quantization Parameter (QP), resolution, rendering device, gender, user’s interest, and user’s familiarity with VR on perceptual quality. Their study concluded that the user’s prior experience of watching a 360-degree video in VR has a notable impact on perceptual quality. In the context of the presence aspect of QoE, Schatz et al. evaluated the effect of stalling on presence while watching an omnidirectional video [28]. Their study is only limited to the comparison between omnidirectional video and 2D traditional video. Another study in [38] evaluated the impact of stalling on perceptual quality and presence for 360-degree videos in VR. Similarly, the impact of various stalling under three different bitrate levels (1 Mbps, 5 Mbps, and 15 Mbps) on user perceptual quality has been investigated in [30]. The study concluded that the adverse effect of multiple stalling in a single video sequence is more profound when the presentation quality level approaches to the high and low end. However, their study is limited to only perceptual quality. The impact of encoding parameter, device type, and rendering mode on presence is evaluated in [39]. Their work concluded a lower presence score strongly affected by content characteristics compared to perceptual quality. Compared to a traditional video, 360-degree videos in VR provide an enhanced presence level and can be used effectively in training, education, and rehabilitation [25]. In our work, we addressed the significant impact of nine different types of 360-degree videos in VR on perceptual quality and presence.
Extensive research studies have been conducted to evaluate and predict the user’s cybersickness level for VR content. Kennedy et al. proposed an instrument to measure the cybersickness level called the Simulator Sickness Questionnaire (SSQ) [5] which is then improved by [40,41]. Cybersickness symptoms can appear when viewers experience the difference between his/her movement and content motion [42]. The user’s cybersickness level is investigated in [20]. The study is limited to the impact of different HMD devices on users. Fremerey et al. evaluate simulator sickness, the overall annoyance level was not excessive and female subjects recorded greater sickness than males [43]. The authors in [27] evaluate the impact of content characteristics and device type on the user’s cybersickness level in a subjective experiment. The study concluded that the effect of device type on cybersickness is insignificant, while the impact of content motion is a serious problem. Similarly, many existing studies addressed the impact of resolution, gender [20], and content motion [24] on cybersickness. Several existing research evaluated the cause of cybersickness in VR, focusing on the relationship between subjective assessment (SSQ) and objective method (physiological signal such as heart rate, EEG, and EGG). To that end, the authors deduced that latency of display [44], frame rate [45], and Field of View (FoV) [46] are the key factors that affect user experience while watching VR contents. Similarly, cybersickness level could be decreased to reduce the FoV [46]. In a recent subjective study [37], the authors subjectively evaluate the impact of gender, user’s interest, and user’s familiarity with VR on cybersickness. Their study concluded that the users’ sickness level is higher while watching a non-interesting 360-degree video and female subjects recorded more severe sickness than males. In [47], the authors compared the Depth of Field (DoF) with the SSQ score blur enabled and disabled. Their study concludes that DoF is one of the main factors that affect cybersickness. For immersive VR content delivered to HMD, an objective and subjective QoE was evaluated in [48]. However, most of the existing studies on cybersickness are dedicated to evaluating and analyzing the relationship between subjective (SSQ) and objective physiological signals assessment. Meanwhile, no previous study has addressed the significant impact of different duration stallings on the viewer’s cybersickness level in the field of 360-degree video. Therefore, in this manuscript, we also evaluate the impact of various significant factors under different stalling events on the user’s cybersickness level. This work is a variant of our prior work [37] in the sense of cybersickness levels prediction. Compared to the previous model, in this manuscript, we have nine different factors as an input variable and four output cybersickness levels. First, the cybersickness is calculated on a standard 16-items SSQ questionnaire (latest version). Then the total score of cybersickness is divided into four levels according to their significance on end-users based on the state-of-the-art methods. Here we have also applied the three supervised machine-learning algorithms (KNN, SVM, and DT) to our dataset in comparison to the ANN model. The ANN model performs well in terms of prediction accuracy, which shows the validity and significance of this model. In this work, we will explain the ANN model in more detail in Section 5.

3. Experimental Setup and Description

This section explains in detail our experimental setup, subjective results evaluations, and analysis. The complete methodology we followed in this work is shown in Figure 1, where the effect of three factors with nine different features under two stalling events is evaluated. The impact of these QoE-affecting factors on three significant QoE-aspects (perceptual quality, presence, and cybersickness) are investigated during a subjective experiment. The datasets obtained for all three QoE-aspects are then analyzed and discussed. The cybersickness dataset is collected, arranged, and then fed into the ANN-based QoE prediction model for different levels predictions. Finally, the prediction performance of the proposed model is compared against well-known machine learning techniques and state of the art QoE prediction models.

3.1. Subjective Users Study and Technical Setup

A total of 40 subjects contributed to the subjective experiment, including 25 male and 15 female subjects, aged between 25 and 38. We used HTC Vive as an HMD device, with resolutions 2160 × 1200 with a FoV of 110 degree. HTC Vive is directly connected with a desktop PC that has Virtual Desktop (VD) software installed and was used as a 360-degree video player. A total of 9 different types of 360-degree videos are downloaded from YouTube based on different content types (fast, medium, and slow), camera motion (fixed, horizontal, and vertical), and the number of moving targets (none, single, and multiple). Figure 2 shows the example frames of the source video sequence covering various scenes. These videos contain diverse content that cover a wide range of SI (spatial) and TI (temporal) indexes. The SI and TI of source videos are shown in Figure 3.
The detailed specifications of the source video, including resolutions, frame rate, video link, and content features are presented in Table 1. Each source video is cut into a 1-min duration using the FFMPEG software tool without changing the video quality. Using Avisynth tool, single long stalling of 9-s and three short stalling of 3-s each at different intervals are simulated in all nine-source videos. We also considered the original source videos in a subjective test as a no stalling event (video without stalling) to compare the impact of single long stalling, multiple short stalling, and no stalling on users QoE. Therefore, we obtained a total of 27 test videos including 9 with single long stalling (9 s), 9 with multiple short stalling ( 3 × 3 s), and 9 videos without stalling events (no stalling). The duration of stalling is chosen longer compared to traditional 2D video [49], by keeping in mind the 360-degree view of the video in HMD. Thus, the subjects can notice the stalling disturbance easily. Moreover, using the Avisynth tool, we simulate a YouTube-style indicator (spinner) that spins when stalling occurs during watching in VR to experience the real-world scenario. Furthermore, we discarded the audio track from the videos to bypass the impact of acoustic information. The effect of content type, camera motion, and moving targets under various stalling events on end-user QoE in terms of presence, perceptual quality, and cybersickness are investigated.

3.2. Subjective Experiment

Before the actual test, all subjects were screened out for visual acuity and color vision using Snellen (20/20) and Ishiara charts, respectively. The subjects were exposed to a training session before the actual experiment to train and help them adjust the HMD device according to the head size [20]. The subjects were instructed to sit on a rotating chair and permitted to move their head generously around to cover the broader region of the 360-degree video.
During the subjective experiment, we randomly divided the total users into two groups, each group consisting of 20 users. Each user from group one watched 9 videos with single long stalling, and each user from another group watched 9 videos with multiple short stalling. For no stalling, we randomly picked 5 users from each group. Therefore, in total, 20 subjects watched 9 videos with single long stalling, and 20 subjects watched 9 videos with multiple short stalling while 10 subjects watched 9 videos without stalling (no stalling). The example frames of the spinning indicator during stalling is shown in Figure 4. The impact of these factors on users QoE were investigated in term of perceptual quality, presence, and cybersickness. After watching each video in VR, the participants were asked to give their scores according to the questions asked. The questions asked during our subjective test are listed below.
  • Q1: How do you perceive the quality of video on a 5-point scale? (MOS), (1 = bad, 5 = excellent);
  • Q2: How do you rate the level of cybersickness (dizziness or nausea) whilst watching in VR on a 4-point scale? (SSQ), (0; no sickness, 1; mild sickness, 2; considerable sickness, 3; severe sickness);
  • Q3: I had a sense of being there in a virtual environment (IPQ-G1), (5 = fully agree, 1 = fully disagree).
The total duration time of the subjective test was almost 10 h. The videos were played randomly during the subjective test to avoid any memory effect. The subjects were asked three questions after being shown each video. The perceptual quality is investigated on a 5-point Absolute Category Rating (ACR) scale according to ITU-T Rec. P.910 called the Mean Opinion Score (MOS). The impact of these factors on the user’s presence was evaluated by asking a question (G1) adopted from the Igroup Presence Questionnaire (IPQ) [50]. At the same time, the level of cybersickness was calculated with the help of a traditional 16-item SSQ method (latest version) as shown in Table 2 [40,41]. A total of 16 symptoms of cybersickness are categorized into nausea (N), oculomotor (O), and disorientation (D), a 4-point scale (0; no sickness, 1; mild sickness, 2; considerable sickness, 3; severe sickness) are used, and weighted values are calculated to obtain the score of each category. N, O, D, and the total score (TS) are then measured by combining every single score for each symptom with the weight. The nausea for SSQ score can be calculated as,
S S Q Nausea = 9.54 × 1 N n = 1 N s n g d + s n s + s n i s + s n d c + s n n + s n b + s n s a
where, N is the number of subjects, s n g d , s n s , and s n i s are the subjective score of n-th subject for general discomfort, sweating, and increased salivation, respectively. The subjective score for the n-th subject for difficulty concentrating, nausea, burping, and stomach awareness is indicated by s n d c , s n n , s n b and s n s a , respectively. The oculomotor score can be calculated as,
SSQoculomotor = 7.58 × 1 N n = 1 N s n g d + s n h + s n f + s n e s + s n d c + s n d f + s n b v
where, s n h , s n f , and s n e s indicated the subjective score of n-th subject for headache, fatigue, and eyestrain, respectively. While s n d f and s n b v represents the subjective score for difficulty focusing and blurred vision, respectively. The disorientation score of SSQ can be calculated as,
S S Q Disorientation = 13.92 × 1 N n = 1 N s n d f + s n n + s n f h + s n b v + s n d z c + s n v + s n d z o
where, s n f h , s n d z c , s n v , and s n d z o are the subjective score of n-th subject for fullness of head, dizzy (eye close), vertigo, and dizzy (eye open), respectively. The total SSQ score can be obtained by adding the partial SSQ score of all three symptoms (Nausea, Oculomotor, and Disorientation) with the weight, 3.74, which can be written as,
S S Q total = 3.74 × 1 9.54 S S Q Nausea + 1 7.58 × SSQoculomotor + 1 13.92 S S Q Disorientation

4. Subjective Results Analysis and Discussions

In this section, we discuss the results obtained from the subjective experiment. The significant impact of QoE-affecting factors on users QoE is evaluated in a subjective test. The impact of these factors on three key QoE aspects will be discussed in detail in this section. To check the reliability of the participant score, we apply the outliers’ detection method according to the ITU-R Rec. BT.500-13 guideline. None of the subjects were noticed as an outlier during our subjective experiment.

4.1. Impact on Perceptual Quality

The impact of QoE-affecting factors under various stalling events on QoE in terms of perceptual quality is depicted in Figure 5. Where Figure 5a presents the effect of these factors in the absence of stalling (no stalling), Figure 5b presents in the presence of single long stalling, and Figure 5c presents multiple short stalling on perceptual quality. In the case of no stalling, most of the MOS values are between 4 and 5, which shows satisfactory QoE. Still, each affecting factor deteriorates the QoE in its capacity, while in the presence of a single long stalling of 9 s, the MOS values of the end-user drop slightly which further degrades QoE as shown in Figure 5b. Furthermore, Figure 5c reveals a significant drop in QoE when three short stalling of 3 s each occurs at a different interval in a single video clip. It means that stalling creates a sturdier effect on users QoE and the negative impact of stalling further increases when multiple short stalling occurs in a single 360-degree video clip. The average perceptual quality score against all factors under various stalling events is shown in Figure 6 with a 95% confidence interval (CI). For statistical analysis, we perform a t-test to find whether there is a statistical difference among different stalling events for perceptual quality aspect. No statistical differences was found and the p-value recorded is p < 0.05. From Figure 6, we obtained some agreeable results and observations. Firstly, stalling always impacts the QoE and results in a significant MOS drop that should be notable. Second, the QoE drop in terms of perceptual quality is higher in the case of a fast video, vertical camera motion, and multiple moving targets compared to other affecting factors. Third, the adverse effects of multiple short stalling ( 3 × 3 s) in a single video on users’ perceptual quality is higher compared to single long stalling (9 s). From the above results and observations, we conclude that views are less sensitive and more tolerant when a single long stalling of 9 s occurs while watching a 360-degree video in VR. On the other hand, these viewers are more sensitive about multiple short stalling of 3 s each, when it happens in a single video clip. Multiple stalling leads to frustration and viewers’ annoyance, resulting in poor QoE.

4.2. Impact on Presence

Regarding the presence aspect of QoE, stalling has a similar effect on the user’s presence such as on perceptual quality. The impact of QoE-affecting factors under various stalling on user presence is shown in Figure 7. From Figure 7, it is clear that the significant effect of multiple short stalling on users’ presence shown in Figure 7c is higher, compared to single long stalling depicted in Figure 7b, and no stalling event shown in Figure 7a. We have some exciting outcomes from the average presence score with 95% CI depicted in Figure 8, viewers’ presence level is higher while watching a medium video, video with horizontal camera motion, and video with multiple moving target objects. It shows that users feel more presence in a virtual environment when there are more moving objects in a 360-degree video compared to a video containing no moving object. Besides, a medium video and video recorded with a horizontal camera motion offers higher presence to viewers. Again, fast video content poorly affects the user’s presence level in VR, which deteriorates the end-user QoE. We performed a t-test to compare the statistical difference for the presence aspect between no stalling, single stalling, and multiple stalling. There are no statistical differences found and the p-value recorded is p < 0.05.

4.3. Impact on Cybersickness

One of the essential goals of the subjective test was to evaluate the impact of these QoE-affecting factors under various stalling events on the user’s cybersickness level while watching a 360-degree video in VR. We aimed to analyze which factor had a higher score of N, O, D, and TS under different stalling events. It can be noticed from the Figure 9a–c that fast video, video with vertical camera motion, and video containing multiple moving targets result into high N, O, D, and TS score with 95% CI. While slow video, video recorded with a fixed camera, and video having no moving targets recorded a lower N, O, D, and TS score. In all three cases, the higher cybersickness level is recorded when multiple stalling occurs (Figure 9c) in a video compared to single long stalling (Figure 9b) and no stalling (Figure 9a). Another reasonable observation inferred from all three cases is that the disorientation score is always the highest in all affecting factors. Therefore, it is concluded that viewers feel higher cybersickness while watching fast videos than a moderate and slow video. In the case of camera motion, the viewers were uncomfortable, having higher cybersickness levels, while watching a video recorded with vertical camera motion than that of a fixed camera and horizontal camera motion. Similarly, another notable reaction from subjects in the case of moving targets in the video is that viewers prefer less moving targets and are more sensitive to multiple targets and feel higher cybersickness than a single and no moving target in a video. More importantly, the effect of stalling on these factors is significant. Multiple short stalling have a more considerable influence and deteriorates the QoE than single long stalling. Figure 10 shows the sickness level in terms of TS across different factors and stallings. Their statistical distribution are indicated by error bars as a 95% CI. We also performed a t-test to compare the statistical difference between N, O, D, and TS. There are no statistical differences found (p < 0.05) and the p-value < 0.05 recorded among no stalling, single stalling, and multiple stalling. These findings show that various stalling has a significant impact on cybersickness. The performance of the subject’s score for all three questions is evaluated in terms of the Pearson Linear Correlation Coefficient (PLCC) and Spearman’s Rank-order Correlation Coefficient (SRCC) shown in Table 3. Both PLCC and SRCC ranges between 0 and 1, the higher value indicates better performance.
To summarize the above results and observations, the impact of all nine factors under different stalling events on QoE in terms of perceptual quality, presence, and cybersickness is significant. In the case of perceptual quality, viewers are more sensitive about the fast video, vertical camera motion, and video having multiple moving targets than other factors. Regarding the presence aspect, these observations are different and the subject’s presence level is higher while watching a medium video than a slow and fast video. Similarly, the viewers feel an extra presence in the VR environment when watching a 360-degree video recorded with a horizontal camera motion than a fixed and vertical camera motion. Furthermore, a video having multiple moving objects gives a higher presence level to the viewers compared to single and no moving target videos. On the other hand, the impacts of these factors on user’s cybersickness level is also critical. Viewers feel annoyed and uncomfortable, which results in higher cybersickness while watching the fast video, videos with vertical camera motion, and videos with multiple moving targets than other factors. More significantly, stalling always affects the users QoE in all three aspects. Viewers feel a satisfactory level of QoE when there is no stalling in a video. At the same time, the end-user QoE drops when they experience a single long stalling of 9 s. The QoE degrades further when multiple short stalling ( 3 × 3 s) occurs in a single video clip at a different interval. Therefore, it suggests that content and service providers should take into account the stalling events because viewers are more sensitive about multiple stalling and tolerant to single long stalling when it occurs in 360-degree video.

5. QoE Prediction in Terms of Cybersickness

In this section, we built a model based on ANN that can predict QoE in terms of cybersickness. To address the viewing safety issues in a VR environment, we construct a neural network that predicts the viewer’s cybersickness level induced by the VR content under stalling events. The cybersickness dataset obtained from subjective experiments through SSQ is used as training data for the QoE prediction. ANN is one of the most promising methods for acceptable computational complexity and uses a chain rule based on the gradient descent method to iteratively compute the gradient for each layer. The basic ANN algorithm equation is:
W ( n ) = W ( n 1 ) Δ W ( n )
Δ W ( n ) = η E W ( n 1 ) α Δ W ( n 1 )
where Δ W indicates gradient used for the adjustment of weighting, η denotes learning rate (hyperparameter) that controls how much to change the model in response to the estimated error each time the model weights W are updated. W denotes weight and E indicates the gradient of the error function. ANN updates the learning rate η based on each sample instead all the samples shown in Equation (5) and accelerates the speed of finding the optimal solution. Therefore, we may achieve the best model by varying the learning rate η . The error function we used is indicated by the following Equation.
c = 1 2 n X y ( x ) a L ( x ) 2
To predict the effect of nine features of three QoE-affecting factors such as content type, camera motion, and the number of moving targets under various stalling events on VR sickness level, we trained a four-layer ANN model based on Stochastic Gradient Descent (SGD). We used four layered ANN model including one input layer, one output layer, and two hidden layers shown in Figure 11. In this typical ANN model, we used nine input neurons indicated by X 1 , , X 9 . Two hidden layers, h 1 1 , h 2 1 , , h n 1 indicate neurons in first hidden layer while h 1 2 , h 2 2 , , h n 2 represents the neurons in the second hidden layer. The output neurons Y 1 , , Y 4 represent the four cybersickness levels 0, 1, 2, and 3. The four output values are based on the TS (Total Score) of SSQ. The TS of SSQ below 10 is traditionally considered to be normal [51], while the TS between 32 and 40 could be enough to cause cybersickness [40,52]. Therefore, for ANN-based prediction, we categorize the TS of SSQ into four output values shown in Table 4.
The intent of using ANN for cybersickness levels prediction is to map these nine input features of three QoE-affecting factors under stalling into four output values ranging from 0 to 3. We use a high-level ANN Keras library that runs on the top of TensorFlow. Keras provides the SGD optimizer with an adapting learning rate. The number of neurons in hidden layers is adapted by fixing the learning rate at 0.2 at the first stage during the optimization process. We then achieved 64 neurons in the first hidden layer and 32 neurons in the second hidden layer with a prediction accuracy of 90%. We used 1000 iterations (epochs) to train the model. We also noted that the final prediction accuracy of the network varied with the adaptation of different learning rates. Therefore, we tried and tested different learning rates to check the prediction accuracy of the proposed model. Figure 12 depicts the variation in prediction accuracy with adapting learning rates. The main steps of our proposed neural network QoE prediction model are shown in Algorithm 1.
Algorithm 1 Learning neural network-based QoE prediction model with cybersickness data.
Initialize: Set the neural network learning rate as 0.2 and the iteration number (epochs) to train the network as 1000. Select the hidden neuron in first and second hidden layer as 64 and 32, respectively.
1:
Collect the cybersickness dataset obtained via subjective experiment.
2:
Divide the dataset in training and testing samples.
3:
while the epochs of the training dataset ≤ 1000, do
4:
Select the output label values ranging from 0 to 3 representing normal sickness (0), slight sickness (1), enough sickness (2), and severe sickness (3).
5:
Apply the SGD optimizer to update the parameters of the network.
6:
end while
7:
Save the parameters of the training network.
8:
Input the testing samples to the saved parameter to obtain the score.
9:
Predict the final QoE

6. Accuracy and Performance Comparison

We used 70% of the cybersickness dataset for training and 30% for testing to check the prediction performance of the model. We compared the prediction accuracy of our model against SVM, KNN, and DT with respect to the confusion matrix, accuracy rate, precision, recall, f1-score, and Mean Absolute Error (MAE).
Confusion Matrix: Is a performance measurement of the machine learning prediction method that offers the classification of the correct match rates for predicted values against actual class. The confusion matrix gives four different arrangements of predicted and actual values. True Positive (TP) interprets correctly predicted cybersickness level, False Positive (FP) denotes the incorrectly predicted cybersickness levels, True Negative (TN) reflects the accurately miss percentage, and False Negative (FN) indicates incorrectly miss percentage. ANN recorded the highest accuracy rate with 90% while SVM, KNN, and DT achieved 83%, 80%, and 83% respectively shown in Table 5. The performance accuracy of the proposed ANN-based QoE prediction model is calculated with the help of the following five Equations:
Precision = T P T P + F P
Recall = T P T P + F N
F 1 = 2 × Precision × Recall Precision + Recall
Accuracy = T P + T N T P + T N + F P + F N
MAE = 1 n i = 1 n Y a c t u a l i Y calculated i
For a further comparison and validation of the proposed model, we compared the prediction accuracy performance of the proposed QoE prediction model against the VR Sickness Predictor (VRSP) [53], linear regression-based model [21], VR Sickness Assessment (VRSA) network [54], and deep learning Visual Comfort Assessment (VCA) method [55]. PLCC and SRCC is calculated to estimate the performance comparison of the proposed models. Figure 13 shows the PLCC and SRCC to compare the prediction performance of the proposed model with 95% CI. It shows that our proposed ANN-based model provides the best prediction performance of the subject’s QoE.

7. Conclusions

This manuscript has addressed the different key factors that affect the QoE of 360-degree video in VR. The impact of three critical factors including nine various affecting features such as content type (fast, medium, and slow), camera motion (fixed, horizontal, and vertical), and the number of moving targets (none, single, and multiple) were investigated on viewers QoE. The impact of these factors were evaluated under various stalling events (no stalling, single long stalling, and multiple short stalling) on QoE in term of three crucial aspects perceptual quality, presence, and cybersickness. Experimental results showed that all three QoE aspects were significantly affected by these affecting factors under various stalling events. Regarding perceptual quality, users were less tolerant about the fast video, vertical camera motion, and video having multiple moving targets than other factors. From t-test, the p value was less than 0.05 between the slow video and fast video, fixed camera and vertical camera, and no target and multiple targets. The statistical analysis shows that these factors significantly influenced the perceptual quality. In the case of presence aspect, these observations were different and the viewer’s presence level was higher while watching a medium video than slow and fast video. Similarly, the viewers felt more presence in the VR while watching a 360-degree video recorded with horizontal camera motion than with a fixed and vertical camera motion. In addition, a video that had multiple moving objects offered a higher presence level to the viewers compared to single and no moving target videos. In terms of cybersickness aspect, viewers felt annoyed and uncomfortable, which resulted in higher cybersickness while watching the fast video, videos recorded with vertical camera motion, and videos with multiple moving targets than other factors. It is also observed that stalling always affected the viewers QoE and the adverse effect of multiple short stalling on end-user QoE was more profound than single long stalling. Furthermore, we proposed the ANN-based QoE prediction method to predict the impact of QoE-affecting factors under various stalling events on the user’s cybersickness level. It is shown that no previous study has addressed the effect of stalling on cybersickness for 360-degree video in VR, which motivated us to carry out this study. We compared the prediction accuracy of the proposed model against other machine learning techniques such as SVM, KNN, and DT with respect to the accuracy rate, recall, f1-score, precision, and MAE. Our proposed ANN model performed well with 90% prediction accuracy against other machine learning techniques and existing QoE prediction models.
There are also a few limitations to our work. We classified the videos according to the three features in a manner that each of the videos represents one single feature. We tried our best to choose the video that had a single feature. We tried to select that a video which had a single moving target did not have another feature of moving targets (i.e., single target or multiple targets). Similarly, this was applied to any video recorded with both fixed, vertical, or horizontal camera motion and the same in the case of video speed. The limitation of our work is that in reality, videos with a moving target could also be a fast or medium and vertical camera motion video and could also have another feature. At the same time, a video could have both a vertical motion and be slow. Still, the purpose of our work is to bring this serious issue to the eyes of researchers. In addition, the content providers should take into account these factors while providing any content to meet the end-users satisfaction and to offer better QoE.
In our future work, we aim to overcome these limitations and evaluate factors that contained multiple feature. We will also cover more QoE affecting factors such as different projection schemes, EEGs, and user gaze focus. In addition, we intend to evaluate the effect of these factors on QoE aspects such as usability, acceptability, presence, immersion, and cybersickness. The finding and QoE prediction model in our study and future work is expected to be helpful so as to improve the QoE of 360-degree video in VR applications for entertainment and education.

Author Contributions

Data curation, S.A.; Conceptualization M.S.A.; Formal analysis, M.S.A.; Investigation, M.S.A.; Project administration, M.S.A.; Validation, W.K.; Resources, A.U.; Supervision, J.W.; Lead role, Z.F. All authors have read and agreed to the published version of the manuscript.

Funding

This research received no external funding.

Conflicts of Interest

The authors declare no conflict of interest.

References

  1. Brunnström, K.; Beker, S.A.; De Moor, K.; Dooms, A.; Egger, S.; Garcia, M.N.; Hossfeld, T.; Jumisko-Pyykkö, S.; Keimel, C.; Larabi, M.C.; et al. Qualinet white paper on definitions of quality of experience. In European Network on Quality of Experience in Multimedia Systems and Services (COST Action IC 1003); EU COST: Lausanne, Switzerland, 2012; Volume 3. [Google Scholar]
  2. Seufert, M.; Egger, S.; Slanina, M.; Zinner, T.; Hoßfeld, T.; Tran-Gia, P. A survey on quality of experience of HTTP adaptive streaming. IEEE Commun. Surv. Tutor. 2014, 17, 469–492. [Google Scholar] [CrossRef]
  3. Garcia, M.N.; De Simone, F.; Tavakoli, S.; Staelens, N.; Egger, S.; Brunnström, K.; Raake, A. Quality of experience and HTTP adaptive streaming: A review of subjective studies. In Proceedings of the 2014 Sixth International Workshop on Quality of Multimedia Experience (QoMEX), Singapore, 18–20 September 2014; pp. 141–146. [Google Scholar]
  4. Tran, H.T.; Ngoc, N.P.; Pham, A.T.; Thang, T.C. A multi-factor QoE model for adaptive streaming over mobile networks. In Proceedings of the 2016 IEEE Globecom Workshops (GC Wkshps), Washington, DC, USA, 4–8 December 2016; pp. 1–6. [Google Scholar]
  5. Kennedy, R.S.; Lane, N.E.; Berbaum, K.S.; Lilienthal, M.G. Simulator sickness questionnaire: An enhanced method for quantifying simulator sickness. Int. J. Aviat. Psychol. 1993, 3, 203–220. [Google Scholar] [CrossRef]
  6. Gianaros, P.J.; Muth, E.R.; Mordkoff, J.T.; Levine, M.E.; Stern, R.M. A questionnaire for the assessment of the multiple dimensions of motion sickness. Aviat. Space Environ. Med. 2001, 72, 115. [Google Scholar] [PubMed]
  7. Ameigeiras, P.; Azcona-Rivas, A.; Navarro-Ortiz, J.; Ramos-Munoz, J.J.; Lopez-Soler, J.M. A simple model for predicting the number and duration of rebuffering events for YouTube flows. IEEE Commun. Lett. 2011, 16, 278–280. [Google Scholar] [CrossRef]
  8. Budagavi, M.; Furton, J.; Jin, G.; Saxena, A.; Wilkinson, J.; Dickerson, A. 360 degrees video coding using region adaptive smoothing. In Proceedings of the 2015 IEEE International Conference on Image Processing (ICIP), Quebec City, QC, Canada, 27–30 September 2015; pp. 750–754. [Google Scholar]
  9. Ng, K.T.; Chan, S.C.; Shum, H.Y. Data compression and transmission aspects of panoramic videos. IEEE Trans. Circuits Syst. Video Technol. 2005, 15, 82–95. [Google Scholar]
  10. Bauermann, I.; Mielke, M.; Steinbach, E.H. 264 based coding of omnidirectional video. In Computer Vision and Graphics; Springer: Berlin/Heidelberg, Germany, 2006; pp. 209–215. [Google Scholar]
  11. Yu, M.; Lakshman, H.; Girod, B. A framework to evaluate omnidirectional video coding schemes. In Proceedings of the 2015 IEEE International Symposium on Mixed and Augmented Reality; Institute of Electrical and Electronics Engineers (IEEE), Fukuoka, Japan, 29 September–3 October 2015; pp. 31–36. [Google Scholar]
  12. Upenik, E.; Řeřábek, M.; Ebrahimi, T. Testbed for subjective evaluation of omnidirectional visual content. In Proceedings of the 2016 Picture Coding Symposium (PCS), Nuremberg, Germany, 4–7 December 2016; pp. 1–5. [Google Scholar]
  13. Sodagar, I. The mpeg-dash standard for multimedia streaming over the internet. IEEE Multimed. 2011, 18, 62–67. [Google Scholar] [CrossRef]
  14. Zare, A.; Aminlou, A.; Hannuksela, M.M.; Gabbouj, M. HEVC-compliant tile-based streaming of panoramic video for virtual reality applications. In Proceedings of the 24th ACM International Conference on Multimedia, Amsterdam, The Netherlands, 15–19 October 2016; pp. 601–605. [Google Scholar]
  15. Qian, F.; Ji, L.; Han, B.; Gopalakrishnan, V. Optimizing 360 video delivery over cellular networks. In Proceedings of the 5th Workshop on All Things Cellular: Operations, Applications and Challenges, New York, NY, USA, 3–7 October 2016; pp. 1–6. [Google Scholar]
  16. Cheung, G.; Liu, Z.; Ma, Z.; Tan, J.Z. Multi-stream switching for interactive virtual reality video streaming. In Proceedings of the 2017 IEEE International Conference on Image Processing (ICIP), Beijing, China, 17–20 September 2017; pp. 2179–2183. [Google Scholar]
  17. Hosseini, M.; Swaminathan, V. Adaptive 360 VR video streaming: Divide and conquer. In Proceedings of the 2016 IEEE International Symposium on Multimedia (ISM), San Jose, CA, USA, 11–13 December 2016; pp. 107–110. [Google Scholar]
  18. Huynh-Thu, Q.; Ghanbari, M. Temporal aspect of perceived quality in mobile video broadcasting. IEEE Trans. Broadcast. 2008, 54, 641–651. [Google Scholar] [CrossRef]
  19. Singh, K.D.; Hadjadj-Aoul, Y.; Rubino, G. Quality of experience estimation for adaptive HTTP/TCP video streaming using H. 264/AVC. In Proceedings of the 2012 IEEE Consumer Communications and Networking Conference (CCNC), Las Vegas, NV, USA, 14–17 January 2012; pp. 127–131. [Google Scholar]
  20. Singla, A.; Fremerey, S.; Robitza, W.; Raake, A. Measuring and comparing QoE and simulator sickness of omnidirectional videos in different head mounted displays. In Proceedings of the 2017 Ninth International Conference on Quality of Multimedia Experience (QoMEX), Erfurt, Germany, 31 May–2 June 2017; pp. 1–6. [Google Scholar]
  21. Yao, S.H.; Fan, C.L.; Hsu, C.H. Towards quality-of-experience models for watching 360 videos in head-mounted virtual reality. In Proceedings of the 2019 Eleventh International Conference on Quality of Multimedia Experience (QoMEX), Berlin, Germany, 5–7 June 2019; pp. 1–3. [Google Scholar]
  22. Nasrabadi, A.T.; Samiei, A.; Mahzari, A.; McMahan, R.P.; Prakash, R.; Farias, M.C.; Carvalho, M.M. A taxonomy and dataset for 360 videos. In Proceedings of the 10th ACM Multimedia Systems Conference, Amherst, MA, USA, 18–21 June 2019; pp. 273–278. [Google Scholar]
  23. TT Tran, H.; Ngoc, N.P.; Pham, C.T.; Jung, Y.J.; Thang, T.C. A Subjective Study on User Perception Aspects in Virtual Reality. Appl. Sci. 2019, 9, 3384. [Google Scholar] [CrossRef] [Green Version]
  24. Singla, A.; Göring, S.; Raake, A.; Meixner, B.; Koenen, R.; Buchholz, T. Subjective quality evaluation of tile-based streaming for omnidirectional videos. In Proceedings of the 10th ACM Multimedia Systems Conference, Amherst, MA, USA, 18–21 June 2019; pp. 232–242. [Google Scholar]
  25. Gaggioli, A. Quality of experience in real and virtual environments: Some suggestions for the development of positive technologies. Stud. Heal. Technol. Inform. 2012, 181, 177–180. [Google Scholar]
  26. Steed, A.; Frlston, S.; Lopez, M.M.; Drummond, J.; Pan, Y.; Swapp, D. An ‘in the wild’experiment on presence and embodiment using consumer virtual reality equipment. IEEE Trans. Vis. Comput. Graph. 2016, 22, 1406–1414. [Google Scholar] [CrossRef] [Green Version]
  27. Tran, H.T.; Hoang, T.H.; Minh, P.N.; Ngoc, N.P.; Thang, T.C. A perception-based quality metric for omnidirectional images. In Proceedings of the 2019 IEEE International Conference on Consumer Electronics-Asia (ICCE-Asia), Bangkok, Thailand, 12–14 June 2019; pp. 151–152. [Google Scholar]
  28. Schatz, R.; Sackl, A.; Timmerer, C.; Gardlo, B. Towards subjective quality of experience assessment for omnidirectional video streaming. In Proceedings of the 2017 Ninth International Conference on Quality of Multimedia Experience (QoMEX), Erfurt, Germany, 31 May–2 June 2017; pp. 1–6. [Google Scholar]
  29. Anwar, M.S.; Wang, J.; Ullah, A.; Khan, W.; Li, Z.; Ahmad, S. User Profile Analysis for Enhancing QoE of 360 Panoramic Video in Virtual Reality Environment. In Proceedings of the 2018 International Conference on Virtual Reality and Visualization (ICVRV), Qingdao, China, 22–24 October 2018; pp. 106–111. [Google Scholar]
  30. Muhammad, A.; Jing, W.; ULLAH, A.; Wahab, K.; Sadique, A.; Zesong, F. Measuring Quality of Experience for 360-degree Videos in Virtual Reality. Sci. China Inf. Sci. 2020, 63, 1–15. [Google Scholar]
  31. Tran, H.T.; Pham, C.T.; Ngoc, N.P.; Pham, A.T.; Thang, T.C. A study on quality metrics for 360 video communications. IEICE Trans. Inf. Syst. 2018, 101, 28–36. [Google Scholar] [CrossRef] [Green Version]
  32. Melo, M.; Vasconcelos-Raposo, J.; Bessa, M. Presence and cybersickness in immersive content: Effects of content type, exposure time and gender. Comput. Graph. 2018, 71, 159–165. [Google Scholar] [CrossRef]
  33. Singla, A.; Fremerey, S.; Robitza, W.; Lebreton, P.; Raake, A. Comparison of subjective quality evaluation for hevc encoded omnidirectional videos at different bit-rates for uhd and fhd resolution. In Proceedings of the on Thematic Workshops of ACM Multimedia 2017, Mountain View, CA, USA, 23–27 October 2017; pp. 511–519. [Google Scholar]
  34. Duan, H.; Zhai, G.; Yang, X.; Li, D.; Zhu, W. IVQAD 2017: An immersive video quality assessment database. In Proceedings of the 2017 International Conference on Systems, Signals and Image Processing (IWSSIP), Poznan, Poland, 22–24 May 2017; pp. 1–5. [Google Scholar]
  35. Tran, H.T.; Ngoc, N.P.; Bui, C.M.; Pham, M.H.; Thang, T.C. An evaluation of quality metrics for 360 videos. In Proceedings of the 2017 Ninth International Conference on Ubiquitous and Future Networks (ICUFN), Milan, Italy, 4–7 July 2017; pp. 7–11. [Google Scholar]
  36. Zhang, B.; Zhao, J.; Yang, S.; Zhang, Y.; Wang, J.; Fei, Z. Subjective and objective quality assessment of panoramic videos in virtual reality environments. In Proceedings of the 2017 IEEE International Conference on Multimedia & Expo Workshops (ICMEW), Hong Kong, China, 10–14 July 2017; pp. 163–168. [Google Scholar]
  37. Anwar, M.S.; Wang, J.; Khan, W.; Ullah, A.; Ahmad, S.; Fei, Z. Subjective QoE of 360-Degree Virtual Reality Videos and Machine Learning Predictions. IEEE Access 2020, 8, 148084–148099. [Google Scholar] [CrossRef]
  38. Anwar, M.S.; Wang, J.; Ullah, A.; Khan, W.; Ahmad, S.; Li, Z. Impact of Stalling on QoE for 360-degree Virtual Reality Videos. In Proceedings of the 2019 IEEE International Conference on Signal, Information and Data Processing (ICSIDP), Chongqing, China, 11–13 December 2019; pp. 1–6. [Google Scholar]
  39. Tran, H.T.; Ngoc, N.P.; Pham, C.T.; Jung, Y.J.; Thang, T.C. A subjective study on QoE of 360 video for VR communication. In Proceedings of the 2017 IEEE 19th International Workshop on Multimedia Signal Processing (MMSP), Lodon, UK, 6–18 October 2017; pp. 1–6. [Google Scholar]
  40. Kim, Y.Y.; Kim, H.J.; Kim, E.N.; Ko, H.D.; Kim, H.T. Characteristic changes in the physiological components of cybersickness. Psychophysiology 2005, 42, 616–625. [Google Scholar] [CrossRef] [PubMed]
  41. Rebenitsch, L.; Owen, C. Review on cybersickness in applications and visual displays. Virtual Real. 2016, 20, 101–125. [Google Scholar] [CrossRef]
  42. Hettinger, L.J.; Riccio, G.E. Visually induced motion sickness in virtual environments. Presence Teleoperators Virtual Environ. 1992, 1, 306–310. [Google Scholar] [CrossRef]
  43. Fremerey, S.; Singla, A.; Meseberg, K.; Raake, A. AVtrack360: An open dataset and software recording people’s head rotations watching 360 videos on an HMD. In Proceedings of the 9th ACM Multimedia Systems Conference, Amsterdam, The Netherlands, 12–15 June 2018; pp. 403–408. [Google Scholar]
  44. Stauffert, J.P.; Niebling, F.; Latoschik, M.E. Towards comparable evaluation methods and measures for timing behavior of virtual reality systems. In Proceedings of the 22nd ACM Conference on Virtual Reality Software and Technology, Munich, Germany, 2–4 November 2016; pp. 47–50. [Google Scholar]
  45. Zielinski, D.J.; Rao, H.M.; Sommer, M.A.; Kopper, R. Exploring the effects of image persistence in low frame rate virtual environments. In Proceedings of the 2015 IEEE Virtual Reality (VR), Houston, TX, USA, 13–17 March 2015; pp. 19–26. [Google Scholar]
  46. Fernandes, A.S.; Feiner, S.K. Combating VR sickness through subtle dynamic field-of-view modification. In Proceedings of the 2016 IEEE Symposium on 3D User Interfaces (3DUI), Greenville, SC, USA, 19–20 March 2016; pp. 201–210. [Google Scholar]
  47. Carnegie, K.; Rhee, T. Reducing visual discomfort with HMDs using dynamic depth of field. IEEE Comput. Graph. Appl. 2015, 35, 34–41. [Google Scholar] [CrossRef]
  48. Egan, D.; Brennan, S.; Barrett, J.; Qiao, Y.; Timmerer, C.; Murray, N. An evaluation of Heart Rate and ElectroDermal Activity as an objective QoE evaluation method for immersive virtual reality environments. In Proceedings of the 2016 Eighth International Conference on Quality of Multimedia Experience (QoMEX), Lisbon, Portugal, 6–8 June 2016; pp. 1–6. [Google Scholar]
  49. Staelens, N.; Moens, S.; Van den Broeck, W.; Marien, I.; Vermeulen, B.; Lambert, P.; Van de Walle, R.; Demeester, P. Assessing quality of experience of IPTV and video on demand services in real-life environments. IEEE Trans. Broadcast. 2010, 56, 458–466. [Google Scholar] [CrossRef] [Green Version]
  50. Regenbrecht, H.; Schubert, T. Real and illusory interactions enhance presence in virtual environments. Presence Teleoperators Virtual Environ. 2002, 11, 425–434. [Google Scholar] [CrossRef]
  51. Rebenitsch, L.R. Cybersickness Prioritization and Modeling; Michigan State University: East Lansing, MI, USA, 2015. [Google Scholar]
  52. Bruck, S.; Watters, P.A. Estimating cybersickness of simulated motion using the simulator sickness questionnaire (SSQ): A controlled study. In Proceedings of the 2009 Sixth International Conference on Computer Graphics, Imaging and Visualization; Institute of Electrical and Electronics Engineers (IEEE), Tianjin, China, 11–14 August 2009; pp. 486–488. [Google Scholar]
  53. Kim, J.; Kim, W.; Ahn, S.; Kim, J.; Lee, S. Virtual reality sickness predictor: Analysis of visual-vestibular conflict and vr contents. In Proceedings of the 2018 Tenth International Conference on Quality of Multimedia Experience (QoMEX), Sardinia, Italy, 29–31 May 2018; pp. 1–6. [Google Scholar]
  54. Kim, H.G.; Lim, H.T.; Lee, S.; Ro, Y.M. Vrsa net: Vr sickness assessment considering exceptional motion for 360 vr video. IEEE Trans. Image Process. 2018, 28, 1646–1660. [Google Scholar] [CrossRef] [PubMed]
  55. Jeong, H.; Kim, H.G.; Ro, Y.M. Visual comfort assessment of stereoscopic images using deep visual and disparity features based on human attention. In Proceedings of the 2017 IEEE International Conference on Image Processing (ICIP), Beijing, China, 17–20 September 2017; pp. 715–719. [Google Scholar]
Figure 1. Complete framework of our study.
Electronics 09 01530 g001
Figure 2. An example of source videos frames.
Electronics 09 01530 g002
Figure 3. Spatial and temporal indexes of source videos.
Electronics 09 01530 g003
Figure 4. An example of a stalling frames with spinning indicator.
Electronics 09 01530 g004
Figure 5. Impact of stalling on perceptual quality: (a) No stalling, (b) single long stalling of 9 s, and (c) multiple short stallings ( 3 × 3 s), (1 = bad, 5 = excellent).
Electronics 09 01530 g005
Figure 6. Average perceptual quality score.
Electronics 09 01530 g006
Figure 7. Impact of stalling on users presence (IPQ-G1): (a) No stalling, (b) single long stalling of 9 s, (c) multiple short stallings ( 3 × 3 s), (5 = fully agree, 1 = fully disagree).
Electronics 09 01530 g007
Figure 8. Average presence score.
Electronics 09 01530 g008
Figure 9. Impact of stalling on users cybersickness level: (a) No stalling, (b) single long stalling of 9 s, and (c) multiple short stallings ( 3 × 3 s).
Electronics 09 01530 g009
Figure 10. User’s sickness level (total score) shown per affecting factor under various stalling events.
Electronics 09 01530 g010
Figure 11. The structure of the proposed Artificial Neural Network (ANN).
Electronics 09 01530 g011
Figure 12. Quality-of-Experience (QoE) prediction with different learning rates.
Electronics 09 01530 g012
Figure 13. PLCC and SRCC performance evaluation of the proposed model.
Electronics 09 01530 g013
Table 1. Detailed specifications of source video.
FactorsFeaturesNameVideo ID (YouTube)ResolutionsFrame Rate
Content TypeFastV18lsB-P8nGSM3840 × 192030 fps
MediumV2D9-i_F3XYhI3840 × 192030 fps
SlowV3mlOiXMvMaZo3840 × 216030 fps
Camera MotionFixedV4ESRz3-btZIA3840 × 192025 fps
HorizontalV59 XR2CZi3V5k3840 × 192025 fps
VerticalV6elhdcvKhgbA3840 × 192025 fps
Moving TargetNo TargetV7L_tqK4eqelA3840 × 216029 fps
Single targetV8ULiXPLH-WA43840 × 204829 fps
Multiple TargetsV9p9h3ZqJa1iA3840 × 216025 fps
Table 2. Computation of the Simulator Sickness Questionnaire (SSQ) score. Total obtained by adding the symptom score, N = [a] × 9.54 , O = [b] × 7.58 , D = [c] × 13.92 , Total Score (TS) = [a] + [b] + [c] × 3.74.
SSQ Symptoms (0,1,2,3)NOD
General discomfort11
Fatigue 1
Headache 1
Eye strain 1
Difficulty focusing 11
Increased salivation1
Sweating1
Nausea1 1
Difficulty concentrating11
Fullness of head 1
Blurred vision 11
Dizzy (Eye open) 1
Dizzy (Eye closed) 1
Vertigo 1
Stomach awareness1
Burping1
Total[a][b][c]
Table 3. Performance evaluation of subjects score for all three questions. Pearson Linear Correlation Coefficient (PLCC). Spearman’s Rank-order Correlation Coefficient (SRCC).
QuestionsPLCCSRCC
Q10.88340.8735
Q20.90050.8961
Q30.90150.8912
Table 4. Categorization of the total SSQ Score and Sickness Level.
Total Score (TS)Sickness LevelOutput Variable
0 to 10Normal Sickness0
11 to 31Slight Sickness1
32 to 40Enough Sickness2
40 aboveSevere Sickness3
Table 5. Performance comparison of the proposed QoE prediction model.
MethodPrecisionRecallf1-ScoreMAEAccuracy
KNN0.840.820.830.19 80 %
ANN0.910.910.900.9 90 %
SVM0.850.830.820.18 83 %
DT0.870.830.820.17 83 %

