Optimization of FireNet for Liver Lesion Classification


Abstract
:1. Introduction
2. Related Work
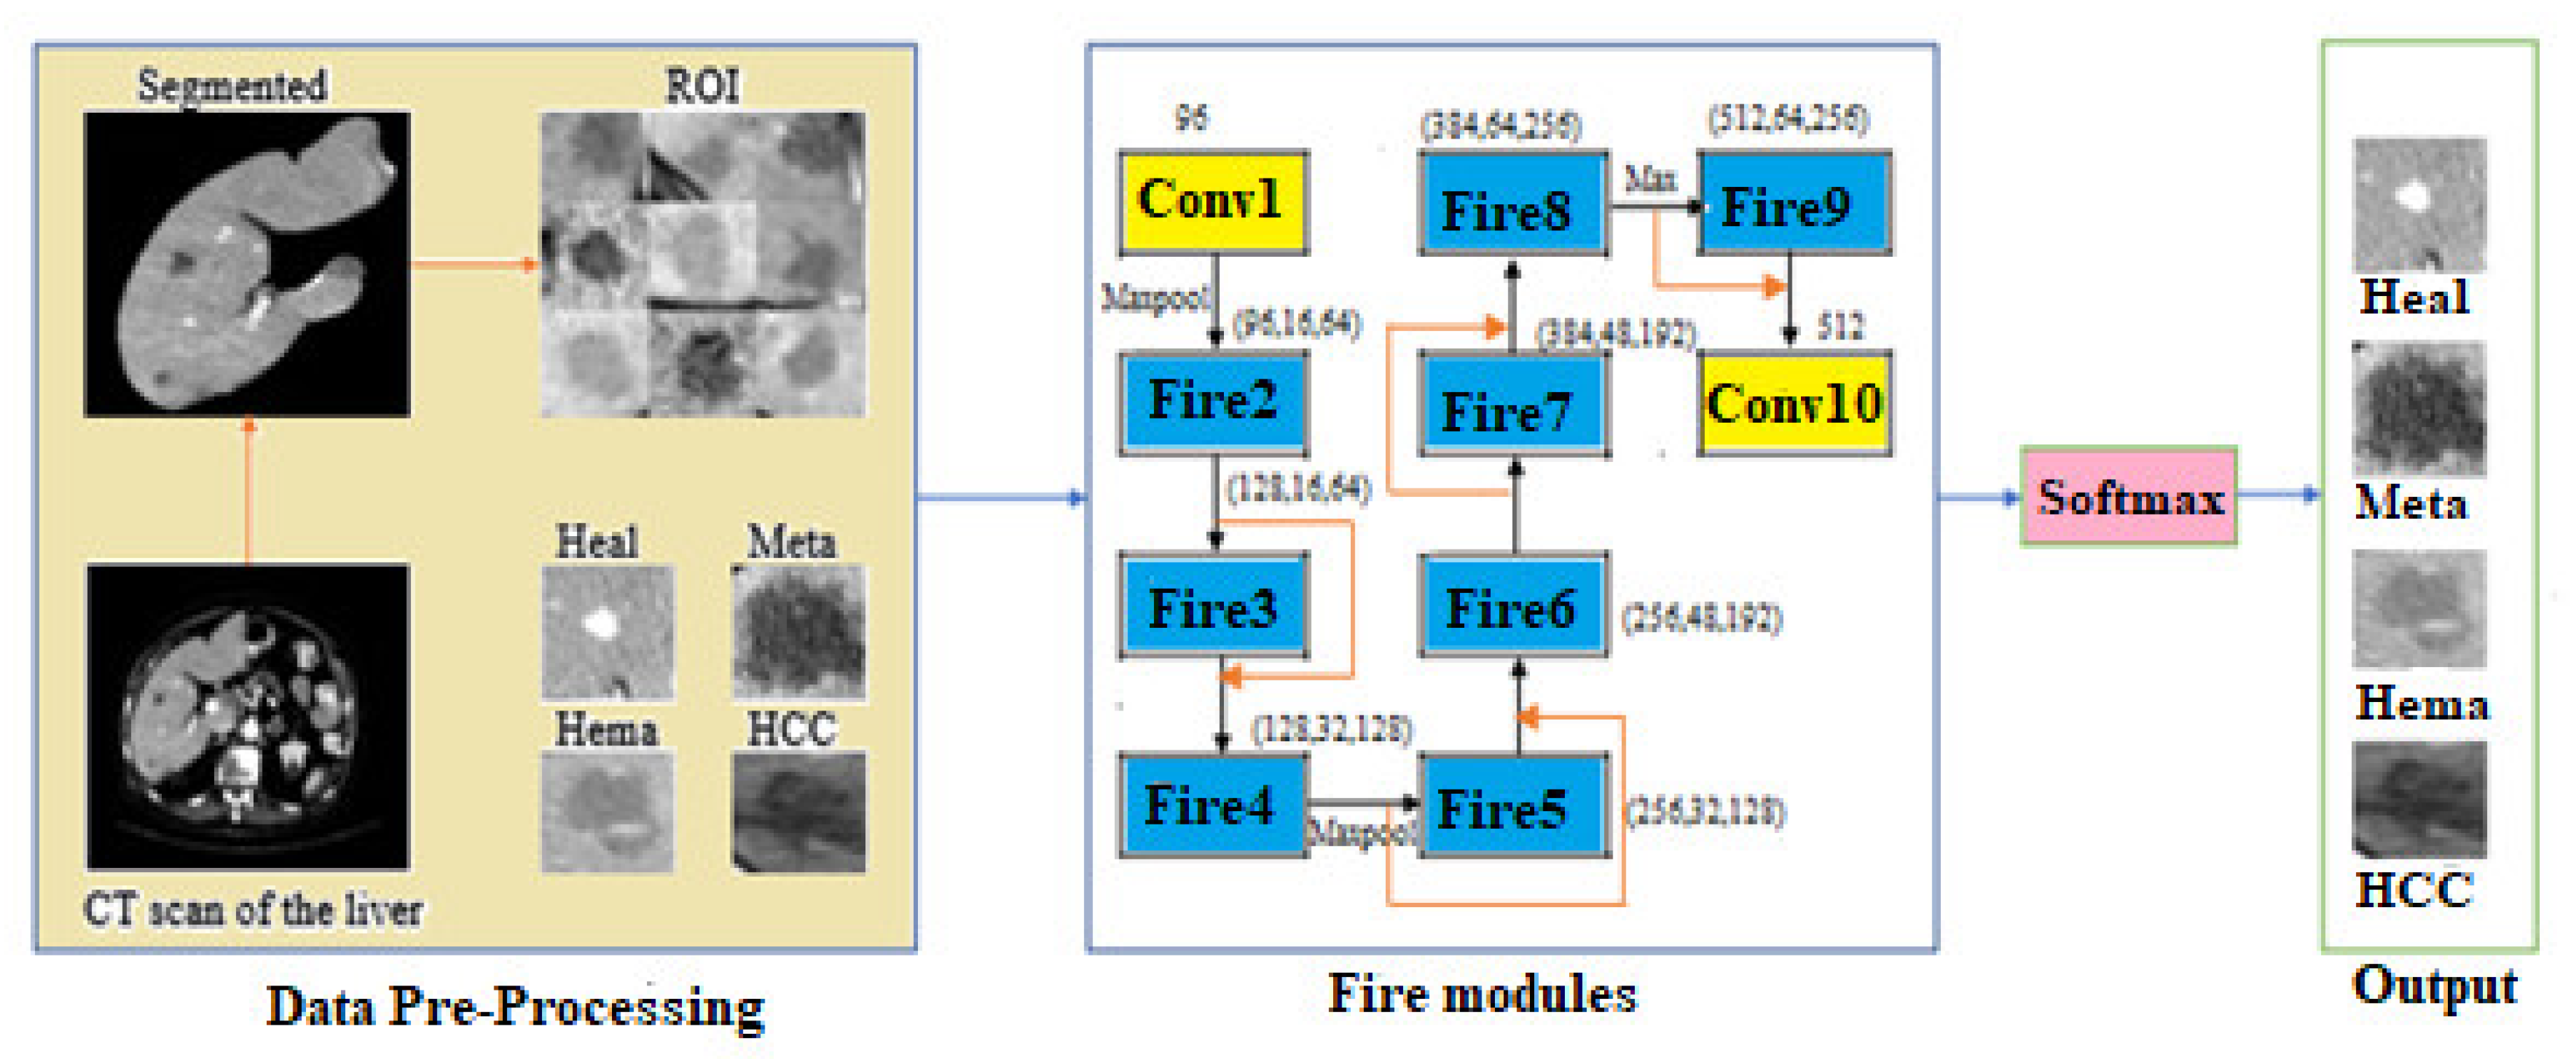
3. Proposed Model
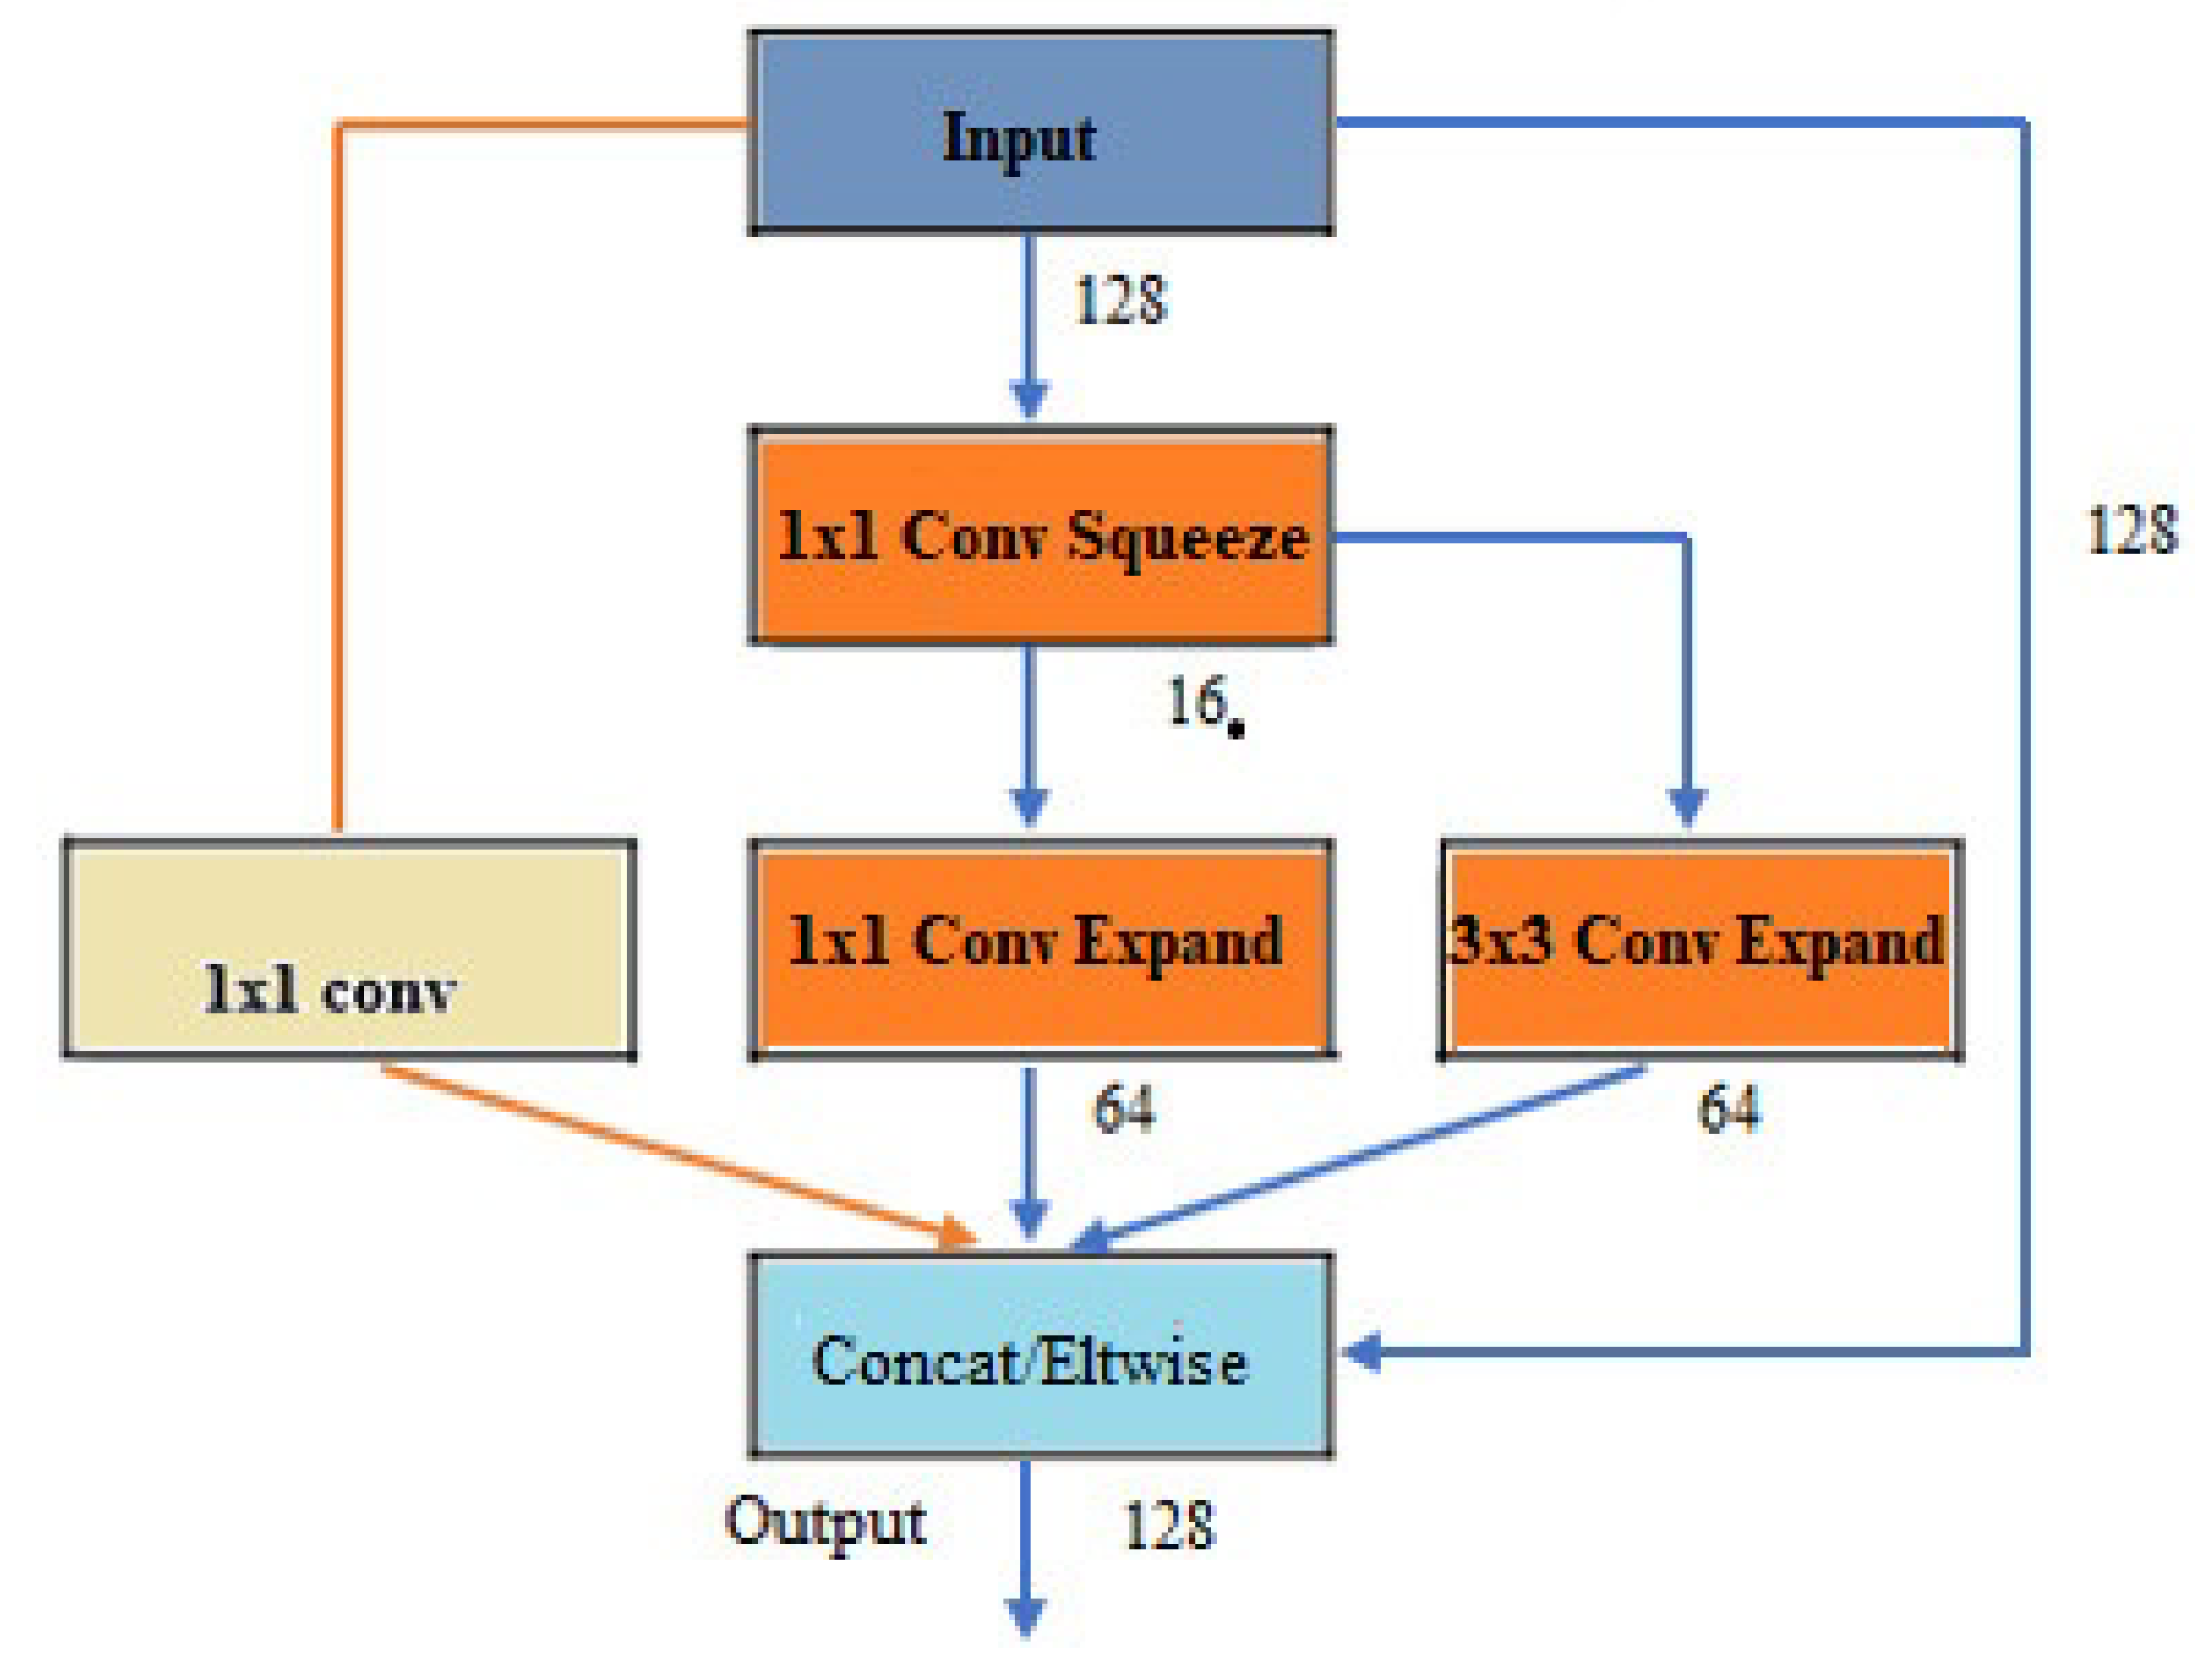
3.1. Architecture of FireNet
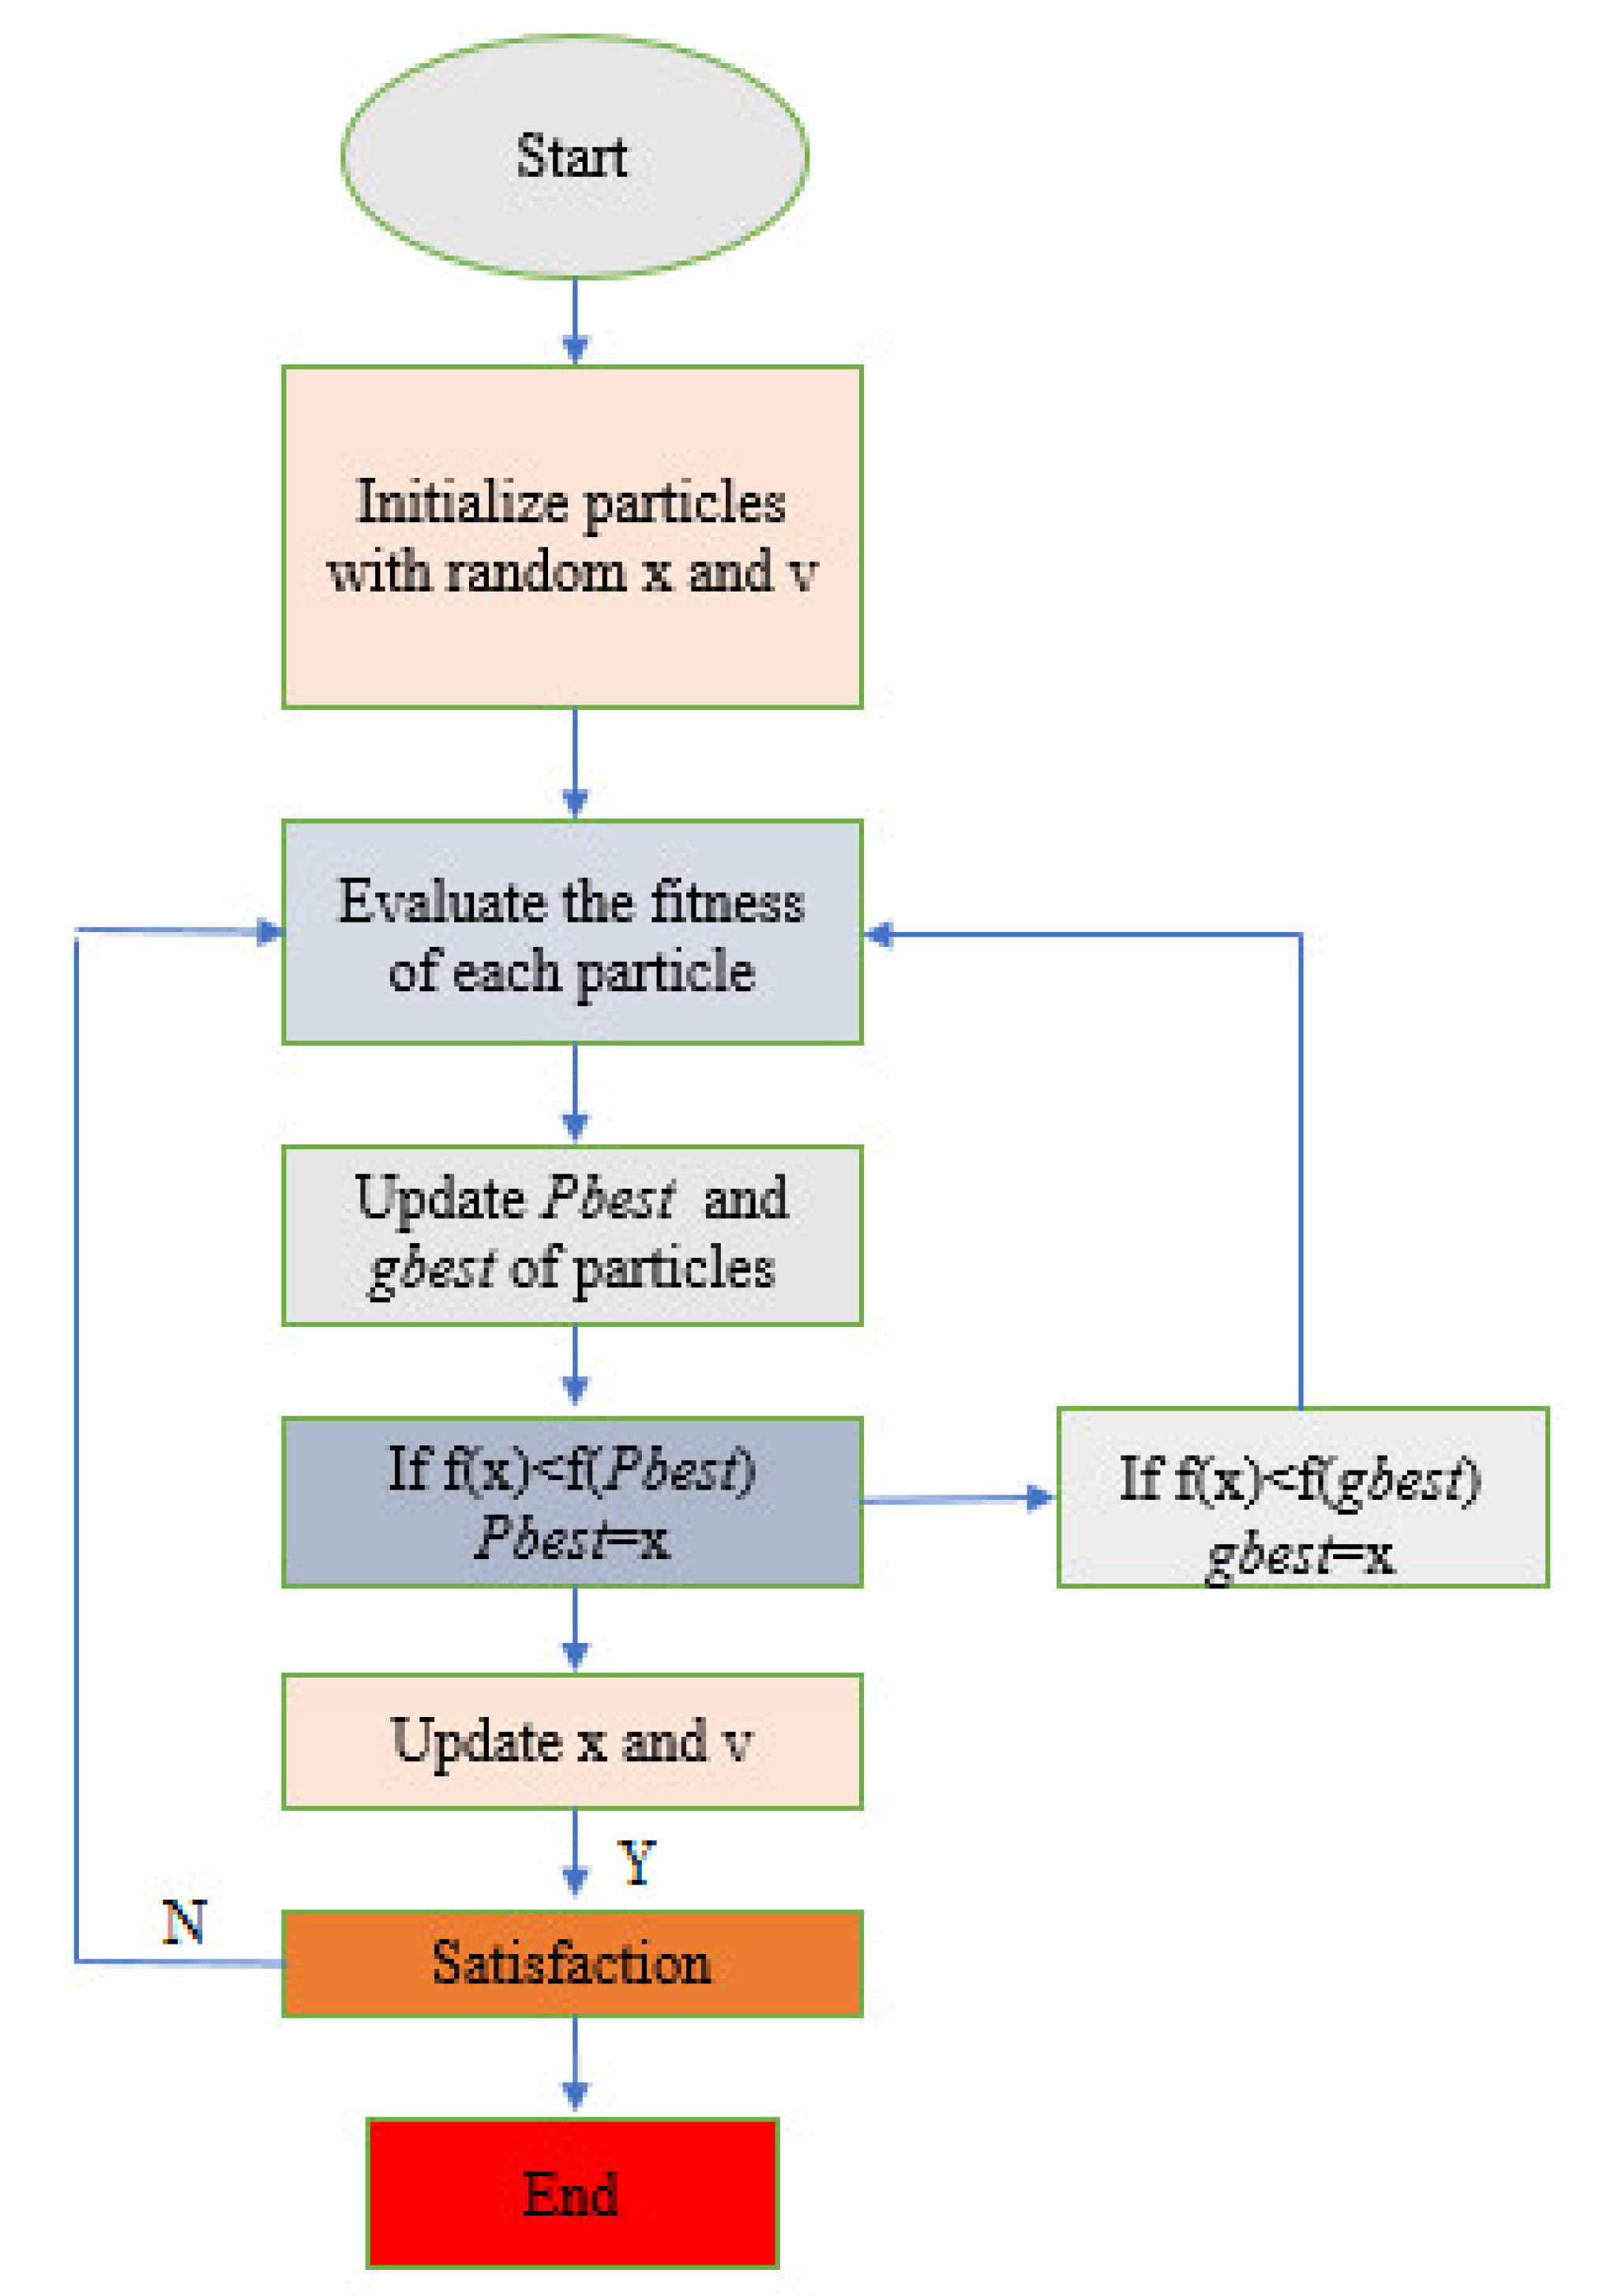
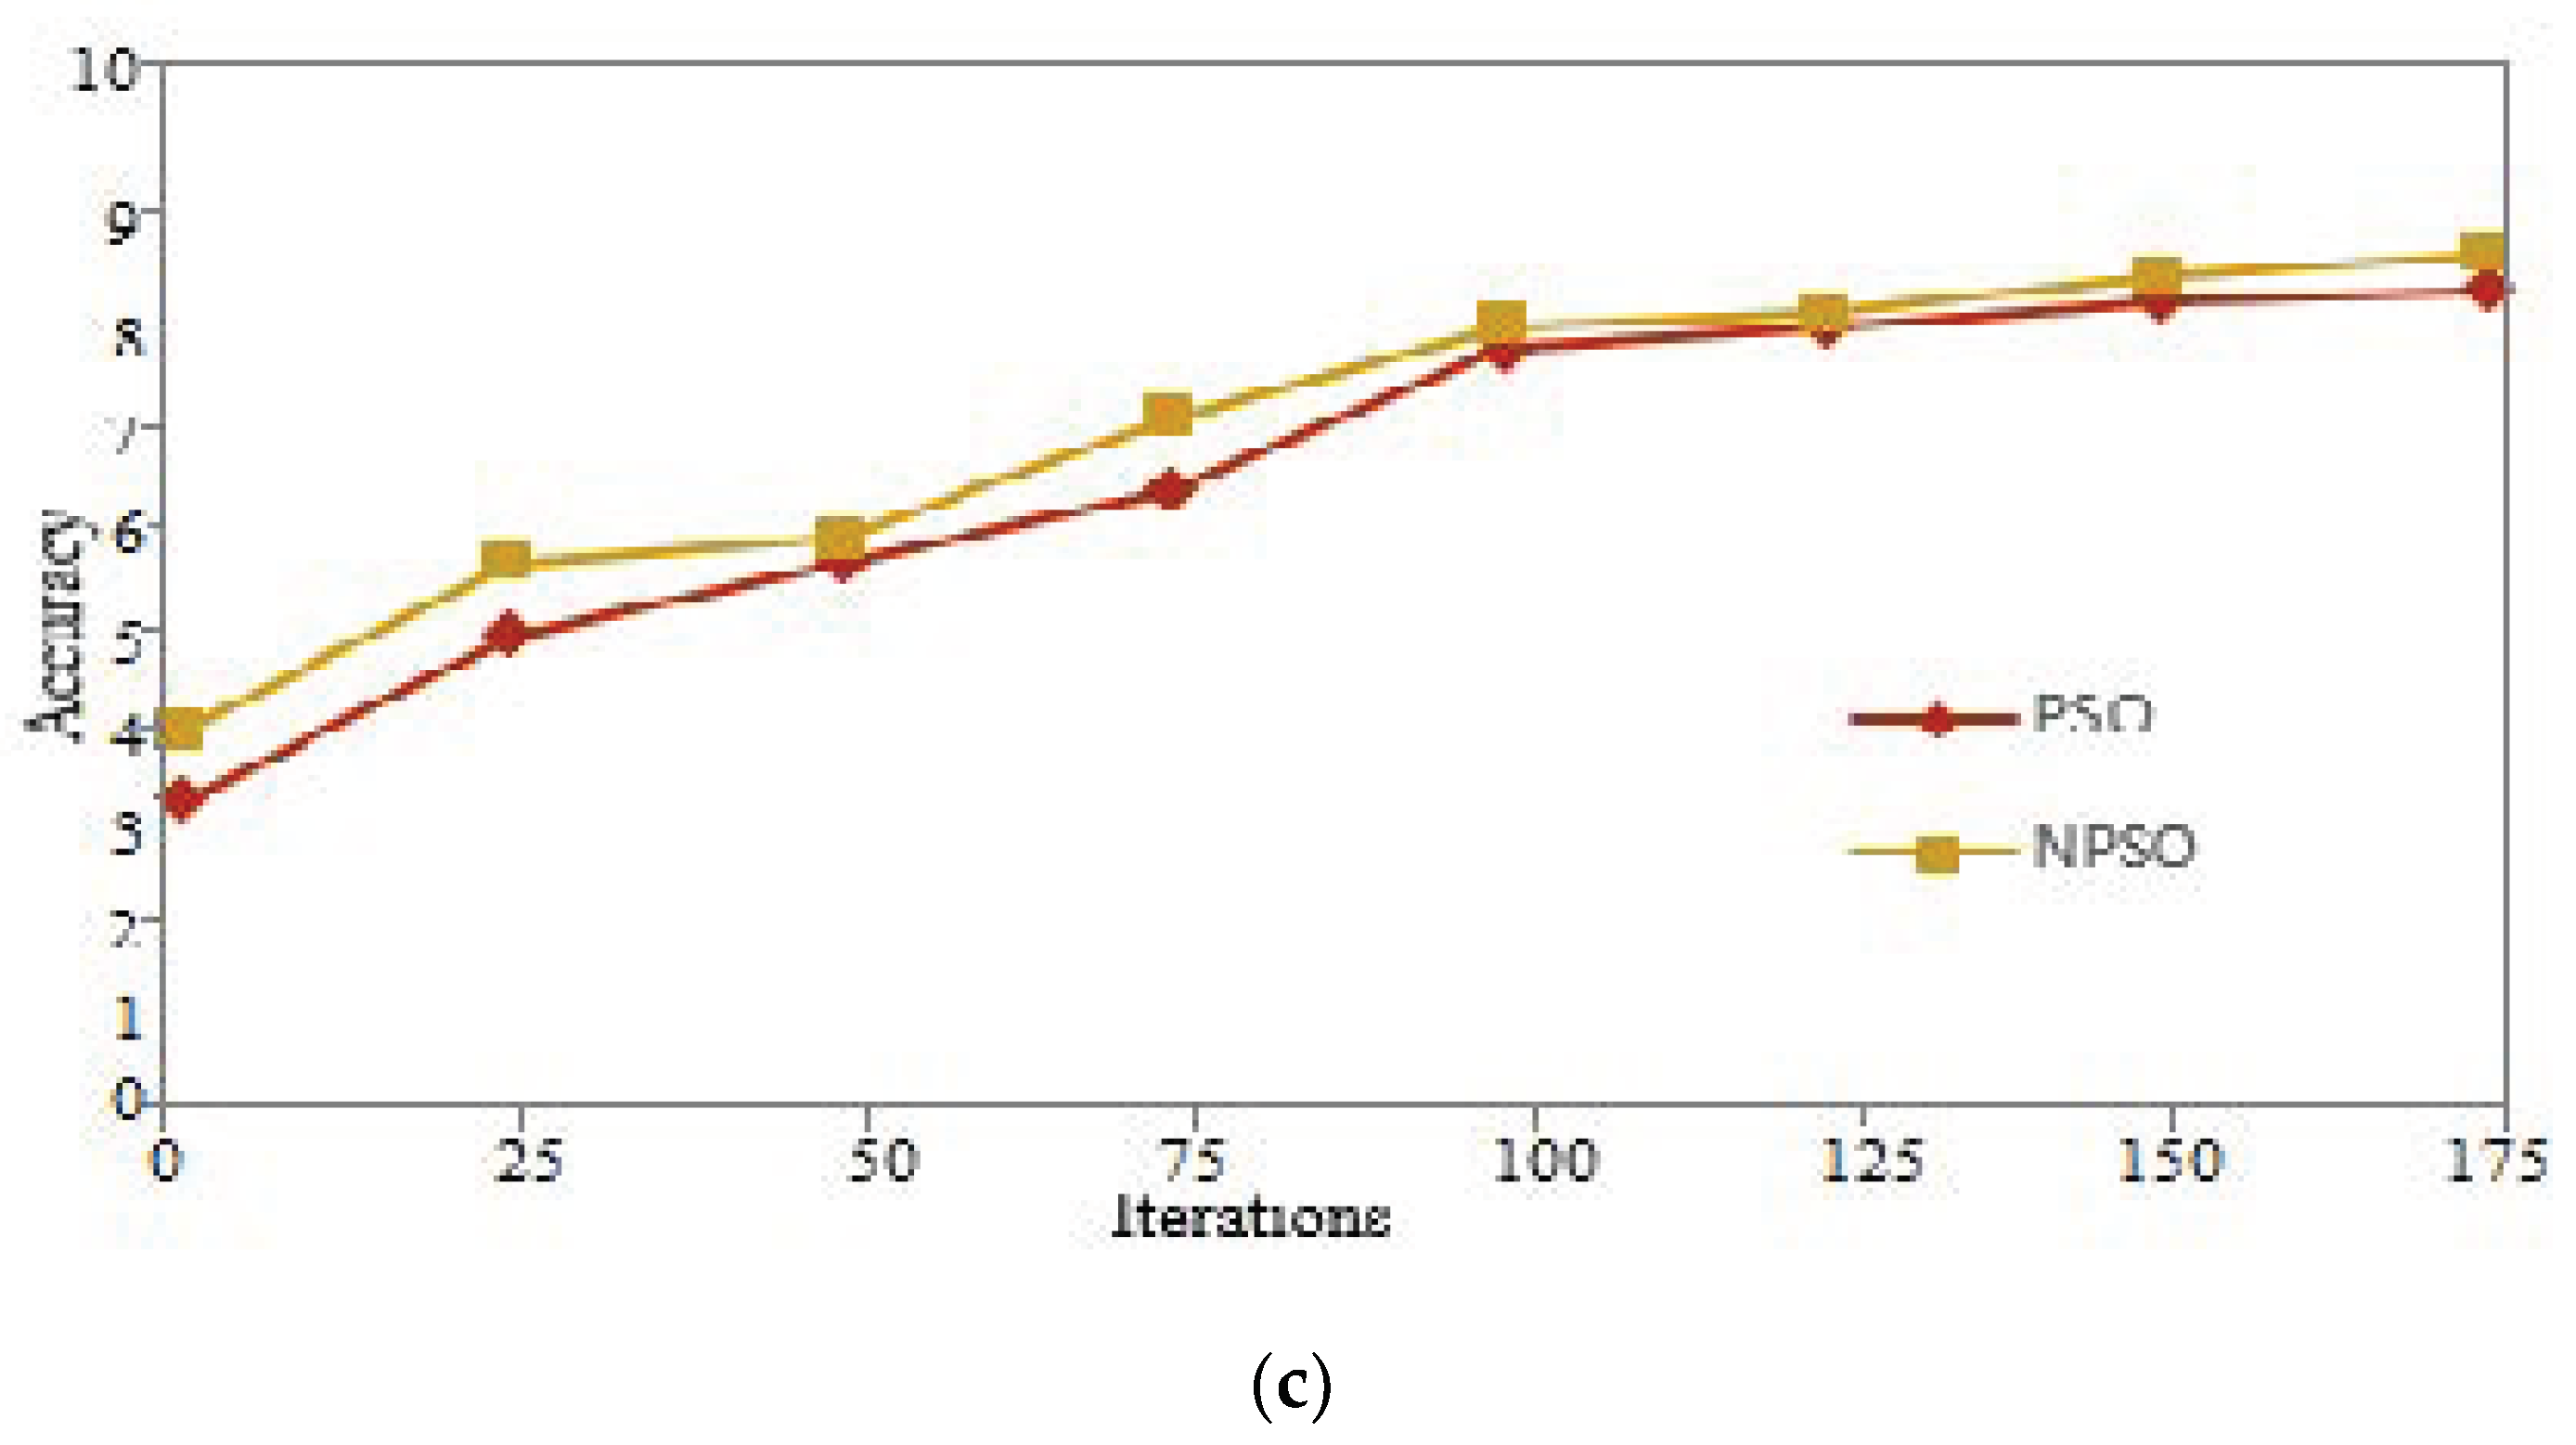
3.2. A Brief Overview of PSO
- Step 1:
- Initialize the original position and velocity of particle swarm;
- Step 2:
- Evaluate the fitness of each particle;
- Step 3:
- Determine gbest from PSO Swarm; determine pbest from PSO Swarm;
- Step 4:
- If f(x) < f(gbest), update the swarm, gbest = x;
- Step 5:
- Repeat until certain termination criteria are met
- Step 5.1:
- Pick random numbers r1 and r2;
- Step 5.2:
- Update every particle’s velocity;
- Step 5.3:
- Update every particle’s position;
- Step 5.4:
- If f(x) < f(pbest), update the particle pbest = x.If f(x) < f(gbest), update the swarm, gbest = x.
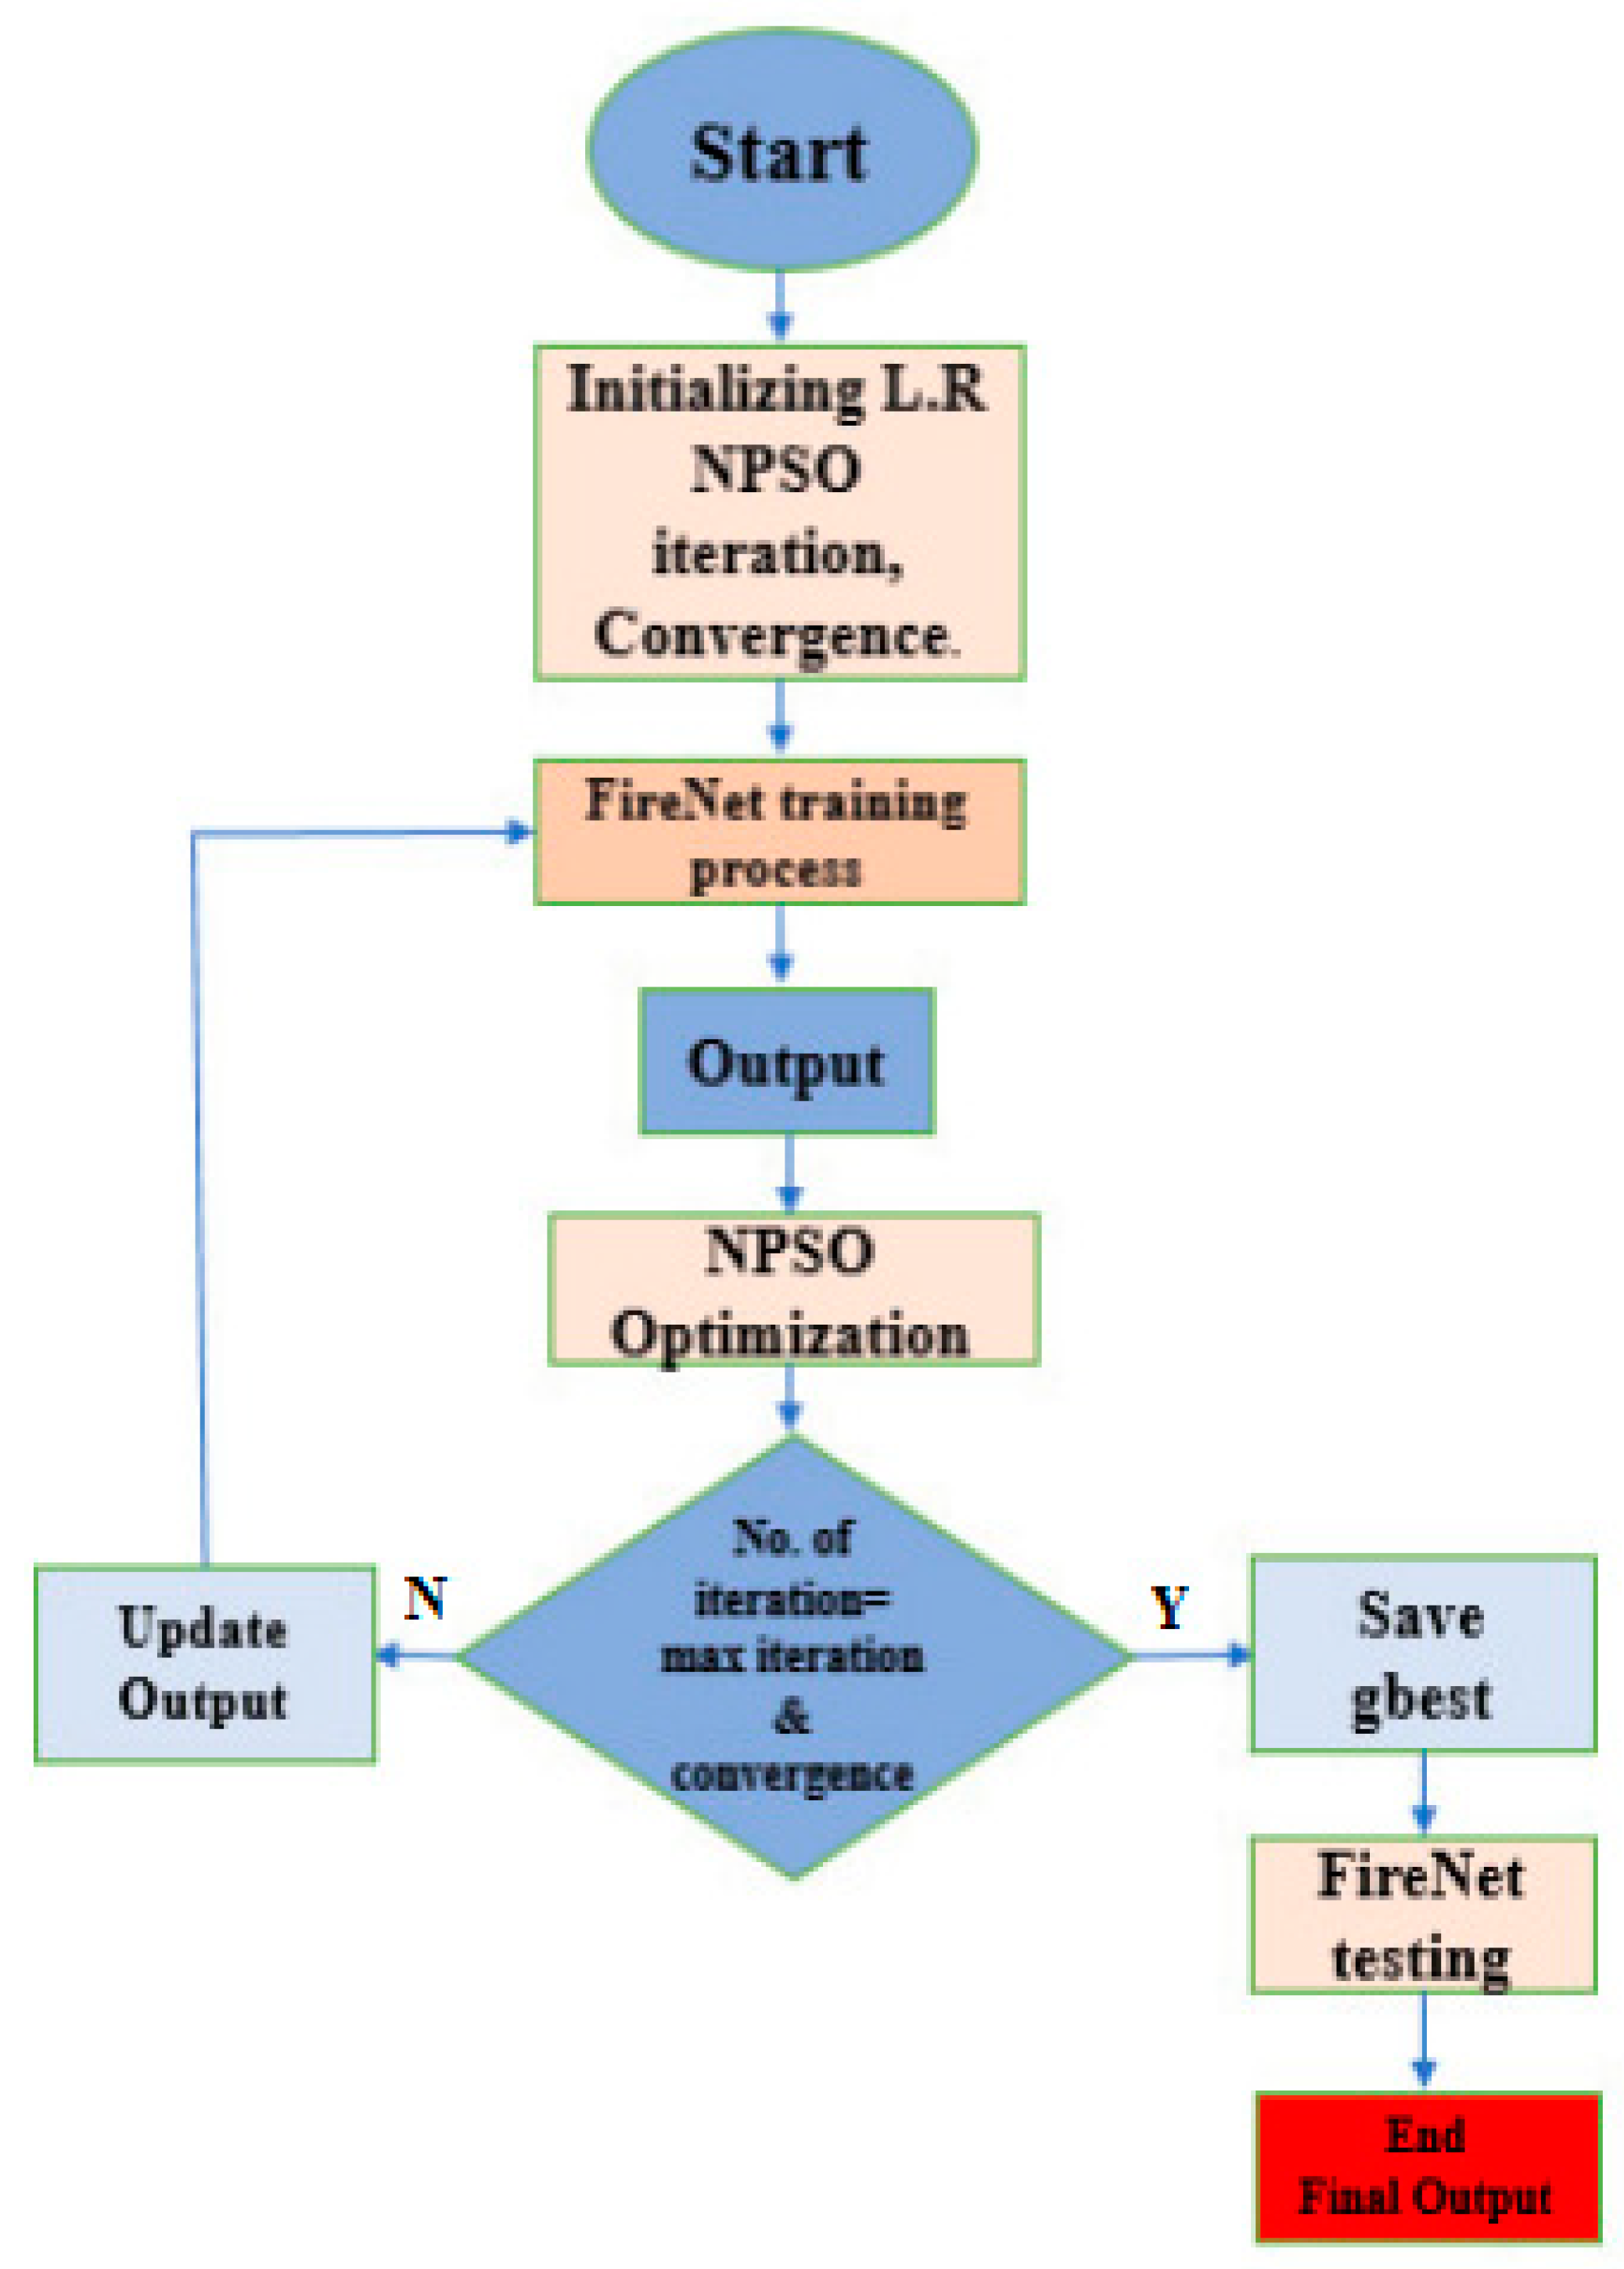
3.3. A New Particle Swarm Optimization (NPSO)
- Step1:
- Initialize the learning rate of the proposed FireNet model, batch size. NPSO is used to control the convergences of the model. After three iterations, if the error value does not change, then the NPSO is considered convergent;
- Step2:
- FireNet training process;
- Step3:
- The result of FireNet are optimized by using the NPSO algorithm;
- Step4:
- The output of FireNet is updated if the solution of the swarm has less error than the old output;
- Step5:
- FireNet for testing;
- Step6:
- Final output is the accuracy of FireNet.
4. Experiment and Results
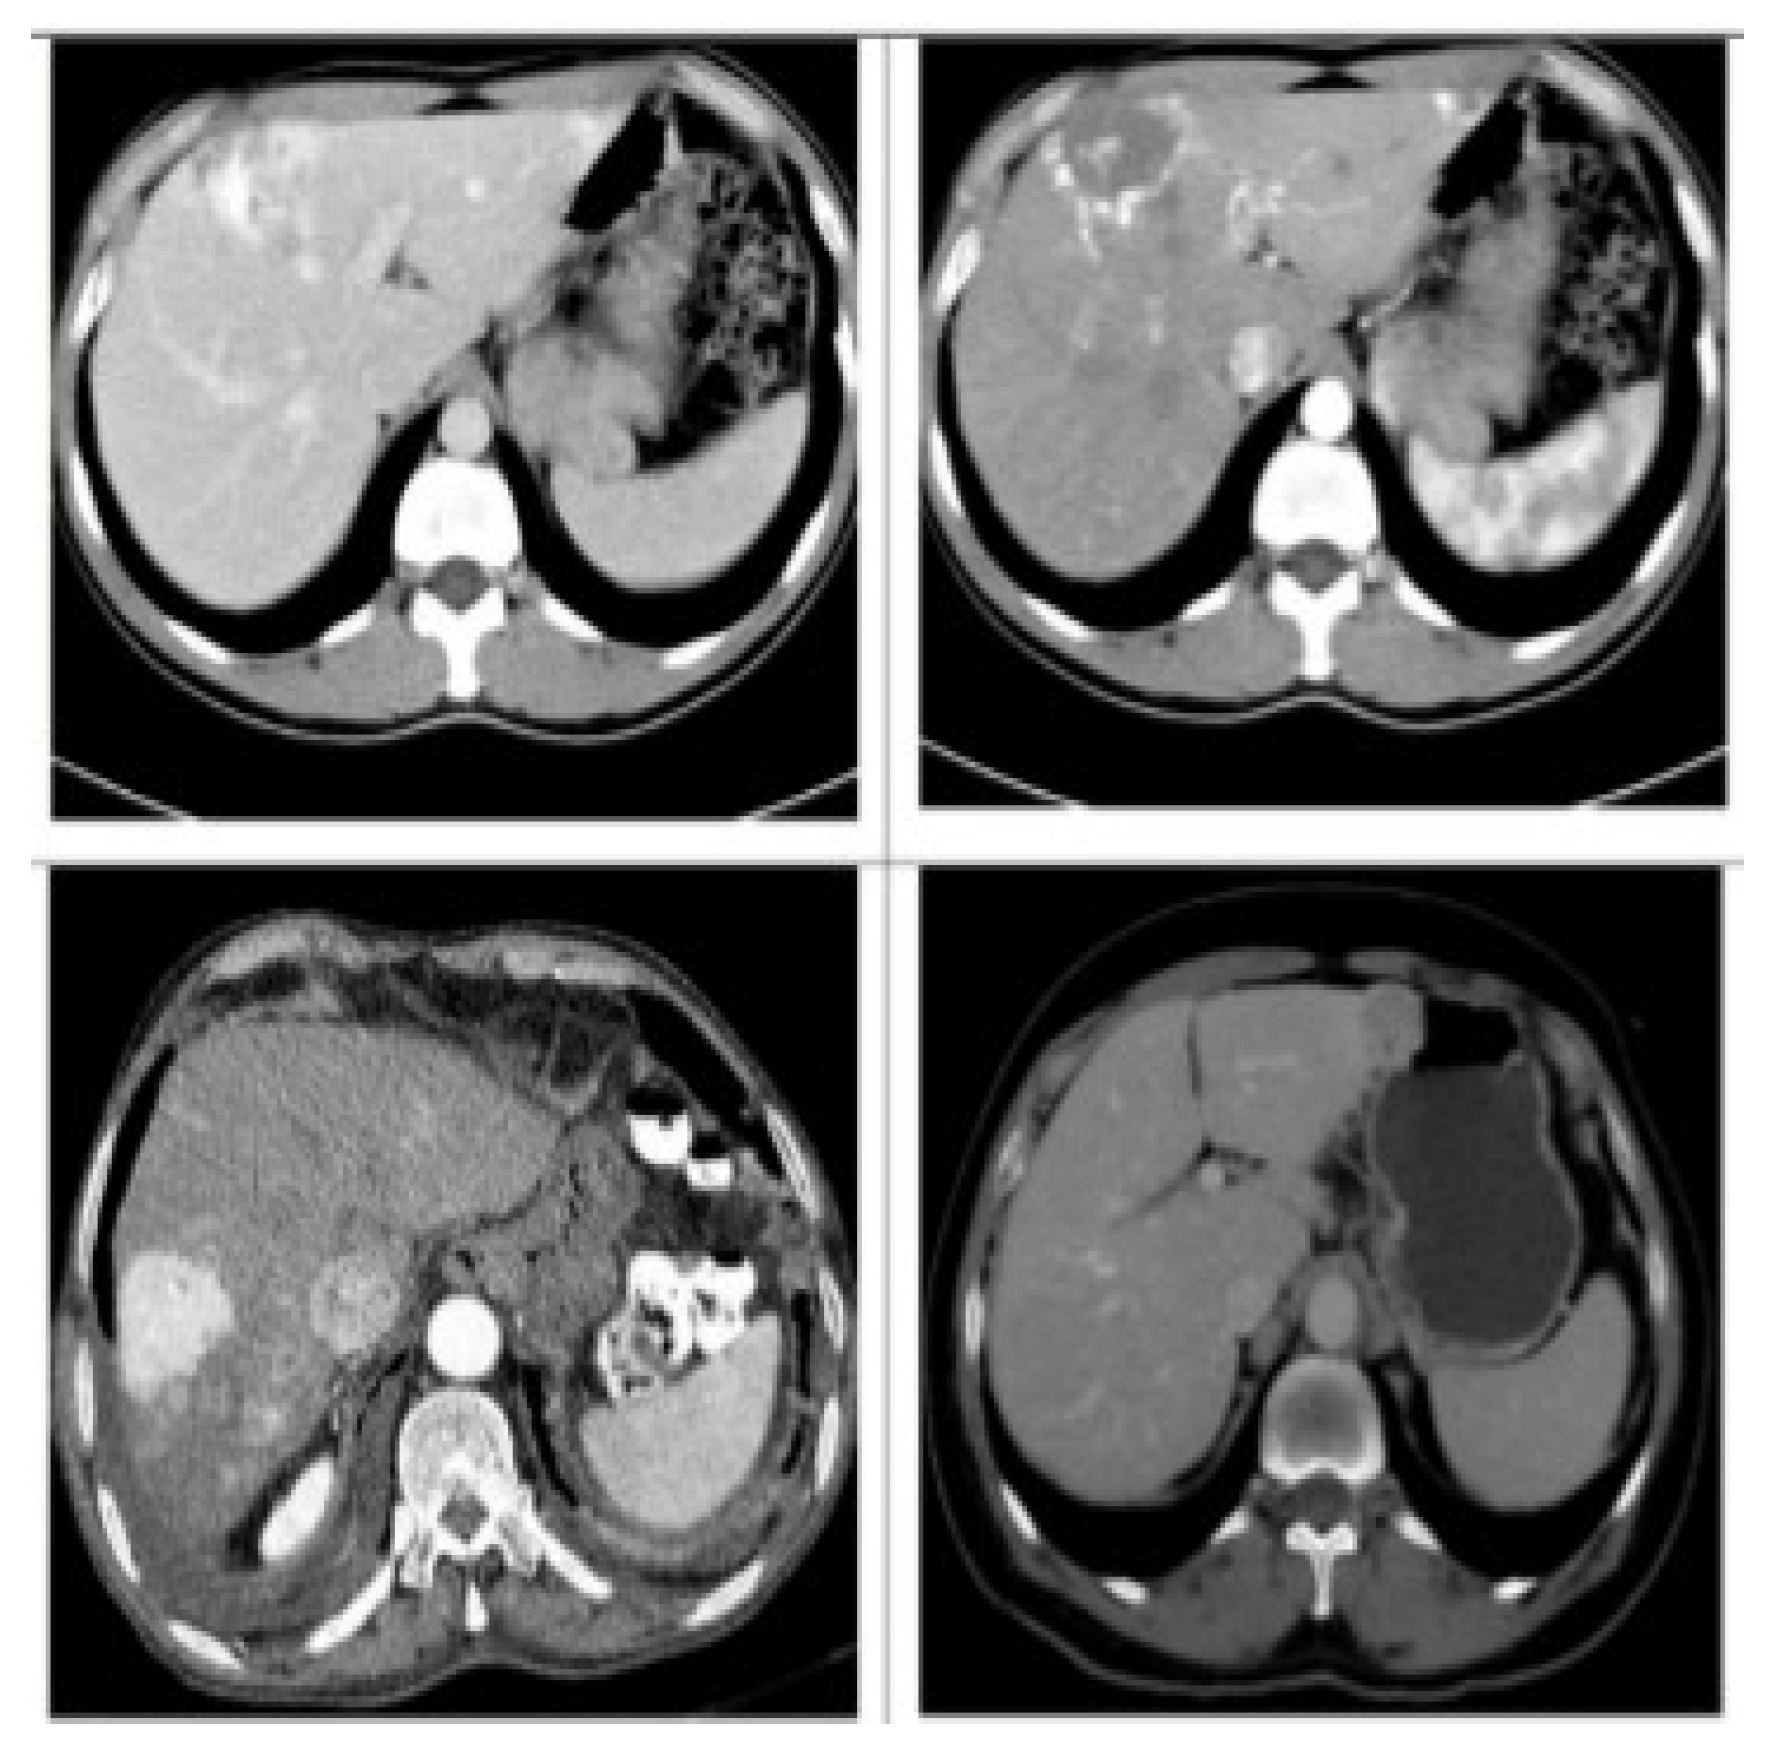
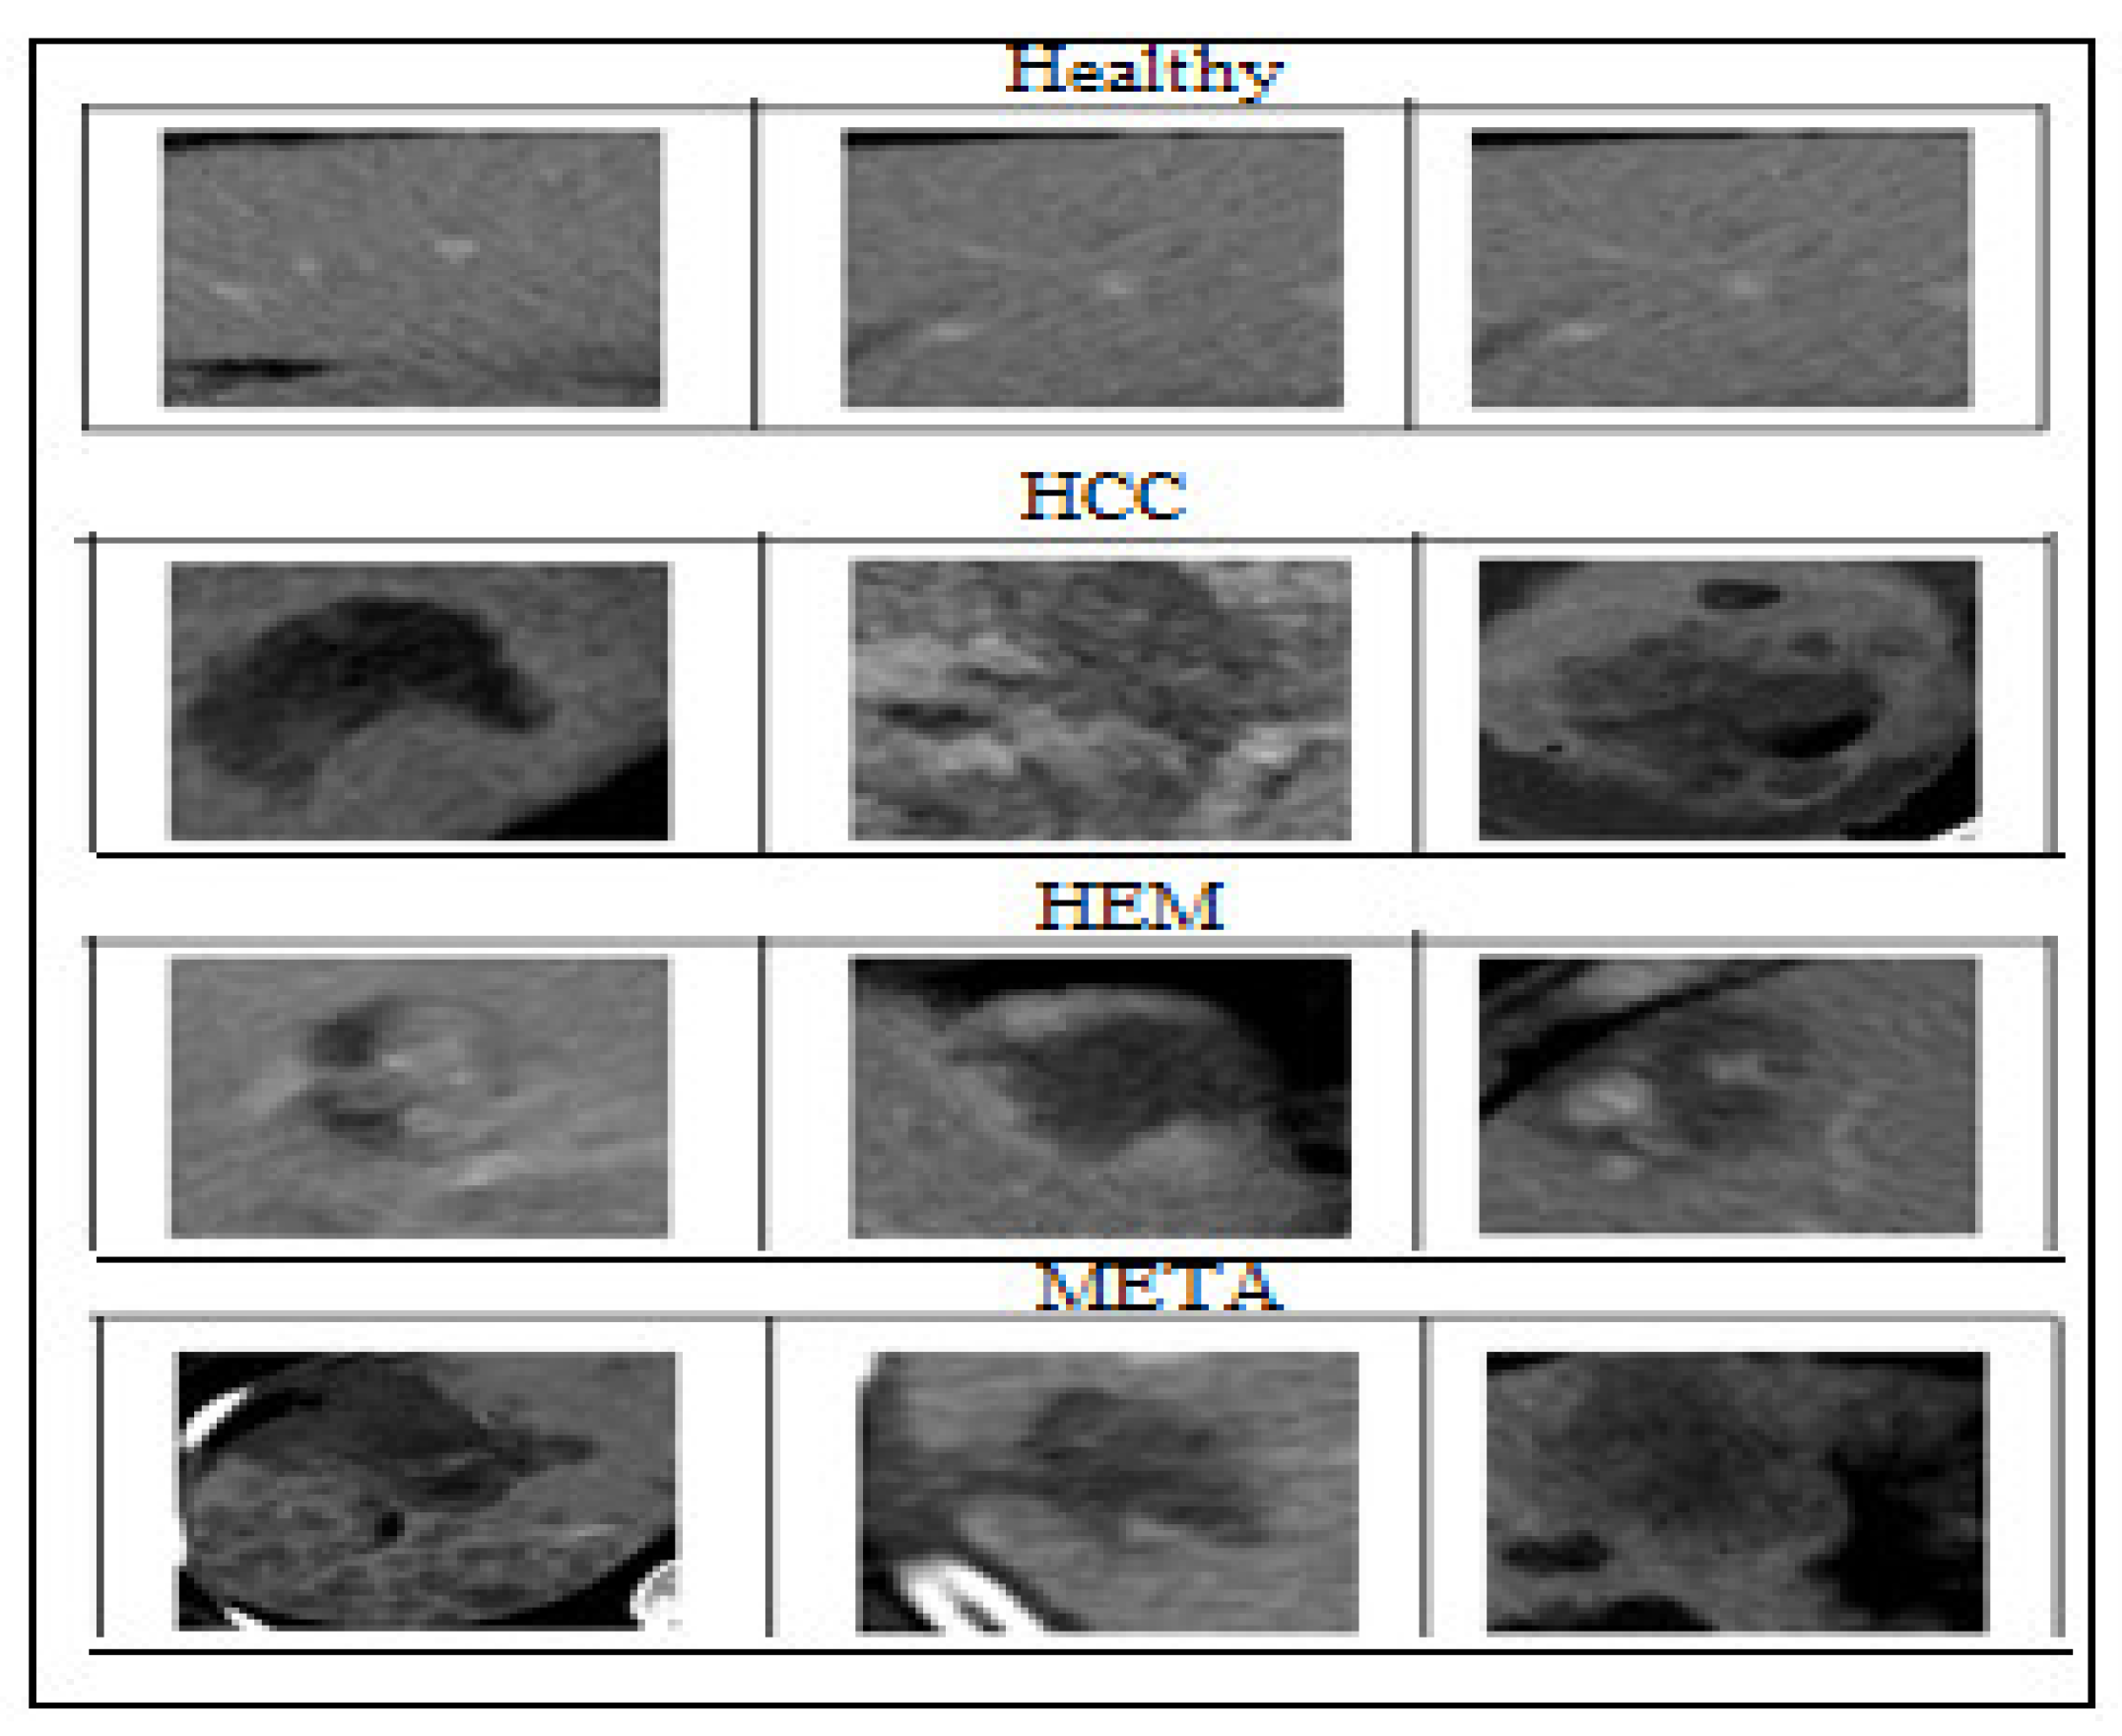
4.1. Dataset
4.2. Experiment
4.3. Results
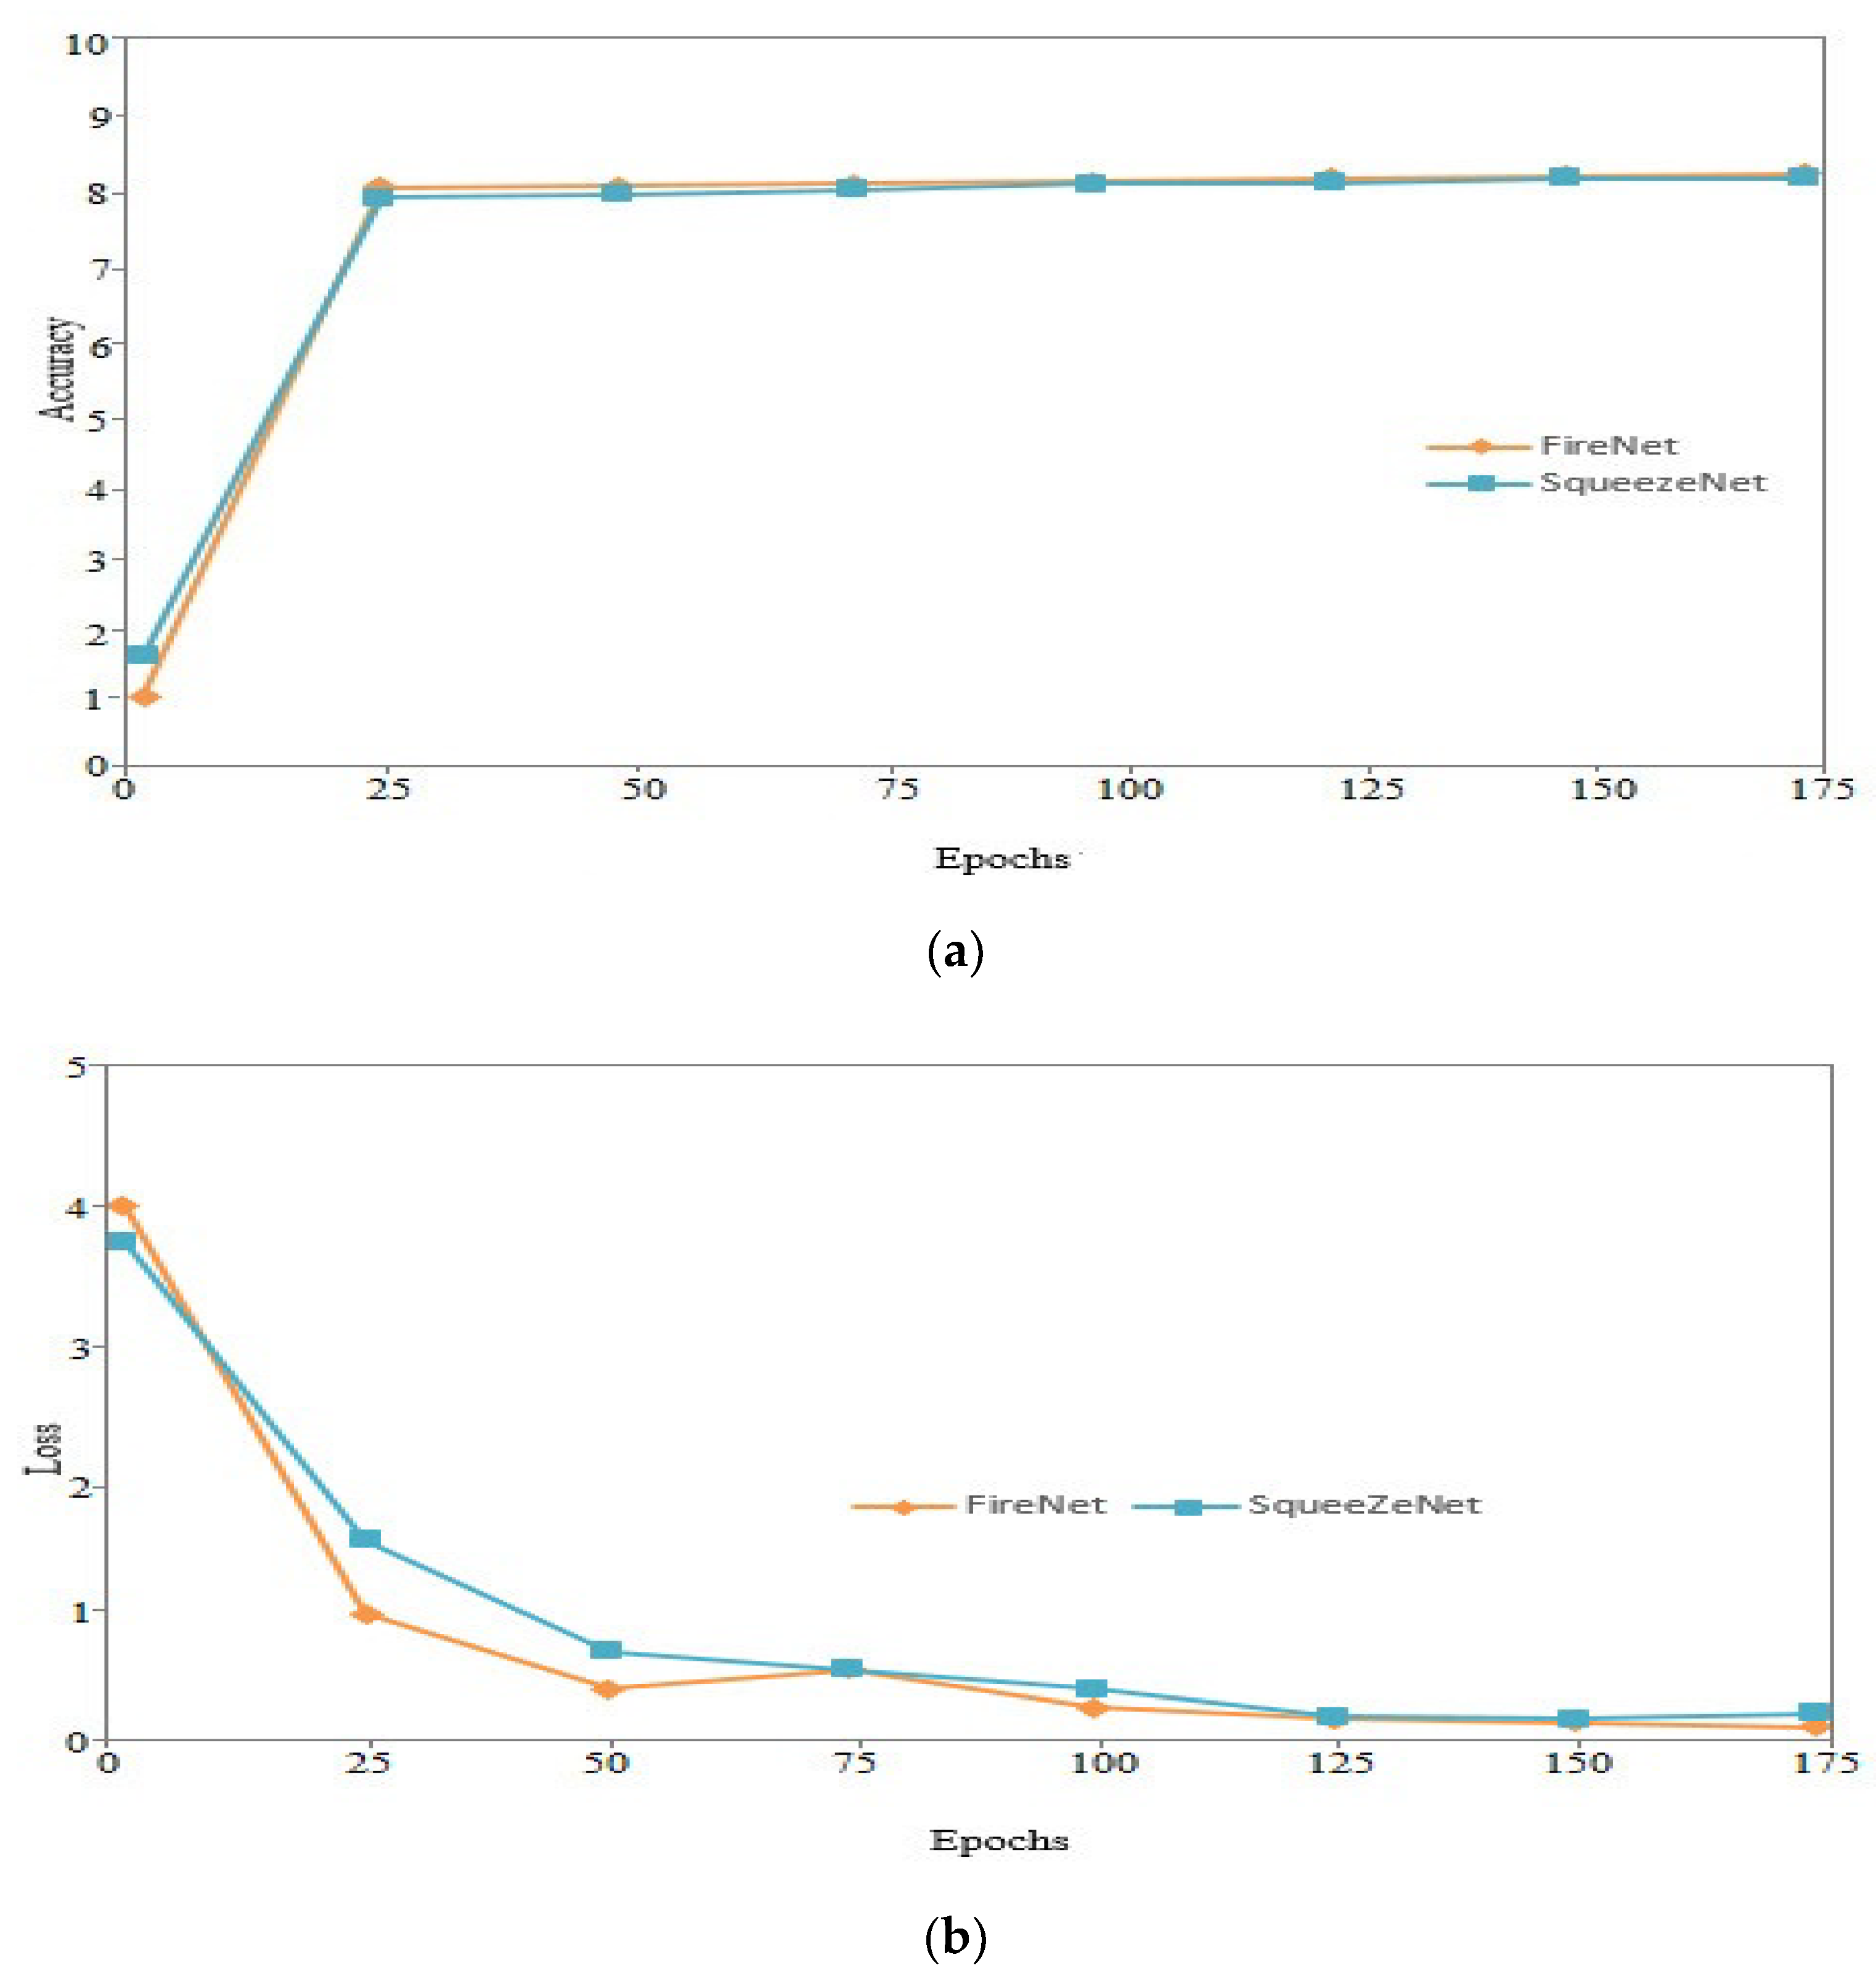
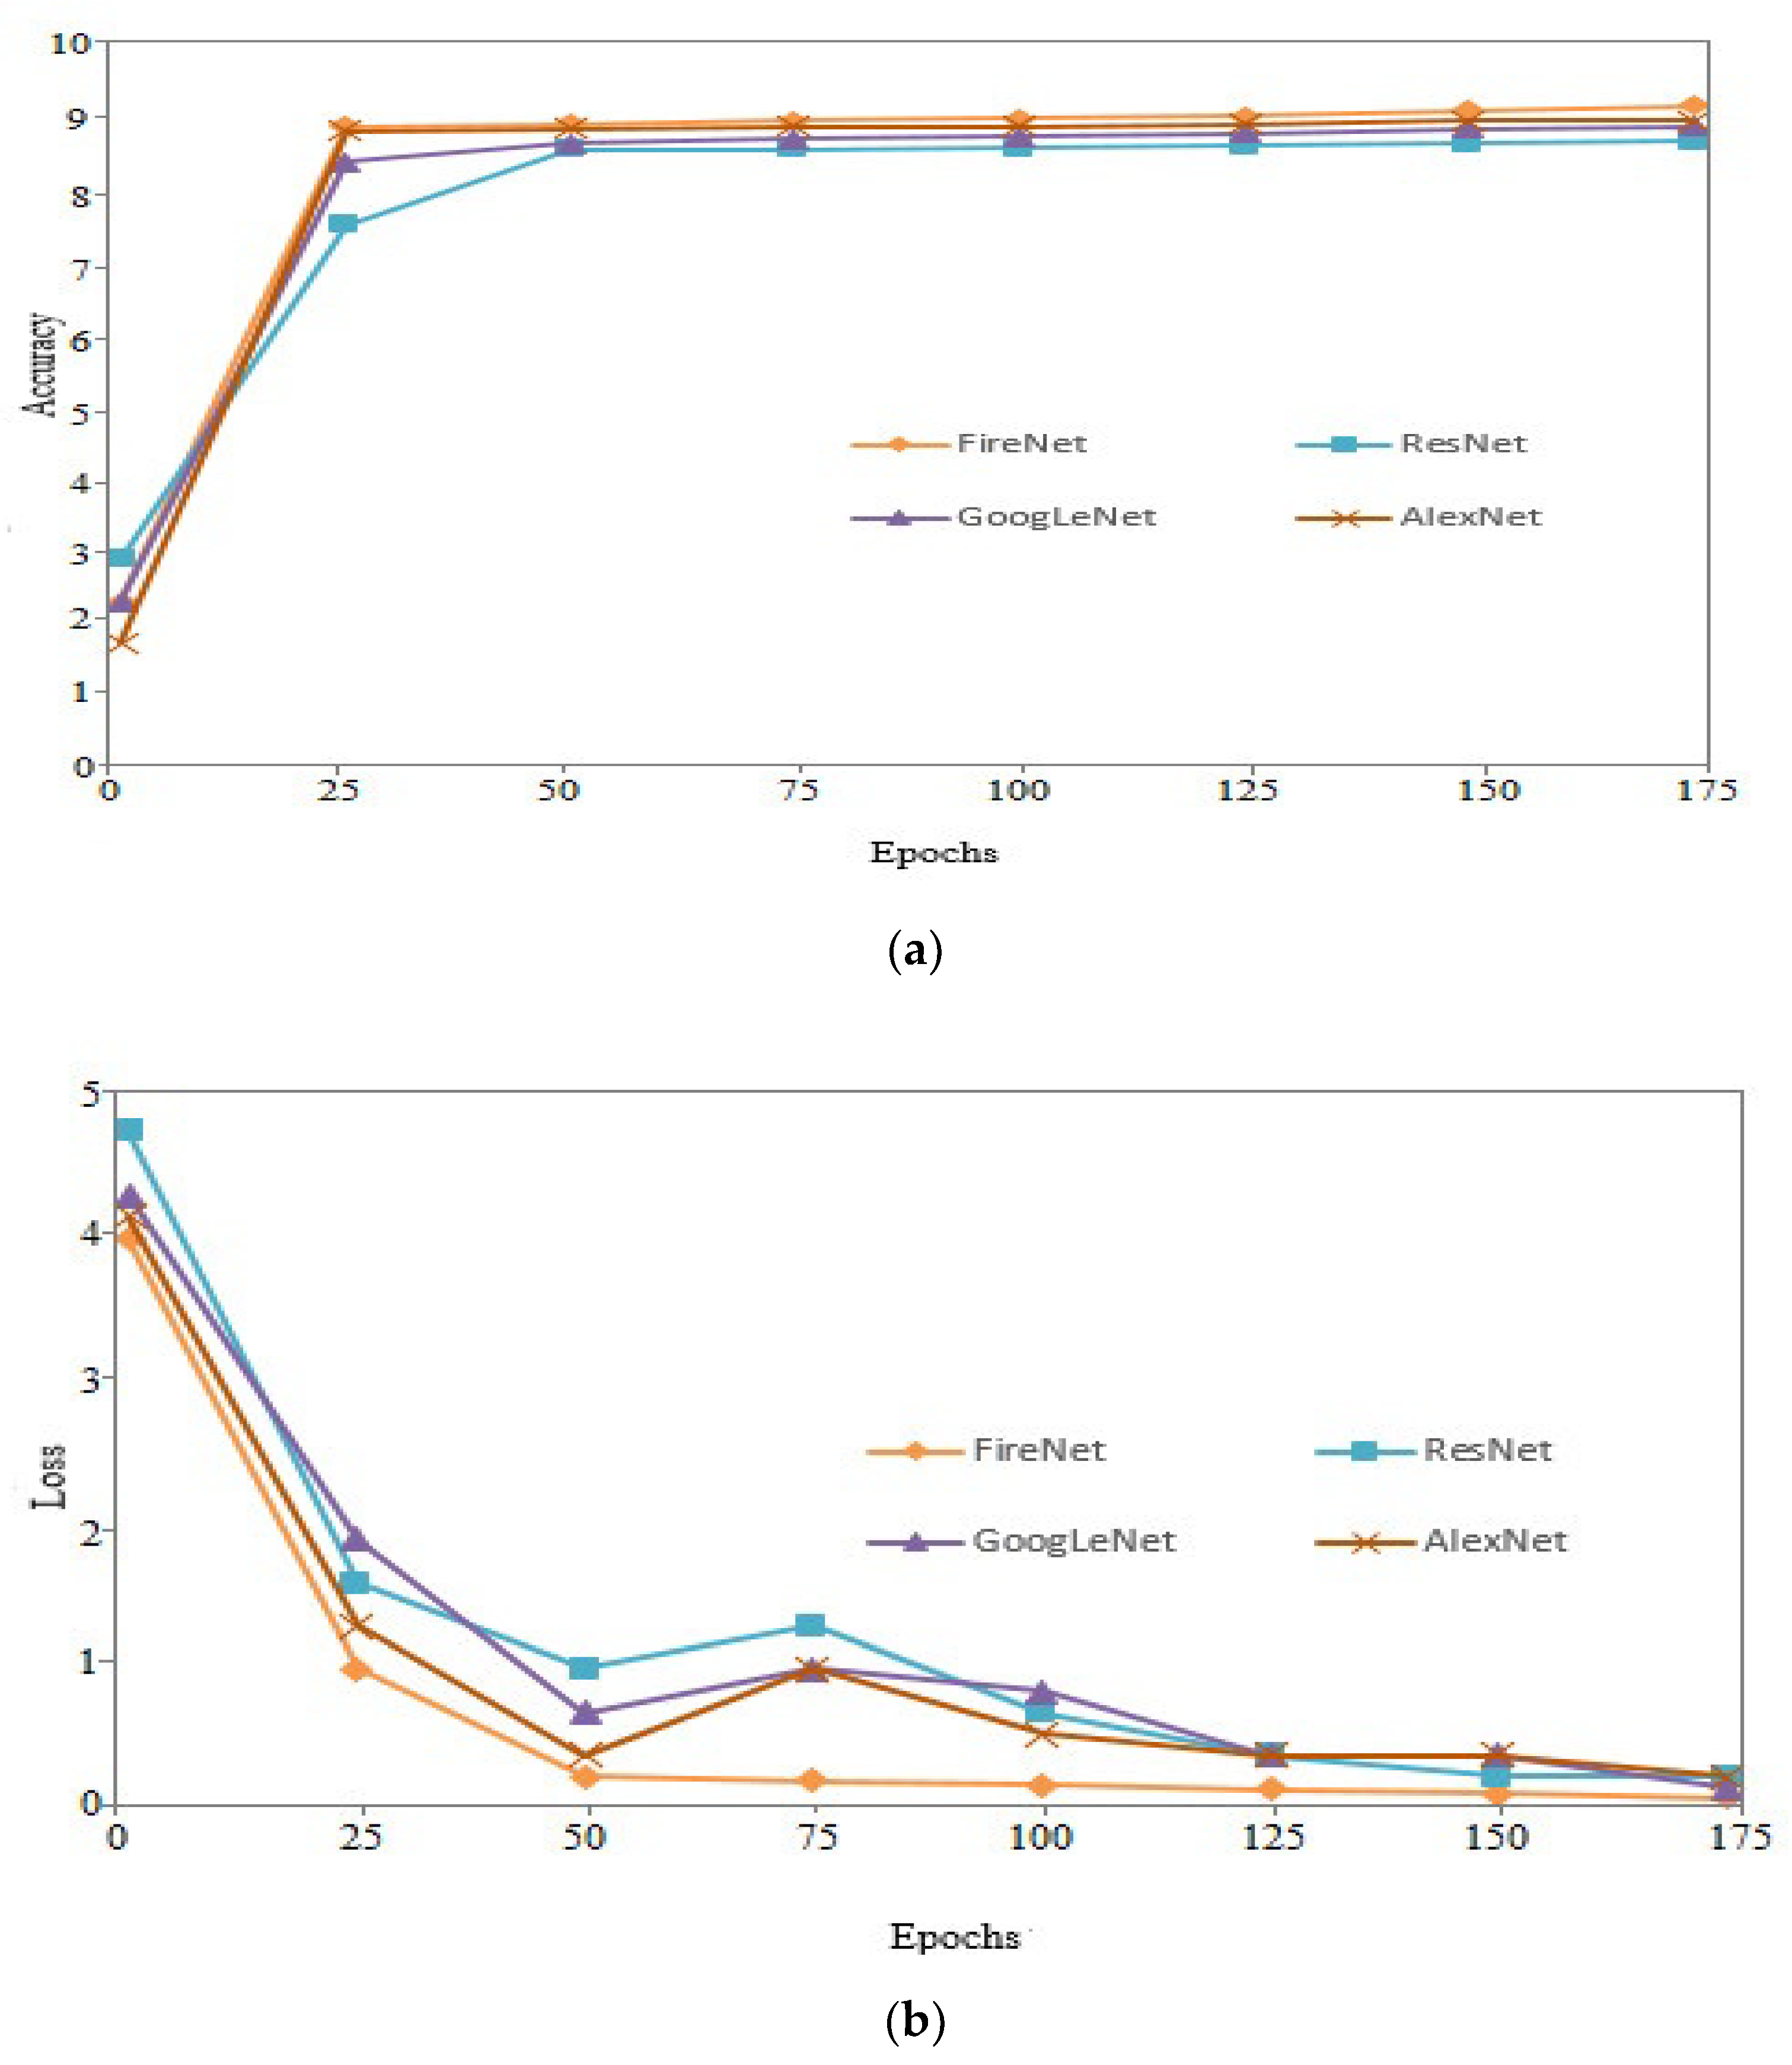
4.3.1. Performance of Proposed FireNet and SqueezeNet
4.3.2. Number of Parameters and Size Model
4.4. Discussion
5. Conclusions
Author Contributions
Funding
Acknowledgments
Conflicts of Interest
References
- Roth, H.; Lu, L.; Liu, J.; Yao, J.; Seff, A.; Cherry, K.; Kim, L.; Summers, R.M. Improving Computer-Aided Detection Using_newlineConvolutional Neural Networks and Random View Aggregation. IEEE Trans. Med. Imaging 2015, 35, 1170–1181. [Google Scholar] [CrossRef] [PubMed] [Green Version]
- Litjens, G.; Kooi, T.; Bejnordi, B.E.; Setio, A.A.A.; Ciompi, F.; Ghafoorian, M.; Van Der Laak, J.A.; Van Ginneken, B.; Sánchez, C.I. A Survey on Deep Learning in Medical Image Analysis. Med. Image Anal. 2017, 42, 60–88. [Google Scholar] [CrossRef] [PubMed] [Green Version]
- Greenspan, H.; Van Ginneken, B.; Summers, R.M. Guest Editorial Deep Learning in Medical Imaging: Overview and Future Promise of an Exciting New Technique. IEEE Trans. Med. Imaging 2016, 35, 1153–1159. [Google Scholar] [CrossRef]
- Tajbakhsh, N.; Shin, J.Y.; Gurudu, S.R.; Hurst, R.T.; Kendall, C.B.; Gotway, M.B.; Liang, J. Convolutional Neural Networks for Medical Image Analysis: Full Training or Fine Tuning? IEEE Trans. Med. Imaging 2016, 35, 1299–1312. [Google Scholar] [CrossRef] [Green Version]
- A Marrero, J.; Ahn, J.; Reddy, R.K. ACG clinical guideline: The diagnosis and management of focal liver lesions. Am. J. Gastroenterol. 2014, 109, 1328–1347. [Google Scholar] [CrossRef]
- Dietrich, C.F.; Sharma, M.; Gibson, R.N.; Schreiber-Dietrich, D.; Jenssen, C. Fortuitously discovered liver lesions. World J. Gastroenterol. 2013, 19, 3173–3188. [Google Scholar] [CrossRef]
- Bajenaru, N.; Balaban, V.; Săvulescu, F.; Campeanu, I.; Patrascu, T. Hepatic hemangioma-review. J. Med. Life 2015, 8, 4–11. [Google Scholar]
- Serrablo, A.; Tejedor, L.; Ramia, J.-M. Liver Metastases—Surgical Treatment. In Liver Tumors; Reeves, H., Manas, D.M., Lochan, R., Eds.; IntechOpen: Rijeka, Croatia, 2013. [Google Scholar]
- Bruix, J.; Sherman, M. Management of hepatocellular carcinoma: An update. Hepatology 2011, 53, 1020–1022. [Google Scholar] [CrossRef]
- Shi, J.; Zhou, S.; Liu, X.; Zhang, Q.; Lu, M.; Wang, T. Stacked deep polynomial network based representation learning for tumor classification with small ultrasound image dataset. Neurocomputing 2016, 194, 87–94. [Google Scholar] [CrossRef]
- Srivastava, N.; Hinton, G.; Krizhevsky, A.; Sutskever, I.; Salakhutdinov, R. Dropout: A Simple Way to Prevent Neural Networks from Overfitting. J. Mach. Learn. Res. 2014, 15, 1929–1958. [Google Scholar]
- Pereira, S.; Pinto, J.A.A.D.S.R.; Alves, V.; Silva, C. Brain Tumor Segmentation Using Convolutional Neural Networks in MRI Images. IEEE Trans. Med. Imaging 2016, 35, 1240–1251. [Google Scholar] [CrossRef] [PubMed]
- Miao, S.; Wang, Z.J.; Liao, R. A CNN Regression Approach for Real-Time 2D/3D Registration. IEEE Trans. Med. Imaging 2016, 35, 1352–1363. [Google Scholar] [CrossRef] [PubMed]
- Zhang, X.; Hu, W.; Chen, F.; Liu, J.; Yang, Y.; Wang, L.; Duan, H.; Si, J. Gastric precancerous diseases classification using CNN with a concise model. PLoS One 2017, 12. [Google Scholar] [CrossRef] [PubMed]
- Iandola, F.; Han, S.; Moskewicz, M.; Ashraf, K.; Dally, W.; Keutzer, K. SqueezeNet: AlexNet-level accuracy with 50x fewer parameters and <0.5 MB model size. arXiv 2016, arXiv:1602.07360. [Google Scholar]
- Bellver, M.; Maninis, K.-K.; Pont-Tuset, J.; Giró-i-Nieto, X.; Torres, J.; van Gool, L. Detection-aided liver lesion segmentation using deep learning. arXiv 2017, arXiv:1711.11069. [Google Scholar]
- Wang, W.; Iwamoto, Y.; Han, X.; Chen, Y.-W.; Chen, Q.; Liang, N.; Lin, L.; Hu, H.; Zhang, Q. Classification of Focal Liver Lesions Using Deep Learning with Fine-Tuning. In Proceedings of the 2018 International Conference on Digital Medicine and Image Processing, Okinawa, Japan, 12–14 November 2018; pp. 56–60. [Google Scholar] [CrossRef]
- Goodfellow, I.J.; Pouget-Abadie, J.; Mirza, M.; Xu, B.; Warde-Farley, D.; Ozair, S.; Courville, A.; Bengio, Y. Generative Adversarial Nets. In Proceedings of the 27th International Conference on Neural Information Processing Systems, Montreal, QC, Canada, 8–13 December 2014; Volume 2, pp. 2672–2680. [Google Scholar]
- Frid-Adar, M.; Diamant, I.; Klang, E.; Amitai, M.; Goldberger, J.; Greenspan, H. GAN-based synthetic medical image augmentation for increased CNN performance in liver lesion classification. Neurocomputing 2018, 321, 321–331. [Google Scholar] [CrossRef] [Green Version]
- Devi, S.M.; Sruthi, A.N.; Jothi, S.C. MRI Liver Tumor Classification Using Machine Learning Approach and Structure Analysis. Res. J. Pharm. Technol. 2018, 11, 434. [Google Scholar] [CrossRef]
- Gletsos, M.; Mougiakakou, S.G.; Matsopoulos, G.K.; Nikita, K.S.; Kelekis, D.; Nikita, A.S. A computer-aided diagnostic system to characterize CT focal liver lesions: Design and optimization of a neural network classifier. IEEE Trans. Inf. Technol. Biomed. 2003, 7, 153–162. [Google Scholar] [CrossRef]
- Yasaka, K.; Akai, H.; Abe, O.; Kiryu, S. Deep Learning with Convolutional Neural Network for Differentiation of Liver Masses at Dynamic Contrast-enhanced CT: A Preliminary Study. Radiology 2018, 286, 887–896. [Google Scholar] [CrossRef] [Green Version]
- Liang, N.; Lin, L.; Hu, H.; Zhang, Q.; Chen, Q.; Lwamoto, Y.; Han, X.; Chen, Y.-W. Residual Convolutional Neural Networks with Global and Local Pathways for Classification of Focal Liver Lesions. In Proceedings of the 15th Pacific Rim International Conference on Artificial Intelligence, Nanjing, China, 28–31 August 2018; pp. 617–628. [Google Scholar]
- Diamant, I.; Hoogi, A.; Beaulieu, C.F.; Safdari, M.; Klang, E.; Amitai, M.; Greenspan, H.; Rubin, D.L. Improved Patch-Based Automated Liver Lesion Classification by Separate Analysis of the Interior and Boundary Regions. IEEE J. Biomed. Health Inform. 2015, 20, 1585–1594. [Google Scholar] [CrossRef] [Green Version]
- Chen, P.; Song, Y.; Yuan, D.; Liu, Z. Feature fusion adversarial learning network for liver lesion classification. In Proceedings of the ACM Multimedia Asia, Beijing, China, 16–18 December 2019; pp. 1–7. [Google Scholar] [CrossRef]
- Hoogi, A.; Subramaniam, A.; Veerapaneni, R.; Rubin, D.L. Adaptive Estimation of Active Contour Parameters Using Convolutional Neural Networks and Texture Analysis. IEEE Trans. Med. Imaging 2016, 36, 781–791. [Google Scholar] [CrossRef] [PubMed] [Green Version]
- Romero, F.P.; Diler, A.; Bisson-Gregoire, G.; Turcotte, S.; Lapointe, R.; Vandenbroucke-Menu, F.; Tang, A.; Kadoury, S. End-To-End Discriminative Deep Network for Liver Lesion Classification. In Proceedings of the 2019 IEEE 16th International Symposium on Biomedical Imaging, Venice, Italy, 8–11 April 2019. [Google Scholar] [CrossRef]
- Alahmer, H.; Ahmed, A. Computer-aided Classification of Liver Lesions from CT Images Based on Multiple ROI. Procedia Comput. Sci. 2016, 90, 80–86. [Google Scholar] [CrossRef] [Green Version]
- Stoitsis, J.; Valavanis, I.; Mougiakakou, S.G.; Golemati, S.; Nikita, A.; Nikita, K.S. Computer aided diagnosis based on medical image processing and artificial intelligence methods. Nucl. Instrum. Methods Phys. Res. A 2006, 569, 591–595. [Google Scholar] [CrossRef]
- Wang, L.; Zhang, Z.; Liu, J.; Jiang, B.; Duan, X.; Xie, Q.; Hu, D.; Li, Z. Classification of Hepatic Tissues from CT Images Based on Texture Features and Multiclass Support Vector Machines. In Proceedings of the Advances in Neural Networks—ISNN 2009, Wuhan, China, 26–29 May 2009; pp. 374–381. [Google Scholar]
- Kumar, S.S.; Moni, R.; Rajeesh, J. An automatic computer-aided diagnosis system for liver tumours on computed tomography images. Comput. Electr. Eng. 2013, 39, 1516–1526. [Google Scholar] [CrossRef]
- Comak, E. A particle swarm optimizer with modified velocity update and adaptive diversity regulation. Expert Syst. 2019, 36, e12330. [Google Scholar] [CrossRef] [Green Version]
- Chen, S.; Xu, Z.; Tang, Y.; Liu, S. An Improved Particle Swarm Optimization Algorithm Based on Centroid and Exponential Inertia Weight. Math. Probl. Eng. 2014, 976486. [Google Scholar] [CrossRef]
- Kennedy, J.; Eberhart, R. Particle swarm optimization. In Proceedings of the ICNN’95—International Conference on Neural Networks, Perth, Australia, 27 November–1 December 1995; pp. 1942–1948. [Google Scholar] [CrossRef]
- Zhu, W.; Zeng, N.; Wang, N. Sensitivity, Specificity, Accuracy, Associated Confidence Interval and ROC Analysis with Practical SAS ® Implementations. Northeast SAS Users Group Health Care Life Sci. 2010, 19, 67. [Google Scholar]


| Method | Loss | Accuracy | Recall | Precision | F1-Score |
|---|---|---|---|---|---|
| SqueezeNet | 0.96 | 81.2 | 77.7 | 79.9 | 78.7 |
| FireNet | 0.079 | 81.8 | 78.7 | 81.6 | 80.1 |
| Method | Model Size (MB) | Fire Modules | Parameters |
|---|---|---|---|
| GoogLeNet | 50 | - | 7,521,212 |
| AlexNet | 225 | - | 40,885,256 |
| ResNet | 230 | - | 60,012,023 |
| FireNet | 3 | 8 | 790890 |
| Method | Loss | Accuracy | Recall | Precision | F1-Score |
|---|---|---|---|---|---|
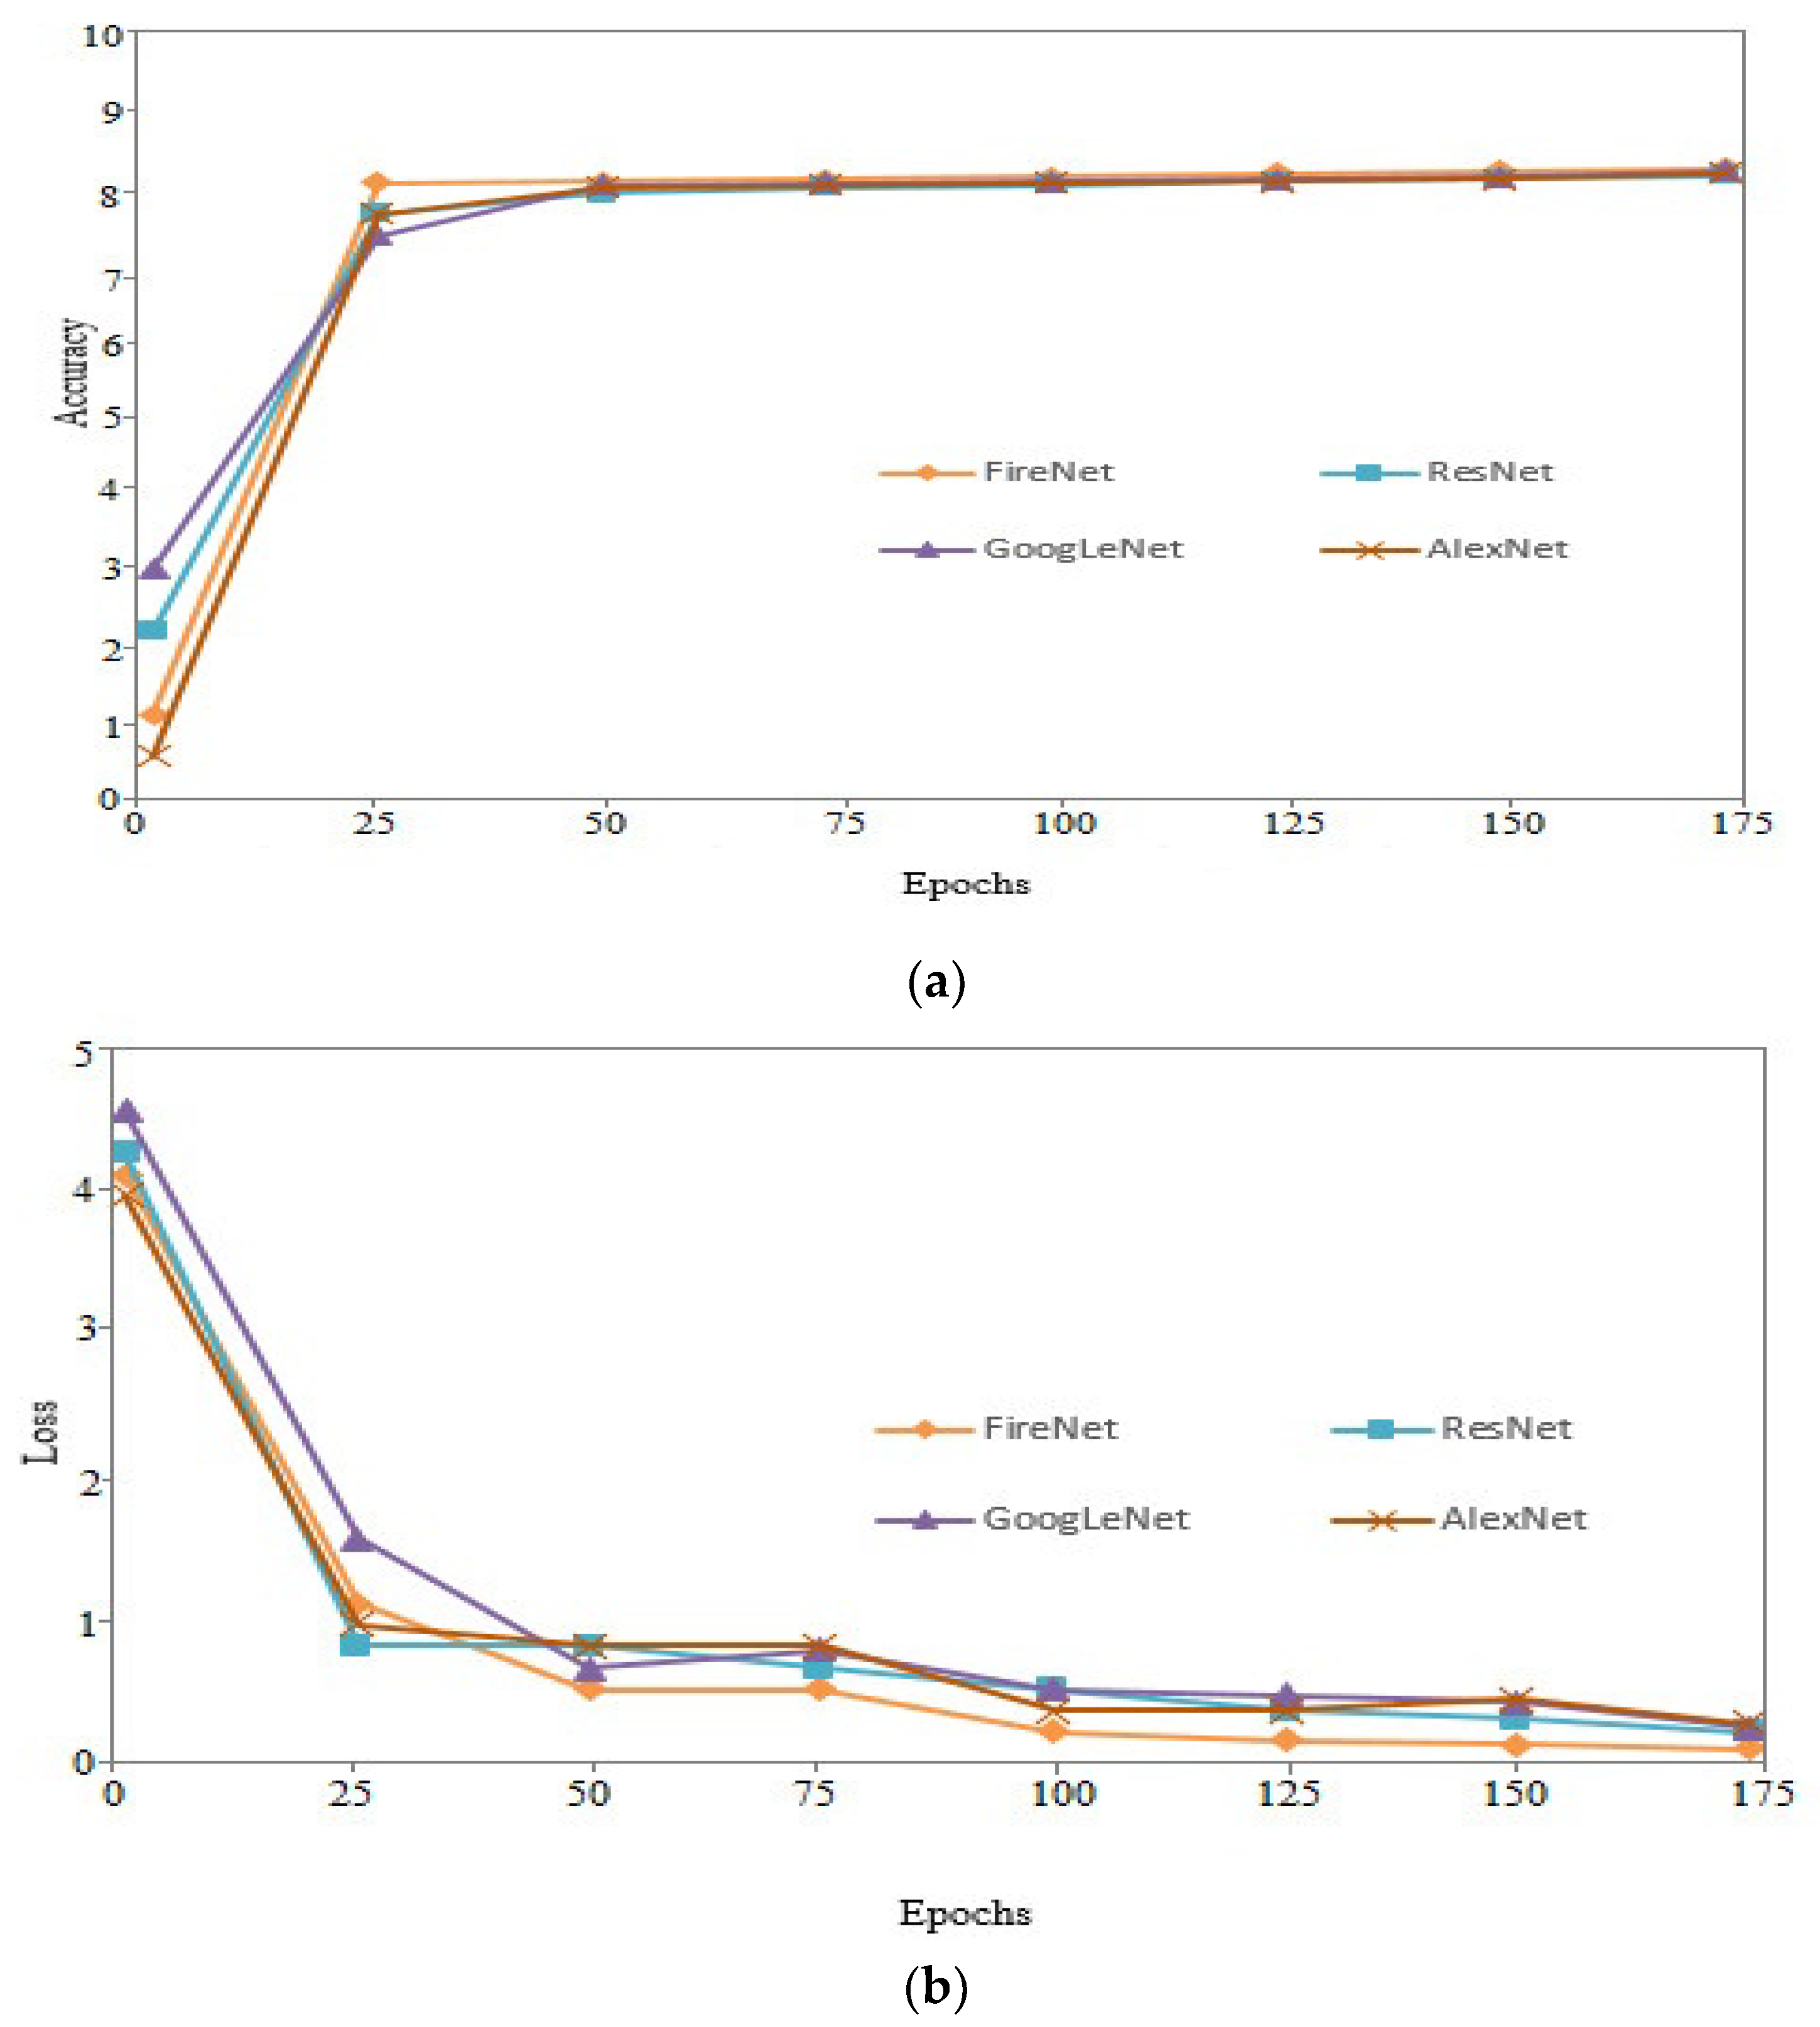
| GoogLeNet | 0.102 | 81.2 | 77.6 | 80.3 | 78.3 |
| AlexNet | 0.150 | 80.1 | 77.1 | 80.6 | 78.8 |
| ResNet | 0.097 | 78.6 | 77.7 | 77.9 | 77.7 |
| FireNet | 0.079 | 81.8 | 78.7 | 81.6 | 80.1 |
| Method | Loss | Accuracy | Recall | Precision | F1-Score | Time(s) |
|---|---|---|---|---|---|---|
| GoogLeNet | 0.083 | 87.1 | 84.9 | 83.3 | 84.0 | 3.4s |
| AlexNet | 0.097 | 88.8 | 85.1 | 87.3 | 86.3 | 4.6s |
| ResNet | 0.096 | 86.2 | 84.1 | 86.5 | 85.2 | 4.3s |
| FireNet | 0.049 | 89.2 | 86.2 | 87.3 | 86.7 | 2.2s |
© 2020 by the authors. Licensee MDPI, Basel, Switzerland. This article is an open access article distributed under the terms and conditions of the Creative Commons Attribution (CC BY) license (http://creativecommons.org/licenses/by/4.0/).
Share and Cite
Kashala Kabe, G.; Song, Y.; Liu, Z. Optimization of FireNet for Liver Lesion Classification. Electronics 2020, 9, 1237. https://doi.org/10.3390/electronics9081237
Kashala Kabe G, Song Y, Liu Z. Optimization of FireNet for Liver Lesion Classification. Electronics. 2020; 9(8):1237. https://doi.org/10.3390/electronics9081237
Chicago/Turabian StyleKashala Kabe, Gedeon, Yuqing Song, and Zhe Liu. 2020. "Optimization of FireNet for Liver Lesion Classification" Electronics 9, no. 8: 1237. https://doi.org/10.3390/electronics9081237