1. Introduction
According to recent sales data, the global stock of electric vehicles (EVs) (plug-in electric passenger cars and light utility vehicles) reached the nine million-unit milestone at the end of 2019, and this trend is growing in early 2020 [
1]. However, battery modules of EVs ensure a cruising range of about 300 km, and they require frequent stops for charging [
2,
3]. Urban parking area (PAs) equipped with charging stations (CSs) are becoming a relevant need [
4,
5]. On the other hand, charging of EV battery packs causes additional load on distribution network (DNs) to be taken into account [
6,
7,
8], and grid operators and planners are exploring different approaches to properly deploy battery electric vehicles (BEVs) and mitigate their impact on grids.
The use of optimized EVs charging strategies is a widely explored approach in technical literature. Scheduling of charging sessions allows to support a deeper penetration of EVs within DNs, [
2]. In this respect, several papers deal with optimized algorithms able to reduce the peak load due to EV charging sessions by using peak shaving and valley-filling strategies or to minimize different objective functions such as charging costs, power losses, etc. [
9,
10,
11].
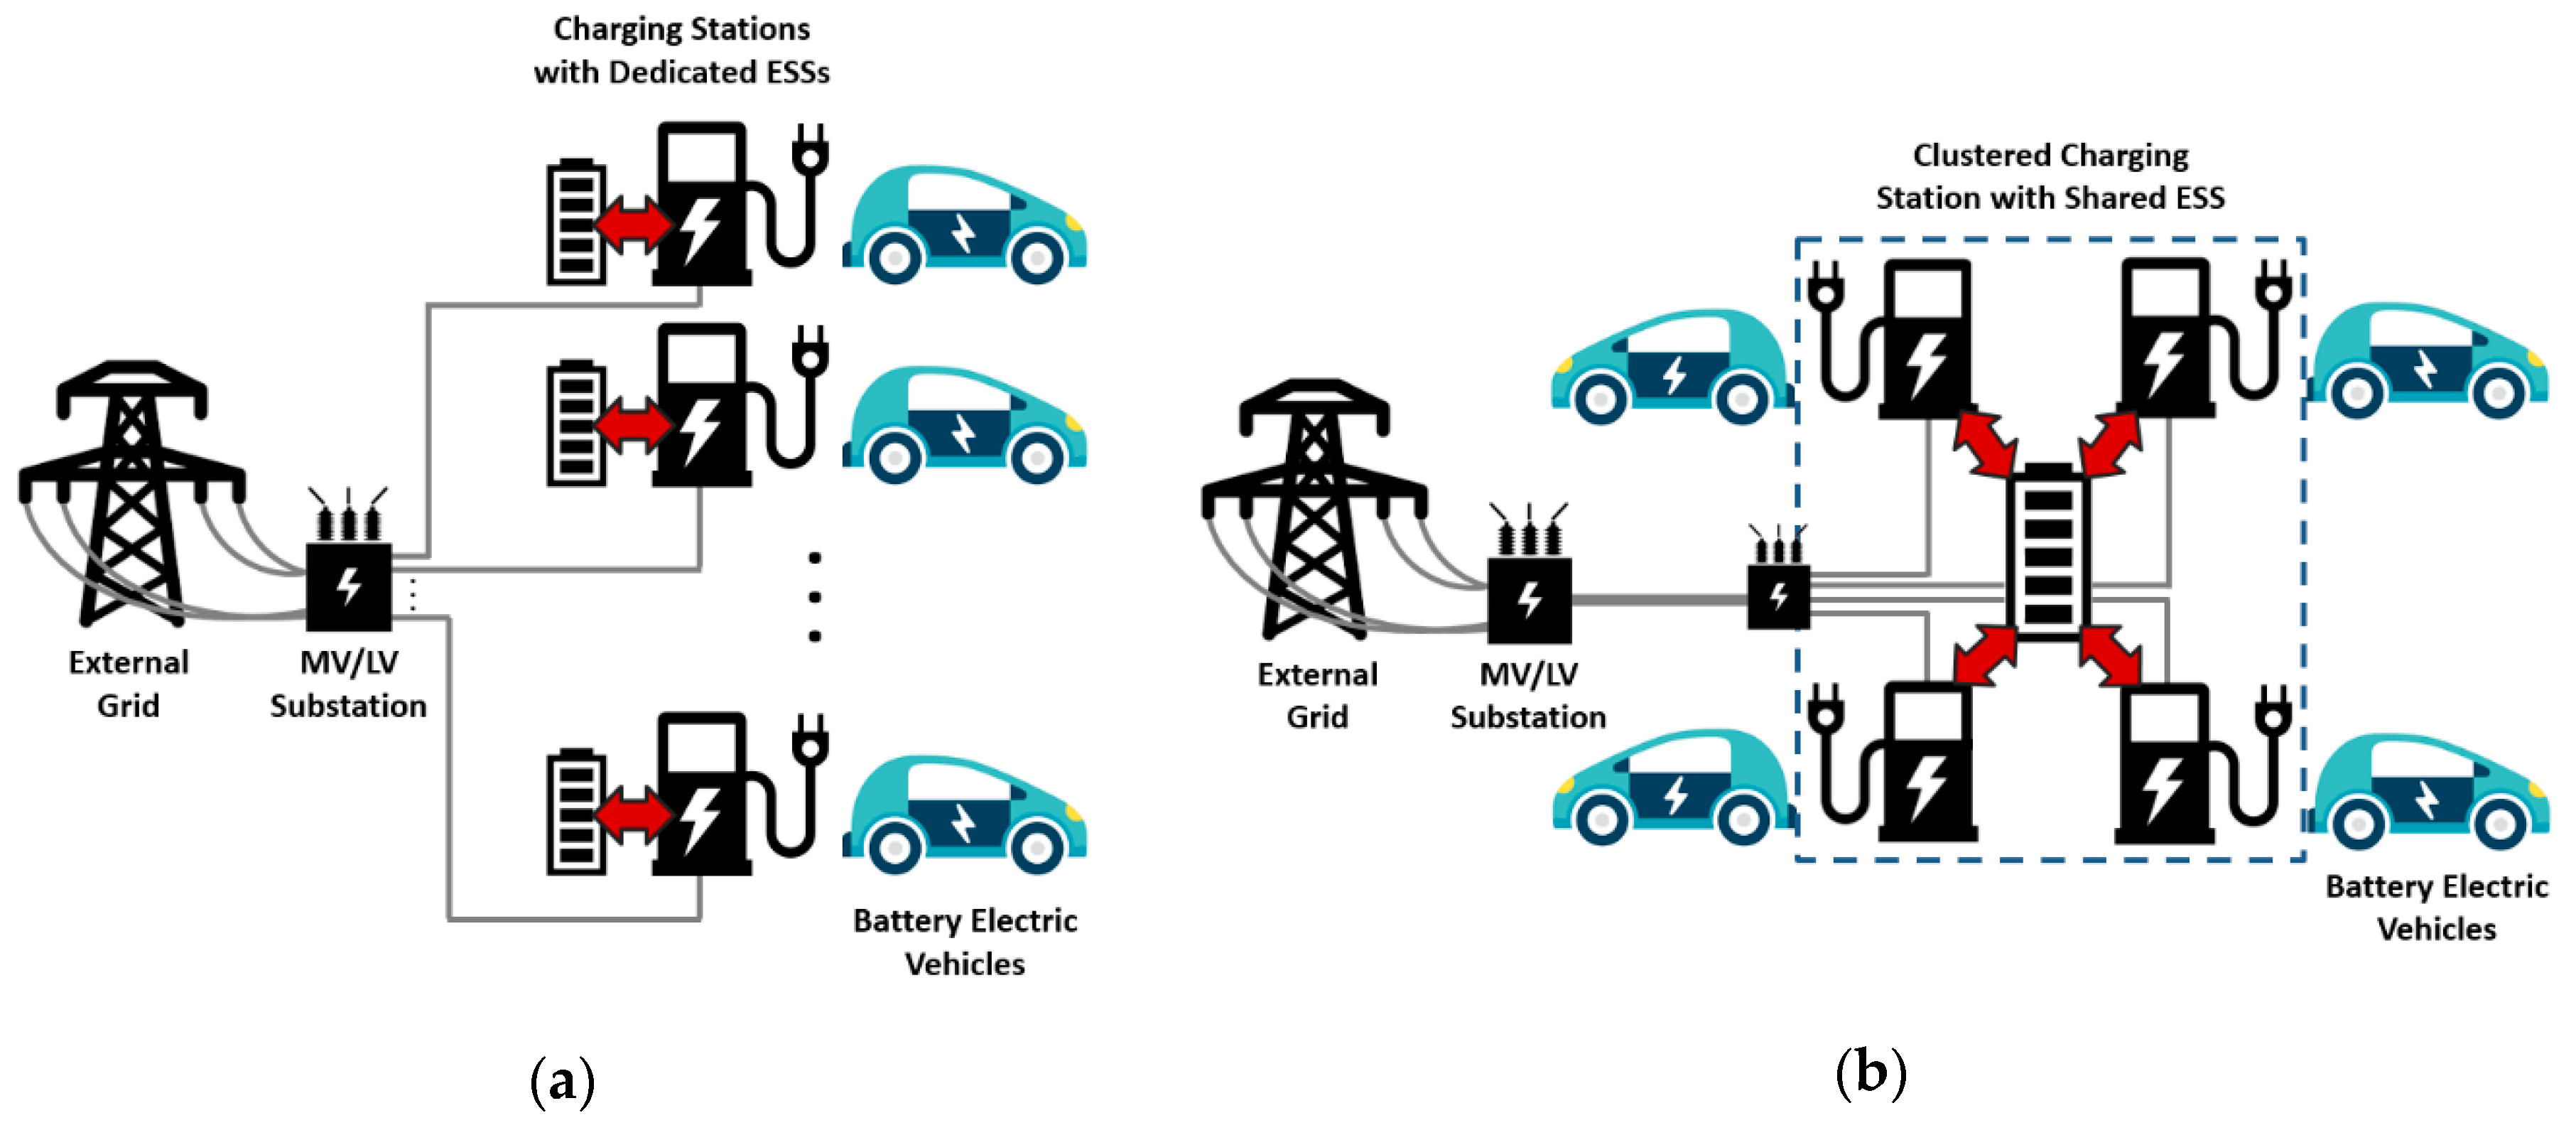
Another emerging and promising solution is the use of battery-based energy storage systems (ESSs) in peak shaving or load following mode, to reduce congestions on DNs due to EV charging sessions, [
12,
13]. The PA architecture consisting of single CSs, each one paired with a dedicated ESS is shown in
Figure 1a [
14,
15]. Managing single CSs coupled with ESS is a simple solution from the PA planning point of view; however, it requires several ESSs equal to the number of CSs installed in the PA. Compared to a single ESS connected to the grid, dedicated ESS solutions are equally able to reduce the peak power request, but they significantly reduce the line power loss and guarantee a high reliability level. If an ESS fails, only the related CS is affected.
Several papers consider CSs with dedicated ESS [
14,
15,
16,
17,
18,
19]. In [
16], Chaudhari et al. propose an energy management strategy for minimizing the operating cost of EV charging stations integrated with photovoltaic (PV) and ESS. In [
14], an efficient design of charging stations with MPPT, PID, and the current control strategy is developed for the optimal power management among solar panels, ESS, grid with the EVs in the charging station. Moreover, CSs with coupled ESS can also reduce the costs of installing high power DC charging stations because they can use the ESS to provide greater charging power [
17]. Negarestani et al. [
18] proposes an approach to determine the optimal size of the storage system for a fast charging station, whereas the control for a fast charging station with dedicated paralleled multiple flywheel energy storage systems is proposed in [
19].
An innovative solution to optimize the number of ESS in the PA is to associate multiple CSs to a single ESS as shown in
Figure 1b. In this way, it is possible to obtain a system composed of
n CSs with one shared ESS. In particular,
n-clustered CSs with shared ESS allows optimizing the sizing of the ESS by using an energy management algorithm that provides to each CS the difference between the required power and that available from the DN. Although the sizing of an ESS for
n-clustered CSs is greater than that required for a single CS with dedicated ESS, it is lower than the overall sizing for
n CS with dedicated ESS, and this allows reducing the investment costs for a PA. However, the energy management algorithm represents the key point of this CS architecture and it affects the overall performance in terms of ESS sizing reduction.
However, economic and ecological sustainability represent two main challenges that have to be considered to integrate ESSs into power systems [
20]. Although their use can be effective, ESSs for grid support applications are not economically attractive, at the moment [
21,
22,
23]. The use of II-Life battery modules, reusing EV battery packs for alternative uses, represents a promising trade-off. In particular, they still have significant residual capacity for grid ancillary services, although this degradation cannot be handled by an EV. The main benefits of the II-Life battery modules are the expected lower cost compared with new ones and the possibility to delay the development of the recycling chain for EV battery packs [
24].
In the literature, the use of II-Life battery-based ESSs for network support is analyzed in several recent papers. In [
24], Viswanathan et al. introduce a method for defining the optimal size of battery modules and estimating the
SoC profile during the operation. Additionally, in [
25], II-Life battery-based ESSs are mainly used for peak shaving services and upgrade deferral of low voltage (LV) distribution systems, while in [
26] and [
27], a general application of battery-based ESSs in DNs and a feasibility analysis are investigated, respectively. In [
28], the authors propose an effective control strategy for minimizing battery cell aging during operations. Finally, Strickland et al. [
29] and Saez-de-Ibarra et al. [
30] face the task of II-Life batteries sizing. A complex procedure problem is formulated taking into account uncertainty factors: in particular, calendar life, degradation factors, and applications.
With this in mind, here, we introduce the idea of clustered CS with shared ESS evaluating the techno-economic feasibility by using I-Life and II-Life technology. We also propose a method for sizing the ESS by using II-Life lithium battery modules and compute the number of EV battery packs required for the ESS implementation. The sizing method takes into account the aging of the battery modules and the uncertainty related to the capacity degradation in I-Life. The proposed is a four steps sizing methodology: (i) modeling of CSs with shared ESS and definition of a heuristic ESS energy management strategy; (ii) sizing of the ESS in terms of rated power, capacity, and charging and discharging (CDC) according to the CS needs by using a statistical distribution of PAs; (iii) calculation of the residual cycles and maximum available power of the II-Life battery pack at the end of life (EoL) by linearizing the relationships residual capacity/CDC and internal resistance/CDC. Compared to the existing aging models, this simple one model does not require data that often are not provided by the datasheet of battery manufacturers; (iv) Monte Carlo (MC) analysis to compute the equivalent sizing in II-Life of the ESS (i.e., the number of II-Life battery modules according to the power and energy requirements).
The remainder of the paper is organized as follows:
Section 2 and
Section 3 describe the II-Life battery model, including the proposed linear approximation, and the modeling and energy management of CSs with ESS.
Section 4 presents the procedure for the equivalent sizing of II-Life ESS. Several simulations results based on a real case study are illustrated and discussed in
Section 5, whereas,
Section 6 reports concluding remarks.
2. Modeling of II-Life Battery Modules
In this Section, we describe the electric model of II-Life battery modules and the proposed method to estimate both the relationship between battery capacity and number of CDC, and the relationship between the battery maximum power and number of CDC, starting from the datasheet.
2.1. II-Life Electrical Battery Model
We assume the equivalent electric model of II-Life battery modules shown in
Figure 2: it consists in the series of an ideal voltage generator and a resistor [
31]. In particular, the ideal voltage source models the open circuit voltage (
OCV) of the battery module, depending on its state of charge (
SoC) value, while the series resistor
Rint models the overall internal resistance. The battery capacity is described by a capacitor
CBATT that is charged or discharged according to the battery current value, and the voltage across it represents the
OCV. We assumed that the conditioning system of the EV battery packs keeps the battery module within a temperature interval, such that variations of electrical parameters due to temperature can be considered negligible [
32].
The electric model of a lithium-ion battery cell is described by Equation (1). In detail, Equation (1) consists of Kirchhoff’s voltage law, the
n-polynomial function linking
OCV and
SoC, and the
SoC update law. In particular, we use the coulomb counting approach for
SoC estimation taking into account the required current from the battery modules:
In Equation (1), VBATT and IBATT are the battery modules voltage and current, respectively, whereas CBATT is the battery capacity in Ah, and β0 … βn are interpolation coefficients derived by the OCV vs. SoC curve reported in battery manufacturer datasheets. The columbic efficiency ηC and the Peukert coefficient p are also provided by battery manufacturers or derived from technical literature. Finally, k·∆t is the generic time interval, where k is the discrete time index, and ∆t is the time step.
Moreover, we considered the effect of battery aging and degradation on the electrical parameters of the model. There are two main aging mechanisms for lithium batteries:
calendar aging, which is the time aging with the battery at rest, and
cyclic aging, which depends on
CDCs. Both mechanisms lead to a decrease in battery capacity, [
33,
34,
35]. We modeled the calendar aging as a capacity reduction at a constant rate during the battery life. Cyclic aging instead produces a decrease in battery capacity as
CDC increases and it is described by the function
f as follows:
The method to estimate the function
f starting from the EV battery datasheet, is presented in
Section 2.2. Similarly, the
g function describes the increase of
Rint by increasing
CDC as follows:
The function
g is derived in
Section 2.3. It is worth noting that this is anyway a battery electrical model aimed at planning analysis and economic evaluations. For this purpose, the applied model represents a trade-off between accuracy and complexity of the model.
2.2. Residual Capacity vs. CDC Approximation
Very often, battery manufacturers do not provide enough information about residual capacity CBATT aging and the maximum number of CDC performed at different depth of discharge (DoD); in a few cases, they give only some curves at certain DoD. The proposed methodology to approximate this relationship at different DoD is described in the following.
Figure 3a shows the typical trend (in logarithmic scale) of the maximum number of
CDC (battery aging) increasing the
DoD value of a battery module [
36]. In general, this relationship is given by a test curve, a table, or a mathematical function based on measured data, which allows us to estimate the number of
CDC before the battery module reaches its maximum acceptable capacity reduction. This value identifies the battery EoL and it strongly depends on the battery use case (traction, energy, etc.).
In
Figure 3b, we show the general trend of the curve linking the residual capacity
CBATT and the maximum number of
CDC for a fixed value of
DoD, and very often it is not provided in the battery datasheet [
36]. This relationship for lithium batteries is typically described by a nonlinear function. The battery residual capacity shows a rapid decrease at the beginning of the profile; the trend is almost linear in the middle part and it decreases very quickly at the end of the curve. The battery EoL for energy applications EoL
en (typical value 60–70% of
CBATT rated value [
26]) is identified by the knee of the curve on the right of
Figure 3b. The EoL for traction applications instead, is characterized by residual capacity values in the range of 80–85% of
CBATT rated value, [
25,
26]. For the proposed method, it is not relevant identifying battery discharge profiles (such as
DoD,
CDC, etc.) before the point EoL
trac-
CDCtrac (i.e., the number of residual
CDC at the EoL
trac). The following procedure is used to approximate the residual capacity vs.
CDC typical trend by a line for different
DoD values, as shown in
Figure 4a.
Select a
DoD value (
DoD1) from
Figure 3a to obtain a maximum number of
CDC (
CDC1), i.e., the number of cycles at the EoL
en;
Draw the point
B1 in the plane
CBATT/
CDC (
Figure 3b);
Repeat step 1 and step 2 for each value of DoD in order to obtain a set of n − 1 maximum values (CDC2, CDC3, …, CDCn);
Draw the points (
B2,
B3, …,
Bn) in the plane
CBATT/
CDC for each maximum value of
CDC, as shown in
Figure 4a;
In the plane CBATT/CDC, identify the point A characterized by 0 cycle and CBATT rated capacity;
Draw a line from point A to each point
Bi,
i = (1, 2, …,
n); each line is associated to a specific
DoD value (
Figure 4a);
Calculate the coefficients of each straight line.
The set of points (B1, B2, …, Bn) defines a different number of cycles at the energy EoL of the battery according to the DoD value.
In particular, the approximation error obtained by using the proposed linear methodology is represented by the yellow area in
Figure 3b. Although the error is relevant in the I-Life of the battery, for our purposes, it is not important. In fact, we are interested in the II-Life of the battery where the error is small. According to real data (
Figure 5) provided by batteries manufacturers [
37], the proposed linear approximation accurately describes the relationship
CBATT vs.
CDC in the battery II-Life. Since the paper is aimed to provide a techno-economic comparison between two ESS-based architectures implemented in I-Life and II-Life technology, the approximation error is acceptable for evaluating the profitability of two different investments.
2.3. Aging of Internal Resistance Approximation
The degradation with use and aging of Li-ion batteries in terms of internal resistance consists of an increase of its rated value [
36]. The increase in
Rint leads to a reduction of the battery maximum power with aging. For these reasons, it is necessary to estimate the
Rint increase in order to design the maximum power of the II-Life ESS at the EoL. Unfortunately, datasheets of battery manufacturers rarely provide such kind of information.
In our analysis, we assume that the increase of
Rint with aging is a synchronous process with the reduction of
CBATT residual value. In
Figure 4b, is depicted the typical trend of the curve linking internal resistance by reducing the battery residual capacity (i.e., increasing the aging), [
36]. In detail, the
X,
Y, and
Z points are defined by the pair
Rint,
CBATT at the beginning of life (this pair is reported in battery datasheet), at the EoL
trac, and the EoL
en, respectively. The
Y and
Z points are not easy to estimate. In fact, battery manufacturers do not provide enough data.
In order to estimate the point
Z, it is necessary to multiply the rated value of
Rint (
X point) for the ratio between rated and residual capacity of battery modules at the EoL. Finally, given the
X and
Z points, we can approximate the trend of
Rint with the aging. The approximation error obtained by using the proposed method is represented by the yellow area in
Figure 4b.
3. Modeling and Management of CSs with Shared ESS
In this section, we describe the electrical model of the CSs taking into account the AC/DC converter, capacity, and energy management strategy of shared ESS.
3.1. Electrical Model of the CS
Several types of CSs are usually installed in public PAs, each of them characterized by different values of charging power.
We assume a constant power
P model of the CS during the EV charging time [
12]. In particular, the
P value is obtained by imposing the following replacement:
where
Pch and
Pdisch are the charging and discharging battery powers, respectively, while
ƞch and
ƞdisch are their related efficiencies.
Thus, for each ESS coupled with one or more CS, the SoC value at the
k-th time interval of the battery-based ESS, is described by:
where ∆
t is the time step,
ηDCDC is the efficiency of the DC-DC converter of the CS, and
P represents the power supplied to the CS or absorbed from the grid.
3.2. Power and Energy Management of the ESS
To size the ESS for single or clustered CSs, it is necessary to define an energy management algorithm for the shared ESS energy supplying the n-CS charging stations within a cluster.
The sizing results of the shared ESS significantly depend on the energy management algorithm. Here, we consider a simple no optimal algorithm: the total power that the external network can supply to the PA grid in a given time interval, k·∆t, is equally split between the NCl clustered CSs within the PA and the power flow of the ESS is managed according to its SoC and rated power Prated.
In particular, for each time interval, k·∆t, it is necessary to calculate the maximum available power Pav(k) that the PA grid can equally provide to each of the nCS clustered CS. This value depends on the maximum power Pmax that the external network can supply to the PA grid and the base load Pbase(k) of the PA grid. Pav(k) can be equal or greater than zero; otherwise, only the shared ESS supplies CSs within the cluster for that time interval. It is also necessary to calculate the power (k) required by the i-th clustered CS in the time interval k·∆t, (i.e., the sum of the charging power values required by each single CS in the cluster).
Given the Pav(k) and (k) values, the algorithm calculates their difference. If it is positive, then the external network can supply the clustered charging station and, therefore, the shared ESS according to its SoC can be charged and its power PESS(k) is positive. In particular, if the SoC is less than 60%, the shared ESS is charged with the rated power value, otherwise it is charged at a lower power value (i.e., 0.25% of the ESS rated power).
If, on the other hand, the difference between Pav(k) and (k) for the i-th cluster is negative, the external network cannot fully supply the clustered charging station (or partially supply if Pav(k) = 0) and therefore, according to its own SoC and rated power, the shared ESS contributes to feeding the clustered CS, and PESS(k) is negative.
The proposed algorithm works for clustered CSs but can be adapted to manage stored energy of dedicated ESS to make comparisons between the two architectures. In particular, it is necessary to consider the number of CS in a cluster, n-CS, is equal to 1 and NCl equal to the total number of single CS in the PA.
In the following, the pseudocode of the energy management algorithm for the shared ESS is described in detail (Algorithm 1).
| Algorithm 1 Energy Management |
| 1: | loop (for each time interval): |
| 2: | # computing of available power for each cluster |
| 3: | |
| 4: | # Available power for each cluster cannot be lower than zero |
| 5: | if ( < 0) |
| 6: | |
| 7: | End |
| 8: | # computing of required power for each cluster |
| 9: | |
| 10: | loop (for each CS cluster): |
| 11: | if ( <= ) |
| 12: | # if SoC(k) > 20% and |
| 13: | |
| 14: | # if SoC(k) > 20% and |
| 15: | |
| 16: | # otherwise |
| 17: | |
| 18: | end |
| 19: | if ( > ) |
| 20: | # if 60% < SoC(k) < 100% |
| 21: | |
| 22: | # if SoC(k) < 60% and |
| 23: | |
| 24: | # otherwise |
| 25: | |
| 26: | End |
| 27: | End |
| 28: | End |
4. Sizing of II-Life ESSs and Cost Analysis
In this section, we describe the sizing procedure of the shared ESS for single or clustered CSs assuming that the number of CSs is known. The stochastic procedure for sizing an equivalent ESS using second life modules will be shown below, then, we present the economic model to evaluate the annual cost of energy (ACOE) of the I-Life and II-Life ESSs. It is worth noting that the proposed procedure can be also applied to other applications involving ESSs.
4.1. Sizing of ESSs for Single or Clustered CSs
To size the shared ESS for single or clustered CSs according to the power and energy requirements, we implement a Monte Carlo (MC)-based procedure [
4].
Given the statistical distributions characterizing a PA (i.e., EVs arrival times, EV parking times, and EV residual SoC) and implementing both CSs with shared and dedicated ESS model and the related energy management procedure, we compute the required power PESSreq and energy EESSreq of the ESSs connected to the CSs, through MC simulation of the PA keeping the maximum power supplied from the external grid PGmax to the PA grid lower than a given value (e.g., it can be a technical or contractual power limit). The ESS sizing procedure implements an iterative algorithm in order to verify the compliance with the power and energy requirements at the current iteration. If more power or energy is required to the ESS in the MC simulation, the sizing procedure increases the ESS sizing and the procedure is repeated until the rated power and energy of the ESS are lower than the required ones (PESSreq and EESSreq, respectively).
It is worth noting that the proposed sizing procedure considers the worst-case among all the CSs within the PA and then the largest ESS size among all the MC iterations is the final sizing value.
Figure 6a shows the block diagram of the iterative procedure.
4.2. Sizing Method of II-Life ESSs
The first step of the proposed method to size the II-life ESSs (i.e., define the number of series and parallel II-Life battery modules), is the definition of the ESS use-case. We assume that it is possible to define rated power and energy, average DoD value, and given number of CDC.
The proposed procedure uses a conventional methodology for the preliminary sizing: in such a way, it is possible to compute the series number
N of battery modules and the parallel battery branches
M [
26]. More in detail,
N is equal to the ratio of the ESS rated voltage and the rated voltage of a single battery module.
M value, instead, is equal to maximum value between the ratio of the ESS required energy and the rated energy of a single battery module and the ratio of the ESS required power and the rated power of a single battery module. Given a minimum increase step for the ESS sizing (i.e., the rated power and energy of a given EV battery pack), if two battery packs are added in series, the rated voltage of the ESS is doubled, whereas if two battery packs are added in parallel, it doubles the energy and the power that the ESS can store. Every time a battery pack is added in parallel, it is necessary to add the same number of a series battery pack to guarantee the rated voltage.
We assume a reduced capacity of battery modules to consider their II-Life: the rated value of battery capacity is equal to the EoLtrac value multiplied CBATT. In fact, we need a greater number of II-Life battery modules compared to that obtained by using I-Life battery modules to satisfy the ESS energy requirement.
Afterward, we take into account the uncertainty related to inaccurate estimations of residual capacity and maximum power at EoL for traction and energy applications. If uncertainty is not considered, the number M × N represents the II-Life battery modules needed for the ESS use case. To take into account the uncertainty, we assume the points B1, C, and Z as random variables with given probability distributions (e.g., uniform, Gaussian, etc.).
We use a MC approach based on the equivalent electrical circuit of the battery modules and proposed linear approximation to calculate: (i) distribution of residual cycles of the II-Life ESS at the EoL for the application; (ii) distribution of maximum power of II-Life ESS at the EoL for the use case.
We consider for our studies two Gaussian distributions (μ1 = CDCtrac, σ1 = 1, μ2 = CDCen and σ2 = 1), to tackle the uncertainty due to an inaccurate estimation of points B1 and C. Similarly, a Gaussian distribution (μZ = 1.66 × Rint, σZ = 1) is assumed at the point Z.
In such a way, the residual capacity of the II-Life ESS and its maximum power at the EoL
en can be designed. We consider
m II-Life battery branches in addition to
M, representing the additional capacity necessary to the II-Life ESS for satisfying the
CDC requirement and the additional power necessary for ensuring the maximum power requirement, respectively. We calculate the
m value by implementing an iterative procedure based on the MC approach. Starting from
m = 0, our procedure ends when it finds the smaller value of
m that ensures:
and
where α
90% is the 90% percentile of the resulting distribution.
The number
M +
m of battery branches ensures the given
CDC* and
P* requirements at EoL. Then, the total number of II-Life battery modules required to obtain an equivalent I-Life ESS and to perform economic evaluations is given by:
The overall procedure is summarized in the block diagram reported in
Figure 7b.
4.3. Economic Metric
The net present value (
NPV) is used as an economic metric to assess costs and revenues while accounting for the time value of money [
38,
39]. If the
NPV of an investment is positive, then it will be profitable. A negative
NPV, instead, highlights that the investment does not show economic benefits. The
ACOE in [
$/year] represents the present value of the investment total cost
Ctot multiplied by the
CRF. The
NPV can be converted into a stream of equal annual payments over a given lifetime
Y [year], at a given interest rate
r, through the
CRF defined as follows:
and the
Ctot is given by:
where
CI is the total capital cost,
CM&O is the
NPV of the maintenance and operation (
M&
O) costs, and
CREP is the
NPV of the replacement costs.
More in detail,
CI is the one-time investment cost, which brings the ESS into an operable status. It depends on the rated power
PR [kW] and the rated energy
ER [kWh] of the ESS. The capital cost can be formulated as:
where
CP [
$/kW] and
CE [
$/kWh] are the specific costs mainly related to the electronic interface to the network and the size of the ESS, respectively.
CFC [
$] is the fixed cost for civil works (building cost, landing cost, construction cost, etc.).
Moreover, the
CM&O cost comprises different contributions, such as: (1) labor associated with plant operation, (2) plant maintenance, (3) equipment wear leading to its loss-of-life, and (4) disposal and decommissioning cost. The
CM&O cost is defined as follows:
Cy [
$] is the annual operation cost on
y years and it is defined as a function of a fixed cost (
Cf) related to the ESS rated power, a variable cost (
Cv) depending on its annual discharged energy
Eyear [kWh], and the ESS charging cost (
Cr):
where
ηCH is the battery charging efficiency and
CCH [
$/kWh] is the electricity cost for charging the ESS from the grid. Furthermore, battery modules have to be replaced one or more times during the ESS lifetime. The
NPV of replacement cost is:
where
CRP [
$] and
L are the future cost and lifetime of battery modules, respectively. The
L value can be estimated by using the proposed linear approximation based on data provided by manufacturers [
37].
5. Simulation Framework
We apply our methodology for sizing II-Life ESSs coupled to CSs, to a real distribution system. We consider single or clustered CSs for reducing the peak power absorption for the microgrid supplying the University of Salerno (UniSA) campus.
5.1. Case Study
The microgrid of the UniSA campus is a 20 kV distribution system composed by 12 bus: two feeders are configured in a closed loop (
Figure 8a). Two combined heat and power (CHP) units, with a rated power of 580 kW each one, are installed at bus 11, whereas eight PV power plants are installed on the roof of the campus buildings (bus 2, 3, 4, 5, 6, 8, 9, and 12), for a total rated power of 1076 kW. The CHP units generate both electricity and thermal energy to supply the loads and to heat the water of the campus sports facilities, respectively.
Typical daily trends of the net active power absorbed from the main external PCC by the UniSA microgrid (bus 1) are shown in
Figure 8b. Green and blue lines show the active power absorption with and without internal PVs and CHPs, respectively. Furthermore, pink and yellow lines depict the average (calculated every 15 min) active power produced by the CHP and PV units.
Furthermore, the additional power demand due to the connection of EVs to CSs into the campus is computed in [
4]; it is based on the CO.S.MO. (Cooperative Systems for Sustainable Mobility) and Energy Efficiency European research project.
For simplicity and without losing generality in our analysis, we merged the three different PAs of the UniSa campus into one single PA. The PDF parameters of the merged PA, validated by using the -square test with a 5% risk parameter [
40], are reported in
Table 1,
Table 2 and
Table 3.
In our analysis, we assume that the users’ behavior and their mobility needs do not change moving from internal combustion engine (ICE)-based vehicles to battery EVs. To assess the residual SoC values of different EV trips, we evaluated the students’ origin-destination paths to reach the UniSA campus in terms of three route types, namely, “urban”, “extra-urban”, and “highway”. Moreover, we consider the Nissan Leaf 2019 as the reference EV model [
41]. More specifically, the Nissan Leaf is characterized by a battery pack capacity of 24 kWh, while the car manufacturer provides the average consumption rate (kWh/km) according to the specific route type [
41]. Furthermore, studies published by the U.S. Department of Energy and Idaho National Laboratory, show that BEV users prefer to charge in the evening and drive during the day [
42,
43]. Thus by assuming, the students’ BEVs leave fully charged from each departure point (e.g., students’ homes), we derived the statistical distribution of residual SoC for BEVs reaching UniSA. The procedure is well described in [
4,
40].
Figure 7a show the active power trend of EV charging demand.
In the following, we apply the proposed sizing procedure for the II-Life ESS to 2 different case studies, and we compare them from the economic point of view:
- case1:
the PA consists of 50 CSs each one with a dedicated II-Life ESS;
- case2:
the PA consists of 10 clustered CSs consisting of 5 conventional CSs and a shared II-Life ESS.
In the following, we assume 50 kW CSs (400 Vac, 125 A peak value) for case1 and case2. The effective charging power of each CSs is defined according to the deadline of the in-charging EV connected to it. The energy management strategy of the ESSs is described in
Section 3.2. Software simulations are run on workstations with Intel® Core™ i7 (3.70 GHz, 64 bit) processors, 16 GB of RAM, and Matlab™ R2018a. The computational effort is not particularly high considering that planning analysis for economic evaluations is usually implemented off-line and there are no strict constraints on computation time because they are not real-time algorithms.
5.2. Sizing Results
Input data for the ESS sizing procedure (
Section 4.1) for single and clustered CSs are the number of CS in the PA and its PDF parameters. By applying Monte Carlo simulations with 500 iterations, we obtain the ESS power and energy rated values for clustered e single CS aimed to keep the maximum power
PGmax supplied from the external grid to the UniSA microgrid lower than 2.75 MW. The obtained ESS sizing values allow defining the average
DoD value for dedicated and shared ESS and applying the proposed methodology to II-Life battery modules.
By assuming 360 V as ESS rated voltage because it is a standard value for automotive battery packs, sizing values and average
DoD at the EoL
en for dedicated and shared ESS are reported in
Table 4.
Following, we applied the equivalent sizing procedure for II-Life ESS (
Section 4.2) by using the battery packs of different EV manufacturers and comparing the results with those obtained by using I-Life battery modules. We consider different EV battery pack among the top-selling EV models.
Table 5 shows the rated energy and rated power values for 5 different EV battery packs used in our analysis. The rated voltage of all battery packs is 360 V, and the rated energy value is computed as the product of rated voltage and rated capacity.
Sizing results for I-life and II-Life ESSs are reported in
Table 6,
Table 7,
Table 8 and
Table 9. In particular,
Table 6 and
Table 7 show the number of series and parallel battery packs required for dedicated and shared I-Life ESS, respectively. On the other hand,
Table 8 and
Table 9 show the number of series and parallel battery pack required for dedicated and shared II-Life ESS, respectively. It is worth to note that the energy sizing of I-Life battery modules has to be multiplied for 1.66 to take into account the changing in the capacity from 100% to 60% at the EoL. For II-Life battery modules, instead, we have to multiply for 1.33 the energy sizing because the capacity changes from 80% to 60% at the EoL.
II-Life ESS sizing results in
Table 8 and
Table 9 are obtained by applying the proposed approximation for
CBATT and
Rint in order to obtain the functions
f and
g (2)–(3) for each battery pack in
Table 5 and they are listed in
Table 10 and
Table 11 for dedicated and shared ESS, respectively. The rated value of
Rint and the maximum number of
CDC at a given
DOD, (
CDCmax@DOD)
, can be derived by the manufacturer datasheet. In particular, the rated value of
Rint could be estimated by considering series and parallel of the battery cells in the battery pack provided by the manufacturer as in [
44,
45] for the Nissan Leaf model. It is worth noting that the proposed methodology can be applied if it is possible to identify a few data from the EV battery pack or, at least, the battery cell. However, EV manufacturers do not share many data on their battery packs. However, EV manufacturers do not share much data on their battery packs at the moment. For these reasons, we considered rated data of the EV battery packs provided by EV manufacturers’ website and we assumed the CDCmax@DOD values very close to them of SAFT batteries. This assumption is a hypothesis introduced for testing the proposed method with a demo case performing techno-economic assessments and evaluations. It is worth noting that effective parameters introduced in
Table 10 and
Table 11 must be experimentally validated before applying the method to a real case study in order to obtain more accurate results.
From the proposed comparison, it seems that clustered CSs allow more efficiently using the installed capacity of the shared ESS compared to that of the dedicated ESS for single CS. Although the total energy supplied in a day to the EVs is the same for both single and clustered CSs, the total installed capacity of their related ESSs is different. In fact, the sizing of dedicated and shared ESSs is carried out by taking the worst case resulting from MC simulations. For CSs with dedicated ESS, it appears that the worst case results in a bigger oversizing of the ESS, on average, compared to that of the shared ESSs. In other words, by grouping CSs it is possible to make the overall power and energy request of the ESS less variable than a single CS. Moreover, the capacity of EV battery packs could be bigger than the required capacity for dedicated ESS and then it results oversized not obtaining a full use of the entire ESS stored energy (e.g., the Tesla battery pack). On the other hand, shared ESSs require a bigger capacity compared to that of dedicated ESSs, and then more than one EV battery pack is necessary to implement dedicated ESS obtaining a lower oversizing of the ESS capacity.
For these reasons, we define the ESS
utilization coefficient as the ratio between the total provided energy and the total rated energy of the ESSs in the PA, and we consider the average value for dedicated and shared ESSs, respectively. In particular, by considering ESSs composed by the battery packs in
Table 5, we obtain values up to 59% and 73%, for dedicated and shared ESSs, respectively. It follows that clustered CSs with shared ESS could reduce the investment costs compared to the single CSs with dedicated ESS, because it optimizes the sizing of the ESS
Moreover, for this application, battery packs characterized by a great sizing in terms of rated power and energy (e.g., the Tesla one) are oversized and lead to high costs as better highlighted in the next Section.
It is worth to note that sizing results, reported in
Table 8 and
Table 9, refer to only one dedicated and shared II-Life ESS, respectively. In particular, for a whole PA consisting of CSs with dedicated ESS, and considering different EV battery packs, up to 50 additional EV battery packs are necessary compared to that required for I-Life modules. Instead, the additional battery modules required for CSs with shared ESS are up to 20. The reduced capacity and the additional modules lead to a further increase in the investment cost for II-Life ESS and then, a comparative economic analysis with I-life ESS is proposed.
The effectiveness of CSs with dedicated and shared ESSs is showed in
Figure 7b. The flattening effect on the UniSA power demand is highlighted when the electric load is greater than
PGmax. The active power trend absorbed and supplied to the external grid by dedicated and shared ESSs is quite similar. This is because even if the rated energy and rated power dedicated and shared ESSs are different, used energy to charge EVs is the same. In particular, the ESSs reduce the peak load acting in load following mode from 9:00 to 12:00 and from 16:00 to 19:00. Instead, from 19:30 onwards, the ESSs that are not fully charged restore their state of charge absorbing in constant power mode from the external grid.
5.3. Economic Assessment
The
ACOE value is calculated for I-Life and II-Life battery solutions by using the parameters listed in
Table 12. We, also, assume without losing in generality, that
CFC is zero and the
CREP is equal to 80% of
CI.
Moreover, the energy supplied to the EVs by the CSs is the same for both dedicated and shared ESSs and then the overall annual energy of the ESSs in the PA is equal to 440 MWh. Finally, by assuming a full equivalent CDC per day, the value of L is about 4 years and about 2.5 years for I-Life and II-Life dedicated ESS, respectively. For shared ESSs, instead, the value of L is 3.5 years and 2.5 years for I-Life and II-Life ESSs, respectively, due to a greater operating DOD.
In
Figure 9a, we compare the
ACOE value of I-Life ESSs implementing dedicated and shared ESS solutions with different battery packs. Obtained results show that CSs with shared ESS is always the most economically convenient solution. In fact, case2 is characterized by an ACOE value between 10% and 20% lower than case1. This is because case2 requires larger ESSs in terms of rating power and capacity but thanks to the energy management algorithm, it is possible to reduce the required number of ESS by a fifth compared to case1.
Figure 9b shows the comparison of
ACOE values for CSs with shared ESS implemented with I-Life and II-Life battery modules. In particular, by considering different battery packs, we evaluate the II-Life cost reduction to give a competitive price to the II-Life ESSs compared to the I-Life solution. In our case studies, the sensitivity analysis has pointed out that the price of II-Life battery modules should be significantly reduced in order to obtain an
ACOE value comparable to that of the I-Life ESS. In particular, CSs with shared ESSs need a cost reduction of II-Life battery module between 10% and 30%, according to different battery packs, to obtain the same
ACOE value of I-Life battery modules. This reduction in the cost for II-Life modules is due to an increase in the battery modules needed to guarantee the same performance of the I-Life ESSs. It is worth to note that 100% cost reduction of II-Life battery modules leads to an
ACOE value of the II-Life ESSs not equal to zero due to
M&
Ocosts.
6. Conclusions
A novel sizing method and economic evaluations for II-Life ESSs supporting EV charging stations, are presented. A linear relationship is assumed to approximate the degradation and aging of lithium-ion batteries. A procedure to size the ESS for dedicated or clustered CSs taking into account the power and energy management algorithm of the ESS is introduced. We propose a methodology for sizing II-Life ESSs able to guarantee given requirements at the EoL for energy applications and to tackle the uncertainty due to inaccurate estimations of the residual capacity in II-Life battery modules.
The sizing in terms of rated power and capacity of dedicated and shared ESSs for CSs in I-Life and II-Life technology have been obtained. Simulation results prove that they are able to provide a peak shaving service on the UniSA microgrid by reducing the maximum power absorbed by the main external grid.
We calculate the ACOE of the II-Life battery solutions for dedicated and shared CSs. Obtained results have shown that the 5-clustered CS solution is characterized by a reduced ACOE value (about 13% average value) compared to the dedicated CS solution. Finally, we compare the ACOE of II-Life and I-Life ESSs in order to identify a competitive price of II-Life battery modules.
Future research directions for techno-economic assessments of ESSs supporting CSs could be related to the development of an optimal energy management algorithm. Moreover, the number of CSs in a cluster with shared ESS could be optimized according to the size of a given EV battery pack.
Finally, based on such kind of cost analysis, it is possible to optimize charging prices for EV users and therefore, assess the profitability of an investment for the manager of the CSs.


