Article

Exploring Malware Behavior of Webpages Using Machine Learning Technique: An Empirical Study

by
Alhanoof Faiz Alwaghid
1 and
Nurul I. Sarkar
2,*
1
Department of Computer Science and Information, Al Jouf University, Al-Jawf 2014, Saudi Arabia
2
Department of IT and Software Engineering, Auckland University of Technology, Auckland 1010, New Zealand
*
Author to whom correspondence should be addressed.
Electronics 2020, 9(6), 1033; https://doi.org/10.3390/electronics9061033
Submission received: 20 May 2020 / Revised: 15 June 2020 / Accepted: 19 June 2020 / Published: 23 June 2020
(This article belongs to the Section Computer Science & Engineering)

Abstract

:
Malware is one of the most common security threats experienced by a user when browsing webpages. A good understanding of the features of webpages (e.g., internet protocol, port, URL, Google index, and page rank) is required to analyze and mitigate the behavior of malware in webpages. This main objective of this paper is to analyze the key features of webpages and to mitigate the behavior of malware in webpages. To this end, we conducted an empirical study to identify the features that are most vulnerable to malware attacks and its results are reported. To improve the feature selection accuracy, a machine learning technique called bagging is employed using the Weka program. To analyze these behaviors, phishing and botnet data were obtained from the University of California Irvine machine learning repository. We validate our research findings by applying honeypot infrastructure using the Modern Honeypot Network (MHN) setup in a Linode Server. As the data suffer from high variance in terms of the type of data in each row, bagging is chosen because it can classify binary classes, date classes, missing values, nominal classes, numeric classes, unary classes and empty classes. As a base classifier of bagging, random tree was applied because it can handle similar types of data such as bagging, but better than other classifiers because it is faster and more accurate. Random tree had 88.22% test accuracy with the lowest run time (0.2 sec) and a receiver operating characteristic curve of 0.946. Results show that all features in the botnet dataset are equally important to identify the malicious behavior, as all scored more than 97%, with the exception of TCP and UDP. The accuracy of phishing and botnet datasets is more than 89% on average in both cross validation and test analysis. Recommendations are made for the best practice that can assist in future malware identification.

1. Introduction

Malware is known as malicious software that represents a crucial threat to the security level of systems. At present, malware codes are hidden behind a huge amount of data, so existing defensive mechanisms often are not able to defend against a malware attack. Malware attacks could cause damage to many internet-connected devices via viruses, worms and Trojans, among many others [1]. Since internet data are substantial, the pattern of malware attack may differ, but is identifiable by its nature. Malware in webpages is one of the biggest threats for both home users and organizations. Malware continues to be a cyber-threat and in 2016, more than 357 million of malware variants were observed [2]. AVTEST reported that 95 million websites were infected by malware in 2017 [3]. The behavior of malware can be identified from a webpage and browsing history or data. Data from a malware can hint at the malware’s properties but not the relationships among features of the data; mostly, these data do not identify ‘suspicious’ behavior. Nonetheless, attackers try any possible approach to break into a victim’s system.
However, tactics are preferred by adversaries that allow them to attack a huge number of users in several minutes [4]. Most hackers today can effectively escape detection by security protocols [5], such as firewall and intrusion detection system (IDS); invaders have used techniques to spread their exploited code that include utilizing online advertisements of website pages [6], structured query language injection (SQLI), cross-site scripting (XSS) and another web scanner [7]. Hence, in many cases, identification of a hacker is not possible [8]. However, despite the potential security threat from attacks, it is possible to protect a website/server from damage by recognizing the behavior of malware attacks [9]. The McAfee threat report identified malware as the most common form of cyber-attack. Therefore, the main concern is the behavior of malware with the aim of suggesting a security protocol to prevent future damage in web space [9]. Malware behavior on websites has been exclusively studied because malware is preventable if its nature is identified [10]. The nature of malware can be identified with feature selection techniques. When data are multivariate and require more preprocessing, classification with ensemble methods (a machine learning technique) may perform better to select suitable features. This paper is motivated by an important consideration. It is rare of literature to investigate the individual features such as the effect of transmission control protocol (TCP), user datagram protocol (UDP), junk, benign and so on. Thus, a study of botnet data is required that might reveal the individual effects of those features. In most cases, malicious data are not in the correct format for suitable features to be selected from the data. However, machine learning offers a promising solution to identify different types of malicious behavior [11]. To overcome the above problems and challenges, the current study identifies the behavior of malware by classification accuracy in terms of the number of occurrences. The empirical investigation reported in this paper provides clear guidelines for selecting features with appropriate classification techniques, which will help to identify the behavior of malware. Thus, future computing may be better able to fight malware. The important features of malware may be having an IP address, port, universal resource locator (URL), pop-up window or email, which are identified in this study. The primary aim of this research is to identify and analyze malicious webpage behavior and considers the property of a webpage as having an IP address, port, requested URL, email browsing and web traffic, based on experimental datasets. It is better to use several datasets to identify malware features and to validate the findings, In this study, the first dataset is donated by Mohammad et al. [12,13,14], from the University of California Irvine (UCI) machine learning repository; the second dataset is donated by Meidan et al. [15] from the UCI Machine Learning Repository. Honeypot data are collected by deploying Modern Honeypot Network (MHN) software [16]. We identify malware behavior through feature selection, determine influential features that have been targeted by attackers, generate similarities between the properties of malicious webpages to identify the common target of exploitation, and predict the malware vulnerability of specific features. Most datasets on malware are not reliable as they contain insufficient data descriptions and features are not clearly understandable. The research challenge is great when we have huge number of malware data without the meaning or the relationships among features of the data. This paper makes a major contribution to the identification of malware behavior. Our analysis contributes by showing that the findings of this study suggest the kinds of features that are identical or point to exploitation by hackers in malware attacks to reduce such attacks. In summary, our main contributions in this paper are outlined below.
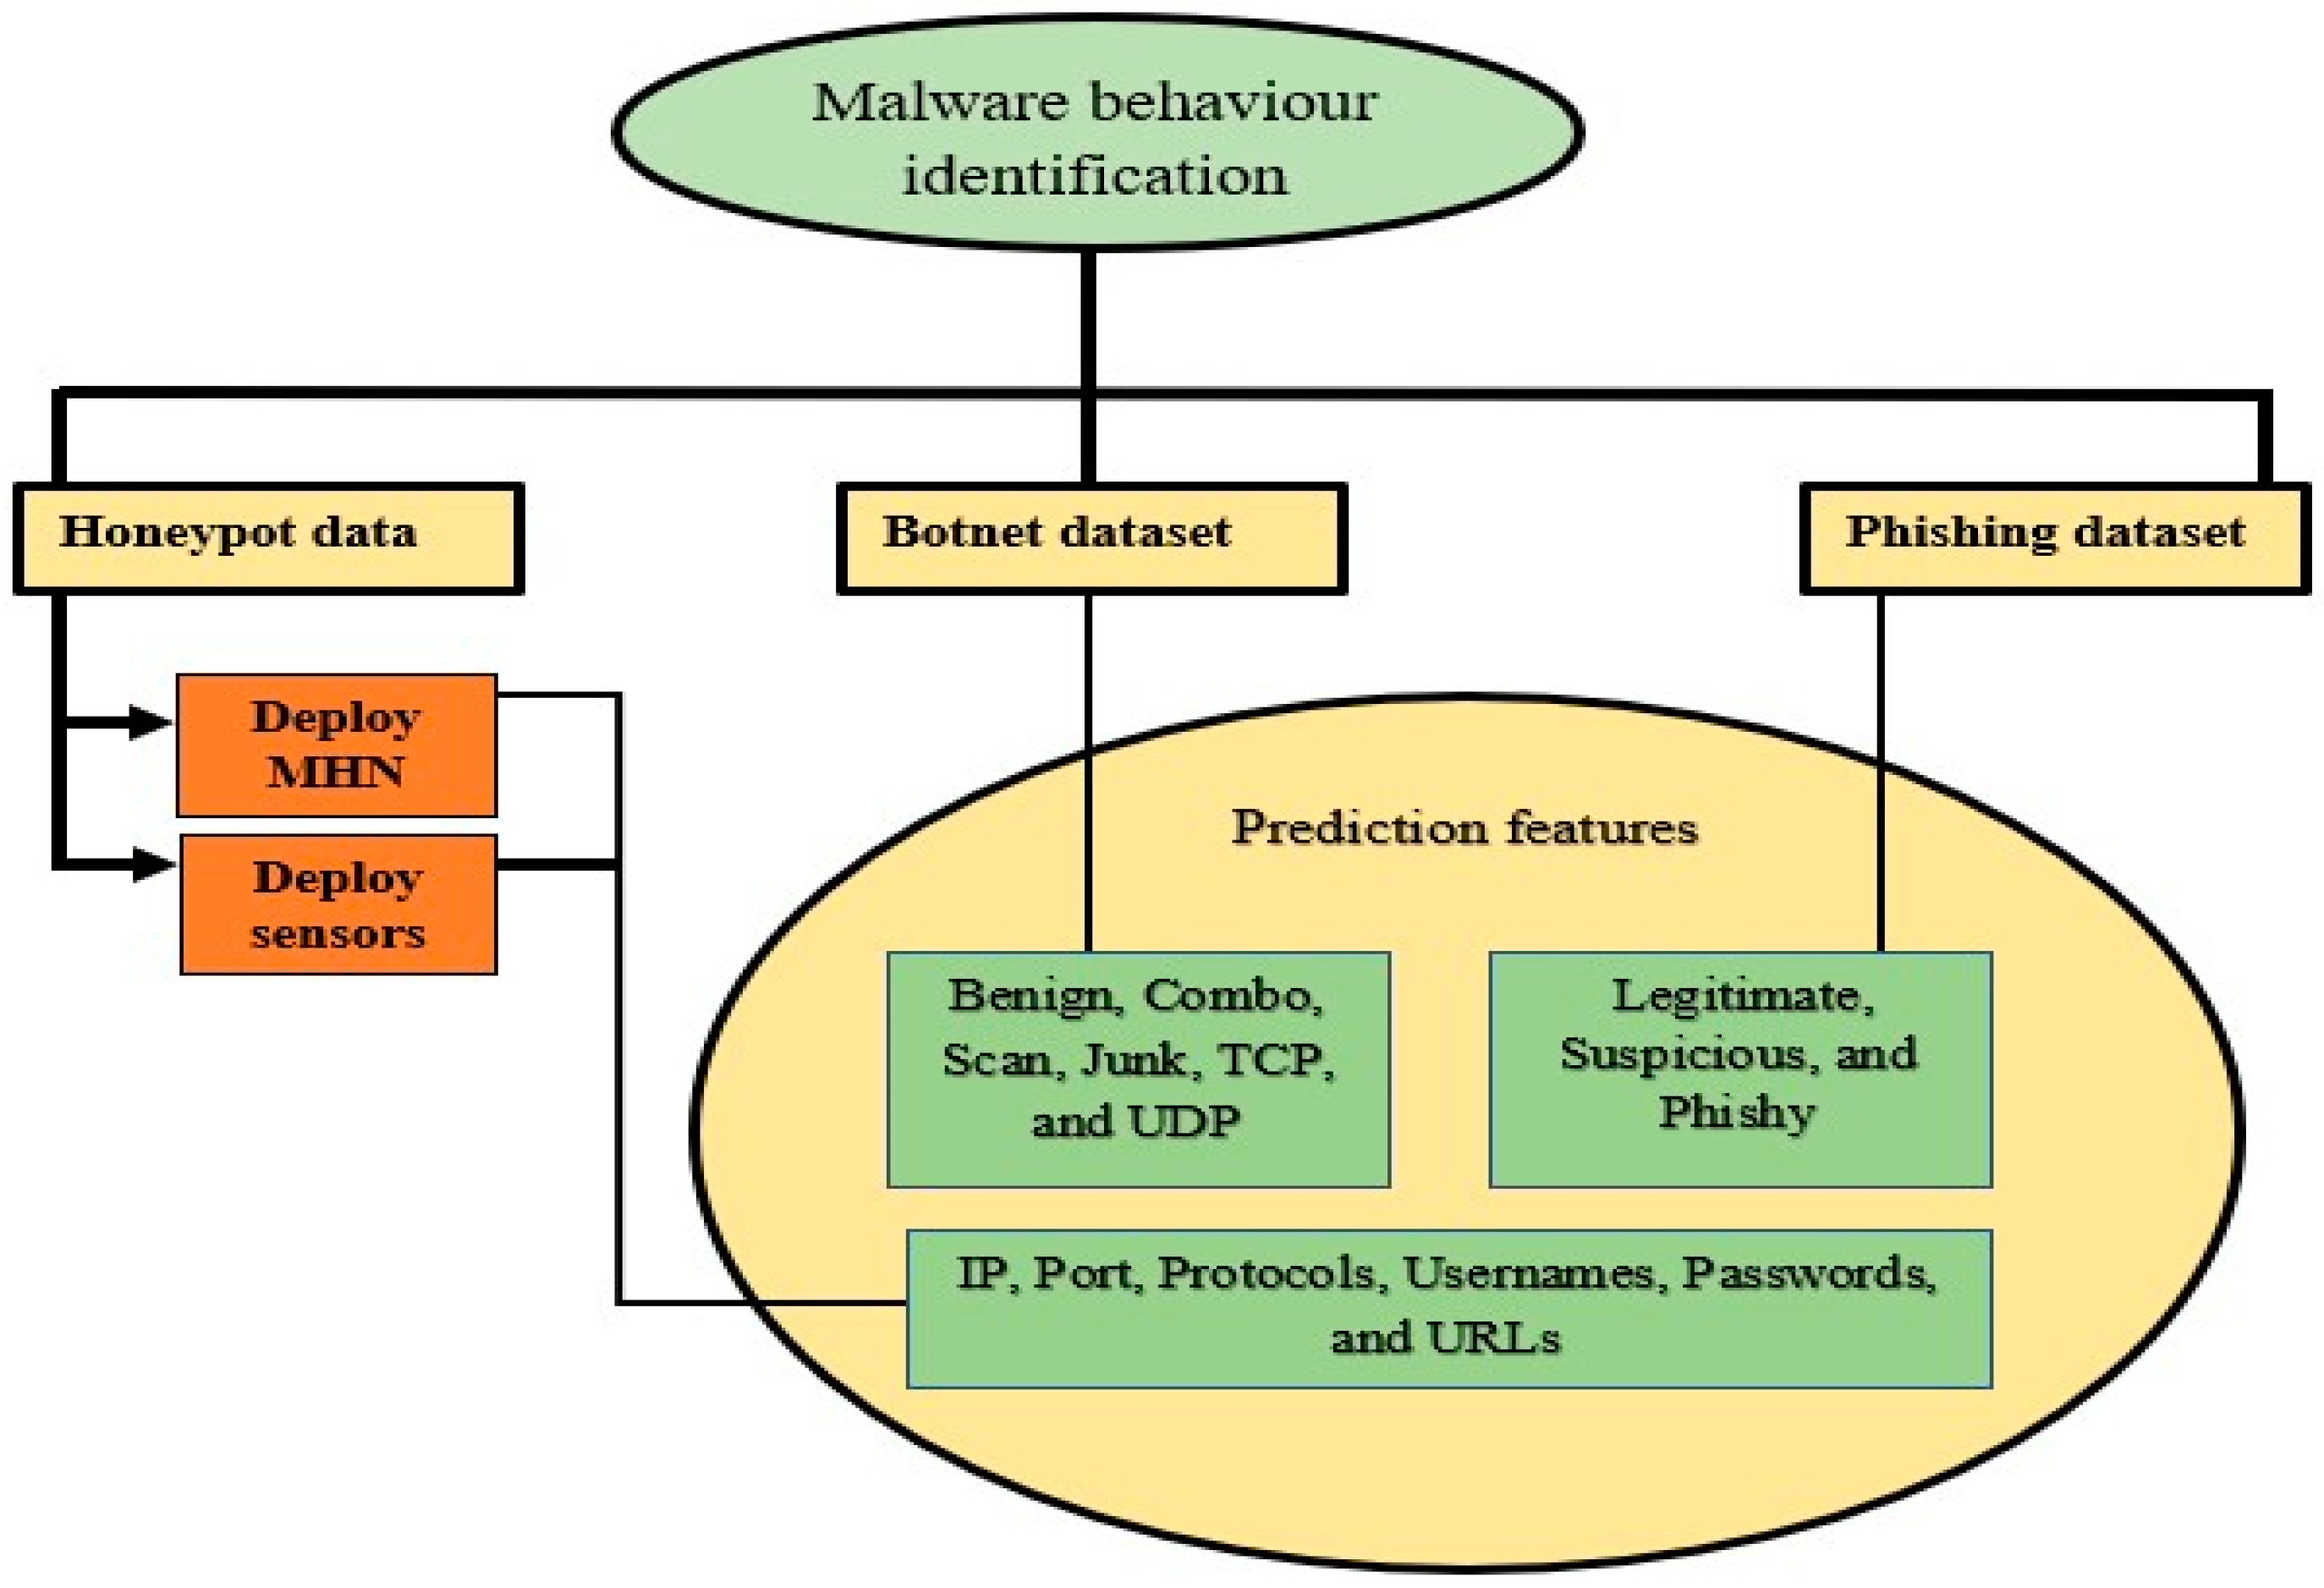
  • We identify the most targeted features of malware attack in three datasets namely, phishing, botnet and honeypot using a machine learning technique. We identify the most vulnerable features that are common to these three datasets. We also identify legitimate, phishy, and suspicious behavior in these features.
  • We compare maliciousness in two available datasets and applications to identify maliciousness in custom-built honeypot infrastructure. Identification is achieved with the accuracy of the number of occurrences for the selected features.
  • We discuss the difference between Google index and page rank in identifying malware behavior, which is a significant achievement of this research along with identification of malware behavior on webpages.
  • We provide two recommendations for best practices that add scientific rigor to the identification of future malware.
This paper is organized as follows. Section 2 reviews related work on malware behavior in webpages and classification using machine learning techniques. Feature selection in malware webpages, which is an important issue, is described in detail. Therefore, malware behavior of webpages is highlighted in this section. In Section 3, we introduce the key idea of the proposed research design and methodology used in the study. The main findings from the three datasets are evaluated in Section 4, and a brief discussion of the results is presented in Section 5. Section 6 concludes the paper with areas for future research.

2. Literature Review

2.1. Identifying Malware Behavior in Webpages

A significant amount of research has been conducted on malware attacks, but little attention has been paid to the behavior of malware. The idea of using a classification has been explored by many researchers, e.g., Altaher [17] used several classification techniques, including Naïve Bayes, neural networks, support vector machines (SVM), decision trees (DT) and k-nearest neighbor (KNN) to identify the behavior of websites. The author proposed a hybrid methodology that combines the KNN algorithm with SVM to classify websites as phishing, legitimate or suspicious. First, KNN was applied to classify noisy data, and then, SVM was applied to improve the classification. KNN and SVM performed better than other classifiers with 87.45% and 83.76% accuracy, respectively. The hybrid methodology gave the highest accuracy of 90.04%. The important findings from the research were that phishing (website behavior) always obtained more than 90% accuracy, which suggests that to identify malware behavior in websites, phishing behavior needs to be considered. Although Altaher’s research quantified the performance of several classifiers, it did not consider the performance of DT or other popular classifiers such as ensemble. Bahnsen et al. [18] proposed two methods to identify phishing URLs from websites. One method was feature engineering with a lexical and statistical URL analysis and random forest (RF) classifier. The second method, the long/short-term memory (LSTM) neural network, was claimed by the authors to be novel as it had a model training accuracy score of 0.98, whereas RF had a model accuracy score of 0.93. Although LSTM was 5% more accurate than RF, it may not be an acceptable option by the researcher because the run time was almost 4 h, whereas RF required only 3 min.

2.2. Classification and Machine Learning to Identify Malware Behavior

Machine learning methods are a suitable analysis technique for classifying websites as legitimate, phishy or suspicious because they utilize a binary classification [19]. The main point of these methodologies is to classify the behavior (feature) instead of the user, as many clients are unable to identify malware attacks [20]. Several machine learning methods were considered by Abu-Nimeh et al. [21], including Bayesian additive regression trees (BART), RF, LR, SVM, artificial neural networks (ANN) and classification and regression trees (CART) to predict phishing attacks in emails. They tested 2889 samples in both phishy and legitimate emails, which helped them extract 43 features. In their research, LR performed better than the others; however, Basnet and Doleck [22] found RF to perform the best and SVM the worst, when comparing seven methods of machine learning. Al-Garadi et al. [23] discussed several machine learning algorithms including DT, SVM, Bayesian algorithms, KNN, RF, association rules (AR), ensemble, learning, k-means clustering and principal component analysis (PCA), along with their advantages, disadvantages and applications in security. It is often noted that SVM classifiers may outperform DT. However, the DT with the ensemble method may enhance the performance of DT, which may supersede SVM. Hoang and Nguyen [24] examined the effectiveness of supervised learning techniques to select suitable features in the botnet data from the Alexa top-level domain using some common supervised machine learning algorithms, including KNN, DT, RF and Naïve Bayes. The authors focused on DNS queries and obtained over 90% accuracy, in general. However, they did not focus on individual features such as the effect of transmission control protocol (TCP), user datagram protocol (UDP), junk, benign and so on. Kumara and Jaidhar [25] utilized VMI technology to characterize unknown benign and malware data to conduct a forensic analysis of inside memory, and an intelligent cross-view analyzer (ICVA) to identify hidden, dead and dubious processes data. They employed 10-fold cross-validation to detect unknown malware but did not present their test results.

2.3. Feature Selection in Malware Websites

Feature selection is important when data are highly dimensional and computational power needs to be minimized. To achieve better accuracy and faster run times, random feature selection is better and can sometimes be done based on feature relevance in terms of accuracy [26]. Some organizations and end users depend on antivirus tools and security techniques to secure their devices. However, the techniques utilized by such programs are inadequate for identifying and preventing malware performance. Basnet et al. [27] evaluated two feature selection methods to identify phishing attacks: correlation-based and wrapper-based feature selection; three machine learning classifiers, Naïve Bayes, LR and RF, were compared. The authors demonstrated that the feature selection method that affected classification results in their study was wrapper-based feature selection, which was slower than correlation-based. However, they collected their dataset without analyzing the features and compared the feature selection methods based only on error rates—false positive and false negative. Based on this, the current study has chosen correlation-based accuracy when employing bagging and random tree. Basnet et al. [28] classified phishing URLs by utilizing a heuristic-based method whose classifier is based on data offered only in URLs, without looking into the contents of webpages. The authors studied phishing and benign URLs, and features were extracted by running several scripts. They used four categories to select the features that include lexical, keyword, search engine and reputation. The study aimed to identify URLs as either phishing or non-phishing and several machine-learning techniques were compared to determine the best classifier for phishing URLs. Although, they did not examine the suspicious feature of URLs, as was done in the current research.

2.4. Malware Behavior of Webpages

The study by AVTEST [29] illustrated the trends in malware attack per year from 2008 to 2017 and the number of attacks increased from 100 million to 600 million, respectively. Malicious behavior can be observed in websites as well as in IoT devices connected to the internet. Numerous malicious attacks occur through DDoS, structured query language (SQL), XSS, HTTPS token and web traffic [23]. CertNZ [30] mentioned that websites are one of the resources that may suffer from unauthorized access. An unauthorized person may gain access to usernames, passwords or login details by using different types of malware or dictionary-based software such as brute force. Thus, this study considered email/junk, username and password as an important feature to detect malware behavior. Pandey and Saini [31] conducted a study on TCP, IP and UDP to understand attack mechanisms. They used several tools to identify the vulnerability of a network based on these three features and suggested that it is necessary to learn how to protect network security rather than simply identifying vulnerability. To meet this goal, the current study proposed machine learning techniques to identify related features such as TCP, IP, junk (email), port and their malicious behavior, to identify future malware trends. Li et al. [32] described botnet attacks based on DNS and reported several studies of botnet techniques. However, the research did not focus on the features of a botnet, such as which features are more related to security vulnerability. To fill this gap, the current research studied botnet data and identified relevant features that represent malware behavior.

2.5. Malware Behavior of Honeypot

Use of honeypots allows a malware attack scenario to be achieved even without access to vulnerable software [33]. To identify the spread of malware in a honeypot, Kaur and Kaur [34] described the detection of malware programs linked to webpages. Honeypots are security devices that detect malicious webpages on a network. Cabaj and Gawkowski [33] deployed honeypots at the Institute of Computer Science to test their practicality and observed that the number of attacks was correlated with the complexity of the web application in the honeypot.

3. Materials and Methods

The research methodology was selected based on the objectives presented in Section 1. The research was conducted through an empirical study. When data classification/feature selection is involved, a test-bed phase is required to achieve the highest accuracy because different classifiers may produce different accuracy. Experimental analysis enables analysis of data, as required by several classifiers—in this study, bagging and different base classifiers: decision stump, hoeffding tree, random tree, j48, RF and REPTtree. Random tree as a base classifier for bagging was chosen for the remainder of the analysis as it achieved better accuracy in experiments. This research used a hierarchical process model with five phases, each with a specific task. This methodology helped us to follow the steps as required to complete the study. The first stage of the methodology involves understanding the problem to achieve the study objectives. Data collection required data description. The data preprocessing stage prepared the data to train machine learning algorithms. Data analysis was the final stage in identifying features.

3.1. Identify the Problem

The first phase that took place was identifying malware behavior, which is still a research challenge.

3.2. Data Collection

The existence of a massive amount of internet data with little information regarding the expected features of malware means that the identification of malware behavior is not easy. The second phase executed was the data collection step, which was as follows: Phishing data were downloaded from the UCI Machine Learning Repository (https://archive.ics.uci.edu/ml/machine-learning-databases/00327/). In this dataset, the features that proved to be effective for predicting malware websites were studied. Botnet data were taken from the UCI Machine Learning Repository (https://archive.ics.uci.edu/ml/machine-learning-databases/00442/) to capture network traffic patterns. Honeypot data were collected for several months to enable an in-depth analysis through application of MHN software; this phase involved a testing scenario to make it as real as possible.

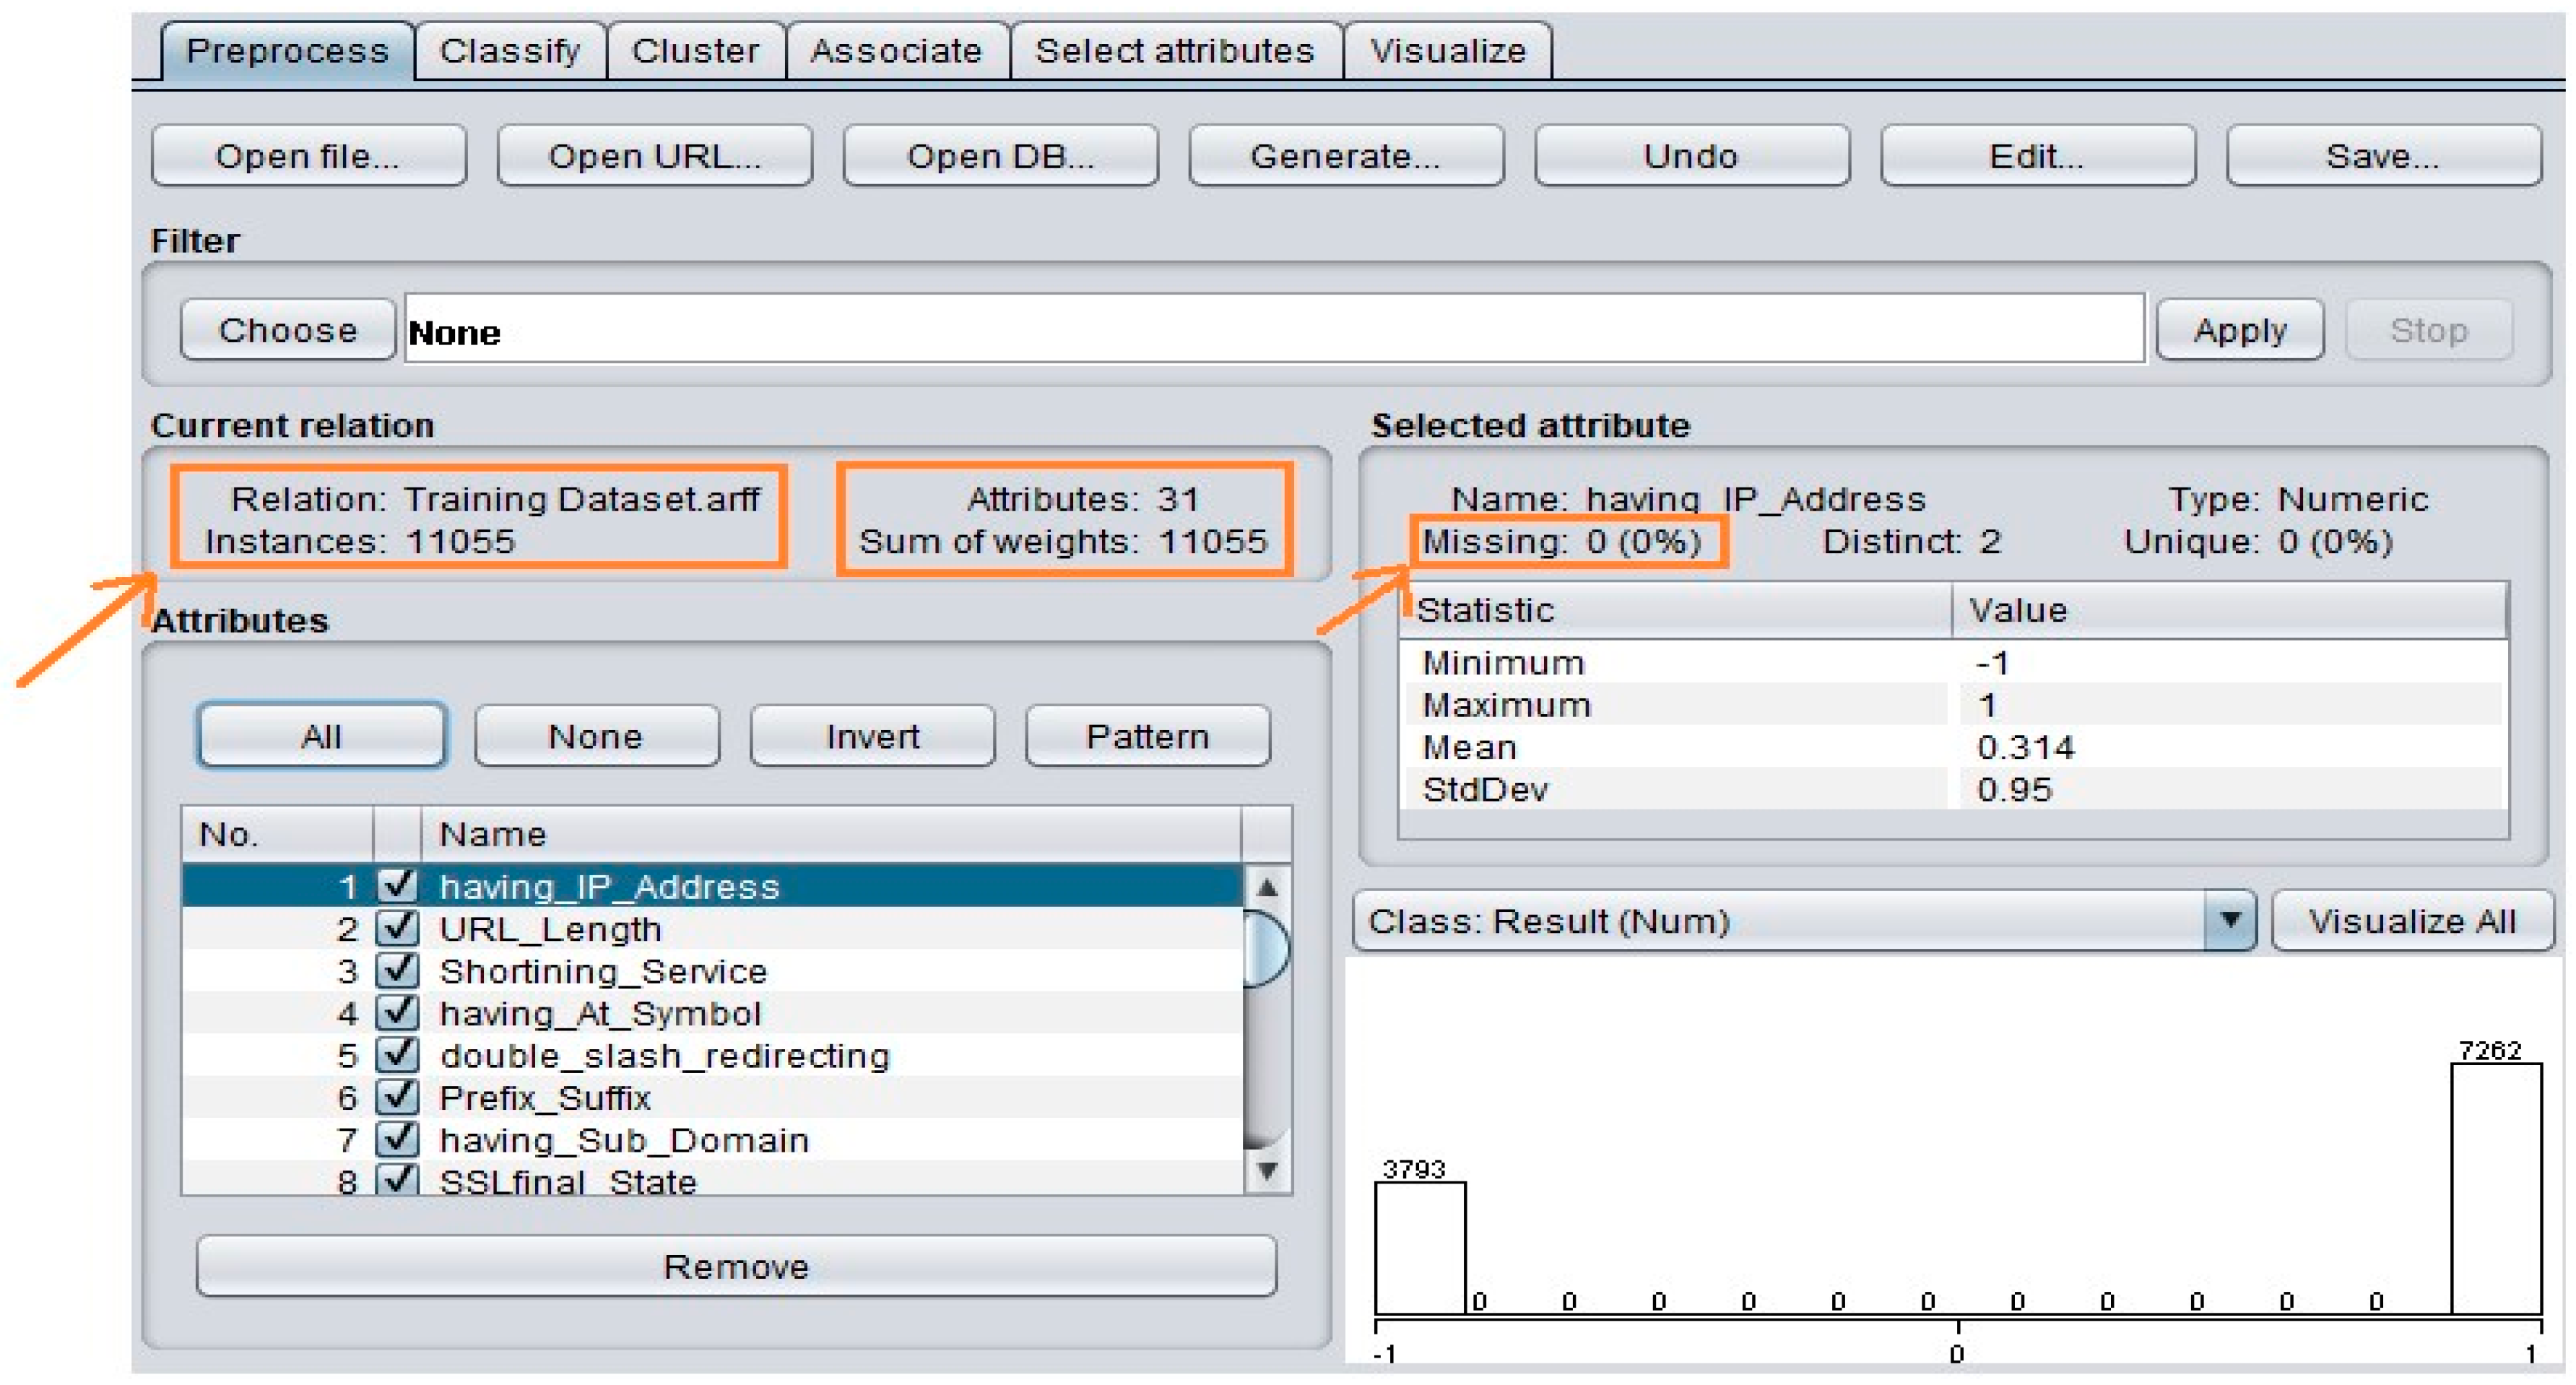
3.3. Data Description

The scenarios in the experiments were based on three types of data: In the phishing dataset, the number of attributes was 31 and there were 11,055 instances without any missing values, where the data type was integer (Figure 1). For data analysis, the Weka tool was utilized; it was used to generate an Excel file for the phishing dataset to enable examination and analysis using charts. Excel worksheets were utilized to graph results. Phishing data contain three types of behaviors: phishy, suspicious and legitimate. Phishy behavior is an attack designed to steal users’ confidential information, which may cause substantial financial harm. Phishing websites are those which are designed to hijack websites and obtain users’ sensitive information [35]. Suspicious behavior is an activity that may be considered as phishy and could have malicious codes and links [36]. A legitimate webpage is a page with clean source code which means it does not contain any malicious code in its source code [35].
Botnet data: The dataset had 115 attributes for each type of attack: 40,395 and 13,111 instances of benign for Danmini and Ecobee, respectively. Danmini is an antihacking tool that is similar to a hardware device. If this device is safe, then the computer is safe too. Ecobee is a device model similar to Danmini; the device was used with the botnet dataset as well. Both Danmini and Ecobee are successors of IoT technology and devices [15]. The data type was numeric for Danmini and Ecobee. In this research, gafgyt attacks—‘A type of botnet attacks that was found in Danmini and Ecobee’—were studied. It is also known as BASHLITE, an IoT botnet attack that mostly compromises Linux servers using brute force attacks [37]. Weka (Waikato environment for knowledge analysis) software is a data mining tool used for data analysis to find the accuracy of each feature and summarize them, with a graphical user interface. Weka uses different algorithms to classify data and it is open source for data preprocessing, classification and feature selection [38]. The features that were analyzed in this study by Weka were benign, which is considered as non-malicious traffic data [39] with normal traffic patterns. Combo refers to sending spam data to an email and opening connection time [15]; junk is sending spam data; scan is to scan the network for any vulnerable data [40]; TCP and UDP—using the bagging method and random tree as classifier; the classifier evaluation options were cross-validation and percentage split, which is known as test analysis. The honeypot dataset includes several types of attacks, such as IP address, port, protocols, usernames, password, and requested URLs. There were around 80,462 attacks for the three types of honeypot sensors used in this research: Snort, Kippo and Glastopf. Snort is an open source IDS that is used to discover and scan if someone is trying to get into your network; then, it can log the alerts to a database [41]. Kippo was selected as one of the sensors in the honeypot to identify different and unique data, such as the most used usernames and passwords. Glastopf is one of the web application honeypot sensors that was deployed via the MHN server. It can mimic web vulnerabilities to collect data about attacks that are targeting the web server such as SQL injection [42].

3.4. Data Preprocessing

The data features chosen were those that were most relevant based on the literature review; the data of the phishing dataset were changed to 0, 1 and −1, based on Mohammad et al. [12]. The authors defined 1 as legitimate, 0 as suspicious and −1 as phishy. Data preprocessing was important for choosing suitable features and differentiating malicious behavior. For honeypot and botnet data, preprocessing was not required as there were no missing values or outliers.

3.5. Data Analysis

Bagging as an ensemble was chosen as it mostly performs better than a single classifier; bagging ensemble classifier can be utilized to expand the accuracy of the classification. Random tree was the base classifier in bagging, based on the high accuracy obtained in comparison with other base classifiers with bagging (Table 1). In the initial experimental analyses that were done by the author using the Weka tool, several base classifiers were employed with the bagging ensemble method (one of the meta algorithms in Weka tools): decision stump, hoeffding tree, J48, RF, random tree and REPTree. The empirical analysis showed that of all the base classifiers, random tree performed better; thus, random tree was chosen as a base classifier for bagging. It was noted that random tree was the best, with accuracy of 88.22%, which has more relevant ROC of 0.938 in terms of time in only 0.2 sec. The result of ROC near 1 is better. Tenfold cross-validation was the test option chosen, meaning that the dataset is divided into 10 parts, with one for testing and nine times for training, which then produced the classifier for the data.
This research was designed to study malware behavior on webpages. The ensemble method was used for data analysis in combination with random tree as a classifier model. Several benefits were obtained by employing this combination. In this research, the bagging (bootstrap aggregation) algorithm was selected for use. Several steps were adopted for the research:
  • Identify malware behavior through feature selection.
  • Determine influential features that have been targeted by attackers.
  • Generate similarities between the properties of malicious webpages to identify the common target of exploitation.
  • Predict malware vulnerability of specific features.

3.6. Research Design

This section provides a brief introduction to the research design, which was divided into four main phases. Figure 2 shows the phases included to achieve the research goals. Each of these processes is described to explain the research design.

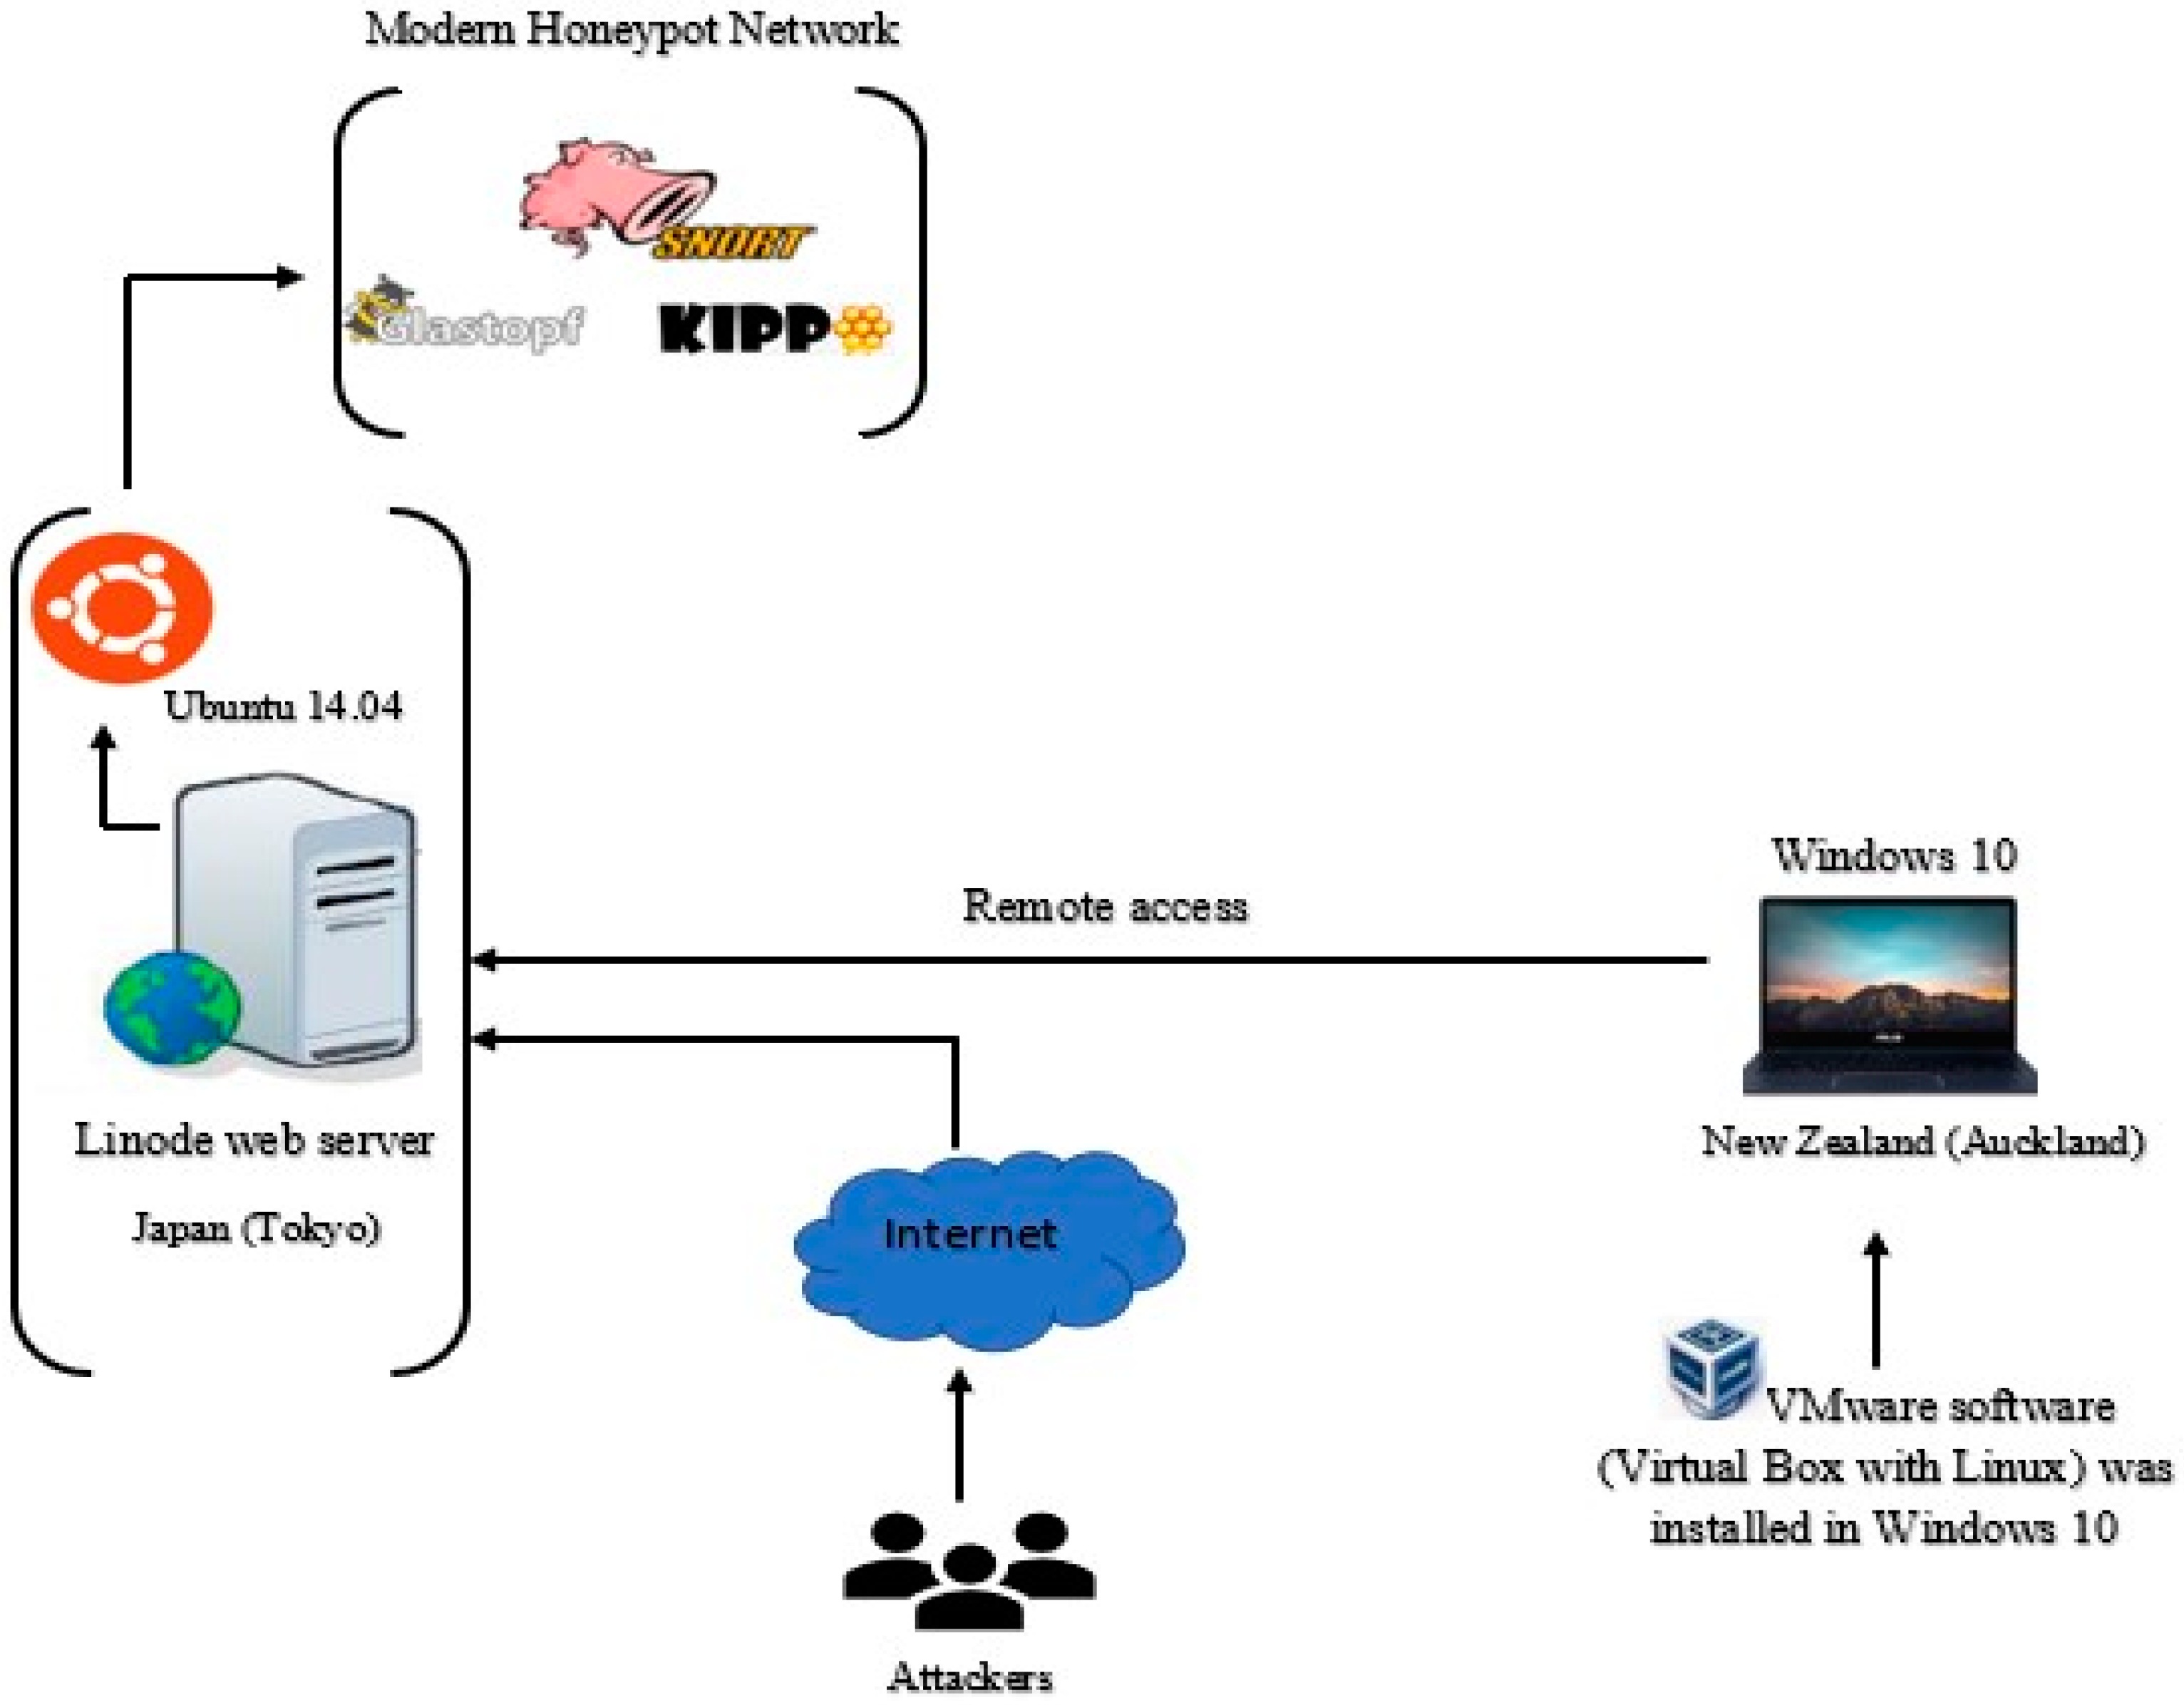
3.6.1. Honeypot Deployment Method

This study employed a virtual honeypot that can emulate services or a network; it was considered a low-interactive honeypot. In the preparation stage, the operating system and software characteristics were identified and set up for collecting the data from the honeypot. This included the web server setting, virtual machine ware (VMware), and the internet connection arrangements to prepare for the next phase, including any required software/packages to support the main goal of operating readily during the experiment. Some of the experimental settings, including the operating system and the main software used (MHN), were open source, so they were downloaded from the internet. The cloud web server (Linux server) hosting from Linode was closed source, which required payment for the hosting and the hardware components (laptop and its belongings), which were sourced locally. Figure 3 shows the honeypot data collection process. The diagram illustrates that the Linode web server was accessed remotely using Windows 10, located in New Zealand (Auckland). The VMware software (Virtual Box) was installed in Windows 10; it was used to set up the MHN software and the sensors (Snort, Kippo and Glastopf) remotely in the Linode server. The Linode web server had Ubuntu 14.04 as a platform for MHN and the geolocation was in Japan (Tokyo, Japan). MHN was set up in Ubuntu 14.04 using VMware. The data were collected using MHN’s sensors and were stored in the Linode web server. After installation of the MHN, the ‘ifconfig’ command was employed to find the public IP address generated by Linode for the web server. Once the IP address was copied and pasted into the search engine (Google Chrome), the MHN webpage appeared. An email address and password were required to be entered and these were used during the configuration step to view the MHN GUI (graphical user interface).

3.6.2. Feature Selection

The common properties or common nature of features in the three datasets were chosen to validate the results. In the phishing dataset, the ensemble method with random tree as a base classifier was utilized to classify features as legitimate, phishy or suspicious. The features were classified according to the number of occurrences and their relevance. For example, the feature ‘having IP address’ was selected by bagging (random tree) based on its relevance and maximum number of occurrences of 8000, while 3793 occurrences were considered phishy. In the botnet dataset, the features chosen for the botnet data were benign, combo, scan, junk, TCP and UDP—the relevant features based on accuracy and relevance. In the honeypot dataset, the feature selection consisted of IP address, port, usernames, passwords, requested URLs, TCP, UDP and internet control message protocol (ICMP).

3.6.3. Identification of Malware Behavior

The analysis presented in Section 4.3 shows that the most malware attacks occurred between October 2017 and February 2018; the attack period identified was similar to that of the McAfee threat map by month. One study shows the virus threat map created by McAfee Antivirus software in 2017 [9]. They found that attackers contacted an IP address or domain that was used to host a malicious document. These attacks were based on IP. Another report from the McAfee lab shows that malware attacks through spam were high during the last quartile (Q4: October, November and December) of 2017 and the first quartile of 2018 (Q1: January, February and March). The source of McAfee data are McAfee spam traps, crawlers and customer submissions [9]. The study confirms that the attacks were mostly from October 2017 to February 2018, as identified in the current study. The above discussion and the findings in the next chapter show that studying the behavior of malware is crucial. The features selected and the time frame to collect honeypot data for this study are in line with the McAfee virus threat map. Thus, predictions about malware are required to ensure future safe webpages.

3.6.4. Predicting Malware Attacks

There are several ways to predict the behavior of malware, including examination of previous malware data (generated from honeypot infrastructure). Assessing the legitimacy of IP, port, request URL, Google index, email, web traffic, pop-up window, links, page rank, HTTPS token, abnormal URL, combo, junk, scan, TCP, UDP, ICMP, password and username can provide a better idea of how malware behaves and what areas are targeted in a malware attack.

4. Results

In this empirical study, phishing, botnet and honeypot datasets were used for performance evaluation to predict attacks from phishing and botnet data. Table 2 summarizes the three datasets used in the study. Both 10-fold cross-validation and test (66% training data; the rest (34%) of the data were test data) analysis show that the percentage of attacks in phishing data and botnet data was more than 89% on average, and the total datasets contained less than 680,786 attacks. The honeypot infrastructure registered the number of malware hits; honeypot infrastructure was used as a test bed server; the number of attacks was 35% when the total data were not more than 80,462.

4.1. Malware Behavior in the Phishing Dataset

The eleven features that were examined to study the malware behavior of phishing websites are: having IP address, port, request URL, google index, submitting to email, web traffic, page rank, HTTP token, abnormal URL, pop-up window, and links pointing to a page. These features assist in discovering phishing websites. The total number of attributes (features) relating to the phishing dataset was 31 (see Figure 4); in the current study, only 11 features were selected based on [12,13,14]. Bagging (random tree) was used to compare the relevance of malware behavior in terms of accuracy between the three datasets. These features were chosen to distinguish websites as ‘phishy’, ‘suspicious or ‘legitimate’ based on Mohammad et al. [13]. If a result was returned as 1, 0 or −1, the website was labelled as legitimate, suspicious or phishy, respectively. In the current section, there are 11 features that were analyzed to study the phishing dataset; in each feature, the Y-axis shows the behavior of the feature as either legitimate, suspicious or phishy, while the X-axis shows the number of occurrences for each behavior. The features are as follows:
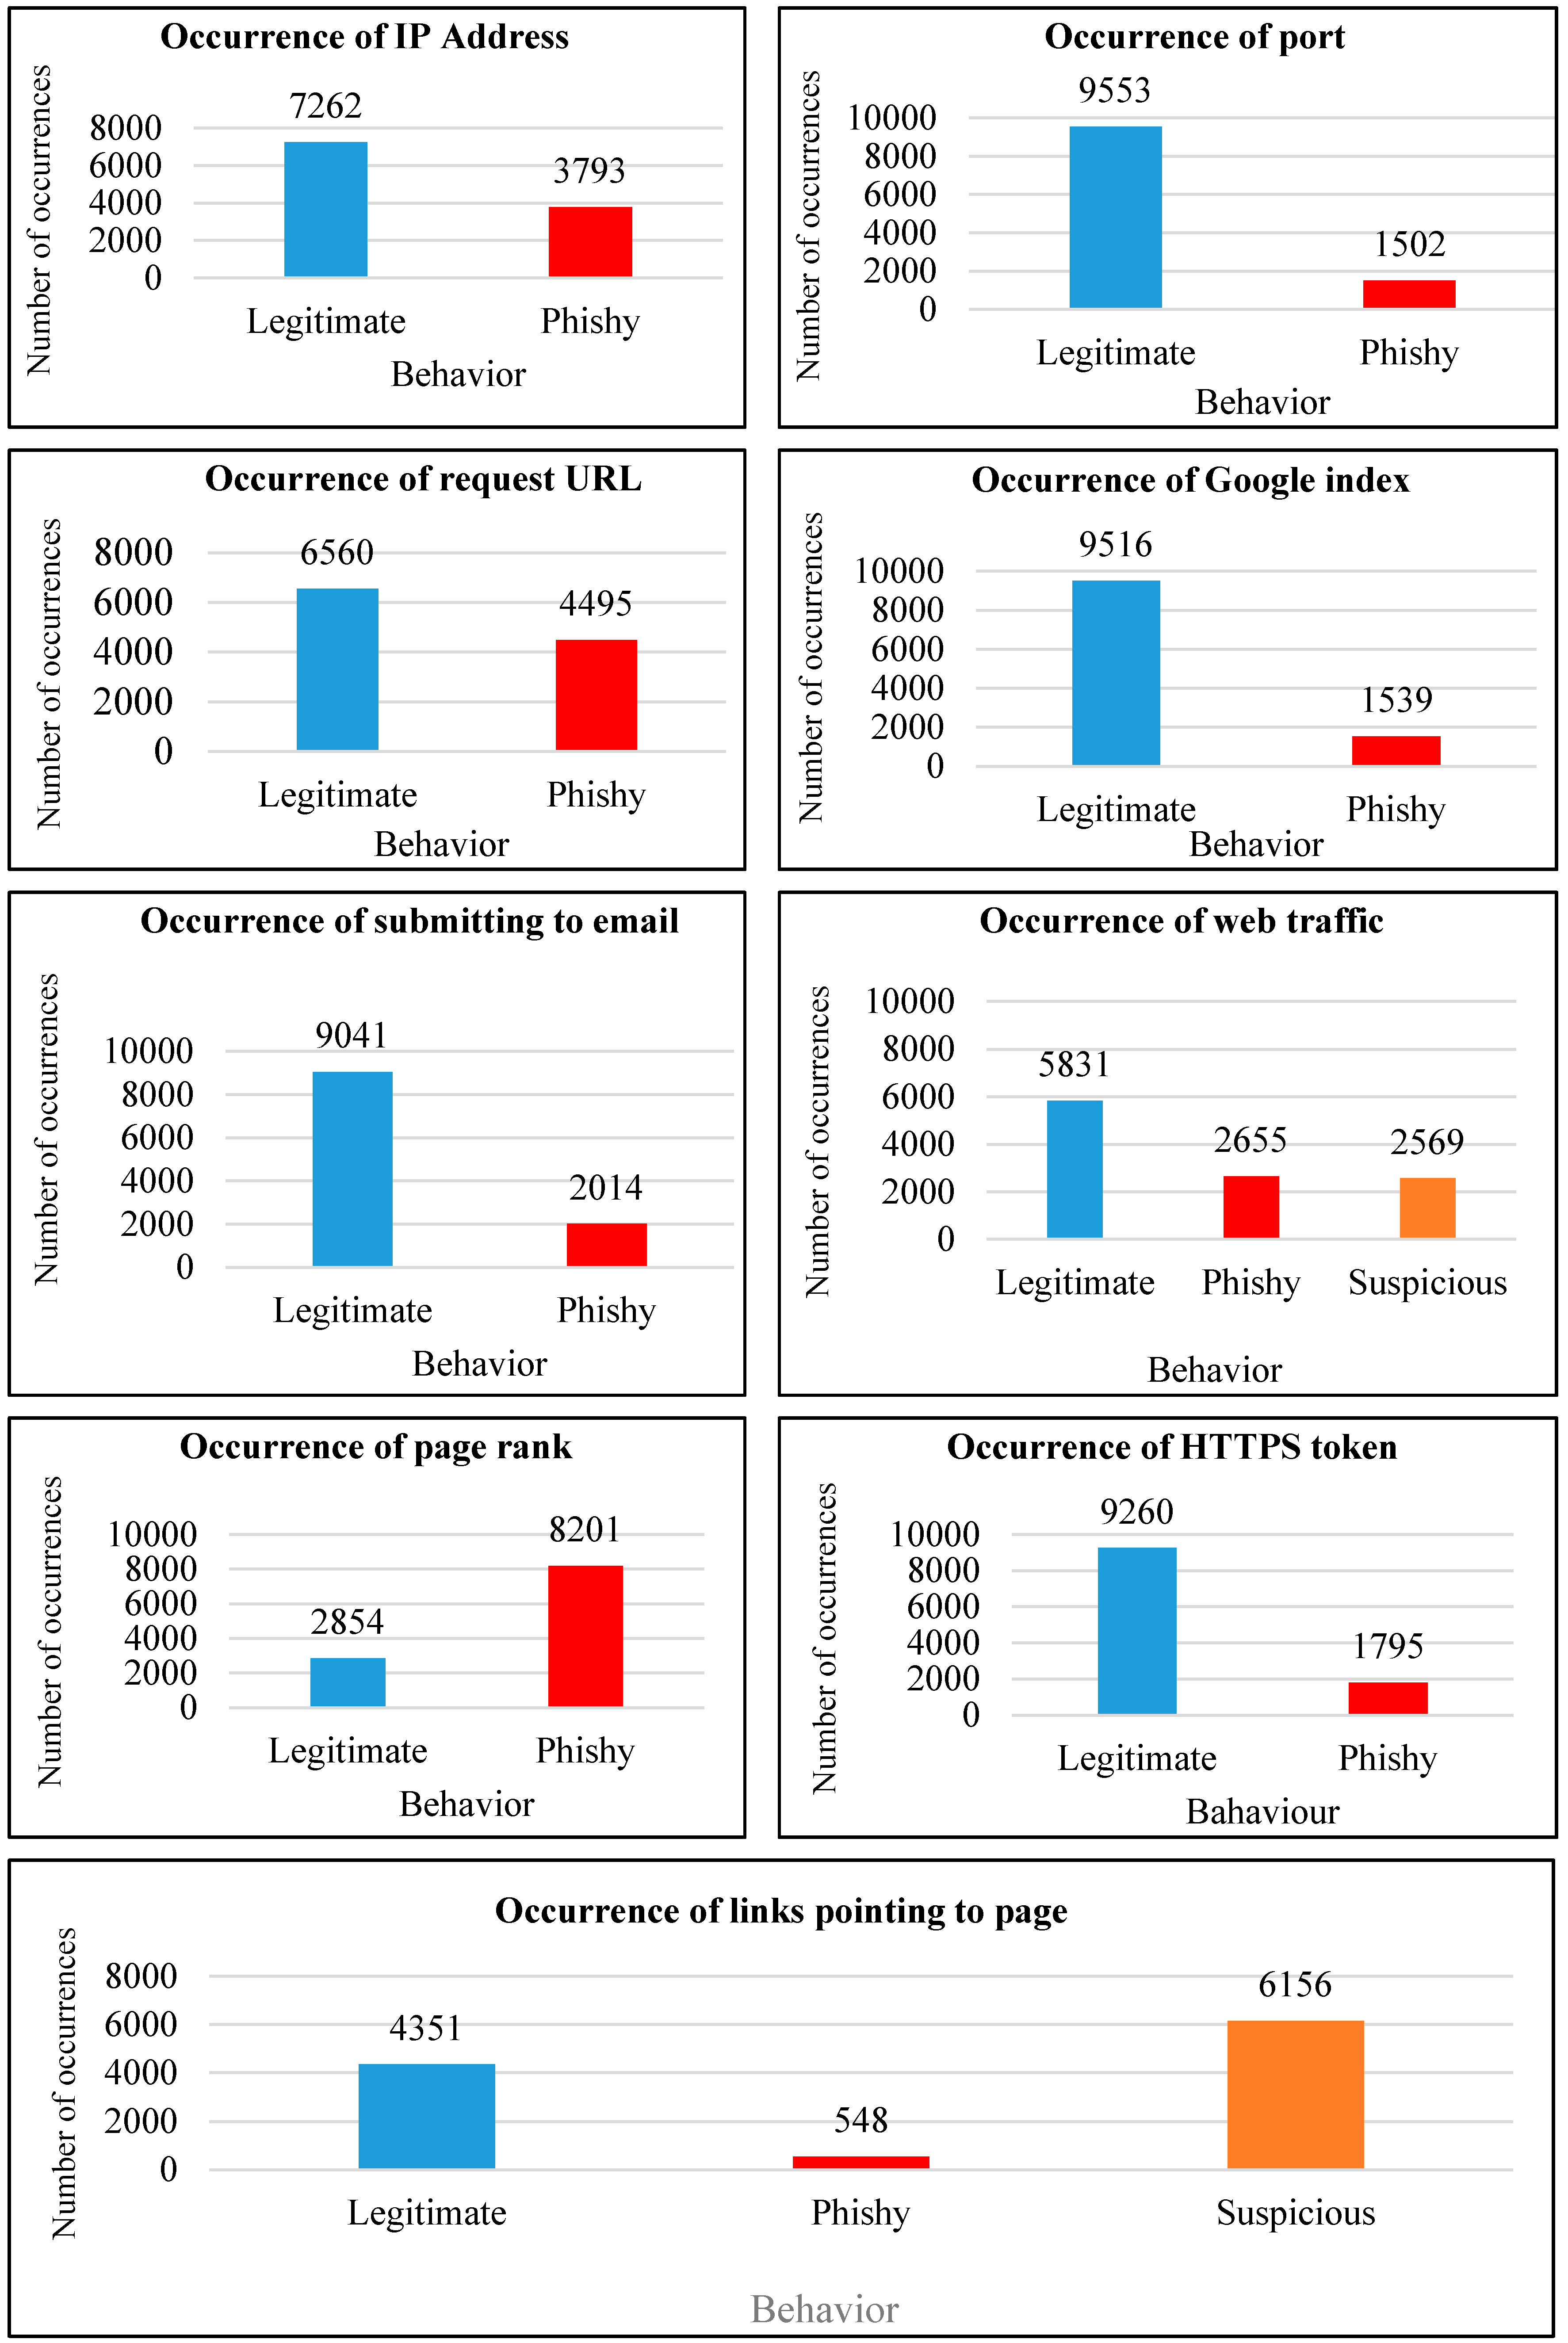
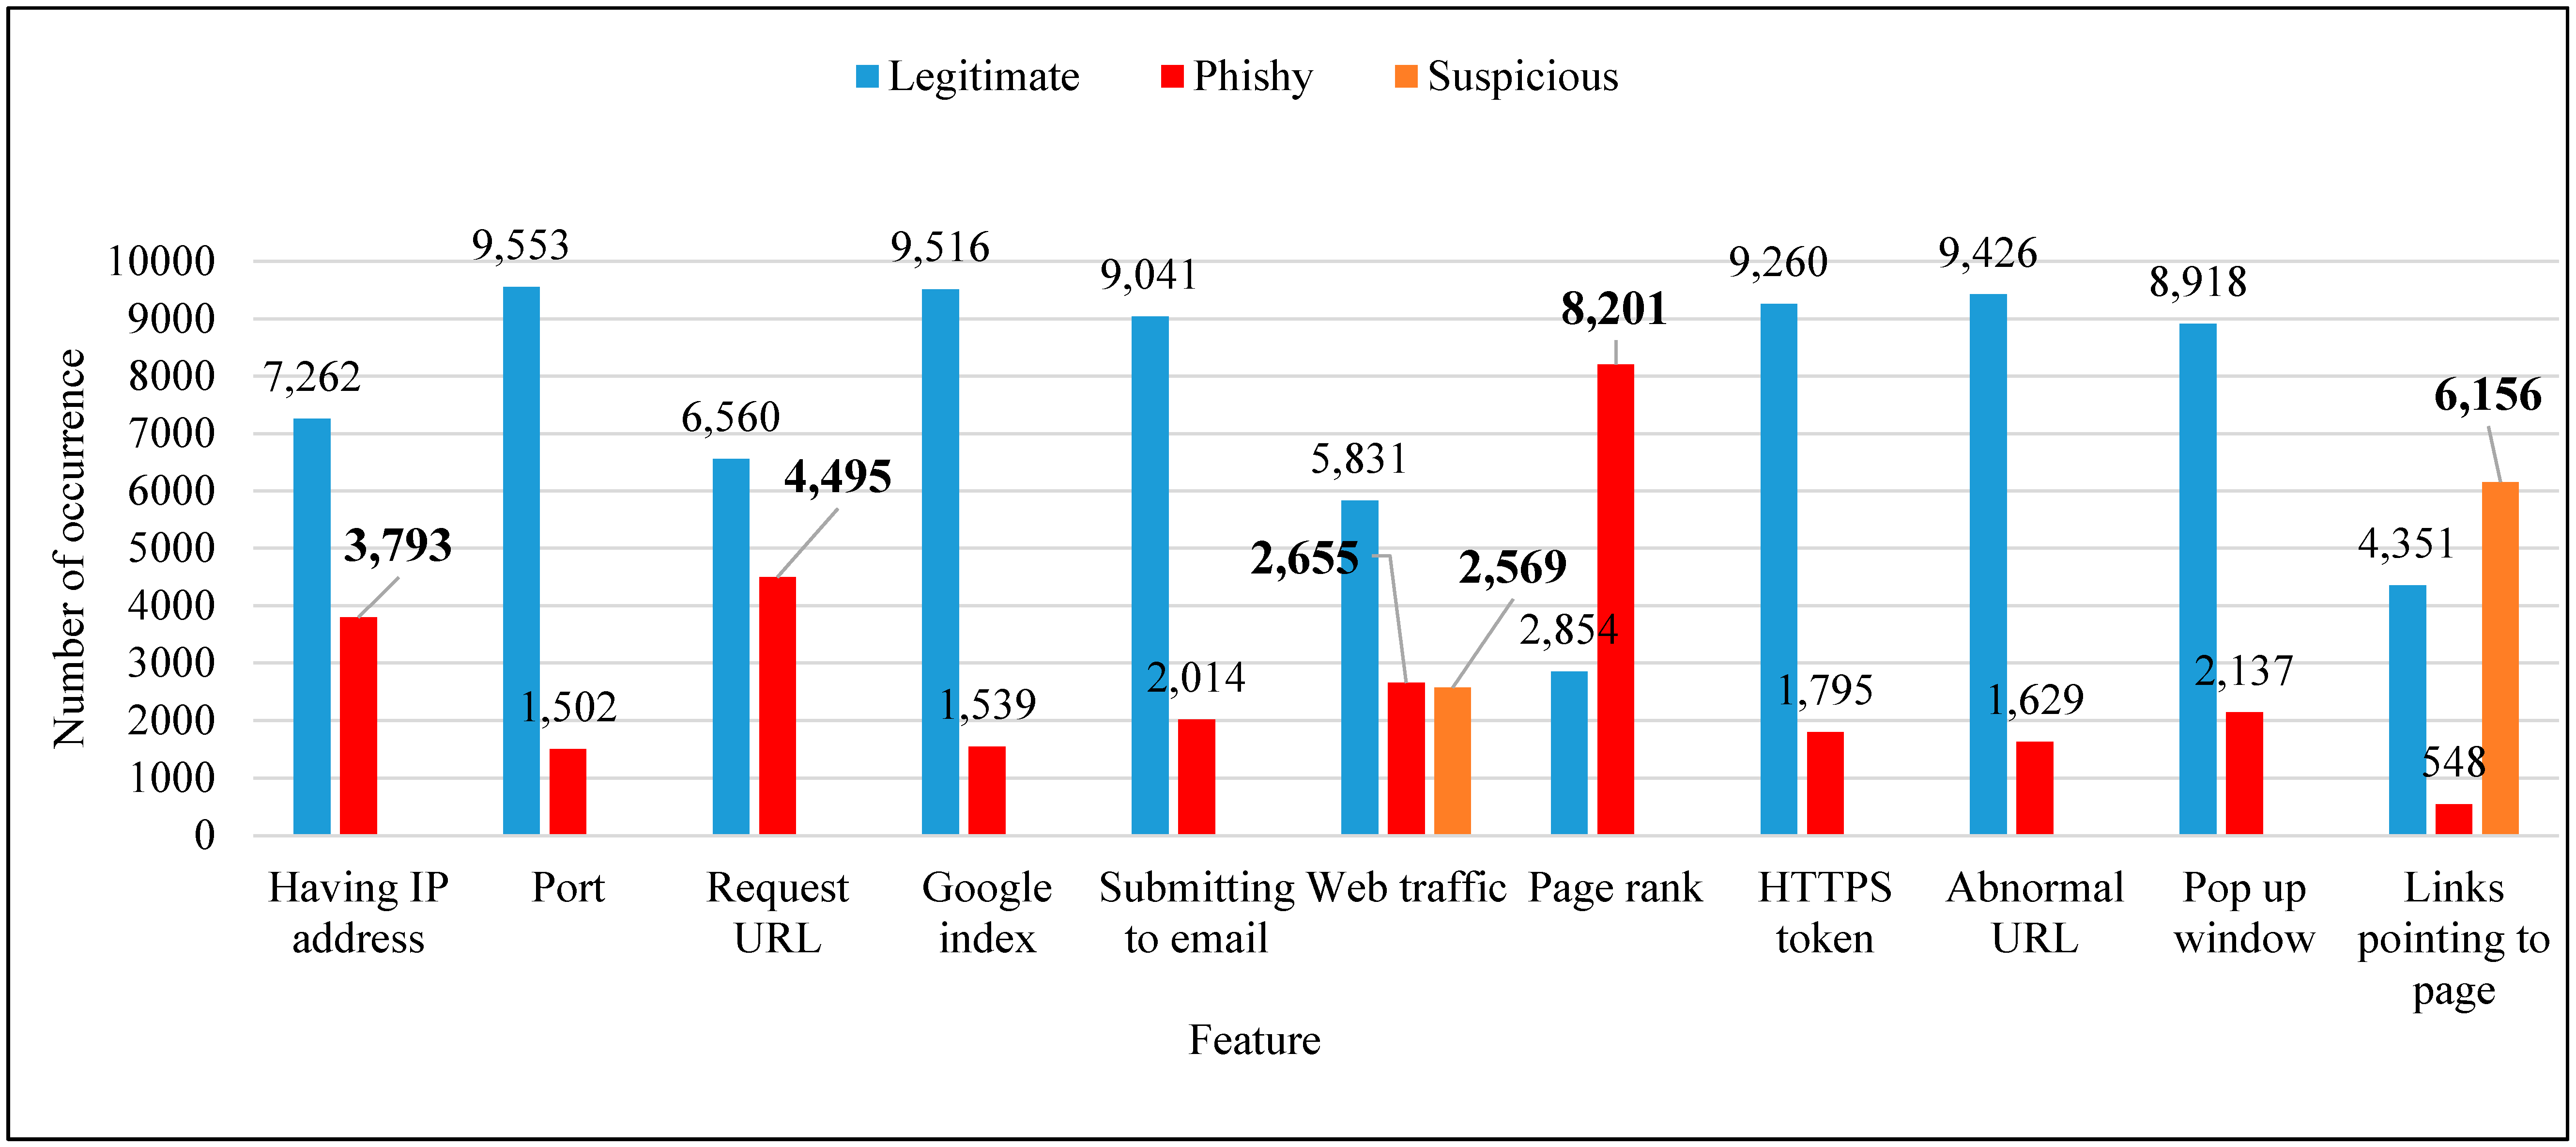
  • Having IP address: the nature of IP addresses is based on the URL—if the IP address exists in the URL instead of the domain name, this typically means there has been an attempt to hijack or steal personal information; otherwise, the webpage would be considered legitimate. In the phishing dataset, the results show that the number of URLs that did not have an IP address (or it was masked) was 7262 among the total behaviors, considered legitimate as they returned 1. Only 3793 URLs had an IP address and were classified as phishy, returning −1 as a result
  • Port: The number of malicious attacks through legitimate port browsing was 9553, but there were still 1502 cases of phishy behavior. In this case, if a port is compromised, all hosted IPs are affected. If the IP address is affected, then only specific webpages associated with that IP are affected, while the port remains safe. Malicious attacks on port are less common compared to IP address manipulation.
  • Request URL: Based on the previous two analyses, it may be concluded that malware occurrence through ports is relatively infrequent (1502 times) while ‘request URL’ has a strong influence on malware behavior, representing more than 40% of 11,055 web hits. In this study’s experiments, the results classified 6560 URLs as legitimate and 4495 as phishy.
  • Google index: Based on the previous three analyses, it is clear that the number of occurrences of malware attacks through Google index and through ports is nearly similar (37 more occurrences for Google index, which is the difference between them). In this study’s experiments, 9516 of the URLs were shown to be legitimate, while 1539 of the results were phishy.
  • Submitting to email: Malicious behavior using the feature ‘submitting to email’ led to more legitimate results (9041) than phishy (2014) (total number of hits—11,055). Compared with other features, such as having IP address and request URL, the number of phishy sites was lower, but it was higher than malicious attacks through ports.
  • Web traffic: The nature of this feature is based on the number of visitors to the webpage. In the phishing dataset, the number of webpages with malicious traffic was less than the number of legitimate webpages. The interesting finding in this feature was that suspicious never indicates whether it is legitimate or phishy. However, from this feature, the number of legitimate webpages for browsing was only 50% of the total number of hits (11,055), which provides a clue that malicious behavior may be closely related to web traffic.
  • Page rank: Compared with all other features in the phishing dataset, page rank provided the ability to discover the highest rate of phishy webpages, with 8201 hits, while Google index detected 1539. However, the legitimate webpages were low with 2854 hits, which was less than any other feature. This clearly shows that the higher ranked webpage may not be always safe as we think, while Google indexed pages are safer than ordinary pages ranked in web browsing.
  • HTTPS token: Similar to previous results, HTTPS token resulted in very similar rates (almost 9200) as legitimate webpage of features such as port, Google index and submitting to email. Turning to phishy results, these numbered 1795.
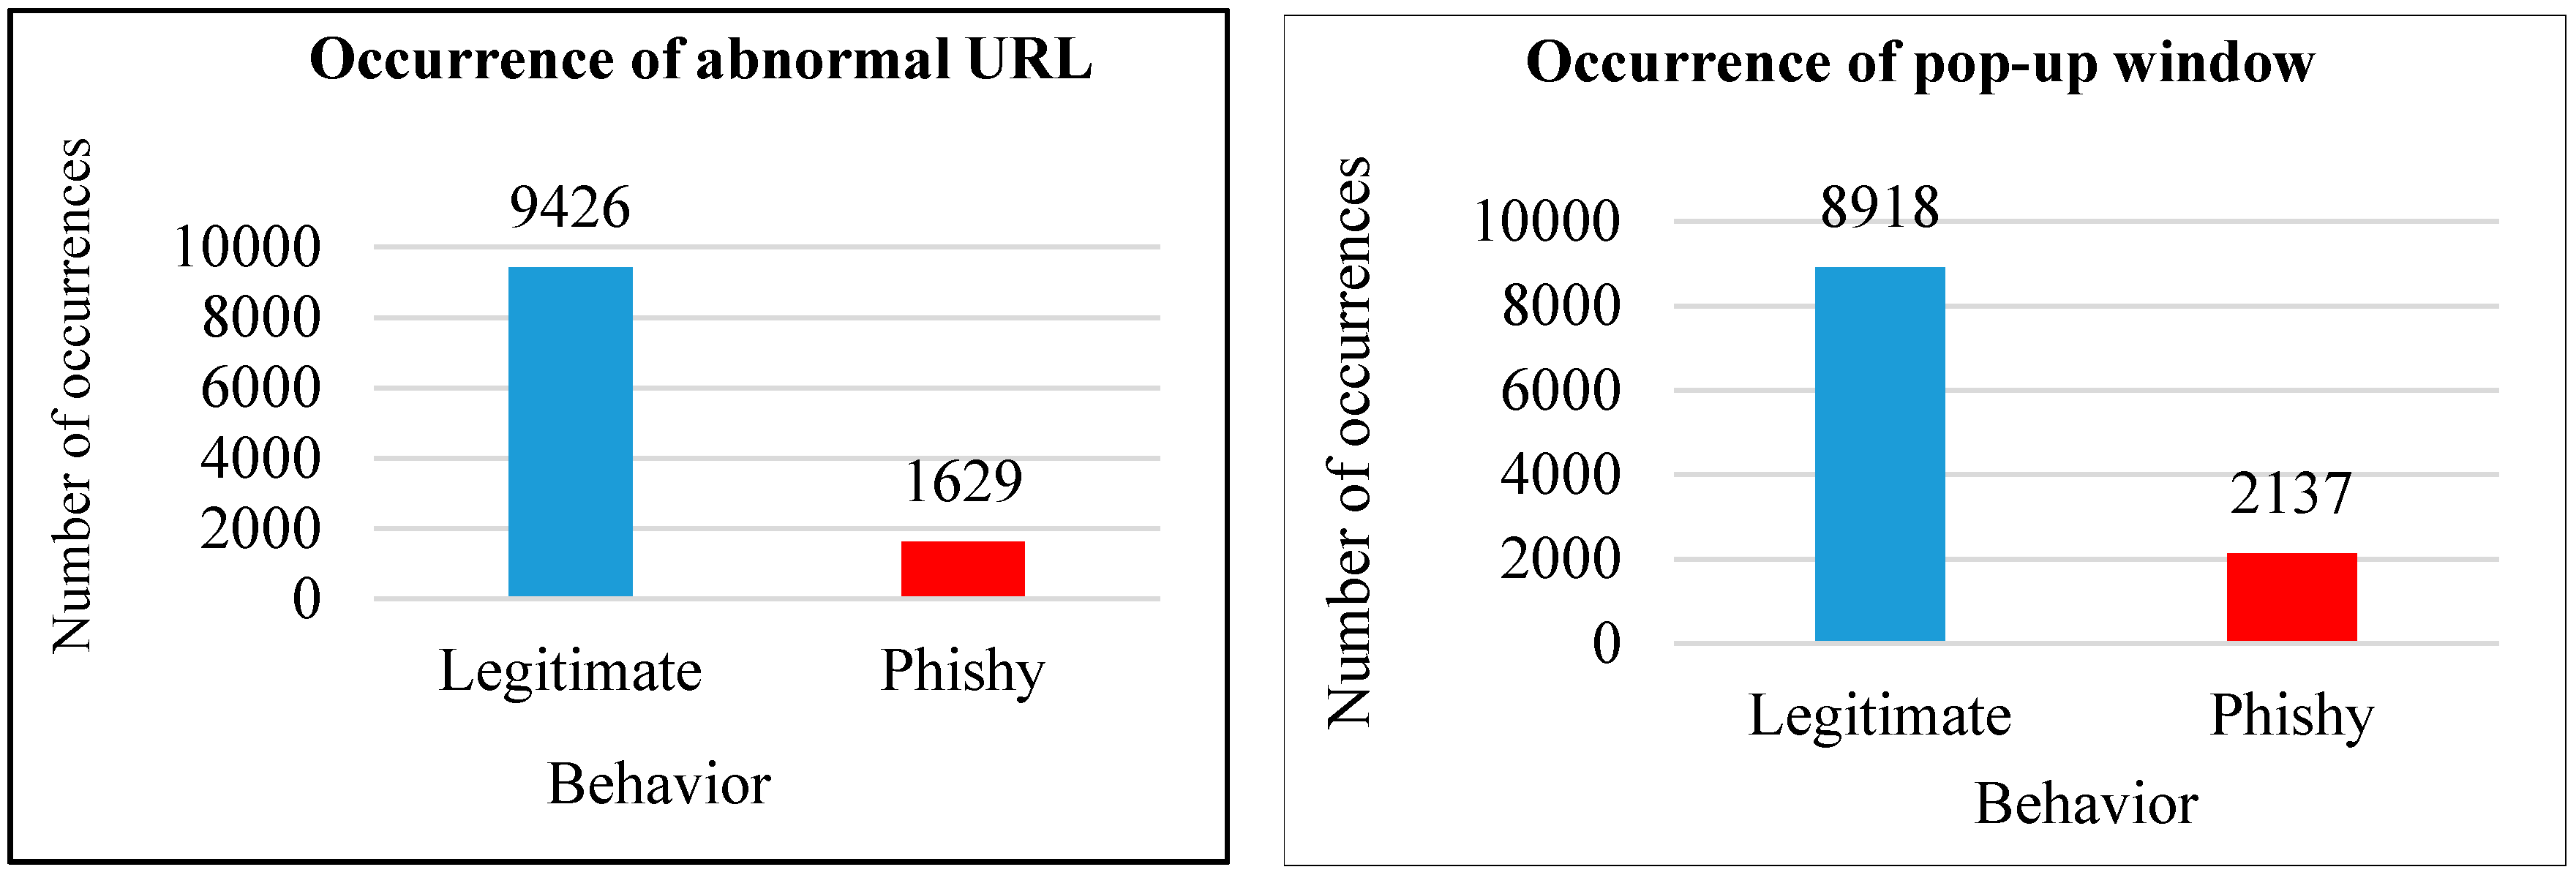
  • Abnormal URL: The nature of this feature is based on the identity of URL. If a URL included the host name, it was considered legitimate; otherwise, it was considered phishy. The number of abnormal URLs that were legitimate was 9426, which is one of the features that has a high number of occurrences compared to some previous features; thus, this is a strange result that requires further study. Only 1629 hits were phishy, which also needs further investigation; however, this study was limited to identifying the malware behavior of webpages.
  • Pop-up window: The function of pop-up windows in webpages is to ask users for some credentials. In the current data, 8918 webpages were found that did not use pop-up windows, which classified them as legitimate, whereas 2137 were phishy. Some pop-ups are based on adware, which is a next-generation malware, meaning that information regarding the suspiciousness of this feature was not present in this dataset.
  • Links pointing to page: This feature refers to links pointing to a specific URL (i.e., page or subpage). There were 4351 webpages classified as legitimate and only 548 as phishy, which was the lowest rate among all features. However, suspicious webpages recorded the highest rate for this feature (6156) compared to the web traffic feature, which had only 2569.

4.2. Malware Behavior in the Botnet Dataset

The second experiment involved findings for malware behavior with respect to botnet attacks (Gafgyt attacks) from the datasets of Danmini and Ecobee. Six features were examined about malware behavior in botnets, based on Meidan et al. [15]. The total number of attributes in each feature was 115 (Figure 5). The Weka tool was utilized to determine the accuracy of each feature using bagging with random tree, where random tree worked as a base classifier for bagging.
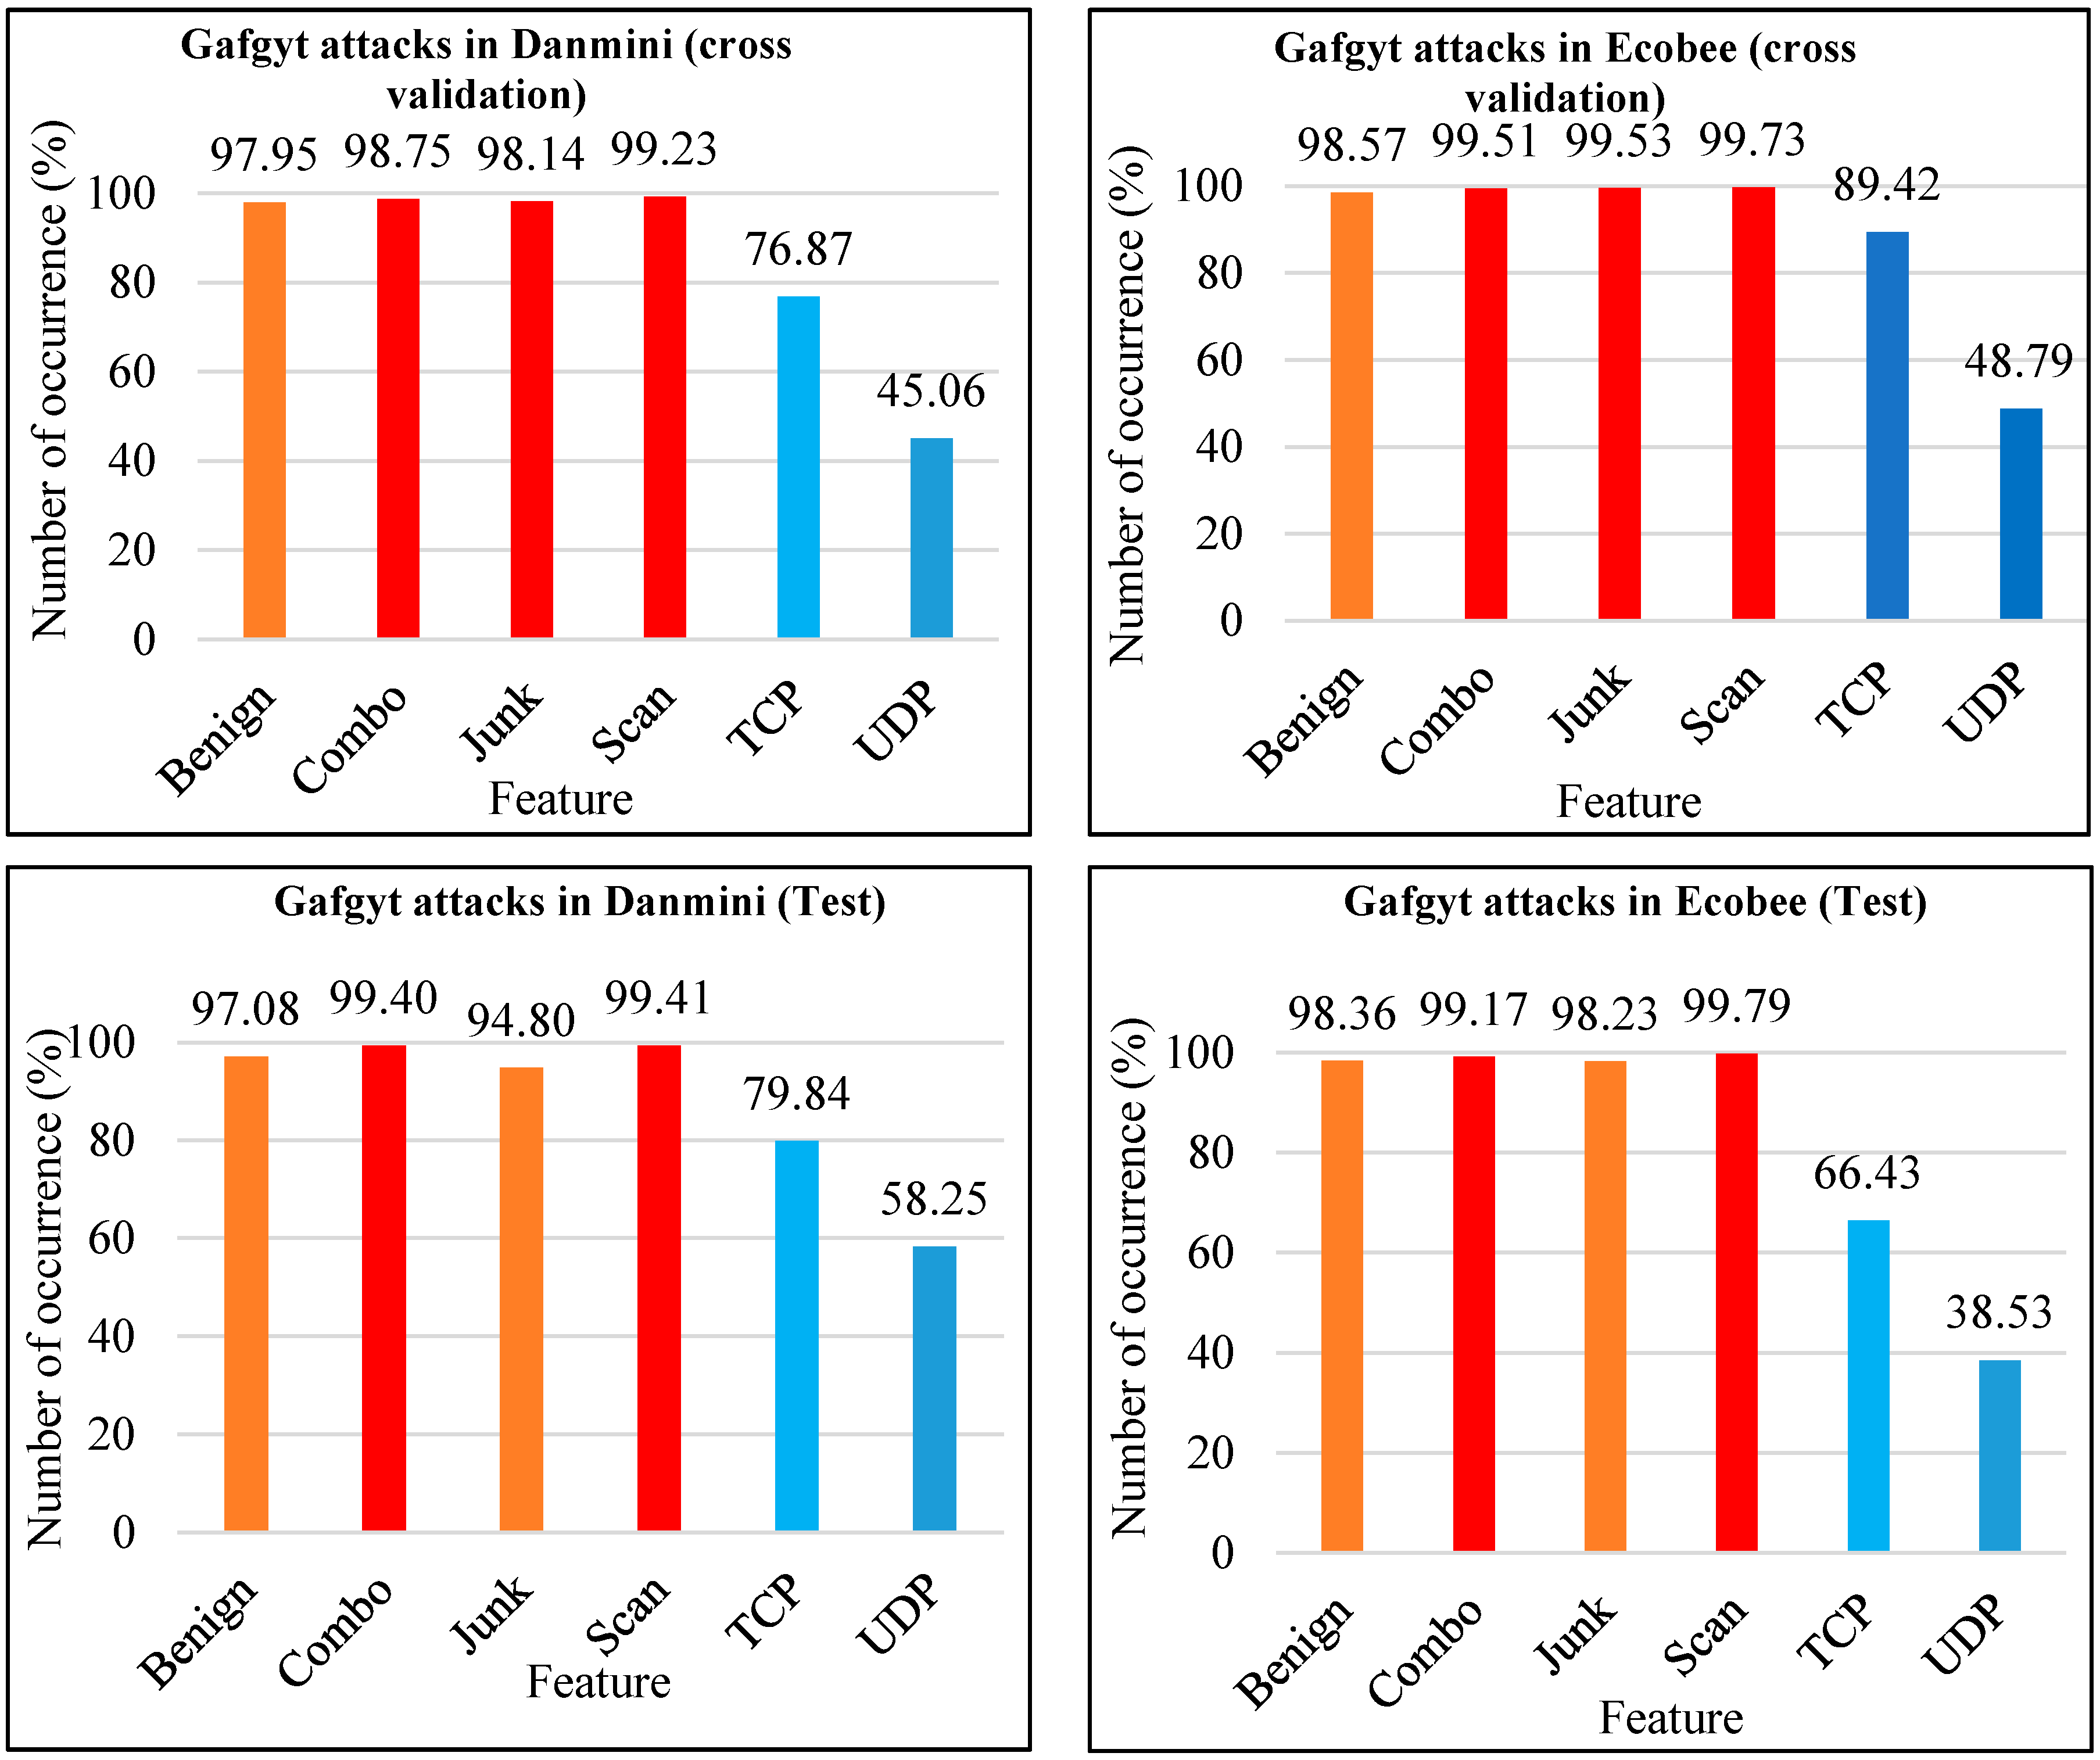
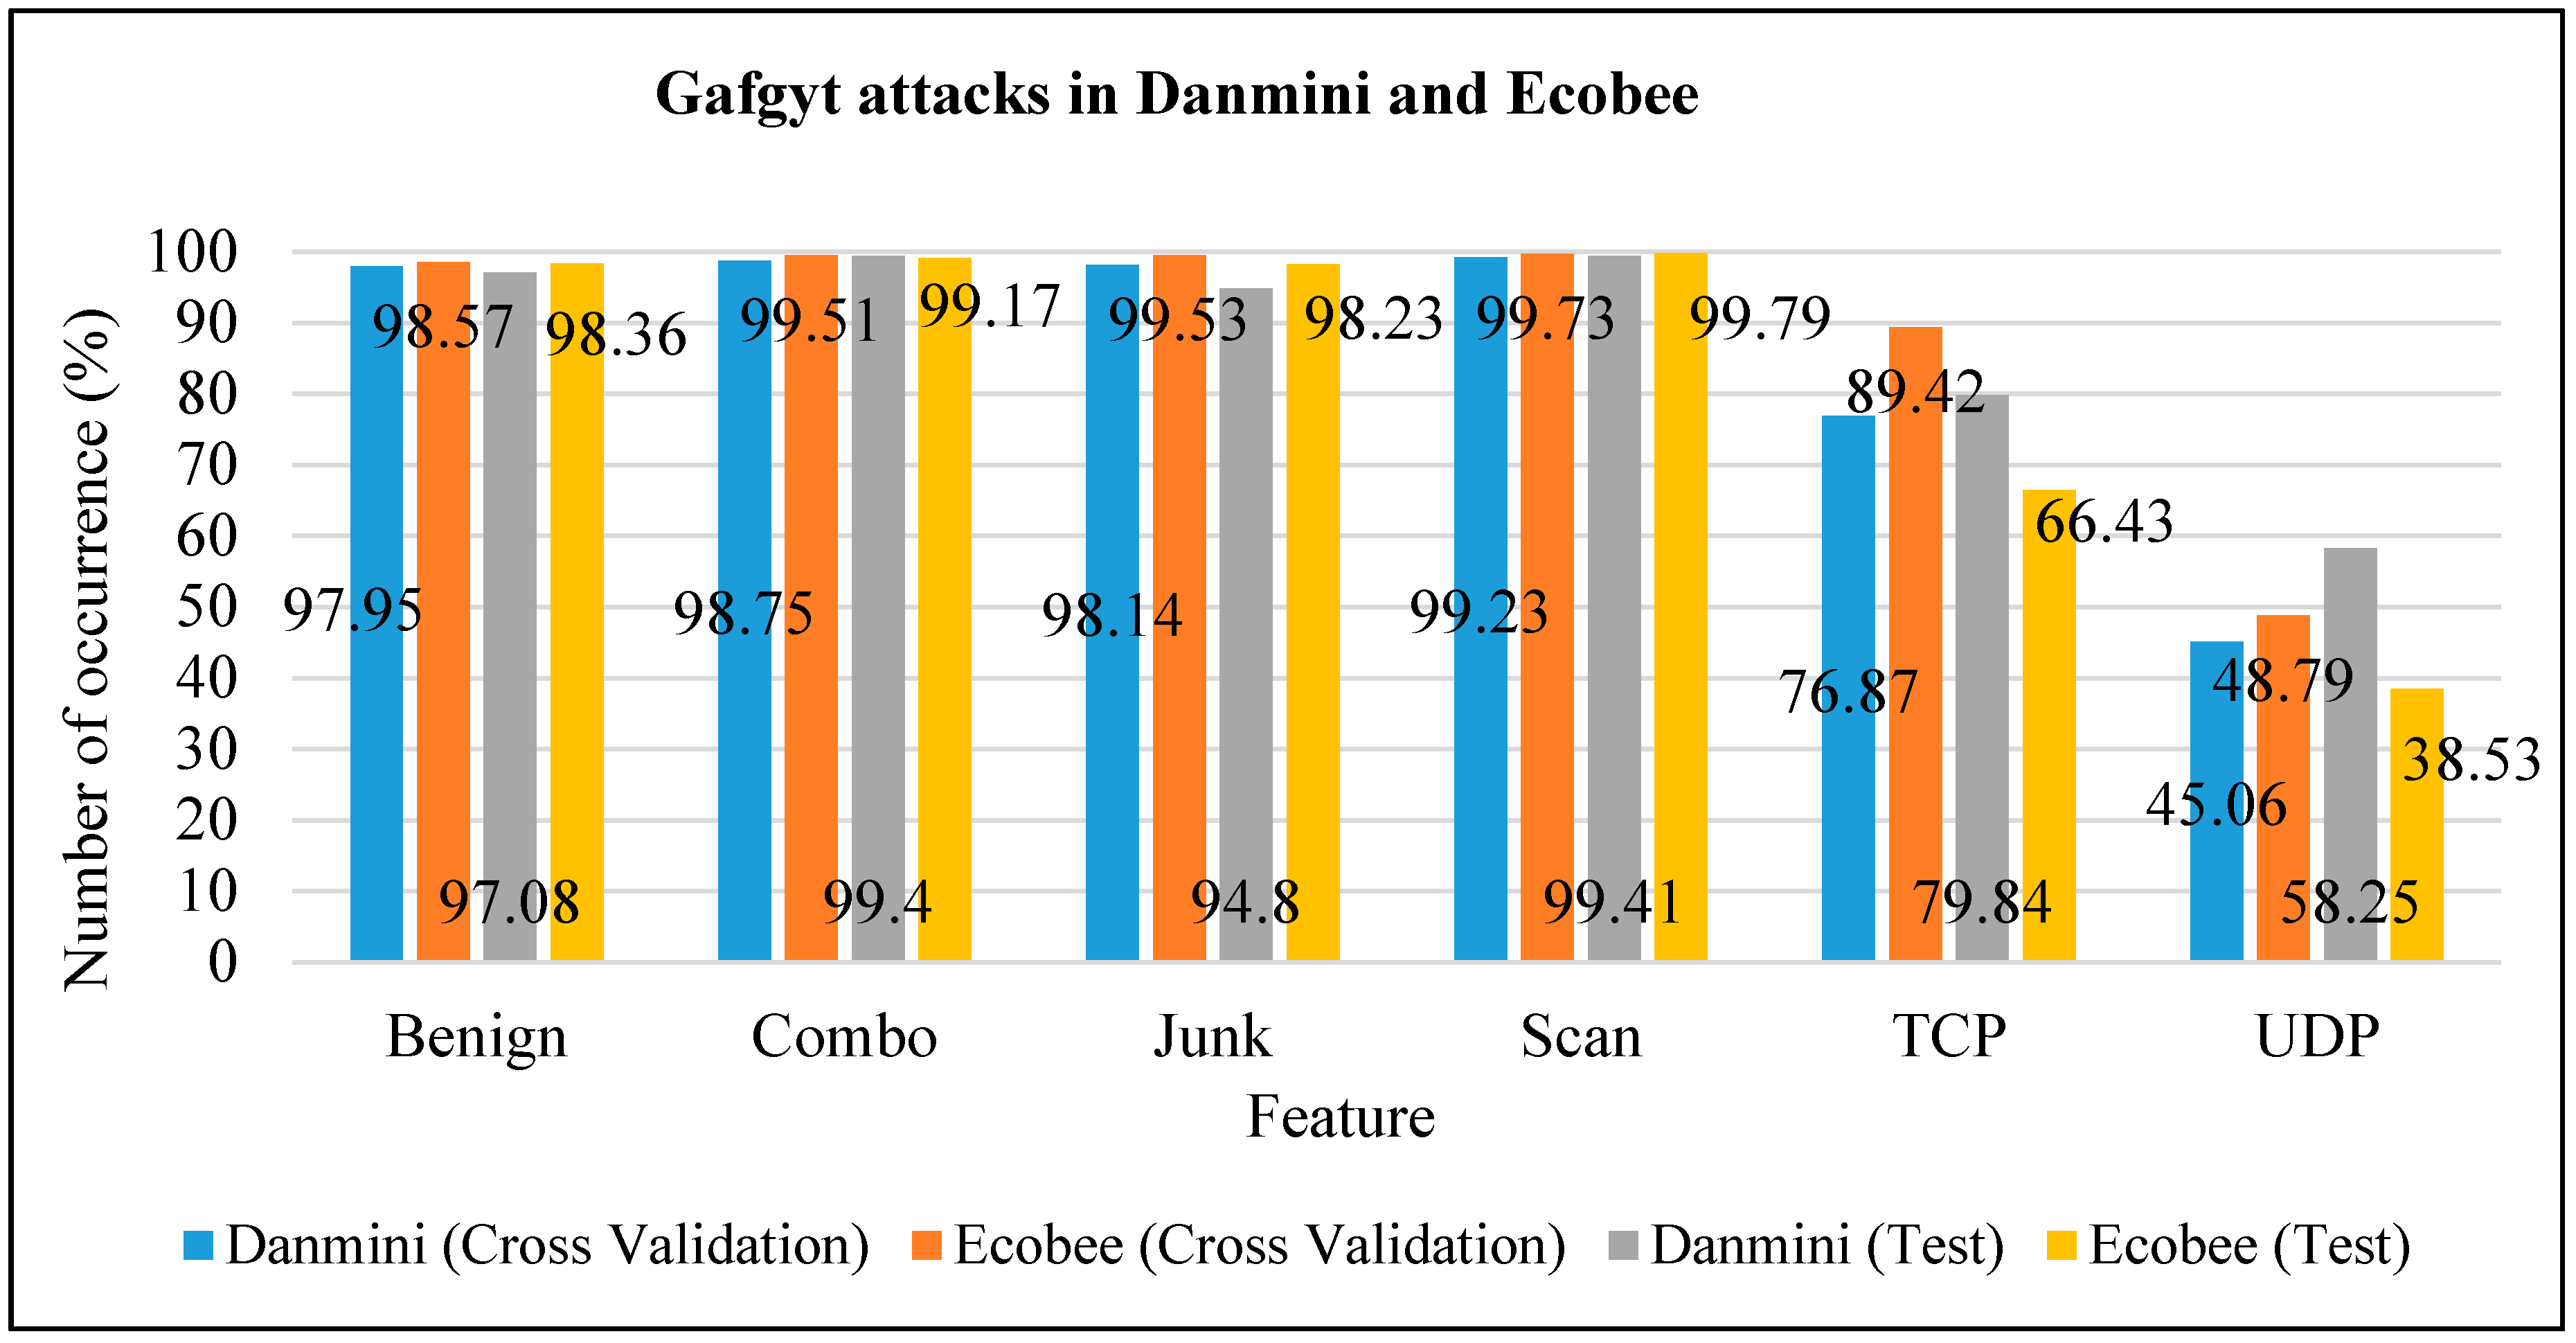
  • Gafgyt attacks in Danmini (10-fold cross-validation analysis): The scan feature had the highest number of occurrences (99.23%) compared with other features; it had slightly more than combo and junk, which had 98.75% and 98.14%, respectively. Malware occurrence through benign was less than the scan feature, with a difference of around 2%. With regard to the TCP feature, it was less than benign, with almost 77%. UDP was much lower than all the other features, with only around 45%.
  • Gafgyt attacks in Ecobee (10-fold cross-validation analysis): With Ecobee, the feature results for attacks were similar to those in Danmini, with only minor differences. The highest three rates of occurrence were in scan, junk and combo, with 99.73%, 99.53% and 99.51%, respectively. While benign in Ecobee is more frequent than in Danmini, the difference was only 1%. The TCP rate in Ecobee was higher than that in Danmini, at around 89%. UDP remained the lowest rate, as seen in Danmini.
  • Gafgyt attacks in Danmini (test analysis): The scan feature had the highest rate among all features, which was more than combo and benign, that had 99.40%, and 97.08%, respectively. It is clear that malware occurrence through combo was slightly similar to scan feature, with a slight difference of only 0.01%. With regard to the TCP feature, it was less frequent than junk with around 80%. UDP was much less frequent than all previous features, with only around 58%.
  • Gafgyt attacks in Ecobee (test analysis): With Ecobee, the feature results for attacks were similar to those in Danmini, with only minor differences. The highest rates were for scan and combo: 99.79% and 99.17%, respectively; benign in Ecobee was more frequent than that in Danmini, but with a difference of only 1%. Malware occurrence through junk was slightly similar to that through the benign feature, with a small difference of only around 0.13%. The TCP rate in Ecobee was less than that of reported in Danmini, at around 66%. UDP was again the lowest rate, as in Danmini.
Based on the previous analysis, cross-validation and test provided similar results, with test being lower for all features with the exception of scan, which had a slightly higher value than cross-validation. Since the difference was less than 1% the scan feature remained an important feature to identify malware behavior.

4.3. Malware Behavior in the Honeypot Dataset

This section presents the findings obtained from three honeypot sensors: Snort, Kippo and Glastopf. The web server geolocation was in Japan (Tokyo), and operated for a period of several months from 17 October 2017 to 29 February 2018 from New Zealand (the study location). Throughout this period, the server derived around 80,462 hits of malware activities. Snort examines the most attacked ports and protocols. The samples from Snort were taken from 17 October 2017 to 25 February 2018. The port and protocols were examined in Snort as follows.
  • Port: At the beginning of the period, the examined ports in Snort were 5060, which was the most significant port receiving attacks and port 1433, which was the largest segment from November 2017 to January 2018. Port 23 was used by attackers for remote access for the purposes of secret espionage or to damage the system. It was targeted 20 times in October 2017, but target rates declined over the subsequent three months (2 hits in total), and then, increased again to 2 hits in February 2018. Another result of note was in relation to port 22, which is used for remote login; also, some Trojans use this port if there is any vulnerability. In October 2017, port 22 received 41 attacks; this figure rose to 53 attacks in November 2017. It is apparent from the pie charts that attacks reduced significantly to 2 hits and 1 hit, in December 2017 and January 2018, respectively. At the end of the period, in February 2018, the number of attacks rose to 22 hits for the month. In summary, the results show that all the ports discussed in this section experienced a decrease in number of attacks in December 2017 and January 2018 by 50, 84, 18, 51 hits, in ports 5060, 1433, 23, 22, respectively. The number of attacks then rose again in February 2018.
  • Protocol: The attack rates on the TCP showed a steady but significant rise over the period from October 2017 to November 2017, while the number of attacks on UDP experienced a downward trend from October 2017 to December 2017. There was no evidence of ICMP attack throughout the period, except in November 2017. The TCP experienced a reduction in the number of attacks by 256 and 270 hits in December 2017 and January 2018, respectively. The UDP also experienced a reduction in the number of attacks by 110 and 109 hits in December 2017 and January 2018, respectively; it then experienced an increased trend in February 2018. In October 2017, the number of attacks on the TCP and UDP were 257 and 172, respectively. The TCP attack rate increased to 303 hits during November 2017, but the UDP rate decreased to 114 hits in that month. Both December 2017 and January 2018 experienced a sharp decrease down to 33 hits for the TCP and 5 hits for the UDP. At the end of the period, the TCP and UDP rates showed a gradual increase and reached 185 hits and 234 hits, respectively. ICMP protocol registered only 12 hits, and that was in November 2017.
  • Kippo examines the top passwords, usernames, and it was used to study the behavior of the top attackers.
  • Top passwords: These show the rate of use of the most common passwords employed by attackers in unauthorized access attempts. Overall, hackers aimed to obtain privileges to login to a victim’s machine by using the brute force method. This technique works by using a random group of passwords. Usually, this approach can achieve access if system administrators use default or weak passwords. The most used (660 attempts) password attempt was ‘123456’, while the least used was ‘qwerty’, with 164 attempts.
  • Top usernames: This provides a summary of the top 10 usernames employed by adversaries attempting to gain access to a vulnerable server. The most substantial rate (3000 times) of username attempts was for ‘root’, while ‘test’ had the lowest rate (102 attempts).
  • Top usernames/passwords: This section shows that Kippo did a good job of revealing brute force attacks by attackers and reporting hacking attempts; it shows that the most common combination of usernames/passwords used by attackers was ‘admin: admin’, which was employed 99 times. The combinations ‘admin:1111’, ‘root:1234’ and ‘admin:1234’ were used in only 63 attempts by attackers.
  • Top attackers:Table 3 shows the top 10 attacker IP addresses detected by the Kippo honeypot, and the frequencies of those attacks.
Glastopf Events: The data classification presented in this section is based on IP addresses, including ports and incoming URLs. The attacks were registered over a period of 10 days from 7–16 November 2017. This section covers only the top attackers, who targeted Port 80: protocol http with their activities.
IP: 45.77.149.77, IP: 94.177.237.15, IP: 121.130.202.67, IP: 211.110.139.158, IP: 77.81.229.93.

5. Discussion

This section discusses the analysis and research findings presented in Section 4.

5.1. Malware Behavior in the Phishing Dataset

To summarize, an interesting finding and important information about Google index (higher rank in Google search) was found. Having real-life experience of using McAfee web adviser [43], it is already in the Google index, and consequently, it is legitimate and safe to browse, as Google is the overwhelming leader in the world [44]. Many website rankings or page ranks, for example, Alexa, are very high because of their content and browsing frequency [45]. Every website has a ranking; it is based on the search term, and keywords that is mostly used by SEO (search engine optimization). In addition, the content that attracts more users will make the site with top page rank. Websites that have prohibited videos organized or hidden very well and more visitors are given very high page ranks. In fact, such sites have more malware content than others. In the phishing dataset, the number of occurrences of phishy behavior that detected for page rank feature was 8201, which was around 74% accuracy. Thus, the findings from this research include that more phishy behavior may be identified in websites that with high page ranks. In summary, Google indexed websites are safer to browse, as only 1539 (13%) were associated with phishy behavior, out of 11,055, which is the total number of phishing dataset. Figure 6 shows that all features recorded high rates in regard to legitimate webpages, but phishy webpages had higher page ranks than legitimate ones. The results in Figure 6 suggest that having an IP address, an average amount of web traffic and a high page rank (randomly selected features) are not reliable key features to consider a website legitimate. When the Google index is high, this means sites are reliable on average, as it is only phishy 1539 times (13%) detected out of 11,055, while average phishy behavior is nearly 43% when combining the features having IP address, request URL, web traffic and page rank. Not all features in the phishing dataset provided information about suspiciousness. However, suspiciousness was noted in the following features: web traffic (23%) and links pointing to page (55%). The number of suspicious behaviors in web traffic was 2569 and 6156 in links pointing to page. The findings of this study are valid, as a prohibited website has a valid IP, high page ranking, many request URLs, and links pointing to that site without very high Google indexes. However, Google is still on the top rank because of search engine optimization (SEO) tools and techniques [46]. The main objective of SEO is to attract people to a specific and required site with good and attracted contents; so, more visitors to the site leads to more Google notices, leading to a higher rank in the Google index [44]. In addition, a prohibited site mostly contains various links to point to similar type of pages that may be phishy. Considering a website is reliable based on page ranking is not advisable because highly ranked websites had the highest occurrence of phishy behavior in the dataset (8201 hits). Another interesting point to note is that having an IP address does not guarantee that a website is reliable because the frequency of phishy behavior was almost 34% accuracy (3793/11,055). Therefore, links pointing to a website may not be valid, as they were phishy at around 5% accuracy (548/11055) and were not free from being suspicious at 55% accuracy (6156/11055). The number of abnormal URL that were legitimate was 9426, which is one of the features that has a high number of occurrences compared to some previous features; thus, this is a strange result that requires further study. Only 1629 hits were phishy, which also needs further investigation.

5.2. Malware Behavior in the Botnet Dataset

All features were equally important for identifying malicious behavior as all scored more than 97%, with the exception of TCP and UDP. The malware behavior in the botnet dataset indicated that the scan feature obtained the highest percentage of accuracy, at around 99% in both Danmini and Ecobee. Interestingly, Figure 7 shows that there is little difference in the test and cross-validation results between the features benign, combo and scan for Danmini and Ecobee. This clearly verifies that these features are equally important to identify malware behavior. However, the features junk, TCP and UDP showed huge differences in test result for Danmini and Ecobee. This finding shows that TCP and UDP attack is less than all other features. Thus, future malware prevention platforms may require less focus on the features junk, TCP and UDP. Junk is no longer a great threat as most users are aware of it and are careful when opening junk email. Experimental results from Kheir et al. [47] relating to some botnet domain blacklists showed that the system called ‘Mentor’ is capable of accurately identifying legitimate domain names with low error rates.

5.3. Malware Behavior in the Honeypot Dataset

All the datasets describe that malware behavior is closely influenced by type of IP, URL and other features. However, phishing and botnet datasets did not include the effect of username and password in a website. Hence, the honeypot infrastructure was applied to identify the effect of username and password in relation to malware attacks. The honeypot dataset revealed the username (admin) and password (admin 123) that are the most prone to malware attacks. The honeypot dataset also revealed malware attacks on IP port, URL and protocols, in line with the other two datasets. In the Glastopf results presented in Section 4.3 the attacker’s purpose may have been to execute an SQLI against the web server; the attacker used personal homepage (PHP) language to generate the script, as it was mainly focused on server-side scripting. If a web designer does not securely code the interaction between the website and the SQL database, attackers can take advantage of this mistake to sneak unexpected SQL queries onto the database server.

6. Recommendations and Future Work

We first highlight two recommendations that add scientific rigor to the identification of future malware, and then, describe two avenues for future work. The two recommendations are as follows:
(i)
Identify malware behavior in web pages: Generally speaking, webpages ranked in the Google index are less prone to malicious behavior; malicious attack through ports is very infrequent. Our findings reported in this paper suggest that if a port is secured and the site is Google indexed, malicious attack from websites can be minimized. Thus, it is recommended that website providers and vendors should identify malware behavior in web pages on a regular basis to make web browsing safe and reliable.
(ii)
Analyze malicious behavior of attackers: It is important for vendors such as antivirus providers to analyze the main risky features of malicious behavior on a regular basis in order to identify attackers against webpages. Build appropriate rules and guidelines to avoid them and secure end users over the internet.
Future work on malware identification should proceed along with two avenues. First, it is useful to be able to use machine-learning algorithms such as neural networks. This requires a thorough evaluation and experimentation of each system. Second, a common IoT botnet attack called Mirai was also within the botnet dataset. An in-depth study on Mirai attacks would be useful to understand and identify more features. Therefore, more analysis of IoT devices such as Ennio—that has also Gafgyt attacks—would improve the ability to identify even more webpages attacks.

7. Conclusions

In this paper, we studied the malware behavior of webpages. The main motivation was the growing demand for information on feature selection in malware data to identify malware behavior and to learn about the features that affect webpages. To achieve this goal, the ensemble method was used for data analysis in combination with the random tree as a classifier model. Several benefits were obtained by employing this combination. Empirical results obtained show that all features in the botnet dataset are equally important to identify the malicious behavior (all scored more than 97%), with the exception of TCP and UDP. We found that the accuracy of phishing and botnet datasets is more than 89% on average in both cross validation and test analysis. We selected bagging (bootstrap aggregation) algorithm for use. The study estimated and compared selected features such as IP, port, URL, email, TCP, and UDP from the three datasets used and these comparisons provided interesting and useful results to identify malware behavior.

Author Contributions

We are writing to confirm with you that the work presented in this paper is an original contribution. A.F.A. and N.I.S. conceived of the presented idea. N.I.S. verified the analytical methods and supervised the findings of this work. A.F.A. wrote the manuscript with support from N.I.S. All authors discussed the results and contributed to the final manuscript. A.F.A. and N.I.S. designed the methodology. A.F.A. worked out the technical details with support from N.I.S., A.F.A. and N.I.S. carried out the experiment. A.F.A. collected the data and N.I.S. contributed to sample preparation. A.F.A. and N.I.S. analyzed the data. A.F.A. presented the published work and N.I.S. reviewed and edited the published work. A.F.A. proposed the study materials in discussion with N.I.S., A.F.A. and N.I.S. processed the management and coordination responsibility for the research activity planning and execution. N.I.S. supervised the research. The research was supported by Aljouf University’s scholarship. We identified the most targeted features of malware attack in three datasets namely, phishing, botnet and honeypot using a machine learning technique. The most vulnerable features that are common to these three datasets are identified. We also identified legitimate, phishy, and suspicious behavior in these features. We compared maliciousness in two available datasets and applications to identify maliciousness in custom-built honeypot infrastructure. The difference between Google index and page rank in identifying malware behavior is discussed, which is a significant achievement of this research along with identification of malware behavior on webpages. We provide three recommendations for best practices that add scientific rigor to the identification of future malware. All authors have read and agreed to the published version of the manuscript.

Funding

This research was supported by Aljouf University’s scholarship and Saudi Culture Mission in New Zealand.

Acknowledgments

This work was support in part through Aljouf University’s scholarship. The support from Saudi Cultural Mission in New Zealand is greatly acknowledged.

Conflicts of Interest

The authors declare no conflict of interest.

References

  1. Rieck, K.; Trinius, P.; Willems, C.; Holz, T. Automatic analysis of malware behavior using machine learning. J. Comput. Secur. 2011, 19, 639–668. [Google Scholar] [CrossRef]
  2. Symantic. Internet Security Threat Report; Thycotic: Waterloo, Belgium, 2017. [Google Scholar]
  3. AV-TEST. Security Report 2017/18: The Independent IT-Security Institute; AV-TEST: Magdeburg, Germany, 2018. [Google Scholar]
  4. Yousaf, S.; Iqbal, U.; Farooqi, S.; Ahmad, R.; Shafiq, Z.; Zaffar, F. Malware slums: Measurement and analysis of malware on traffic exchanges. In Proceedings of the 2016 46th Annual IEEE/IFIP International Conference on Dependable Systems and Networks (DSN), Toulouse, France, 28 June–1 July 2016. [Google Scholar]
  5. Ranjith, G.; Vijayachandra, J.; Prathusha, B.; Sagarika, P. Design and implementation of a defense system from TCP injection attacks. Indian J. Sci. Technol. 2016, 9, 40. [Google Scholar] [CrossRef] [Green Version]
  6. Canali, D.; Balzarotti, D.; Francillon, A. The role of web hosting providers in detecting compromised websites. In Proceedings of the 22nd International Conference on World Wide Web, Rio de Janeiro, Brazil, 13–17 May 2013; pp. 177–188. [Google Scholar]
  7. Ceccato, M.; Tonella, P.; Basile, C.; Coppens, B.; De Sutter, B.; Falcarin, P.; Torchiano, M. How professional hackers understand protected code while performing attack tasks. In Proceedings of the 2017 IEEE/ACM 25th International Conference on Program Comprehension (ICPC), Buenos Aires, Argentina, 22–23 May 2017; pp. 154–164. [Google Scholar]
  8. Batten, L.; Li, G. Applications and Techniques in Information Security. In Proceedings of the 6th International Conference (ATIS), Cairns, QLD, Australia, 26–28 October 2016; Springer: Berlin/Heidelberg, Germany, 2016. [Google Scholar]
  9. McAfee. McAfee Labs Threats Report; McAfee: Santa Clara, CA, USA, 2018. [Google Scholar]
  10. Fleshman, W.; Raff, E.; Zak, R.; McLean, M.; Nicholas, C. Static malware detection & subterfuge: Quantifying the robustness of machine learning and current anti-virus. arXiv 2018, arXiv:1806.04773. [Google Scholar]
  11. Mangialardo, R.J.; Duarte, J.C. Integrating static and dynamic malware analysis using machine learning. IEEE Lat. Am. Trans. 2015, 13, 3080–3087. [Google Scholar] [CrossRef]
  12. Mohammad, R.M.; Thabtah, F.; McCluskey, L. Intelligent rule-based phishing websites classification. IET Inf. Secur. 2014, 8, 153–160. [Google Scholar] [CrossRef] [Green Version]
  13. Mohammad, R.M.; Thabtah, F.; McCluskey, L. Predicting phishing websites based on self-structuring neural network. Neural Comput. Appl. 2014, 25, 443–458. [Google Scholar] [CrossRef] [Green Version]
  14. Mohammad, R.M.; Thabtah, F.; McCluskey, L. An assessment of features related to phishing websites using an automated technique. In Proceedings of the 2012 International Conference for Internet Technology and Secured Transactions, London, UK, 10–12 December 2012; pp. 492–497. [Google Scholar]
  15. Meidan, Y.; Bohadana, M.; Mathov, Y.; Mirsky, Y.; Shabtai, A.; Breitenbacher, D.; Elovici, Y. N-BaIoT—Network-Based Detection of IoT Botnet Attacks Using Deep Autoencoders. IEEE Pervasive Comput. 2018, 17, 12–22. [Google Scholar] [CrossRef] [Green Version]
  16. Shah, M.J. Modern honey network. Int. J. Res. Advent Technol. 2016, 4, 156–162. [Google Scholar]
  17. Altaher, A. Phishing websites classification using hybrid SVM and KNN approach. Int. J. Adv. Comput. Sci. Appl. 2017, 8, 6. [Google Scholar] [CrossRef]
  18. Bahnsen, A.C.; Bohorquez, E.C.; Villegas, S.; Vargas, J.; González, F.A. Classifying phishing URLs using recurrent neural networks. In Proceedings of the 2017 APWG Symposium on Electronic Crime Research (eCrime), Scottsdale, AZ, USA, 25–27 April 2017; pp. 1–8. [Google Scholar]
  19. Dunham, K. Mobile Malware Attacks and Defense; Syngress: Amsterdam, The Netherlands, 2008. [Google Scholar]
  20. Khonji, M.; Iraqi, Y.; Jones, A. Phishing detection: A literature survey. IEEE Commun. Surv. Tutor. 2013, 15, 2091–2121. [Google Scholar] [CrossRef]
  21. Abu-Nimeh, S.; Nappa, D.; Wang, X.; Nair, S. A comparison of machine learning techniques for phishing detection. In Proceedings of the Anti-Phishing Working Groups 2nd Annual Ecrime Researchers Summit, Pittsburgh, PA, USA, 4–5 October 2007; pp. 60–69. [Google Scholar]
  22. Basnet, R.B.; Doleck, T. Towards developing a tool to detect phishing URLs: A machine learning approach. In Proceedings of the 2015 IEEE International Conference on Computational Intelligence & Communication Technology, Ghaziabad, India, 13–14 February 2015; pp. 220–223. [Google Scholar]
  23. Al-Garadi, M.A.; Mohamed, A.; Al-Ali, A.; Du, X.; Guizani, M. A survey of machine and deep learning methods for Internet of Things (IoT) security. arXiv 2018, arXiv:1807.11023. [Google Scholar]
  24. Hoang, X.D.; Nguyen, Q.C. Botnet detection based on machine learning techniques using DNS query data. Future Internet 2018, 10, 43. [Google Scholar] [CrossRef] [Green Version]
  25. Kumara, A.; Jaidhar, C. Automated multi-level malware detection system based on reconstructed semantic view of executables using machine learning techniques at VMM. Future Gener. Comput. Syst. 2018, 79, 431–446. [Google Scholar]
  26. Katzir, Z.; Elovici, Y. Quantifying the resilience of machine learning classifiers used for cyber security. Expert Syst. Appl. 2018, 92, 419–429. [Google Scholar] [CrossRef]
  27. Basnet, R.B.; Sung, A.H.; Liu, Q. Feature selection for improved phishing detection. In Proceedings of the International Conference on Industrial, Engineering and Other Applications of Applied Intelligent Systems, Dalian, China, 9–12 June 2012; pp. 252–261. [Google Scholar]
  28. Basnet, R.B.; Sung, A.H.; Liu, Q. Learning to detect phishing URLs. Int. J. Res. Eng. Technol. 2014, 3, 11–24. [Google Scholar]
  29. AV-TEST. AV-TEST the Independent IT-Security Institute; AV-TEST: Magdeburg, Germany, 2017. [Google Scholar]
  30. Cert, N.Z. Unauthorised Access. Available online: https://www.cert.govt.nz/businessesand-individuals/explore/unauthorised-access/?topic=unauthorised-access (accessed on 30 September 2017).
  31. Pandey, A.; Saini, J.R. Attacks & defense mechanisms for TCP/IP based protocols. Int. J. Eng. Innov. Res. 2014, 3, 17. [Google Scholar]
  32. Li, X.; Wang, J.; Zhang, X. Botnet detection technology based on DNS. Future Internet 2017, 9, 55. [Google Scholar] [CrossRef] [Green Version]
  33. Cabaj, K.; Gawkowski, P. HoneyPot systems in practice. Przegląd Elektrotechniczny 2015, 91, 63–67. [Google Scholar] [CrossRef] [Green Version]
  34. Kaur, S.; Kaur, H. Client honeypot based malware program detection embedded into web pages. Int. J. Eng. Res. Appl. 2013, 3, 849–854. [Google Scholar]
  35. Ramesh, G.; Gupta, J.; Gamya, P. Identification of phishing webpages and its target domains by analyzing the feign relationship. J. Inf. Secur. Appl. 2017, 35, 75–84. [Google Scholar] [CrossRef]
  36. Perez, C.; Lemercier, M.; Birregah, B.; Corpel, A. SPOT 1.0: Scoring suspicious profiles on twitter. In Proceedings of the International Conference on Advances in Social Networks Analysis and Mining Advances in Social Networks Analysis and Mining (ASONAM), Kaohsiung, Taiwan, 25–27 July 2011; pp. 377–381. [Google Scholar]
  37. Angrishi, K. Turning internet of things (iot) into internet of vulnerabilities (iov): Iot botnets. arXiv 2017, arXiv:1702.03681. [Google Scholar]
  38. Singhal, S.; Jena, M. A study on WEKA tool for data preprocessing, classification and clustering. Int. J. Innov. Technol. Explor. Eng. 2013, 2, 250–253. [Google Scholar]
  39. Boehm, H.-J. How to miscompile programs with “Benign” data races. In Proceedings of the Usenix Conference on Hot Topic in Parallelism, HotPar, San Jose, CA, USA, 26 May 2011. [Google Scholar]
  40. Mirsky, Y.; Doitshman, T.; Elovici, Y.; Shabtai, A. Kitsune: An ensemble of autoencoders for online network intrusion detection. arXiv 2018, arXiv:1802.09089. [Google Scholar]
  41. Rehman, R.U. Intrusion Detection Systems with Snort: Advanced IDS Techniques Using Snort, Apache, MySQL, PHP, and ACID; Prentice Hall Professional: Upper Saddle River, NJ, USA, 2003. [Google Scholar]
  42. Mphago, B.; Bagwasi, O.; Phofuetsile, B.; Hlomani, H. Deception in dynamic web application honeypots: Case of glastopf. In Proceedings of the International Conference on Security and Management (SAM), Las Vegas, NV, USA, 8 December 2015; p. 104. [Google Scholar]
  43. Intel. McAfee AntiVirus for Education; Intel: Santa Clara, CA, USA, 2017. [Google Scholar]
  44. Kelsey, T.; Lyon, B. Introduction to Search Engine Optimization: A Guide for Absolute Beginners; Apress: New York, NY, USA, 2017. [Google Scholar]
  45. Pochat, V.L.; Van Goethem, T.; Joosen, W. Rigging research results by manipulating top websites rankings. arXiv 2018, arXiv:1806.01156v2. [Google Scholar]
  46. Evans, M.P. Analysing Google rankings through search engine optimization data. Internet Res. 2007, 17, 21–37. [Google Scholar] [CrossRef] [Green Version]
  47. Kheir, N.; Tran, F.; Caron, P.; Deschamps, N. Mentor: Positive DNS reputation to skim-off benign domains in botnet C&C blacklists. In Proceedings of the IFIP International Information Security Conference, Marrakesh, Morocco, 2–4 June 2014; pp. 1–14. [Google Scholar]
Figure 1. Information of phishing dataset in preprocessing step.
Electronics 09 01033 g001
Figure 2. Design phases of the research in three datasets.
Electronics 09 01033 g002
Figure 3. The steps of the honeypot deployment network for experimentation.
Electronics 09 01033 g003
Figure 4. An overview of all features in the phishing dataset (the number of occurrences of each feature with three different behaviors).
Electronics 09 01033 g004aElectronics 09 01033 g004b
Figure 5. An overview of the features in the Botnet dataset (the number of occurrences of each feature with two different analysis).
Electronics 09 01033 g005
Figure 6. Number of occurrences of all features with comparison of legitimate, phishy and suspicious.
Electronics 09 01033 g006
Figure 7. Number of occurrences in Danmini and Ecobee for cross validation and test analysis in different features.
Electronics 09 01033 g007
Table 1. A comparison of classification algorithms.
Classifier Type Time Accuracy True Positive False Positive ROC Area
Decision stump 0.05 73.0167 0.730 0.404 0.757
Hoeffding tree 0.83 85.9060 0.859 0.190 0.910
J48 1.08 88.6296 0.886 0.145 0.949
RF 11.17 88.6024 0.886 0.147 0.949
Random tree 0.20 88.2225 0.882 0.146 0.938
REPTree 0.92 87.8697 0.879 0.153 0.946
Note: ROC, receiver operating characteristic.
Table 2. Datasets used in this study.
Dataset Source 1
Phishing websites (UCI) Percentage of attacks (10-fold cross-validation) Percentage of attacks (test)
Training dataset (Bagging) 97% 96%
Dataset Source 2
Detection of IoT botnet attacks N BaIoT (UCI) Percentage of attacks (10-fold cross-validation) Percentage of attacks (test)
Gafgyt attacks Danmini (bagging)86%88%
Gafgyt attacks Ecobee (bagging)89%83%
Dataset Source 3
Honeypot Percentage of attacks
Snort (IDS)25%Average 35%
Kippo (used to find the brute force attacks)74%
Glastopf (web application honeypot sensor)6%
Table 3. The IPs of attackers with the number of attacks.
IP Address Number of Attacks
177.39.121.252 8512
184.106.219.63 7532
186.251.208.49 3423
112.78.4.85 3311
185.25.122.3 1580
193.70.40.191 1408
51.254.123.147 1047
176.53.0.87 931
185.165.29.198 873
183.192.189.133 774

