Article

Millimeter Wave Propagation in Long Corridors and Tunnels—Theoretical Model and Experimental Verification

1
Department of Electrical and Electronics Engineering, Ariel University, Ariel 40700, Israel
2
Department of Chemical Engineering, Ariel University, Ariel 40700, Israel
*
Author to whom correspondence should be addressed.
Electronics 2020, 9(5), 707; https://doi.org/10.3390/electronics9050707
Submission received: 1 April 2020 / Revised: 21 April 2020 / Accepted: 25 April 2020 / Published: 26 April 2020
(This article belongs to the Collection Millimeter and Terahertz Wireless Communications)

Abstract

:
The development of the Fifth-Generation (5G) of cellular communications considers bands in millimeter waves (MMW) for indoor, short-range links. The propagation of MMW is affected by atmospheric and weather conditions, specular reflections from surfaces, and the directivity of the antennas. The short wavelength enables utilization of a quasi-optical propagation model for the description of indoor multi-path scenarios. A study of MMW propagation in tunnels, long corridors, or canyons is carried out using ray-tracing to evaluate the link budget and group delay. The analysis considers radiation patterns of both transmitting and receiving antennas, deriving a criterion for the number of dominating rays. Error analysis demonstrates the convergence of the method, while using a finite number of reflected rays. Experiments in a small-scale tunnel model demonstrate the accuracy of the analysis.

1. Introduction

Millimeter waves (MMW) are considered for short-range wireless links for Fifth-Generation (5G) cellular communications. This will increase channel capacity and channel availability. New bands in the MMW spectrum are already allocated, mainly in the vicinity of 28 GHz [1,2,3,4]. In addition to the growth in cellular communications, the rising popularity of autonomic vehicles has accelerated development in automotive radars, which are based on millimeter wave technology [5,6].
Currently, a common method to analyze signal propagation in tunnels or corridors uses modal expansion [7,8,9,10]. In this approach, the tunnel is treated as an empty waveguide, and the field in the cross-section is expressed as a summation of the transverse Eigenmodes above the cutoff frequency. However, at high frequencies such as those of the millimeter wavelengths, the method becomes ineffective. The transverse dimensions are much larger than the wavelength, and too many modes are required to be considered. In such an overmoded scenario, the calculation will be inaccurate, and the modal approach is no longer useful.
An alternate method to deal with indoor propagation is by solving the Maxwell equations in a numerical computational solver, imposing boundary conditions to calculate the field along the tunnel. In large structures, the computation becomes time consuming, requiring large storage and computing capabilities, and its resulting accuracy is limited to the numerical calculation resolution [11,12].
Due to its short wavelength, the propagation of MMW can be analyzed using “quasi-optical” models. The wavelength is much smaller than the cross-section dimensions, and the indoor multi-path can be treated using ray-tracing, providing significant advantages compared to propagation modeling [10,13,14,15]. The ray-tracing model has high resolution and is easy to implement on any computer without the need for special storage or computing capabilities.
Compared to the “conventional” RF bands in the VHF and UHF, the MMW band faces more implementation challenges [16,17]. Millimeter waves suffer from atmospheric attenuation, are affected by scattering and absorption, and are specularly reflected by surfaces. Nevertheless, the potential of MMW communication is important. In addition to its free spectrum, it is useful for densely packed communication networks due to its small equipment and antennas, and it offers frequency reuse potential due its to directivity and atmospheric attenuation.
This research focuses on the implementation of ray tracing in the analysis of indoor millimeter wave propagation. The MMW antennas are frequently directional, and their radiation pattern must be considered. It is shown that the radiation pattern of the transmitting and receiving antennas plays a role in the indoor multipath that emerges due to the occurrence of multiple reflections. It is important to note that, although the use of ray-tracing in the analysis of millimeter waves’ propagation is both effective and reliable, it is necessary to determine how many rays should be considered in the simulations. The accuracy of the multi-ray model is examined for different scenarios, including omni-directional and directive transmissions. The study is employed to demonstrate a millimeter wave link operating in frequencies allocated for the 5G cellular communications. Experimental verification is conducted and the results compared to the simulation model results.
The objective of this work is to study the propagation of millimeter wave transmission along corridors (or tunnels), comparing between communication scenarios of omni-directional links, as well as directive ones. Theoretical analysis is done for expressing the transfer function (magnitude and phase) of a wireless MMW link in both cases. The model is used for calculating the power budget and dispersive group delay emerging due to the involved multi-path phenomenon.

2. Method of Multi-Ray-Tracing in Tunnels

The propagation of millimeter waves along a tunnel can be described using the ray-tracing approach [18]. Figure 1 illustrates the ray paths and the resulting reflections along the tunnel. To find the link performances, it is necessary to consider the line-of-sight (LOS) and all the reflected rays. For convenience, the received power is presented in a normalized form:
P r ( T u n n e l ) P r ( L O S ) = | m = n = R 0 R ( m , n ) · Γ | m | · Γ | n | · G ( θ , ϕ ) G L O S · e j 2 π f Δ τ ( m , n ) | 2
where f is the wave frequency, G ( θ , ϕ ) = G t ( θ , ϕ ) · G r ( θ , ϕ ) , G L O S is the antenna gain in the LOS direction, R 0 = R ( 0 , 0 ) is the LOS path distance, Γ is the reflection coefficient for each reflected ray, and m and n are the number of reflections in the horizontal and vertical dimensions, respectively. We define the time delay of the path (m,n) as follows:
Δ τ ( m , n ) = R ( m , n ) R 0 c
The distance each ray travels from the transmitter to the receiver is calculated according to:
R ( m , n ) = [ x t ( m ) x r ] 2 + [ y t ( n ) y r ] 2 + z 2
Here, the receiver coordinates are ( x r , y r ) . The coordinates x t ( m ) and y t ( n ) are of the transmitter images and calculated as in geometrical optics [18]:
x t ( m ) = 2 m a + ( 1 ) m · x t y t ( n ) = 2 n b + ( 1 ) n · y t
where a and b are defined as half of the tunnel width and height, respectively. The reflection coefficients of the incident electric transverse electric (TE) and transverse magnetic (TM) waves are found using Fresnel’s equations [19]:
Γ T M = ϵ r sin ( θ g ) ϵ r cos 2 ( θ g ) ϵ r sin ( θ g ) + ϵ r cos 2 ( θ g ) Γ T E = sin ( θ g ) ϵ r cos 2 ( θ g ) sin ( θ g ) + ϵ r cos 2 ( θ g )
where ϵ r is the relative dielectric permittivity of the surface and θ g is defined as the grazing angle between the incident ray to the surface (see Figure 1b):
θ g ( m , n ) = arcsin | x t ( m ) x r | R ( m , n ) , vertical surfaces arcsin | y t ( n ) y r | R ( m , n ) , horizontal surfaces
Table 1 summarizes the reflection coefficient type according to the antenna polarization [20].
To examine the sensitivity of the model to variations in the reflectivity of the surfaces, it is important to evaluate the Fresnel coefficients for the dielectric permittivity of typical construction materials. Table 2 presents different construction materials and their relative dielectric constant ϵ r at 28 GHz [21,22,23]. Calculations were made to find reflection coefficients for transverse electric (TE) and transverse magnetic (TM) waves and for different materials. Figure 2 shows that the differences are minor and mainly expressed for high incident angles θ g .
The ray traveling distances R ( m , n ) can be expressed as follows:
R ( m , n ) = R 0 a R 0 2 [ 2 m 1 + ( 1 ) m ] 2 + b R 0 2 [ 2 n 1 + ( 1 ) n ] 2 + 1
We define the following parameters:
A m = [ 2 m 1 + ( 1 ) m ] 2 B n = [ 2 n 1 + ( 1 ) n ] 2
The above expression Equation (7) can be re-written using the above parameter definitions:
R ( m , n ) = R 0 a R 0 2 A m + b R 0 2 B n + 1
Substitute Equation (9) into Equation (2), where τ 0 = R 0 / c results in the incremental delays Δ τ ( m , n ) of the multi-path rays, which are given by the following:
Δ τ ( m , n ) τ 0 = a R 0 2 A m + b R 0 2 B n + 1 1
Figure 3 illustrates graphs of the parameters A m , B n and the resultant time delay of the multi-path rays as a function of their m th and n th orders.
The multi-reflection inside the tunnel not only causes variations in the field intensity due to constructive or destructive interference, but also causes a phase shift Δ ϕ . This is a frequency-dependent quantity that may cause a dispersive group delay. The normalized field at the receiver can be expressed as follows:
E r E L O S = P r ( T u n n e l ) P r ( L O S ) · e j Δ ϕ
The incremental group delay with respect to the line-of-sight path can be calculated by the phase derivative:
Δ τ = 1 2 π d d f Δ ϕ

3. Number of Dominant Rays: Simulation Results

Multi-path in an indoor environment contains rays reflected from the walls, ceiling, floor, as well as from obstacles. However, each reflection of a ray from a surface results in an attenuation in accordance with the reflection coefficient given by Fresnel’s Equation (5). The more it is reflected, the less power it maintains, so effectively, there is a finite number of reflections that need to be taken into consideration in the summation Equation (1). To analyze it properly, the discussion should be divided into two types of transmissions; omni-directional and directive links.

3.1. Omni-Directional Transmission

Using omni-directional antennas, the rays are assumed to have the same intensity transmitted at each beam angle. The rays are attenuated by two factors: the free space loss, determined by the distance each ray travels, and the total accumulative reflectivity from the walls. Figure 4 is an example showing the minor contribution of additional rays in the link budget calculation for a millimeter wave 28 GHz link operating inside a narrow underground pedestrian tunnel made of concrete, with 2 a = 1 m and 2 b = 2 m.
In order to identify how many dominant rays play a role in the link along a section of length L in the tunnel, an error analysis of the modification was made. The root mean squared error (RMSE) for the nth additional ray is calculated as follows:
E r r o r ( n ) = 1 L 0 L E n ( z ) E L O S ( z ) E n 1 ( z ) E L O S ( z ) d z 2
The results are summarized in Figure 5 for different tunnel section lengths inside the underground pedestrian tunnel. A longer tunnel requires the consideration of more rays in the summation.

3.2. Directive Link

Millimeter wave antennas are usually directive (see for example the radiation pattern of a horn antenna as shown in Figure 6). Moreover, 5G links will utilize beam steering antennas that direct the transmission towards the receiver side. Thus, the radiation pattern of the antenna needs to be considered. Each ray arrives at the receiver at a different spatial angle and has its own intensity and phase.
The patterns of transmitting and receiving antennas play a role in the link budget via their respective gains G t ( θ , ϕ ) and G r ( θ , ϕ ) . The resulting overall gain G ( θ , ϕ ) = G t ( θ , ϕ ) · G r ( θ , ϕ ) is given in terms of the azimuthal ϕ and elevation θ angles, which are determined by the geometry:
θ = arccos z R ( m , n ) ϕ = arctan y t ( m ) y r x t ( m ) x r
Knowing the effective azimuthal and elevation beam widths θ H and θ V , respectively, a criterion estimating the number of relevant multi-path rays is required for each direction, M for the vertical and N for the horizontal directions, respectively. Figure 7 illustrates the utilization of the image method for the N th transmitter image location. This image transmits the ray that will be reflected the most, corresponding to the beam angle, 0.5 θ H . The distance between the transmitter position y t and its most distant image location y t is equal to R 0 t a n ( 0.5 θ ) . For N reflections, the ray crosses the tunnel N 1 times, so we get R 0 t a n ( 0.5 θ ) = ( N 1 ) · 2 b + y r + y t . Considering a scenario where the transmitter and receiver are located at the center of the tunnel (e.g., y r = y t = b ), one can find an expression for the maximum number of horizontal reflections, N (the same way for finding the maximum number of vertical reflections, M), as follows:
M = i n t R 0 tan ( 0.5 θ H ) 2 a N = i n t R 0 tan ( 0.5 θ V ) 2 b
where i n t ( x ) is the nearest integer number.
This is an important result, which is useful for evaluating the maximum number of rays required in the simulation for obtaining a reliable estimation of the link budget for different tunnel scenarios. Figure 8a shows the number of rays that play a role in a directive link for which θ H = 10 and θ V = 15 .
In this case, propagation along the first 140 m of the 2.4 km long Lincoln Tunnel was studied with the parameters summarized in Table 3. Figure 8a shows the number of multi-path rays N for the vertical direction and M for the horizontal direction that play a role in the power budget of a 28 GHz wireless link operating along the tunnel. Inspection of Figure 8a reveals that, up to the first 30 m, only the direct line-of-sight link was dominant, and no multi-path rays (M = N = 0) contributed to the link budget. From 30 m to 60 m, one additional elevated multi-path ray from the tunnel ceiling and floor was added (M = 0, N = 1). The first multi-path ray in the horizontal direction appeared at a distance of 75.5 m, where a single reflection (M = 1) from the walls and two reflections (N = 2) from the ceiling and floor contributed to the link budget.
Figure 8b shows the path loss normalized to the LOS direct link. Up to the first 30 m, only the LOS played a role, resulting in 0 dB normalized path loss. The constructive and destructive contributions of the multi-path began after the first 30 m. The resulting incremented group delay is plotted in Figure 8c. As expected, no dispersive effect was noted during the first 30.47 m, where no multi-path was revealed. Incremented phase shifts appeared afterwards, due to the multi-path effects, first from the vertical (ceiling and floor) reflections. More reflections are realized as one advances along the tunnel, increasing the group delay correspondingly, as the channel becomes more and more frequency-selective.
Using criterion Equation (15), it was found that for the first 140m of Lincoln Tunnel, the required number of rays in the horizontal and vertical dimensions was N = 1 and M = 4 , respectively (see Figure 8a). Examination of the convergence as a function of the number of reflected rays M and N via the normalized RMS error is shown in Figure 9. Inspection of the resulted modification error above four reflections revealed insignificant modifications.

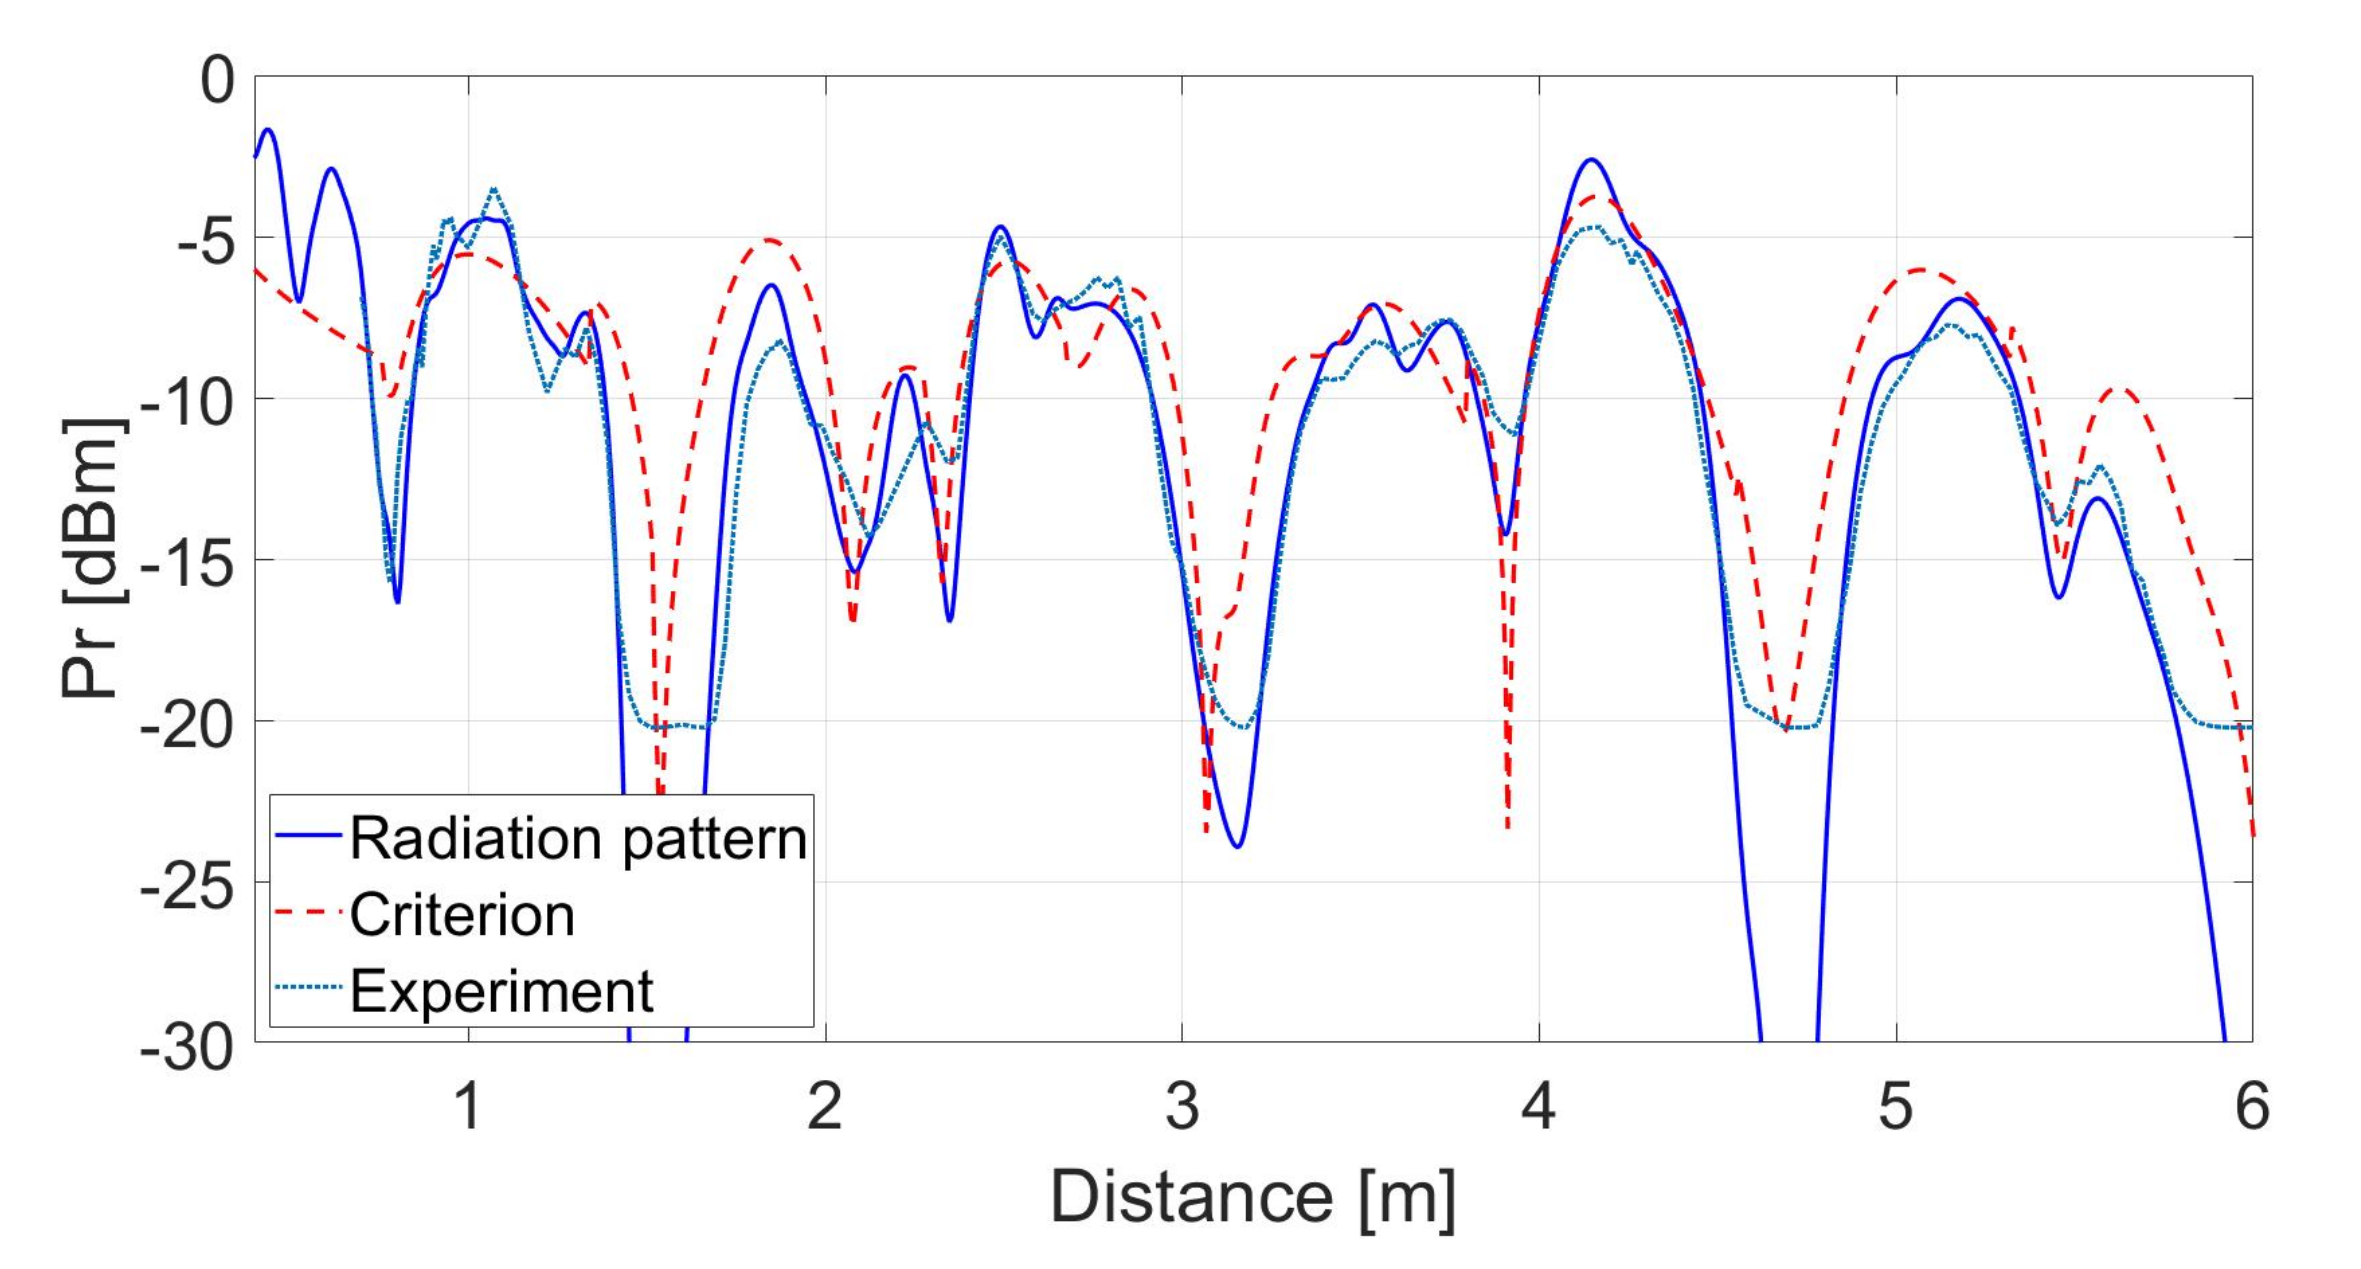
4. Experimental Results with a Scaled Tunnel Model

To verify the MMW propagation model suggested in this study, lab experiments were carried out using a scaled model. We built a sub-scale tunnel made of wood covered with Formica to simulate the tunnel (Figure 10) and set the transmitter frequency to a higher frequency 94 GHz (shorter wavelength). The transmitter and receiver were connected to a pyramidal horn antenna with a gain of 24 dBi each (see Figure 11), and their radiation pattern was calculated using the formulation given in [24,25]. The detected power at the receiver was measured for different distances up to 6 m along the tunnel, starting from 0.6 m. The steps between the measurements were set to 1–2 cm. The experiments were carried out and repeated for vertical and for horizontal polarizations. Figure 12 compares the experimental results and the simulation, and a significant correspondence is notable between both graphs. We applied the criterion developed in Equation (15) for the maximum number of reflected rays. The results are illustrated in Figure 13, comparing simulations with the real antenna pattern (solid line), the resulting number of reflected rays (dashed line), and experimental results (dotted line).
In order to compare between the simulation results and experimental measurements, we employed the Pearson correlation coefficient, ρ ( A , B ) , defined by [26]:
ρ ( A , B ) = 1 L 1 i = 1 L A i μ A σ A B i μ B σ B
Here, A represents a vector of the experimental measurements, where μ A is its mean and σ A is its standard deviation. The vector B represents the simulation results with mean μ B and standard deviation σ B . When ρ = 0 , there is no correlation between A and B, while ρ = 1 stands for perfect correlation.
The correspondence between the experimental results and those estimated by the link budget simulation was examined using Equation (16). The Pearson correlation coefficient was calculated while assuming radiation patterns demonstrated in Figure 11b and found to be ρ = 0.9054 . Evidently, the model predicted the expected indoor link budget quite accurately.

5. Discussion and Conclusion

This study examined the robustness of the ray-tracing model to describe a wireless link operating in millimeter wavelengths. The ray-tracing model was used to describe the link budget of a wireless link operating inside a tunnel. The dependence between the antenna polarization and directivity was investigated theoretically and compared with experiments that were carried out in a scaled tunnel model. The study revealed a comparable link behavior along the tunnel and a criterion for the number of dominant rays playing a role in the determination of received power and phase shift. The study focused on the 28 GHz band, which is allocated for the 5G cellular networks.
In summary, the study demonstrated the evolvement of the received power, as well as the group delay emerging due to the multi-path along a tunnel in two different MMW links: omni-directional and directive ones. Experimental measurement showed high correlation with the theoretical estimations.

Author Contributions

Conceptualization, G.A.P., Y.P., and L.R.; methodology, G.A.P. and L.R.; software, L.R. and G.A.P.; validation, Y.P.; formal analysis, L.R.; investigation, L.R., G.A.P., and Y.P.; resources, L.R., G.A.P., and Y.P.; data curation, L.R.; writing, original draft preparation, L.R.; writing, review and editing, L.R., G.A.P., and Y.P.; visualization, L.R., G.A.P., and Y.P.; supervision, G.A.P. and Y.P.; project administration, Y.P.; funding acquisition, Y.P. and G.A.P. All authors have read and agreed to the published version of the manuscript.

Funding

This research received no external funding. Liat Rapaport is supported by the Israeli Ministry of Science.

Conflicts of Interest

The authors declare no conflict of interest.

References

  1. Dahlman, E.; Mildh, G.; Parkvall, S.; Peisa, J.; Sachs, J.; Selén, Y.; Sköld, J. 5G wireless access: Requirements and realization. IEEE Commun. Mag. 2014, 52, 42–47. [Google Scholar] [CrossRef]
  2. Rappaport, T.S.; Sun, S.; Mayzus, R.; Zhao, H.; Azar, Y.; Wang, K.; Wong, G.N.; Schulz, J.K.; Samimi, M.; Gutierrez, F., Jr. Millimeter wave mobile communications for 5G cellular: It will work! IEEE Access 2013, 1, 335–349. [Google Scholar] [CrossRef]
  3. Rappaport, T.S.; Xing, Y.; MacCartney, G.R.; Molisch, A.F.; Mellios, E.; Zhang, J. Overview of millimeter wave communications for fifth-generation (5G) wireless networks with a focus on propagation models. IEEE Trans. Antennas Propag. 2017, 65, 6213–6230. [Google Scholar] [CrossRef]
  4. Qamar, F.; Hindia, M.; Dimyati, K.; Noordin, K.A.; Majed, M.B.; Abd Rahman, T.; Amiri, I.S. Investigation of future 5G-IoT millimeter-wave network performance at 38 GHz for urban microcell outdoor environment. Electronics 2019, 8, 495. [Google Scholar] [CrossRef] [Green Version]
  5. Jha, U.S. The millimeter Wave (mmW) radar characterization, testing, verification challenges and opportunities. In Proceedings of the 2018 IEEE AUTOTESTCON, National Harbor, MD, USA, 17–20 September 2018; pp. 1–5. [Google Scholar]
  6. Wang, X.; Xu, L.; Sun, H.; Xin, J.; Zheng, N. On-road vehicle detection and tracking using MMW radar and monovision fusion. IEEE Trans. Intell. Transp. Syst. 2016, 17, 2075–2084. [Google Scholar] [CrossRef]
  7. Hrovat, A.; Kandus, G.; Javornik, T. A survey of radio propagation modeling for tunnels. IEEE Commun. Surv. Tutor. 2014, 16, 658–669. [Google Scholar] [CrossRef]
  8. Zhang, X.; Sood, N.; Sarris, C.D. Fast radio-wave propagation modeling in tunnels with a hybrid vector parabolic equation/waveguide mode theory method. IEEE Trans. Antennas Propag. 2018, 66, 6540–6551. [Google Scholar] [CrossRef]
  9. Mahmoud, S.F. Wireless transmission in tunnels with non-circular cross section. IEEE Trans. Antennas Propag. 2009, 58, 613–616. [Google Scholar] [CrossRef]
  10. Zhou, C. Ray tracing and modal methods for modeling radio propagation in tunnels with rough walls. IEEE Trans. Antennas Propag. 2017, 65, 2624–2634. [Google Scholar] [CrossRef] [Green Version]
  11. Collin, R.E. Antennas and Radiowave Propagation; McGraw-Hill: New York, NY, USA, 1985. [Google Scholar]
  12. Zhang, Y.; Liu, Y.; Sun, J.; Wang, C.X.; Ge, X. Impact of Different Parameters on Channel Characteristics in a High-Speed Train Ray Tracing Tunnel Channel Model. In Proceedings of the 2017 IEEE 85th Vehicular Technology Conference (VTC Spring), Sydney, Australia, 4–7 June 2017; pp. 1–5. [Google Scholar]
  13. Fu-Rong, Y.; Dan, S.; Feng, C.; Yuan-jian, L. Study on the propagation characteristics of radio wave in tunnels by the method of SBR/image. In Proceedings of the IEEE 2014 3rd Asia-Pacific Conference on Antennas and Propagation, Harbin, China, 26–29 July 2014; pp. 706–709. [Google Scholar]
  14. Liu, C.; Zhang, E.; Wu, Z.; Zhang, B. Modelling radio wave propagation in tunnels with ray-tracing method. In Proceedings of the IEEE 2013 7th European Conference on Antennas and Propagation (EuCAP), Gothenburg, Sweden, 8–12 April 2013; pp. 2317–2321. [Google Scholar]
  15. Hossain, F.; Geok, T.K.; Rahman, T.A.; Hindia, M.N.; Dimyati, K.; Ahmed, S.; Tso, C.P.; Rahman, A.; Ziela, N. An efficient 3-D ray tracing method: Prediction of indoor radio propagation at 28 GHz in 5G network. Electronics 2019, 8, 286. [Google Scholar] [CrossRef] [Green Version]
  16. Rangan, S.; Rappaport, T.S.; Erkip, E. Millimeter-wave cellular wireless networks: Potentials and challenges. Proc. IEEE 2014, 102, 366–385. [Google Scholar] [CrossRef] [Green Version]
  17. Frascolla, V.; Faerber, M.; Dussopt, L.; Calvanese-Strinati, E.; Sauleau, R.; Kotzsch, V.; Romano, G.; Ranta-aho, K.; Putkonen, J.; Valiño, J. Challenges and opportunities for millimeter-wave mobile access standardisation. In Proceedings of the 2014 IEEE Globecom Workshops (GC Wkshps), Austin, TX, USA, 8–12 December 2014; pp. 553–558. [Google Scholar]
  18. Zhou, C.; Plass, T.; Jacksha, R.; Waynert, J.A. RF Propagation in Mines and Tunnels: Extensive measurements for vertically, horizontally, and cross-polarized signals in mines and tunnels. IEEE Antennas Propag. Mag. 2015, 57, 88–102. [Google Scholar] [CrossRef]
  19. Rappaport, T.S. Wireless Communications–Principles and Practice, (The Book End). Microw. J. 2002, 45, 128–129. [Google Scholar]
  20. Rapaport, L.; Etinger, A.; Litvak, B.; Pinhasi, G.; Pinhasi, Y. Quasi Optical Multi-Ray Model For Wireless Communication Link in Millimeter Wavelengths. MATEC Web Conf. 2018, 210, 03006. [Google Scholar] [CrossRef] [Green Version]
  21. Zhao, K.; Gustafson, C.; Liao, Q.; Zhang, S.; Bolin, T.; Ying, Z.; He, S. Channel characteristics and user body effects in an outdoor urban scenario at 15 and 28 GHz. IEEE Trans. Antennas Propag. 2017, 65, 6534–6548. [Google Scholar] [CrossRef]
  22. Sarabandi, K.; Li, E.S.; Nashashibi, A. Modeling and measurements of scattering from road surfaces at millimeter-wave frequencies. IEEE Trans. Antennas Propag. 1997, 45, 1679–1688. [Google Scholar] [CrossRef] [Green Version]
  23. Lamb, J.W. Miscellaneous data on materials for millimetre and submillimetre optics. Int. J. Infrared Millim. Waves 1996, 17, 1997–2034. [Google Scholar] [CrossRef]
  24. Balanis, C.A. Antenna Theory: Analysis and Design; John Wiley & Sons: Hoboken, NJ, USA, 2005. [Google Scholar]
  25. Aragon-Zavala, A.; Saunders, S.R. Antennas and Propagation for Wireless Communication Systems; John Wiley & Sons: Chichester, UK, 2008. [Google Scholar]
  26. Edwards, A.W.F.; Fischer, R.A. Fischer, Statistical Methods for Research Workers, first edition (1925). In Landmark Writings in Western Mathematics 1640–1940; Elsevier: Amsterdam, The Netherlands, 2005; pp. 856–870. [Google Scholar]
Figure 1. (a) Transmitter and receiver transverse coordinates inside the tunnel. (b) Longitudinal tunnel side view. Here, 2 a and 2 b are the width and height of the tunnel, respectively.
Electronics 09 00707 g001
Figure 2. Reflection coefficients for different construction materials at 28 GHz: (a) transverse electric (TE) reflection; (b) transverse magnetic (TM) reflection.
Electronics 09 00707 g002
Figure 3. (a) A m and B n dependence for the n and m orders. (b) τ ( m , n ) / τ 0 dependence for n and m values, where a = 0.5 m, b = 1 m, and z = 300 m.
Electronics 09 00707 g003
Figure 4. Overview of different numbers of reflected rays at 28 GHz.
Electronics 09 00707 g004
Figure 5. Root mean squared error at 28 GHz inside the tunnel.
Electronics 09 00707 g005
Figure 6. Millimeter wave horn antenna radiation pattern.
Electronics 09 00707 g006
Figure 7. Demonstration of the image method used to derive the number of maximum rays criterion.
Electronics 09 00707 g007
Figure 8. (a) Number of maximum rays arriving at the detector side for each distance inside Lincoln Tunnel, using a horn antenna, calculated from Equation (15). (b) Link budget along the first 140 m of the tunnel. (c) Δ τ along the tunnel.
Electronics 09 00707 g008aElectronics 09 00707 g008b
Figure 9. Normalized RMSE at 28 GHz inside the first 140m of Lincoln Tunnel, using a directive horn antenna.
Electronics 09 00707 g009
Figure 10. Downscaled tunnel experiment setup in the laboratory. (a) Cross section of the tunnel. (b) Down scale tunnel.
Electronics 09 00707 g010
Figure 11. (a) Horn antenna. (b) Radiation pattern in 3D view.
Electronics 09 00707 g011
Figure 12. Comparison of the simulation and experimental results of directive links for different polarizations while considering the radiation pattern of transmitting and receiving antennas. (a) Vertical polarization. (b) Horizontal polarization.
Electronics 09 00707 g012
Figure 13. Comparison of the simulation and experimental results for vertical polarization using a radiation pattern and the criterion Equation (15) for maximum reflected rays.
Electronics 09 00707 g013
Table 1. Reflection coefficients for fundamental polarization.
Antenna PolarizationWalls’ PolarizationFloor and Ceiling Polarization
Vertical Γ T E Γ T M
Horizontal Γ T M Γ T E
Table 2. Relative dielectric coefficients of construction materials at 28 GHz.
MaterialDielectric Constant ϵ r
Concrete5.31
Glass6.27
Brick3.75
Wood5
Wet Ground10
Nylon3.2
Silicon11.6
Teflon3.0
Table 3. Simulation parameters of the wireless link operating inside Lincoln Tunnel.
DefinitionParameterValue
Tunnel Width 2 a 6.6 m
Tunnel Height 2 b 4 m
Cross-Section Shape-Rectangular
Polarization-vertical
Frequencyf28 GHz
Effective Equivalence Vertical Beamwidth θ V 15
Effective Equivalence Horizontal Beamwidth θ H 10
Transmitting antenna gain G t 24 dBi
Receiving antenna gain G r 24 dBi

