Article

Applications of Extreme Gradient Boosting for Intelligent Handovers from 4G To 5G (mm Waves) Technology with Partial Radio Contact

by
Saad Ijaz Majid
1,*,
Syed Waqar Shah
1 and
Safdar Nawaz Khan Marwat
2
1
Department of Electrical Engineering, University of Engineering and Technology, Peshawar 25120, Pakistan
2
Department of Computer Systems Engineering, University of Engineering and Technology, Peshawar 25120, Pakistan
*
Author to whom correspondence should be addressed.
Electronics 2020, 9(4), 545; https://doi.org/10.3390/electronics9040545
Submission received: 8 February 2020 / Revised: 12 March 2020 / Accepted: 23 March 2020 / Published: 25 March 2020
(This article belongs to the Special Issue Applications for Smart Cyber Physical Systems)

Abstract

:
In a network topology, where 5G (mm Waves) have better coverage footprint compared to 4G (LTE or LTE-A) technology, mobile devices would generally be handed over from 4G to 5G. In this work, a supervised intelligent prediction technique for improved handover success rate (HSR) from 4G to 5G technology is proposed. The technique is applicable for base stations enabled with sub-6-GHz and mm-wave bands. This technique is novel since it can predict HSR even before switching to 5G radio circuitry or initiating its measurement gap for acquisition of mm-wave reference signal received power (RSRP) unlike conventional algorithms. Thus, preempting all handovers which are likely to fail will provide improvements in latency, delay, and handover success rate, as well as decrease call drops. Therefore, this research work answers previous research shortcomings and can unleash applications of supervised intelligent algorithms for predicting the HSR from 4G to 5G. The proposed algorithm is validated by showing improvements obtained through simulation results performed using Python-based framework. The proposed algorithm is tested for reliability with increasing parameters such as the intensity number of UEs and simulation time. Improvements in standard handover algorithm are also proposed.
Keywords:
mm waves; handover; 5G

1. Introduction

The boundless demand of high-speed wireless communications poses a challenge for cellular networks in inter-RAT (radio access technology) handovers. Conventional handover algorithms are based upon scanning of radio parameters for every handover; however, the current trend is shifting toward intelligent handovers where equipment predicts the success of upcoming handover and radio parameters by using previous already available data. The proposed algorithm also looks into limitations of previous research work. Conventional techniques are not robust, and they are prone to handover failures, causing call drops and initiating inappropriate measurement gaps. These handover failures, call drops, and inappropriate measurement gaps affect the performance of high-speed networks. Thus, an end user does not perceive adequate quality of service (QoS).
The 5G technology promises uninterrupted high-speed connectivity with reliability, as well as minimum latency and delay. However, while a mobile attempts to handover from 4G to 5G, a measurement gap has to be established for scanning radio parameters. The measurement gap ceases data transmission for that duration, which is contrary to the promised uninterrupted and high-speed data transmission in 5G.
Amongst the challenging demands of wireless technology today is to provide mobility without any loss in QoS provision. Thus, this research focuses on improved inter-RAT handovers, where a measurement gap can only be triggered while having an accepted level of probability for a successful handover. Therefore, this will reduce demand for unnecessary measurement gaps and, consequently, user data transmission will not cease during this interval.
This work exploits the availability of the sub-6-GHz band which is available in both 4G and 5G technologies [1,2,3,4,5,6,7,8]. This clearly raises the challenge of accurate prediction of target cell radio parameters before a radio link is established with 5G technology. Resolving this challenge can result in elimination of unnecessary transmission interruptions in data due to measurement gaps [8].
The proposed technique will statistically predict the handover success rate (HSR) to mm wave through estimations without establishing a radio link with 5G technology.
This research work contributes to the field as follows: Section 1 outlines the limitations of previous research work, reduction of steps in an actual handover algorithm for improved delay and latency; Section 2 offers a mathematical prediction of handover success to mm waves (without a radio link to 5G at the time of handover); Section 3 validates the proposed technique by demonstrating the improvement in HSR, Section 3 also shows that the proposed algorithm generates decisions different to conventional algorithms after the training period and proves that the proposed algorithm improves with an increase in the number of UEs and the simulation time.

1.1. Limitations in Previous Research Work

Previous research work carried out by [8] had the following limitations which are covered here:
  • There was no discussion on path loss models for 4G and 5G technology. This is an important aspect since intelligent handover algorithms are based upon path loss models. This is covered in Section 2.
  • The path loss model used in the simulator by [8] for 4G technology was inaccurate, and parameters for 5G frequency used in estimating its signal strength were invalid. Furthermore, 5G path loss parameters were not available in [8]. This is covered in Section 2.
  • Simulation results were inaccurate due to the incorrect path loss model of 4G, as well as using invalid 5G frequency and its parameters. This is covered in Section 2.
  • Due to discrepancies, the algorithm proposed by [8] failed to detect the requirements of further possible handover attempts. This is covered in Section 3.
  • Results were not discussed with moving users. This is covered in Section 2 and Section 3.
  • It is not clear whether the 5G technology radio model is a line-of-sight model or not. This is covered in Section 2.
  • Cell level improvement should also be discussed appropriately after the intelligent handover kicks in. This is covered in Section 3.
  • Authors in [8] recommended its proposed algorithm to be executed in base stations only, but did not cover what happens if the base station processing power is saturated. This is covered in Section 4.

1.2. Literature Review

In order to discuss the limitations of conventional algorithms, we consider the most debatable conventionally available techniques. Authors in [9,10,11,12] utilized the angle of arrival (AoA) and angle of departure (AoD) for estimating the mm-wave channel. However, accurately predicting AoA and AoD at mm waves is difficult because of their sensitive and stochastic nature at such higher frequencies. Therefore, this highly complicates the algorithm and circuitry for error control. On the other hand, [13,14,15] utilized a correlation-based adaptive compressed sensing (CBACS) mechanism for 5G technology and claimed to obtain precise AoA and AoD, which is an important factor for hybrid beam forming. Compressed sensing is a promising technique because of the poor scattering involved in mm waves during propagation. This technique calculates the channel state information (CSI) by relating quantized sensing vectors with the correlations of received CSI. In contrast, [9] believed that, for accurately obtaining CSI, in cases where the base station is equipped with more antennas compared to the user, then for accurately obtaining CSI in paths from the base station to the user, it is more promising to utilize uplink AoA than downlink AoD. Similarly, [16] argued that the compressed sensing scheme has limitations in terms of resolution loss because of channel angle quantization. Moreover, [17] showed that estimating mm-wave channels through a large number of antennas and hybrid precoding poses a challenge in itself due to the fact that digital baseband systems do not access complete channel dimensions. This is also known as channel subspace sampling limitation; thus, acquiring useful CSI within coherence time becomes difficult.
Another promising technique in the literature is orthogonal matching pursuit (OMP), used by [18,19,20,21,22] which exploit the sparse properties of mm waves. Authors in [20] argued that the channel can be estimated using a parametric model having quantized AoDs and AoAs. The results are promising because of the capable performance of OMP as an upper limit and an oracle estimator concluding the information of AoDs and AoAs. However, calculating CSI in mm waves employing massive MIMO is difficult because of the low signal-to-noise ratio (SNR) before beam forming and the higher number of antennas. In contrast, this research work defuses these limitations by estimating quantities from a sub-6-GHz system. Thus, we can accurately predict the strength of received mm waves.
Authors in [23,24,25,26,27] recommended a technique where dual connectivity was made with 4G and 5G simultaneously in order to achieve the desired goals. However, this technique concurrently engages dual radio circuitry. Multi-connectivity has limitations in terms of latency, battery drainage, and processing power, which contradicts the goal of improved handover algorithms. Moreover, dual connectivity has a high probability of ping-pong effects because mm waves are highly susceptible to radio parameters.
In [28,29,30], assisted handover signaling was discussed, showing limitations in terms of uninterrupted data transmission, latency, delay, and battery drainage. Therefore, their research work contradicted the promising features of 5G technology.
The mm-wave signal strength can also be estimated through out-of-band information [31,32,33]. There are three layers of out-of-band information: (1) radars or global positioning systems (GPS), (2) sub-6-GHz signals, and (3) wireless sensor networks (WSNs). However, this has limitations by not reprocessing mm-wave measurements in a temporal window or by not applying statistical learning, which is employed in this work to achieve successful handovers without call drops.
All conventional algorithms discussed above trigger unnecessary measurement gaps. They do not provide any solution where such events could be pre-empted in advance, whereas each algorithm also has accuracy problems due to the intrinsic limitations discussed above. In contrast, [8,34,35] argued for the use of machine learning (intelligent)-based algorithms that predict in advance the required parameters without a measurement gap. The proposed technique also estimates the 5G radio signal strength through machine learning rather than scanning the radio bearing data of the target cell for each handover. Therefore, the proposed research work answers the limitations of conventional algorithms and proposes an improved model. The proposed algorithm uses extreme gradient boosting which is discussed in Section 4.
It is expected that 5G technology handovers would resemble LTE at the radio resource control (RRC) layer [8]. Thus, the handover can be generally categorized into two distinct groups.
  • Active measurements: The mobile processes the source domain, as well as the radio conditions of the target domain, and relays information as an event to base stations.
  • Intelligent estimates: The mobile/base station executes action through intelligent estimates with partial radio measurements, and it triggers the base station for setting up radio bearers to a new service.
Estimating the mm waves from a collocated serving cell of LTE in the sub-6-GHz band is a promising notion for pre-empting handovers in cases of weak levels. This can be achieved without the mobile explicitly measuring the mm-wave carrier before handover. This technique is referred to as intelligent handover with partial radio connectivity. Target cell data of 4G and mm waves are both required for training data; however, once the training sequence is accomplished, the system autonomously predicts the target cell reference signal received power (RSRP) without physically connecting to it.
The proposed algorithm is effective in the sense that the measurement gap configuration remains momentarily avoidable; thus, by eliminating unnecessary measurement gaps, the user enjoys continuous data flow.
For this research, sub-6-GHz and mm-wave technologies were used; however, this methodology also supports other inter-frequency pairs in circumstances of collocated cells and known radio parameters. Figure 1 and Figure 2 represent the actual and proposed algorithms.
As mm waves have high frequencies, their wavelengths shrink by a factor related to the sub-6-GHz band, and material penetration experiences higher attenuation at these frequencies [8,36]. Moreover, estimating mm-wave frequencies is highly challenging because of severe path losses and multiple channel coefficients, but the proposed algorithm can provide reliable predictions.

2. Methodology

This section covers path loss models and their parameters. The section also discusses, in detail, the limitations of the path loss models proposed by [8].

2.1. Path Loss Models

Recent studies [37,38] provided a mathematical model represented by Equation (1) for close-in free space path loss (distance = 1 m reference).
P L i n   dB = F S P L   i n   dB + 10   k   log 10 d + ɣ i n   dB + Δ σ ,
where path loss (PL) is a function of free space path loss (FSPL), path loss exponent ( k ), distance ( d ), atmospheric attenuation ( ɣ ), and a gaussian random variable with zero mean ( Δ ) and standard deviation σ .
FSPL (in dB) and Δ σ are given by Equations (2) and (3), respectively.
F S P L i n   dB = 20 log 10   ( 4 × 3.14 × f × 10 9 3 × 10 8 ) ,
F S P L i n   dB = 32.4 i n   dB + 20 log 10 f ,
Δ σ i n   d B = β dB m × d m ,
where f is the frequency in GHz, and β is the attenuation constant.
With reference to models, the following models are discussed here:
  • Alpha Beta Gamma (ABG) [36,38,39].
  • Close-in (CI) free-space reference distance model [36,38,39].
  • CI model with a frequency-weighted path loss exponent (CIF) [36,38,39]. All these models can be used over an extensive range of relevant frequencies to predict path loss.
  • Cost231 model [40,41].
The ABG model can be mathematically expressed by Equation (4) [36,38,39].
P L A B G   f , d i n   dB = 10   β log 10   d 1   m + α + 10 η log 10 f 1   GHz + ɣ σ A B G   ,
where P L A B G f ,   d represents the path loss in dB for frequency and distance, respectively, α and η are coefficients for dependence of path loss associated with frequency and distance, respectively, β is the offset (optimized value) for path loss in dB, d is the three-dimensional distance of transmitter and receiver, f is the carrier frequency (GHz), ɣ σ A B G is the Gaussian random variable with zero mean, and σ is the standard deviation (dB) in large-scale fluctuations of signal. This model is dependent upon 3 + 1 = 4 variables for calculating mean path loss at a certain distance and frequency, where the fourth parameter is the standard deviation of shadowing. The ABG model becomes a floating intercept (FI or AB) model when used at a single frequency which is already in the 3GPP standard.
The CI model is mathematically expressed by Equation (5) [36,38,39].
P L C I f , d i n   dB = F S P L f , d 1 i n   dB + 10   a log 10 d d 1 + ɣ σ C I ,   d     d 1 ,
where f is the frequency (GHz), d 1 is the reference distance for close-in free space, a is the path loss exponent (PLE), ɣ σ C I is the Gaussian random variable with zero mean having a standard deviation of σ in dB, d is the three-dimensional transmitter and receiver distance, and FSPL(f, d1) is the free space path loss (FSPL) in dBs with frequency = f and transmitter receiver separation distance =   d 1 .
In contrast to the ABG model, the CI model needs the PLE only for the calculation of mean path loss with distance and frequency [36,38,39].
The FSPL(f, d1) can be mathematically represented by Equation (6) [36,38,39].
F S P L f ,   d 1 i n   dB = 20   log 10   ( 4 × 3.14 × f × d 1 × 10 9 3 × 10 8 ) .
The FSPL term gives the CI model a basic frequency dependency upon path loss. If the CI model is re-written in terms of 3GPP/ITU format, then it can be mathematically given by Equation (7) [36,38,39].
P L C I f , d i n   dB = F S P L f , d 1 i n   dB + 10 a log 10 d d 1 + ɣ σ C I   ,
P L C I f , d i n   dB = 10   a log 10 d d 1 + 20 log 10 4 × 3.14 × d 1 × 10 9 3 × 10 8 + 20 log 10 f + ɣ σ C I   ,
P L C I f , d i n   dB = 10   a log 10 d d 1 + ϑ + 20 log 10 f + ɣ σ C I ,   d d 1   and   ϑ   =   20 log 10 4 × 3.14 × d 1 × 10 9 3 × 10 8 .
A more simplified arrangement of the CI model is the CIF model which can be used for multi-frequency modeling. Mathematically, the CIF model is expressed by Equation (8) [36,38,39], when d1 = 1 m.
P L C I F f , d i n   dB = F S P L f ,   1   m i n   dB +   10   a   1 + j f f 1 f 1 log 10 d + ɣ σ C I F   ,   d     d 1 ,
where d 1 = 1 m, a is the distance dependence of path loss, j is the linear frequency dependence of path loss in the model, and f 1   is the average frequency. The CIF model can be mathematically expressed in 3GPP form by Equation (9) [36,38,39],
P L C I F f , d i n   dB = F S P L f ,   1   m i n   dB + 10   a 1 + j f f 1   f 1 log 10 d + ɣ σ C I F ,
P L C I F f , d i n   dB = 10   a   1 + j   f f 1 f 1 log 10 d + 20 log 10 4 × 3.14 × 10 9 3 × 10 8 + 20 log 10 f + ɣ σ C I F ,
P L C I F f , d i n   dB = 10   a   1 + j   f f 1 f 1 log 10 d + ʎ + 20 log 10 f +     ɣ σ C I F   ,
For d ≥ 1 m and ʎ = 20 log 10 4 × 3.14 × 10 9 3 × 10 8 = 32.4   dB , f1 is given by Equation (10) [36,38,39].
f 1 = v = 1 V f v N v v = 1 V N v ,
where v is the number of frequencies (unique), N v is the amount of path loss with respect to the v-th frequency (fv), ɣ σ C I F is the Gaussian random variable with zero mean and a standard deviation of σ   (dB).
Since this research work is based upon estimates, for accurate predictions, a model with lower shadow factors and path loss is preferable. Therefore, the single-frequency ABG model, referred to as the FI Model or AB Model, is used for the estimation of mm-wave signal strength given by Equation (11).
P L i n   dB = α + β × 10 log 10 d + x σ ,
where α is the floating intercept, β   is the slope, and x σ   is the shadow factor with reference to frequency.
The CI and CIF models deliver a close-in free space showing a continuous dependence of path loss upon transmitter power and distance [36,38,39]. In contrast, the FI and ABG model does not consider close-in free space propagation happening near a transmitter in the open; however, these models use a floating point constant that is based upon the fit to a data scheme.
The 4G path loss is estimated by the Cost231 model given by Equation (12) [40,41].
  P L i n   dB = 46.3 + 33.9 × log 10 f c + 13.82 × log 10 h t e α h r e + 44.9 6.55 × log 10 h t e × log 10 d + C ,
where f c   is the carrier frequency, α h r e is the frequency correction factor, h t e is the antenna height, d is the distance, and C = 3 dB.
The correction factor   α h r e , is given by Equation (12a).
α h r e = 3.2 × log 10 11.75 × h r e 2 4.97 ,
where h r e is the receiver height.
The correction factor used by authors in [8], shown in Equation (12b), is invalid since the correction factor is used for frequencies less than 300 MHz.
α h r e = 1.1 × log 10 f c 0.7 × h R 1.56 × log 10 f c 0.8 .

2.2. Model Design

The system was designed as follows:
  • A radio environment was used having two circular collocated cells operating on different frequencies and technologies. The radius of cells was assumed to be r. Unlike the conventional system, due to the intelligent handover scheme, the system can decide, depending upon LTE measurements, whether to initiate a measurement gap or vice versa. The mobile users were scattered in a network as per Poisson point process (PPP). The procedure having an intensity parameter of µ denotes the number of likely users per unit area. Let the sum of users be N in coverage area A. Thus, the mean for sampled UEs in Poisson distribution with radius r   of cell becomes   A μ   μ π r 2 . The h-th UE position (independent and identically distributed random variable) was taken from CUD (continuous uniform distribution) in R2 (polar coordinates, i.e., rh, θh). It should be noted that 0 ≤ rh ≤ r, 0 ≤ θh ≤ 2π rad for h = 1, 2, …, N.
  • The model is dependent upon channel coherence time; therefore, measurements pooling time should not surpass it. This is categorized as a temporal measurement window. The number of data points should not surpass the handover attempts (since all UEs do not require handovers).
The radio parameters are given in Table 1:
3.
A classifier (for intelligent handover) with extreme gradient boost (XGBoost) for intervening handovers was used. Authors in [42,43,44] argued that XGBoost has the capability of working with parallel trees depicting a cellular network having multiple distributed base stations. It is also scalable and is adaptable in acquiring higher interactions amongst features. XGBoost is promising in terms of its efficiency and accuracy. Moreover, it turns weaker predictions into strong learners [45].

2.3. XGBoost as a Mathematical Model

Let the parameters gathered be denoted by U p such that the parameter set can be expressed by Equation (13), where individual parameters are denoted by p n .
U p = u p 1 ,   u p 2 ,   ,   u p n ,
Let F 0 be the initial predictive model for output y .
Then, for m numbers of predictive models,
y m = F m .
F 0 ( y F 0 ) associates with residuals.
A new model h 1 is generated to fit the previous step. Thus, h 1 together with F 0 produces F 1 as a boosted F 0 , given by Equations (15)–(15b) and so on.
Thus,
F 1 = F 0 + h 1 ,
F 2 = F 1 + h 2 ,
F m = F 2 + h m .
The additives learners here do not interfere with preceding functions; in fact, new information impacts the reducing errors.
However, for the error margin, the latest model will have less error compared to its predecessor. Thus, if M m denotes the m-th step error, then
M 1 < M 0 ,
M 2 < M 1 ,
M m < M m 1 .
In this algorithm, the deciding factor for F m is h m since it is additional quantities are added. Thus, the quantity of h m drives F m .   Thus,
F m = F m 1 + ε h m ,
where ε is a scaling factor for h m .
If the proposed model generates N trees, then
M o d e l = m = 0 M f m .
The prediction at the l-th step for feature vector x j at data point j   is given by Equation (19).
y j l = m = 1 l f m x j .
The objective function for the proposed algorithm is given by Equation (20).
O b j   θ = L + U ,
where L   regression represents logistic and linear, and U = α R 1 + 0.5   λ R 2 2   + ɣ T , while vector R corresponds to leaf weights, and T represents the number of leaves.
L o g i s t i c = 1 N   i = 1 N ( y i log p i + 1 y i log 1 p i ) , y i = i t h y   v a l u e   f o r   g i v e n   i n p u t , p i = i t h p r o b a b i l i s t i c   v a l u e .
L i n e a r   R e g r e s s i o n = 1 N   i = 1 N y i y i ^ 2   , y i = i t h y   v a l u e   f o r   g i v e n   i n p u t , y i ^ = i t h p r e d i c t e d   v a l u e .
Table 2 provides information regarding the chosen hyperparameters; for tuning of the hyperparameters, the grid search technique was applied to k-fold cross-validation, since the grid search provides the optimized required values.
The required learning features were as follows: (a) UE co-ordinates, (b) Euclidean distance of UE from base station with reference to co-ordinates, (c) RSRP, (d) measurement gap open, and (e) measurement gap closed (measurement gaps with reference to events A2 and A1, respectively). The features ranging from (c) to (e) were obtained from UE; however, specific modifications had to be incorporated in standards of RRC messaging to obtain the information of features given by (a) and (b). Table 3 shows these parameters.
Time complexity was obtained by [42] as n log n + d m a x   E . m n )   O ,   where m n is m × n matrix,   d m a x   is the boosted tree’s maximum depth, and E is the number of estimators (tree). Here, complexity does not represent the number of cells throughout the network; however, it is a function based on measuring the reporting frequency and the number of UEs in a cell.

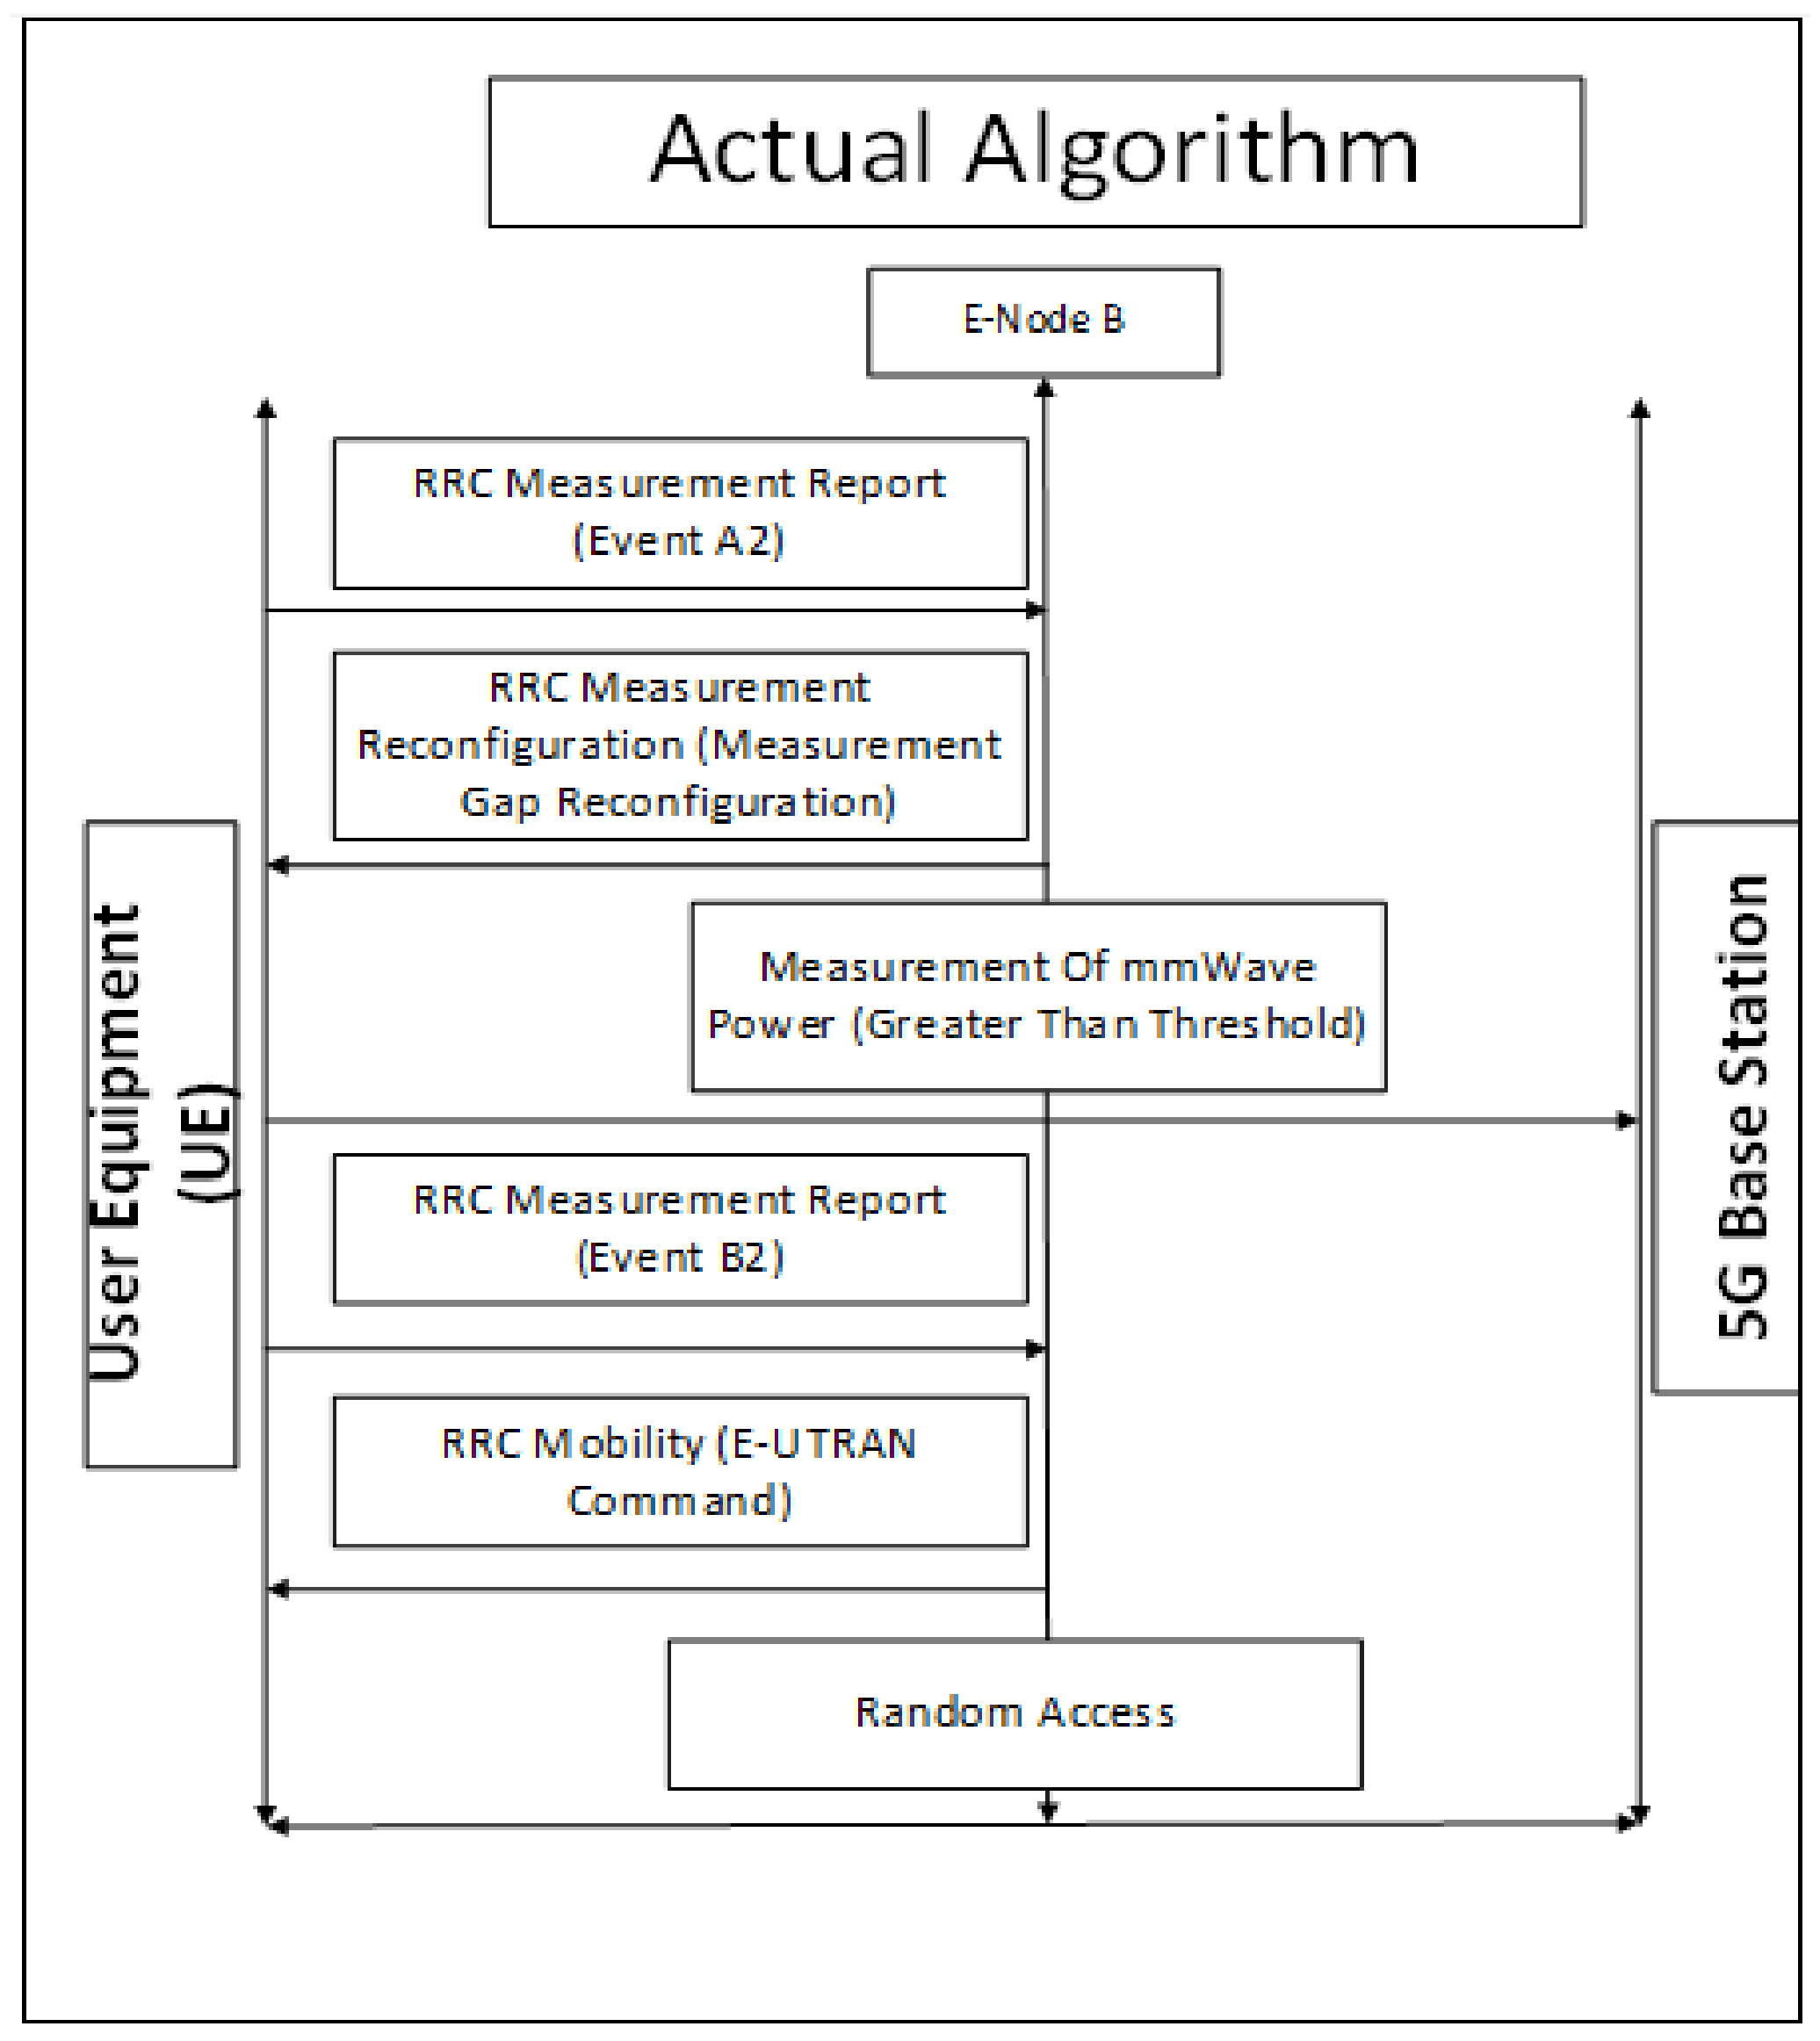
2.4. Actual Handover Algorithm

As per specifications [8,46] when a UE detects weak RSRP compared to a given threshold set by the operator RRC event, A2 gets triggered. Thus, by employing measurement gaps, the inter-RAT measurements initiate. In cases where RSRP gets better, the A1 event gets triggered to cancel inter-RAT measurements.
If UE detects better mm waves, then the B2 event gets triggered and it accesses mm-wave technology; thus, a handover is executed (refer to Figure 1).

2.5. Proposed Algorithm

The proposed algorithm employs an intelligent mathematical approach where it predicts mm-wave conditions in comparison to LTE. Thus, the algorithm is based upon true vs. false positive rates of the area under the curve (AUC) for receiver operating characteristics (ROC); this leads to decisions of whether to override or accept UE measurements.
The proposed technique generates these curves using training and cross-validation to calculate the success or failure of a handover. Therefore, if the ROC AUC is insufficient or if LTE power at UE is inadequate compared to a conventional algorithm’s threshold and if the predicted mm-wave received strength is above the threshold, then our proposed algorithm will not override it.
Conversely, if the calculated mm-wave power is less than the threshold, the proposed algorithm will smartly cease the handover to mm wave, thereby preventing a handover that is probably going to fail. Figure 2 outlines the proposed technique of intelligent handover, with the reduction in steps also shown. Table 4 shows the pseudo code and Figure 3 represents flow chart of proposed algorithm respectively.

3. Results and Discussion

3.1. Cell Level

An arbitrary UE#34 was chosen to examine the conventional vs. intelligent handover algorithm at the cell level. From Table 5 and Figure 4 with the conventional algorithm, a total of 10 handovers were attempted over 40 ms. In contrast, the proposed algorithm identified two possible handover failures prior to a handover attempt due to its smart estimates; thus, it had eight handover attempts in total while preventing two predicted handover failures. The conventional algorithm in this scenario could have led to two simultaneous call drops and inappropriate measurement gaps.
For UE#34, the HSR and DCR (drop call ratio) with the conventional algorithm were 80% and 20%, respectively; with the proposed algorithm, the HSR and DCR were 100% and 0%, respectively, which is a significant achievement.
We validated that the proposed algorithm takes different decisions in comparison to the conventional algorithm when requirements are met. From Figure 4, decisions for handover remained the same until Tsim × 0.7 (which is training period), as shown in the shaded area; however, after the training period, the network behaved like an SON (self-organized network) due to the proposed algorithm network intelligently predicting the success or failure of an approaching handover. Therefore, the proposed algorithm for UE#34 in Figure 4 pre-empted two failures of upcoming handovers between 35 ms and 40 ms, which would have been triggered by the conventional algorithm, eventually leading to inappropriate measurement gaps and consequent handover failures. Figure 5 shows the respective radio measurements.
In order to verify that the estimated mm-wave strength was valid, the proposed mechanism kept on processing AUC for the true positive rate vs. false positive rate through the ROC. The threshold for a valid estimate remained at 0.7. Thus, in cases where the AUC < 0.7, the estimated mm-wave strength was considered as invalid and the handover algorithm proceeded as normal. Figure 6 for UE#34 shows that AUC > 0.7; therefore, the proposed technique estimates were valid, which allowed overriding the conventional algorithm.

3.2. Base Station Level

Although the frequency and its chosen parameters by authors in [8] were invalid, at the base station level, the simulator was nevertheless re-run with the parameters tested by [8] to check the validity of the results. The algorithm is expected to provide the same results as of [8]; however, at certain instances, some inconsistent results appeared. For lower simulation time and lower user density, the inconsistency in results was low; however, as simulation time and user density grew to larger values, the inconsistency increased, as shown in Table 6, Table 7, Table 8, Table 9, Table 10 and Table 11 with bold and underlined values. Therefore, the path loss model proposed herein, as well as the frequency and its valid parameters, was chosen to the check effectiveness of the proposed algorithm. The baseline algorithm in the simulation results represents the conventional handover technique.
Table 12, Table 13 and Table 14 show the results for tests performed with the accurate mathematical model of path loss, along with the valid frequency and its parameters of mm waves, for simulation times of 40 ms, 400 ms, and 800 ms with population densities of 78 and 8, respectively, so that proper comparisons could be made after improving the proposed model. By incorporating the changes, drastic changes and improvements in results can be observed from Table 12, Table 13 and Table 14, whereas the number of handover attempts also increased compared to that claimed in [8]. These handover attempts were not previously detected by the model proposed in [8].
Equation (23) provides the actual progress in HSR with the proposed technique.
I m p r o v e d   H S R   % = T o t a l   H a n d o v e r   A t t e m p t s   H a n d o v e r   F a i l u r e s T o t a l   H a n d o v e r   A t t e m p t s × 100 ,
where Total Handover Attempts refers to attempts with the proposed model, and Handover Failures refers to handover failures with the proposed model.
From Table 12, for a population density of 78 and simulation time of 40 ms, according to the baseline algorithm of [8] the total number of attempts was 1259. However, upon incorporating the above-mentioned corrections, the actual number of attempts according to the proposed model was 1277. This means that 18 attempts were supposed to happen which did not get triggered previously. Moreover, the baseline and proposed techniques which were improved had a lower number of failures compared to the results in [8]. Thus, the improved HSR in this scenario was 97.65%. For the case where the population density was 8, the improved HSR was 96.29%. Figure 7 and Figure 8 shows comparison bar chart for base line vs improved proposed methodology.
Similarly, from Table 13, for a simulation period of 400 ms and population densities of 78 and 8, the improved HSRs were 97.27% and 98.58%, respectively. Table 14 also shows improved HSRs of 98.22% and 97.38%, respectively.
Correspondingly, the improvements obtained in HSR for all scenarios after making necessary corrections were 2.26%, 0.73%, 2.79%, 4.16%, 3.72%, and 2.59%, as shown in Table 12, Table 13 and Table 14. Figure 9 and Figure 10 shows population density plotting and Figure 11, Figure 12, Figure 13 and Figure 14 show comparison bar charts.

4. Conclusions

The simulation results showed that the intelligent handover algorithm, as compared to the conventional algorithm, made significant improvements in HSR. The test results also validate the claim that the previous research work conducted had limitations in selecting the correct path loss equation for 4G technology. Moreover, the corresponding parameter mismatch of mm waves caused inaccurate estimates; thus, the results in [8] were neither accurate nor convincing. However, the results obtained through the improvements proposed herein covered the limitations which hampered the previous results. Therefore, to study the effectiveness of the proposed research algorithm, one should rely on the improved model, since the test results in [8] were not accurate and, thus, cannot be taken as a benchmark.
Upon incorporating corrections, the model showed an increased number of attempts in comparison to [8], which means that the previous model did not allow some handovers which were supposed to happen. However, the improved model, despite the increased number of handover attempts, still showed improvements in HSR. This shows the resilience of the proposed algorithm. Moreover, the improved results were based upon moving users, while [8] did not comment if the results obtained were for moving or static users.
Path loss significantly increases with higher frequencies because it is a function of frequency. However, in the proposed research, HSR showed significant improvements despite the fact that the mm-wave frequency remained at 38 GHz throughout the simulations, which is much higher compared to [8], where 28 GHz was used. Thus, it can be claimed that the proposed work does not have frequency limitations in terms of mm waves, and it can significantly predict the success rate of upcoming handovers in a given band.
The proposed algorithm disagrees with the notion of [8] that the intelligent handover algorithm has to be processed at the base station, because it does not cover what happens if the base station processing power becomes saturated. Therefore, this work recommends the processing algorithm to be available to both the user’s device and the base station such that processing overload can be shared in the case of saturation without compromising QoS.
The proposed technique has a lower number of steps involved for handover compared to the conventional algorithm; therefore, it significantly reduces signaling overhead and also improves the performance of the network. Despite lowering the number of steps, the HSR still showed major improvements compared to the conventional algorithm.

Author Contributions

Conceptualization, S.I.M.; methodology, S.I.M.; software, S.I.M.; validation, S.I.M., S.W.S. and S.N.K.M.; formal analysis, S.I.M., S.W.S., and S.N.K.M.; investigation, S.I.M.; resources, S.I.M., S.W.S., and S.N.K.M.; data curation, S.I.M.; writing—original draft preparation, S.I.M.; writing—review and editing, S.I.M., S.W.S., and S.N.K.M.; visualization, S.I.M.; supervision, S.W.S. and S.N.K.M.; project administration, S.I.M., S.W.S., and S.N.K.M.; funding acquisition, S.I.M. All authors have read and agreed to the published version of the manuscript.

Funding

This was self-funded research work. This research received no external funding.

Conflicts of Interest

The authors declare no conflicts of interest.

References

  1. Rappaport, T.S.; Sun, S.; Mayzus, R.; Zhao, H.; Azar, Y.; Wang, K.; Wong, G.N.; Schulz, J.K.; Samimi, M.; Gutierrez, F. Millimeter Wave Mobile Communications for 5G Cellular: It Will Work! IEEE Access 2013, 1, 335–349. [Google Scholar] [CrossRef]
  2. Xu, X.; Chen, Q.; Jiang, H. LTE-U or mmWave Network: A Network Selection Scheme. In Proceedings of the 2018 10th International Conference on Wireless Communications and Signal Processing (WCSP), Hangzhou, China, 18–20 October 2018. [Google Scholar]
  3. Chergui, H.; Tourki, K.; Lguensat, R.; Benjillali, M.; Verikoukis, C.; Debbah, M. Classification Algorithms for Semi-Blind Uplink/Downlink Decoupling in Sub-6 GHz/mmWave 5G Networks. In Proceedings of the 2019 15th International Wireless Communications & Mobile Computing Conference (IWCMC), Tangier, Morocco, 24–28 June 2019. [Google Scholar]
  4. Feng, B.; Chung, K.L.; Lai, J.; Zeng, Q. A Conformal Magneto-Electric Dipole Antenna With Wide H-Plane and Band-Notch Radiation Characteristics for Sub-6-GHz 5G Base-Station. IEEE Access 2019, 7, 17469–17479. [Google Scholar] [CrossRef]
  5. Waidhuba, M.K.; Tiang, S.S.; Manzoor, S.; Hong, M.V. A Wireless Backhaul using a Massive MIMO—5G NR HetNet design; at Sub-6GHz and MillimetreWave Frequencies. In Proceedings of the 2019 7th International Conference on Smart Computing & Communications (ICSCC), Sarawak, Malaysia, 28–30 June 2019. [Google Scholar]
  6. Coll-Perales, B.; Gozalvez, J.; Gruteser, M. Sub-6GHz Assisted MAC for Millimeter Wave Vehicular Communications. IEEE Commun. Mag. 2019, 57, 125–131. [Google Scholar] [CrossRef] [Green Version]
  7. Jin, G.; Deng, C.; Yang, J.; Xu, Y.; Liao, S. A New Differentially-Fed Frequency Reconfigurable Antenna for WLAN and Sub-6GHz 5G Applications. IEEE Access 2019, 7, 56539–56546. [Google Scholar] [CrossRef]
  8. Mismar, F.B.; Evans, B.L. Partially Blind Handovers for mmWave New Radio Aided by Sub-6 GHz LTE Signaling. In Proceedings of the 2018 IEEE International Conference on Communications Workshops (ICC Workshops), Kansas City, MO, USA, 20–24 May 2018. [Google Scholar]
  9. Garcia, N.; Wymeersch, H.; Slock, D.T. Optimal Precoders for Tracking the AoD and AoA of a mmWave Path. IEEE Trans. Signal Process. 2018, 66, 5718–5729. [Google Scholar] [CrossRef] [Green Version]
  10. Qin, Q.; Gui, L.; Cheng, P.; Gong, B. Time-Varying Channel Estimation for Millimeter Wave Multiuser MIMO Systems. IEEE Trans. Veh. Technol. 2018, 67, 9435–9448. [Google Scholar] [CrossRef]
  11. Zhu, D.; Choi, J.; Heath, R.W. Auxiliary Beam Pair Enabled AoD and AoA Estimation in Closed-Loop Large-Scale Millimeter-Wave MIMO Systems. IEEE Trans. Wirel. Commun. 2017, 16, 4770–4785. [Google Scholar] [CrossRef]
  12. Song, X.; Haghighatshoar, S.; Caire, G. Efficient Beam Alignment for Millimeter Wave Single-Carrier Systems With Hybrid MIMO Transceivers. IEEE Trans. Wirel. Commun. 2019, 18, 1518–1533. [Google Scholar] [CrossRef]
  13. Yang, J.; Wei, Z.; Zhang, X.; Li, N.; Sang, L. Correlation Based Adaptive Compressed Sensing for Millimeter Wave Channel Estimation. In Proceedings of the 2017 IEEE Wireless Communications and Networking Conference (WCNC), San Francisco, CA, USA, 19–22 March 2017. [Google Scholar]
  14. Sun, S.; Rappaport, T.S. Millimeter Wave MIMO channel estimation based on adaptive compressed sensing. In Proceedings of the 2017 IEEE International Conference on Communications Workshops (ICC Workshops), Paris, France, 21–25 May 2017. [Google Scholar]
  15. Rusu, C.; González-Prelcic, N.; Heath, R.W. Low resolution adaptive compressed sensing for mmWave MIMO receivers. In Proceedings of the 2015 49th Asilomar Conference on Signals, Systems and Computers, Pacific Grove, CA, USA, 8–11 November 2015. [Google Scholar]
  16. Liao, A.; Gao, Z. Super-Resolution Channel Estimation for mmWave Massive MIMO. In Proceedings of the 2018 IEEE International Conference on Communications (ICC), Kansas City, MO, USA, 20–24 May 2018. [Google Scholar]
  17. Zhou, Z.; Fang, J.; Yang, L.; Li, H.; Chen, Z.; Blum, R.S. Low-Rank Tensor Decomposition-Aided Channel Estimation for Millimeter Wave MIMO-OFDM Systems. IEEE J. Sel. Areas Commun. 2017, 35, 1524–1538. [Google Scholar] [CrossRef]
  18. Yeh, C.; Hsu, K.; Chi, J.; Huang, Y. Adaptive Simultaneous Orthogonal Matching Pursuit for mmWave Hybrid Beam Tracking. In Proceedings of the 2018 IEEE 23rd International Conference on Digital Signal Processing (DSP), Shanghai, China, 19–21 November 2018. [Google Scholar]
  19. Weiland, L.; Stöckle, C.; Würth, M.; Weinberger, T.; Utschick, W. OMP with Grid-Less Refinement Steps for Compressive mmWave MIMO Channel Estimation. In Proceedings of the 2018 IEEE 10th Sensor Array and Multichannel Signal Processing Workshop (SAM), Sheffield, UK, 8–11 July 2018. [Google Scholar]
  20. Lee, J.; Gil, G.; Lee, Y. Channel Estimation via Orthogonal Matching Pursuit for Hybrid MIMO Systems in Millimeter Wave Communications. IEEE Trans. Commun. 2016, 64, 2370–2386. [Google Scholar] [CrossRef]
  21. Zhong, W.; Xu, L.; Zhu, Q.; Chen, X.; Zhou, J. MmWave beamforming for UAV communications with unstable beam pointing. China Commun. 2019, 16, 37–46. [Google Scholar]
  22. Uwaechia, A.N.; Mahyuddin, N.M.; Ain, M.F.; Latiff, N.M.; Za’bah, N.F. On the Spectral-Efficiency of Low-Complexity and Resolution Hybrid Precoding and Combining Transceivers for mmWave MIMO Systems. IEEE Access 2017, 7, 109259–109277. [Google Scholar] [CrossRef]
  23. Polese, M.; Giordani, M.; Mezzavilla, M.; Rangan, S.; Zorzi, M. Improved Handover Through Dual Connectivity in 5G mmWave Mobile Networks. IEEE J. Sel. Areas Commun. 2017, 35, 2069–2084. [Google Scholar] [CrossRef] [Green Version]
  24. Ghosh, A.; Thomas, T.A.; Cudak, M.C.; Ratasuk, R.; Moorut, P.; Vook, F.W.; Rappaport, T.S.; MacCartney, G.R.; Sun, S.; Nie, S. Millimeter-Wave Enhanced Local Area Systems: A High-Data-Rate Approach for Future Wireless Networks. IEEE J. Sel. Areas Commun. 2014, 32, 1152–1163. [Google Scholar] [CrossRef]
  25. Chen, J.; Wang, Y.; Li, Y.; Wang, E. QoE-Aware Intelligent Vertical Handoff Scheme Over Heterogeneous Wireless Access Networks. IEEE Access 2018, 6, 38285–38293. [Google Scholar] [CrossRef]
  26. Ying, G.; Qingmin, M.; Xiaoming, W. Energy-Optimized 5G Dual Connectivity Radio Resource Allocation. In Proceedings of the 2019 IEEE 2nd International Conference on Electronics Technology (ICET), Chengdu, China, 10–13 May 2019. [Google Scholar]
  27. Monteiro, V.F.; Sousa, D.A.; Maciel, T.F.; Cavalcanti, F.R.; e Silva, C.F.; Rodrigues, E.B. Distributed RRM for 5G Multi-RAT Multiconnectivity Networks. IEEE Syst. J. 2019, 13, 192–203. [Google Scholar] [CrossRef]
  28. Jain, A.; Lopez-Aguilera, E.; Demirkol, I. Evolutionary 4G/5G Network Architecture Assisted Efficient Handover Signaling. IEEE Access 2018, 7, 256–283. [Google Scholar] [CrossRef]
  29. Jain, A.; Lopez-Aguilera, E.; Demirkol, I. Enhanced Handover Signaling through Integrated MME-SDN Controller Solution. In Proceedings of the 2018 IEEE 87th Vehicular Technology Conference (VTC Spring), Porto, Portugal, 3–6 June 2018. [Google Scholar]
  30. Jain, A.; Lopez-Aguilera, E.; Demirkol, I. Improved Handover Signaling for 5G Networks. In Proceedings of the 2018 IEEE 29th Annual International Symposium on Personal, Indoor and Mobile Radio Communications (PIMRC), Bologna, Italy, 9–12 September 2018. [Google Scholar]
  31. Gonzalez-Prelcic, N.; Ali, A.; Va, V.; Heath, R.W. Millimeter-Wave Communication with Out-of-Band Information. IEEE Commun. Mag. 2017, 55, 140–146. [Google Scholar] [CrossRef] [Green Version]
  32. Ali, A.; Gonzalez-Prelcic, N.; Heath, R.W. Millimeter Wave Beam-Selection Using Out-of-Band Spatial Information. IEEE Trans. Wirel. Commun. 2018, 17, 1038–1052. [Google Scholar] [CrossRef]
  33. Xiu, Y.; Wang, W.; Zhang, Z. A Message Passing Approach to Acquire mm-Wave Channel State Information Based on Out-of-Band Data. IEEE Access 2018, 6, 45665–45680. [Google Scholar] [CrossRef]
  34. Yan, L.; Ding, H.; Zhang, L.; Liu, J.; Fang, X.; Fang, Y.; Xiao, M.; Huang, X. Machine Learning-Based Handovers for Sub-6 GHz and mmWave Integrated Vehicular Networks. IEEE Trans. Wirel. Commun. 2018, 18, 4873–4885. [Google Scholar] [CrossRef]
  35. Nishio, T.; Okamoto, H.; Nakashima, K.; Koda, Y.; Yamamoto, K.; Morikura, M.; Asai, Y.; Miyatake, R. Proactive Received Power Prediction Using Machine Learning and Depth Images for mmWave Networks. IEEE J. Sel. Areas Commun. 2019, 37, 2413–2427. [Google Scholar] [CrossRef] [Green Version]
  36. Rappaport, T.S.; Xing, Y.; MacCartney, G.R.; Molisch, A.F.; Mellios, E.; Zhang, J. Overview of Millimeter Wave Communications for Fifth-Generation (5G) Wireless Networks—With a Focus on Propagation Models. IEEE Trans. Antennas Propag. 2017, 65, 6213–6230. [Google Scholar] [CrossRef]
  37. Lodro, M.M.; Majeed, N.; Khuwaja, A.A.; Sodhro, A.H.; Greedy, S. Statistical channel modelling of 5G mmWave MIMO wireless communication. In Proceedings of the 2018 International Conference on Computing, Mathematics and Engineering Technologies (iCoMET), Sukkur, Pakistan, 3–4 March 2018. [Google Scholar]
  38. Sun, S.; Rappaport, T.S.; Thomas, T.A.; Ghosh, A.; Nguyen, H.C.; Kovács, I.Z.; Rodriguez, I.; Koymen, O.; Partyka, A. Investigation of Prediction Accuracy, Sensitivity, and Parameter Stability of Large-Scale Propagation Path Loss Models for 5G Wireless Communications. IEEE Trans. Veh. Technol. 2016, 65, 2843–2860. [Google Scholar] [CrossRef]
  39. Sun, S.; MacCartney, G.R.; Rappaport, T.S. Millimeter-wave distance-dependent large-scale propagation measurements and path loss models for outdoor and indoor 5G systems. In Proceedings of the 2016 10th European Conference on Antennas and Propagation (EuCAP), Davos, Switzerland, 10–15 April 2016. [Google Scholar]
  40. Rappaport, T.S. Wireless Communications Principles and Practice, 2nd ed.; Prentice Hall PTR: Upper Saddle River, NJ, USA, 2002. [Google Scholar]
  41. Sharma, P.K.; Sharma, D.; Sai, T.V. Optimization of Propagation Path Loss Model in 4G Wireless Communication Systems. In Proceedings of the Proceedings of the Second International Conference on Inventive Systems and Control (ICISC 2018), Coimbatore, India, 19–20 January 2018. [Google Scholar]
  42. Chen, T.; Guestrin, C. XGBoost: A Scalable Tree Boosting System. In Proceedings of the KDD ’16 Proceedings of the 22nd ACM SIGKDD International Conference on Knowledge Discovery and Data Mining, San Francisco, CA, USA, August 2016; pp. 785–794. [Google Scholar]
  43. Yang, L.; Li, Y.; Di, C. Application of XGBoost in Identification of Power Quality Disturbance Source of Steady-state Disturbance Events. In Proceedings of the 2019 IEEE 9th International Conference on Electronics Information and Emergency Communication (ICEIEC), Beijing, China, 12–14 July 2019. [Google Scholar]
  44. Jiang, Y.; Tong, G.; Yin, H.; Xiong, N. A Pedestrian Detection Method Based on Genetic Algorithm for Optimize XGBoost Training Parameters. IEEE Access 2019, 7, 118310–118321. [Google Scholar] [CrossRef]
  45. Liao, X.; Cao, N.; Li, M.; Kang, X. Research on Short-Term Load Forecasting Using XGBoost Based on Similar Days. In Proceedings of the 2019 International Conference on Intelligent Transportation, Big Data & Smart City (ICITBS), Changsha, China, 12–13 January 2019. [Google Scholar]
  46. ETSI. 2020. Available online: https://www.etsi.org/deliver/etsi_ts/136300_136399/136331/15%20.03.00_60/ts_136331v150300p.pdf (accessed on 8 February 2020).
Figure 1. Actual algorithm for handover.
Electronics 09 00545 g001
Figure 2. Proposed algorithm for handover (reduced steps and signaling overhead shown).
Electronics 09 00545 g002
Figure 3. Flowchart of proposed algorithm.
Electronics 09 00545 g003
Figure 4. Proposed vs. baseline algorithm.
Electronics 09 00545 g004
Figure 5. RSRP of UE#34. On X-axis, blue, red, and green lines represent the thresholds of RRC events A1, A2, and B2, respectively.
Electronics 09 00545 g005
Figure 6. ROC curve for UE#34.
Electronics 09 00545 g006
Figure 7. Comparison bar chart.
Electronics 09 00545 g007
Figure 8. Comparison bar chart.
Electronics 09 00545 g008
Figure 9. Population density graph for 78 users.
Electronics 09 00545 g009
Figure 10. Population density graph for eight users.
Electronics 09 00545 g010
Figure 11. Comparison bar chart.
Electronics 09 00545 g011
Figure 12. Comparison bar chart.
Electronics 09 00545 g012
Figure 13. Comparison bar chart.
Electronics 09 00545 g013
Figure 14. Comparison bar chart.
Electronics 09 00545 g014
Table 1. Radio parameters.
ParameterSimulated ValueParameterSimulated Value
Radio propagation models4G cost 231 model, 5G floating intercept model (LOS, NLOS)Simulation time (Tsim)40 ms, 400 ms and 800 ms
Floating intercept model values (α, β, σ)116.77, 0.41, 5.96Cell coverage radius (r)350 meters
RRC events time to trigger (TTT)0 sBase station power (5G)46 dBm
Event A1 (RRC) trigger125 dBm (negative)Base station power (LTE)46 dBm
Event A2 (RRC) trigger130 dBm (negative)Radio propagation (antenna)Omnidirectional
Event B2 (RRC) trigger95 dBm (negative)Height (antenna)36 m
LTE center frequency2100 MHzSub-6 GHz (antenna gain)17 dBi
LTE bandwidth20 MHzmm wave (antenna gain)24 dBi
Cyclic prefix (LTE)NormalCellular coverage patternCircular
5G mm-wave center frequency38 GHzUser height1.5 meters
5G mm-wave bandwidth100 MHzPoisson point parameter (µ)2 × {10−5, 10−4, 10−3}
Average UE speed0.25 m/s to 5.54 m/s--
Table 2. Hyperparameters.
ParametersValue
(dmax) Maximum depth6, 8
Training data0.7
Child weights0, 10
ObjectiveLogistic, linear
(k) Cross-validation5
(E) Estimator number500
Weights of samples0.5, 0.7
Lambdas0, 1, 2
(γ) Complexity control0, 0.002
Table 3. Learning features.
ParameterDescriptionType
Gap openA2 reported by UE as per RSRP measurements0,1 (Boolean)
Gap closedA1 reported by UE as per RSRP measurements0,1 (Boolean)
(x, y)UE co-ordinatesFloating
RSRPLTE, mm wave = RSRPFloating
DistanceEuclidean distanceFloating
Table 4. Pseudo code.
Proposed algorithm
Input: All radio parameters of 4G and mm waves, optimized hyperparameters, margins for decision overriding, and simulation time
1For N UEs, compute 4G and mm-wave signal strength with desired radio parameters
2If mm-wave signal strength is greater than threshold, then estimate handover success (if mm-wave signal strength for i -th UE is better than 4G in measurement gap, then controlling feature y i = U E i )
3Tune hyperparameters through grid search on K-fold cross-validation
4Introduce training data split for training, testing, and validation, Time for training model = training data split × simulation time
5XGboost model training
6Find proposed model handover decision (0 or 1)
7Plot true positive vs. false positive rate (receiver operating characteristic (ROC) area under the curve (AUC))
8If
 ROC AUC > decision threshold
Then
 Proceed with proposed algorithm
9Else
 Proceed with conventional algorithm
End
Output: Show whether UE shall pre-empt handover to mm waves or override its proposed algorithm
Table 5. UE#35 conventional vs. proposed algorithm handover data. HSR—handover success rate; DCR—drop call ratio.
Conventional AlgorithmProposed Algorithm
Handover AttemptsCall DropsHSRDCRHandover AttemptsCall DropsHSRDCR
10280%20%80%100%0%
Table 6. Inconsistencies in results.
Simulated TimePopulationAlgorithmClaimed AttemptsRerun AttemptsClaimed FailuresRerun FailuresPrevious Success RateRerun Success Rate
40 ms78Baseline12591259585895.39%95.39%
Proposed12591259555695.63%95.55%
Claimed refers to the results of [8]; rerun refers to results obtained after rerunning the simulator with the same parameters as [8]. This also applies to Table 7, Table 8, Table 9, Table 10 and Table 11.
Table 7. Inconsistencies in results.
Simulated TimePopulationAlgorithmClaimed AttemptsRerun AttemptsClaimed FailuresRerun FailuresClaimed Success RateRerun Success Rate
40 ms8Baseline1351356695.56%95.55%
Proposed1351356695.56%95.55%
Table 8. Inconsistencies in results.
Simulated TimePopulationAlgorithmClaimed AttemptsRerun AttemptsClaimed FailuresRerun FailuresClaimed Success RateRerun Success Rate
400 ms78Baseline12,60112,60169569594.48%94.48%
Proposed12,60112,60145046096.43%96.34%
Table 9. Inconsistencies in results.
Simulated TimePopulationAlgorithmClaimed AttemptsRerun AttemptsClaimed FailuresRerun FailuresClaimed Success RateRerun Success Rate
400 ms8Baseline12541254707094.42%94.41%
Proposed12541254131598.96%98.80%
Table 10. Inconsistencies in results.
Simulated TimePopulationAlgorithmClaimed AttemptsRerun AttemptsClaimed FailuresRerun FailuresClaimed Success RateRerun Success Rate
800 ms78Baseline25,07025,0701378137894.50%94.50%
Proposed25,07025,07075760996.98%97.57%
Table 11. Inconsistencies in results.
Simulated TimePopulationAlgorithmClaimed AttemptsRerun AttemptsClaimed FailuresRerun FailuresClaimed Success RateRerun Success Rate
800 ms8Baseline2535253513213294.79%94.79%
Proposed25352535191099.25%99.60%
Table 12. Improvements in HSR with the improved algorithms.
TimeNAlgorithm(Old) Attempts(Improved) Attempts(Old) Failures(Improved) Failures(Old) Baseline HSR(Improved) Proposed HSR
40 ms78Baseline12591277583895.39%97.65%
Proposed125912775530
40 ms8Baseline1351356495.56%96.29%
Proposed13513565
Old refers to the results from [8]; improved refers to the results obtained after corrections. This also applies to Table 13 and Table 14.
Table 13. Improvements in HSR with improved algorithms.
TimeNAlgorithm(Old) Attempts(Improved) Attempts(Old) Failures(Improved) Failures(Old) Success Rate(Improved) Success Rate
400 ms78Baseline12,60112,73169549694.48%97.27%
Proposed12,60112,731450347
400 ms8Baseline12541268705394.42%98.58%
Proposed125412681318
Table 14. Improvements in HSR with improved algorithms.
TimeNAlgorithm(Old) Attempts(Improved) Attempts(Old) Failures(Improved) Failures(Old) Success Rate(Improved) Success Rate
800 ms78Baseline25,07025,318137897794.50%98.22%
Proposed25,07025,318757450
800 ms8Baseline253525641329794.79%97.38%
Proposed253525641967

