1. Introduction
It is known that the reception and analysis of the secondary electromagnetic emissions created during electronic data processing equipment operation allow the information processed by this equipment to be reconstructed [
1,
2,
3,
4]. In these cases, the aforementioned emissions directly constitute the information carrier [
5,
6,
7]. Additive manufacturing printers do not have such emission sources [
8]. The information may be reconstructed using the advance analysis methods for the signals from the indirect sources. The initial studies showed that these sources are the printing head positioning system components. It was also stated that the printed object shapes cannot be recreated based on the electromagnetic emissions. This results from the stepping motor operation control methods (the tested printer was equipped with the NEMA 17, bipolar, four-cable electrical motor [
9]) where many signals with similar structure are present at the same time and their related electromagnetic emissions interfere with each other.
Considering possible remote three-dimensional (3D) printer infiltration, the potential secondary channels were determined:
The latter part of the article focuses on the analysis of the acoustic signals generated by the operating 3D printer.
The paper presents the preliminary results of tests and analysis regarding the possibility of acoustic eavesdropping of 3D printers. The results are very promising. In practice, objects with a complex spatial structure are printed. However, because the printer head H can only move in the X and Y directions, even a complex structure can be created as a result of the assembly of such elementary movements. In order to confirm the assumption that head H movements are a source of compromising emissions, a correlation study of recorded sounds and head movements was conducted. At the beginning, simple shapes were printed: ruler, angle bar, cube. Then, more complex objects were analysed: a trihedron and a tube, which allowed to carry out the analysis of diagonal (relative to the X and Y axes) and along the arc movements. The objects with more sophisticated shapes will be tested in subsequent studies. In this stage, vibration signals will be measured also. The ability to reproduce the shape of printed elements based on acoustic signals can be important for both industry and scientific institutions, where a lot of prototypes of various objects are created. Such works must be protected before being placed on the market.
In [
8], the authors reconstruct an original object based on acoustic signals. They reproduce the G-code that controls the operation of the printer. G-code means “geometric code”. Its main function is to instruct the 3D printer head how to move in three dimensions. However, it can also instruct the printer to perform other tasks. For example, G-code commands may instruct the 3D printer to extrude material at a specific extrusion rate or change the filament temperature. In formal terms, it is a numerically controlled programming language. G-codes are described in ISO 6983, DIN 66025.
Also in [
13], authors use the acoustic signal to reconstruct G-code. They analyse a complex object. But the object contains only diagonal, vertical and horizontal lines. The results obtained show that there are possibilities to reconstruct the original object. The authors present the same results in [
4]. They show that power signals, vibrating signals and magnetic fields contain information about the printed object.
The analysis carried out is based on only acoustic signals and their spectrograms. The article shows that based on the analysis of acoustic signals it is possible to determine the movements of the head H not only in directions consistent with the X and Y axes but also diagonal relative to the X and Y axes) and along a circle.
This paper is organized as follows. The 3D printing mechanism and test conditions are described in
Section 2 and
Section 3.
Section 4 and
Section 5 represent the test and analyses results corresponding to experimental results and discussions. Finally, conclusions are presented in
Section 6.
2. Three-Dimensional (3D) Printing Mechanism
Three-dimensional printers are increasinglyimportant in various areas of life; they are used to design and manufacture various of industrial, medical, scientific facilities etc. The object can be designed using popular CAD (computer-aided design) applications and printed after converting to a file accepted by the printer (
Figure 1).
The studies used the M200 Plus printer by ZORTRAX. It is a printer based on the ME3DP (Material Extrusion 3D Printing) technology that uses thermoplastic material in the production process, i.e., molten plastic is used to form object shapes at high temperatures. The models printed using this technology are created by applying the individual layers of semi-liquid material extruded from the heated nozzle. The material is a vein of constant diameter (1.75 mm or 2.85 mm) wound onto a spool, commonly known as a filament.
Due to the printhead positioning method, there are at least two types of ME3DE printers where the head is moved in the
X,
Y or Z axis by the stepping motors (
Figure 2). The manufactures have used two solutions that provide a set 3D printout. The first solution concerns control of the printhead (
H) movement in the
X and
Y axes and platform (
P) movement in the
Z axis (
Figure 2a). The other solution includes the platform movement in the
X and
Y axes and the printhead movement in the Z axis (
Figure 2b). The printhead of the tested 3D printer is positioned in the
X and
Y axes.
The studies and analyses presented in this article focus primarily on the acoustic signals generated by the printer. Their correlation with the movements of printhead and platform was examined, as well as the possibility of reproducing the printed object based on the characteristic features of the measured signals [
13]. These signals can be identified as disclosing (compromising) emissions.
3. Test Conditions
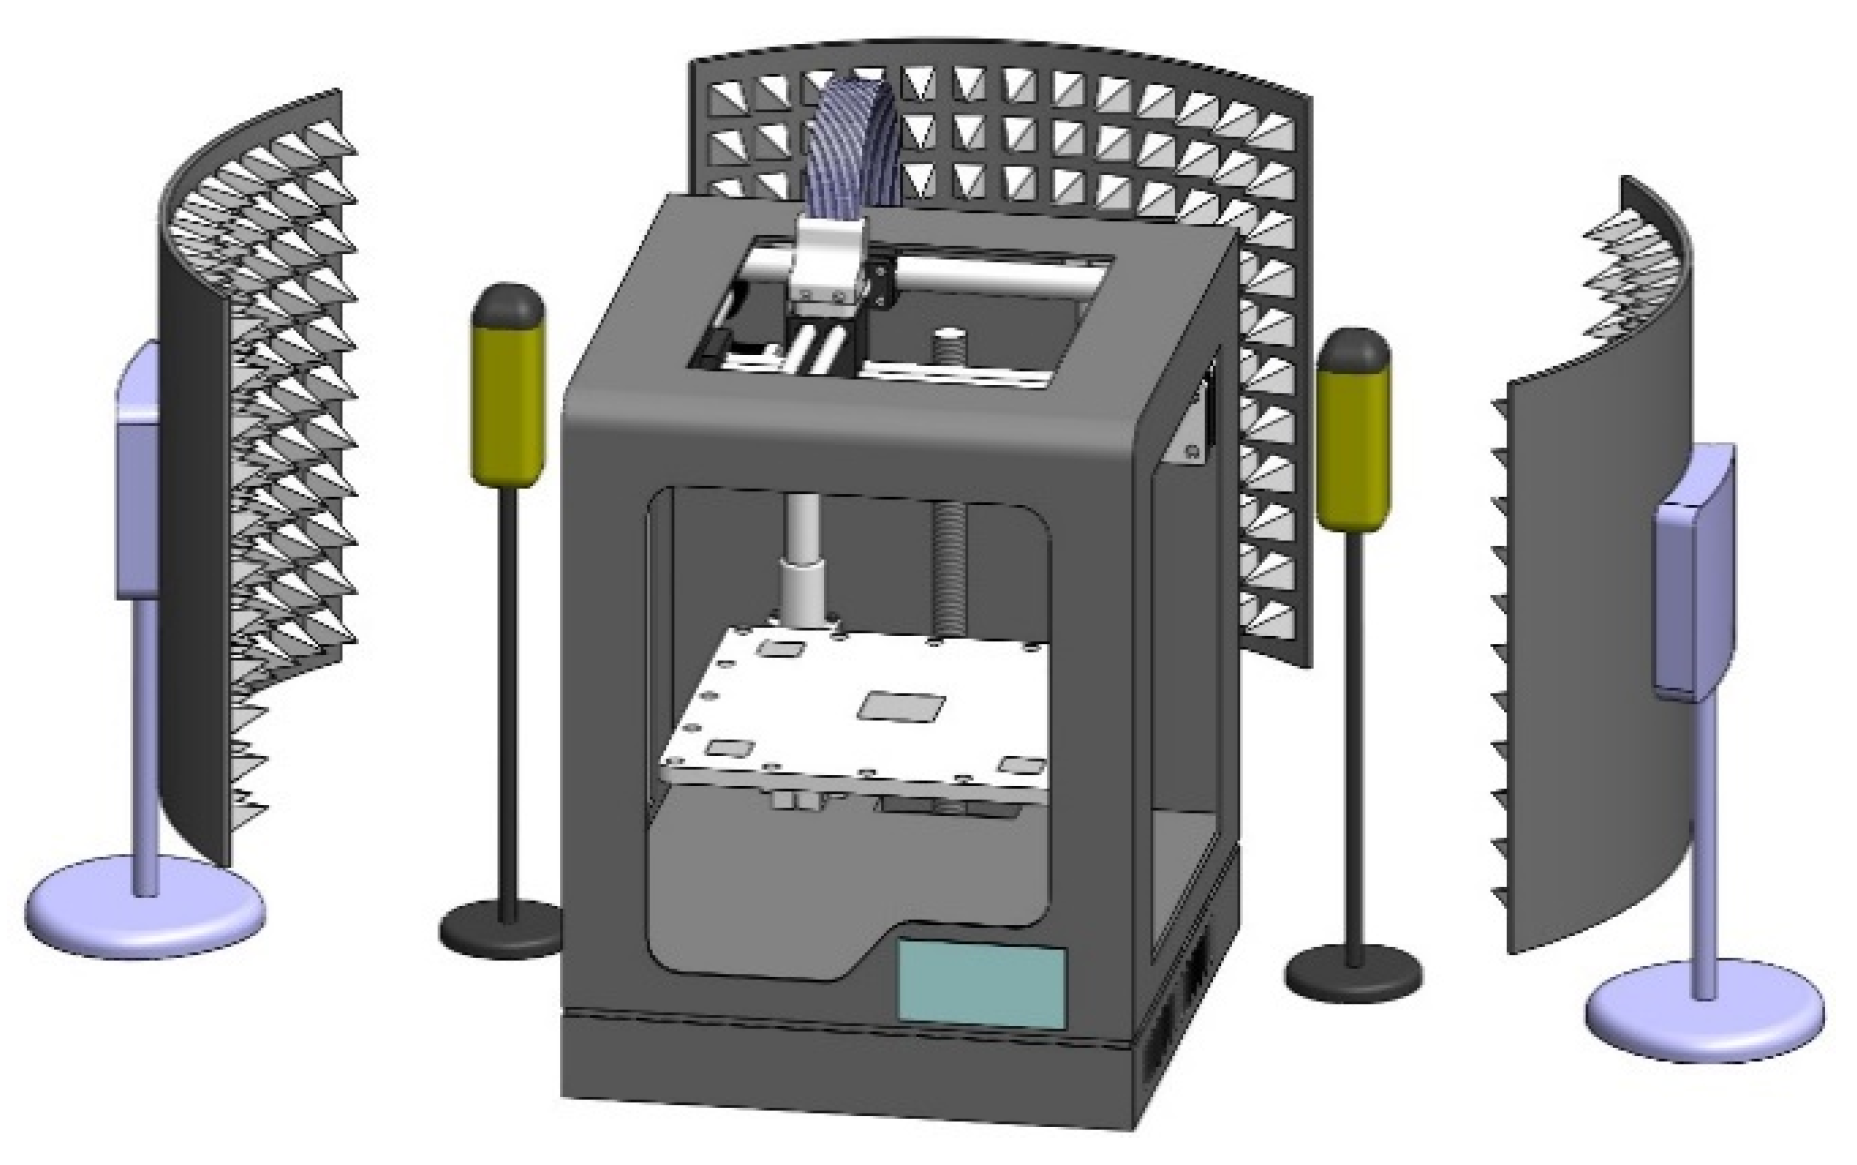
Figure 3 shows the overall view of the tested 3D printer. The signals were recorded next to each stepper motor. The recorded acoustic signals were analysed with Audacity. The sampling frequency was 48,000 Hz, the sound was recorded with the Behringer C-1U microphone. In addition, sound-absorbing guards were used to reduce the acoustic signals from the room where the measurements were performed (
Figure 4).
Three objects were printed during tests (
Figure 5). The acoustic signals were recorded for the printhead movements when printing these objects. The printhead was moving:
in a straight line, along the X axis;
in a straight line, along the Y axis;
in a straight line positioned at 45° in relation to the X and Y axes;
along the arc.
Selected object shapes allowed to observe the movement of the printhead in two basic directions (X and Y) and to look for the distinctive features of sound signals correlated with the objects’ printing phases. The time courses and spectrograms of acoustic signals were the basis of the analysis.
4. Test and Analyses Results
Figure 6 shows the spectrograms based on the acoustic signals recorded when printing the trihedron. They clearly show that the head movements and the resulting printed object shape can be identified. One can distinguish a few characteristic printing steps for this object to recreate the printed shape basing on the recorded acoustic signals. These steps are marked as I, II, III, IV, V and VI, and P1, P2, P3, P4, P5 and P6. They are defined as follows:
- P1, P2
the printhead performs the positioning movements (without printing), the platform is lowered by one level;
- I
the printhead prints the side of trihedron (oter path) from point A to B;
- II
the printhead prints the hypotenuse (outer path) from point B to C;
- III
the printhead prints the side of trihedron (outer path) from point C to A;
- P3
the printhead performs the positioning movements (no printing);
- IV
the printhead prints the hypotenuse (inner path) from point C to B;
- V
the printhead prints the side of trihedron (inner path) from point B to A;
- VI
the printhead prints the side of trihedron (inner path) from point A to C;
- P4, P5, P6
the printhead performs the positioning movements (without printing), the platform is lowered by one level.
The dark vertical stripes across the spectrum width (
Figure 6) refer to the idle speed of printhead (without printing) during P1, P2, P3, P4, P5 and P6. The printhead is moving in the directions indicated by the green arrows. The spectrum density from a few hertz to approx. 4 kHz, marked on the spectrogram with pink rectangles, indicates the platform movement.
The spectrogram in
Figure 6 shows that the movement of the printhead in a straight line, along the
X or
Y axis, produces an acoustic signal of a certain frequency. When printing the tube another situation can be observed (
Figure 5b) where the movement of the printhead along an arc line causes the frequency-modulated signals (
Figure 7).
One can distinguish the characteristic printing steps for this object marked as I, II, III, IV, V, VI, VII and VIII, and P1 and P2 in
Figure 7. These steps may be defined as follows:
- P1
the printhead performs the positioning movements (without printing), the platform is lowered by one level;
- I
the printhead prints the wall of tube (outer path, perimeter quarter I), along the arc from point A to B;
- II
the printhead prints the wall of tube (outer path, perimeter quarter II), along the arc from point B to C;
- III
the printhead prints the wall of tube (outer path, perimeter quarter III), along the arc from point C to D;
- IV
the printhead prints the wall of tube (outer path, perimeter quarter IV), along the arc from point D to A;
- P2
the printhead performs the positioning movements (without printing);
- V
the printhead prints the wall of tube (inner path, perimeter quarter IV), along the arc from point A to D;
- VI
the printhead prints the wall of tube (inner path, perimeter quarter III), along the arc from point D to C;
- VII
the printhead prints the wall of tube (inner path, perimeter quarter II), along the arc from point C to B;
- VIII
the printhead prints the wall of tube (inner path, perimeter quarter I), along the arc from point B to A;
- P1
the printhead performs the positioning movements (without printing), the platform is lowered by one level.
One can observe that the spectrum densities within 19 kHz and 21 kHz for the L channel (left motor) are correlated for the respective printing steps as indicated with the colour triangles in the spectrogram. Step I and VIII (blue triangle), step II and VII (yellow triangle), step II and VI (white triangle) and step IV and V (green triangle) are the mirror reflection of each other in the graphical representation of the spectrum density of the measured acoustic signal. This is due to the fact that during these two step pairs the same arc quarters are printed but the printhead faces the reversed directions. Additionally, the printhead movement trajectory during steps I–IV includes the outer path of the printed wall and during steps V–VII – the inner path.
The similar spectrum correlation during the above-mentioned steps is observed for the R channel (right motor). The significant parts are marked with colour rectangles using the colour scheme as per the L channel. Relation of the respective spectrum areas marked with the triangles and rectangles can be used to determine the printed object quarter.
The printhead movement direction during printing is not the only significant part of the printed shape recreation process. The printhead movement turn is an important factor of this process. The tetrahedron (
Figure 5c) was printed to identify the characteristics of this phenomenon. In this case, the printhead is performing two movements along the
X or
Y axis in the opposed turns. When presenting the recorded sound signal measured from the left motor as a spectrogram one can identify the direction and turn of the printhead movement. The characteristic printing steps marked as I, II, III, IV, V, VI, VII and VIII, and P1 and P2 in
Figure 8 can be identified for this object. They are characterised as follows:
- P1
the printhead performs the positioning movements (without printing), the platform is lowered by one level;
- I
the printhead print the outer path of the tetrahedron from point A to B;
- II
the printhead prints the outer path of the tetrahedron from point B to C;
- III
the printhead prints the outer path of the tetrahedron from point C to D;
- IV
the printhead prints the outer path of the tetrahedron from point D to A;
- P2
the printhead performs the positioning movements (without printing);
- V
the printhead prints the inner path of the tetrahedron from point B to A;
- VI
the printhead prints the inner path of the tetrahedron from point A to D;
- VII
the printhead prints the inner path of the tetrahedron from point D to C;
- VIII
the printhead prints the inner path of the tetrahedron from point C to B;
- P1
the printhead performs the positioning movements (without printing), the platform is lowered by one level.
The respective printing steps are marked with the colour rectangles in the spectrogram: step I and V (blue), step II and VIII (yellow), step III and VII (white) and step IV and VI (green).
When comparing the aforementioned step pairs, distinctive features can be observed that one can use to determine both the direction and the turn of the head movement when printing the respective lines:
for step I–X axis movement, left turn (from A to B), noise occurring within 14–23 kHz,
for step V–X axis movement, right turn (from B to A), clear line visible at 19 kHz;
for step II–Y axis movement, downwards turn (from B to C), a number of right inclined lines visible within 19–20 kHz;
for step VIII–Y axis movement, upwards turn (from C to B), a number of left inclined lines visible within 19–20 kHz;
for step III–X axis movement, right turn (from C to D), clear line visible at 19 kHz;
for step VII–X axis movement, left turn (from D to C), noise occurring within 14–23 kHz;
for step IV–Y axis movement, upwards turn (from D to A), a number of left inclined lines visible within 19–20 kHz;
for step VI–Y axis movement, downwards turn (from A to D), a number of right inclined lines visible within 19–20 kHz.
Using the analysis of the characteristic features connected with the signals with the respective harmonic amplitudes that occur in the defined time frame one can recreate the printed shapes basing on the spectrogram. It should be emphasized that the acoustic signals measured at the output of Information Infiltration Channel (IIC) output are affected by the noise and other channel disturbances. This situation renders the accurate time analysis impossible to determine the printing start and finish time (printhead movement) based on the acquired spectrograms. Thus, the printed shapes are recreated with some errors connected with the incorrect length of the straight lines or wall arches of the printed elements, among other things. However, when the speed and time of the printhead movement are known, determined based on the step duration specified in the spectrograms, one can estimate the printed shape dimensions basing on the graphical images [
14,
15,
16].
5. Discussions
For the tested 3D printer the printhead movement speeds are as follows:
for the directions along the X or Y axis (the trihedron): 1.205 ;
for the directions along the X or Y axis (the tetrahedron): 1.605 ;
for the diagonal line in relation to the X and Y axis (the trihedron): 1.397 ;
for the arc (the circle): 1.113 .
Basing on the dependencies that define the linear speed:
where:
v—linear speed in
,
s—distance in
,
t—time in
, and linear speed on the circle with the
r radius:
where:
and
w—temporary linear speed in
,
l—arc length in
,
t—time in
,
r—circle radius in
,
α—arc angle in
, the attempts to recreate the printed objects shown in
Figure 5 were performed.
Table 1,
Table 2 and
Table 3 show the read time values that relate to printing of the individual trihedron walls, tube and tetrahedron walls. The wall lengths and tube perimeter values were determined basing on these tables, according to the dependencies (1) and (2).
6. Conclusions
The article presents the results of tests and analyses in the field of using the acoustic signals in the non-invasive acquisition of data [
17,
18,
19] on the shape of objects printed using a 3D printer. The acoustic signals usable for the acoustic infiltration process are generated by the stepper motors that control the printhead and platform movements. The following objects were used in the tests: the trihedron, the tube and the tetrahedron. Based on the spectrograms of recorded acoustic signals, it is possible to identify the movements of the printhead, and then reproduce the shape of the printed object. The frequency range of acoustic signals useful in the process of identifying the shape of the printed object is from 11 kHz up to 23 kHz. Low-frequency signals are mainly generated when the stepper motors control the platform. The signals with higher frequencies contain information about the object’s printed elements (straight lines, arcs). If the printhead movement speed is known, one can determine the printed element length. The length of the sides (walls) of the printed trihedron was equal 19.91 mm and 17.67 mm respectively (for the actual length of 20.00 mm) and 27.56 mm for the hypotenuse (for the actual length of 28.30 mm). To sum up, based on the acoustic signals generated by 3D printers in the additive printing process, the shape of the printed object can be reproduced. This can be a very important conclusion in the field of information protection.
The obtained results show that 3D printers could be source of compromising emanations valuable from viewpoint of an eavesdropping process in the area of acoustic signals. The compromising emanations are correlated with electric signals which control the stepper motors. Acoustic signals from each stepper motor are used to create spectrograms. On the basis on these spectrograms, each movement (along X and Y axes and along diagonal and circle) of the printhead can be recognised. In this way, all the walls of the printed object could be reconstructed, which is important from viewpoint of industrial property.
The above can apply to all kind of 3D printers using stepper motors in the printing process of 3D objects.
The next step will be the analysis of the signals for other secondary channels listed in
Section 1 of the article and combining it with the analysis of acoustic signals carried out in this article. Therefore, solutions that reduce the level of susceptibility to infiltration of the 3D printer can be proposed.
In addition, attempts will be made to use the results to develop a method for automatically recognising printed objects. To confirm the results obtained, the tests carried out should also be repeated for other types of 3D printers. The possibility of using devices emitting acoustic signals jamming the operation of the 3D printer will also be considered [
20].
Author Contributions
Conceptualization, I.K., A.P. and A.S.; methodology, I.K., A.P. and A.S.; software, I.K. and A.S.; validation, I.K., A.P. and A.S.; formal analysis, I.K. and A.S.; investigation, I.K., A.P. and A.S.; resources, I.K., A.P. and A.S.; writing—original draft preparation, I.K.; writing—review and editing, I.K., A.P. and A.S.; visualization, A.S. All authors have read and agreed to the published version of the manuscript.
Funding
This research was funded by Ministry of Science and Higher Education.
Conflicts of Interest
The authors declare no conflict of interest.
References
- Chhetri, S.R.; Faezi, S.; Al Faruque, M.A. Information Leakage-Aware Computer-Aided Cyber-Physical Manufacturing. IEEE Trans. Inf. Forensics Secur. 2018, 13, 2333–2344. [Google Scholar] [CrossRef]
- Kubiak, I. LED printers and safe fonts as an effective protection against the formation of unwanted emission. Turk. J. Electr. Eng. Comput. Sci. 2017, 25, 4268–4279. [Google Scholar] [CrossRef]
- Kubiak, I.; Loughry, J. LED Arrays of Laser Printers as Valuable Sources of Electromagnetic Waves for Acquisition of Graphic Data. Electronics 2019, 8, 1078. [Google Scholar] [CrossRef] [Green Version]
- Al Faruque, M.A.; Chhetri, S.R. Side Channels of Cyber-Physical Systems: Case Study in Additive Manufacturing. IEEE Design & Test 2017, 34. [Google Scholar] [CrossRef]
- Kim, J.; Park, N.; Kim, G.; Jin, S. CCTV Video Processing Metadata Security Scheme Using Character Order Preserving-Transformation in the Emerging Multimedia. Electronics 2019, 8, 412. [Google Scholar] [CrossRef] [Green Version]
- Wu, C.; Gao, F.; Dai, H.; Wang, Z. A Topology-Based Approach to Improve Vehicle-Level Electromagnetic Radiation. Electronics 2019, 8, 364. [Google Scholar] [CrossRef] [Green Version]
- Debar, H.; Dacier, D.; Wespi, A. Towards a taxonomy of intrusion-detection systems. Comput. Netw. 1999, 31, 805–822. [Google Scholar] [CrossRef]
- Al Faruque, M.A.; Chhetri, S.R.; Canedo, A.; Wan, J. Acoustic Side-Channel Attacks on Additive Manufacturing Systems. In Proceedings of the IEEE/ACM 7th International Conference on Cyber-Physical Systems (ICCPS), Vienna, Austria, 11–14 April 2016. [Google Scholar] [CrossRef]
- Mechanical and electrical specifications for PBC Linear Stepper Motor NEMA 17. Available online: www.mev-elektronik.com (accessed on 4 March 2019).
- Backes, M.; Durmuth, M.; Gerling, S.; Pinkal, M.; Sporleder, C. Acoustic side-channel attacks on printers. In Proceedings of the USENIX Security Symposium, Washington, DC, USA, 11–13 August 2010; pp. 307–322. [Google Scholar]
- Rubinstein, M.; Wadhwa, N.; Mysore, G.J.; Durand, F.; Freeman, W.T. The visual microphone: Passive recovery of sound from video. Acm Trans. Graph. 2014, 33, 79. [Google Scholar]
- Dawei, Z.; Zhiyong, L.; Shengxue, Q.; Shanling, H. Optimization of Vibration Characteristics of Fused Deposition Modeling Color 3D Printer Based on Modal and Power Spectrum Method. Appl. Sci. 2019, 9, 4154. [Google Scholar] [CrossRef] [Green Version]
- Chhetri, S.R.; Canedot, A.; AI Faruque, M.A. KCAD: Kinetic Cyber-Attack Detection Method for Cyber-Physical Additive Manufacturing Systems. In Proceedings of the IEEE/ACM International Conference on Computer-Aided Design (ICCAD), Austin, TX, USA, 7–10 November 2016. [Google Scholar] [CrossRef]
- Kubiak, I. The influence of the structure of useful signal on the efficacy of sensitive emission of laser printers. Measurement 2018, 119, 63–76. [Google Scholar] [CrossRef]
- Vijayraghavan, P.; Krishnan, R. Noise in electric machines: A review. IEEE Trans. Ind. Appl. 1999, 35. [Google Scholar] [CrossRef]
- Cihan, U.; Aşık, U.; Cantürk, K. Analysis of Information Leakages on Laser Printers in the Media of Electromagnetic Radiation and Line Conductions. In Proceedings of the International Conference on Information Security and Cryptology, Ankara, Turkey, 30–31 October 2015. [Google Scholar]
- Loughry, J.; Umphress, D.A. Information Leakage from Optical Emanations. Acm Trans. Inf. Syst. Secur. 2002, 5, 262–289. [Google Scholar] [CrossRef] [Green Version]
- Nan, Z.; Yinghua, L.; Qiang, C.; Yiying, W. Investigation of Unintentional Video Emanations from a VGA Connector in the Desktop Computers. IEEE Trans. Electromagn. Compat. 2017, 59, 1826–1834. [Google Scholar]
- Kubiak, I. Font Design—Shape Processing of Text Information Structures in the Process of Non-Invasive Data Acquisition. Computers 2019, 8, 70. [Google Scholar] [CrossRef] [Green Version]
- Ciuonzo, D.; Aubry, A.; Carotenuto, V. Rician MIMO channel-and jamming-aware decision fusion. IEEE Trans. Signal Process. 2017, 65, 3866–3880. [Google Scholar] [CrossRef] [Green Version]
© 2020 by the authors. Licensee MDPI, Basel, Switzerland. This article is an open access article distributed under the terms and conditions of the Creative Commons Attribution (CC BY) license (http://creativecommons.org/licenses/by/4.0/).


