Article

Photovoltaic Self-Consumption in Industrial Cooling and Refrigeration

by
Antonio Javier Martínez-Calahorro
1,
Gabino Jiménez-Castillo
1,2,
Catalina Rus-Casas
1,3,*,
Pedro Gómez-Vidal
2,3 and
Francisco José Muñoz-Rodríguez
1,3
1
Department of Electronic and Automatic Engineering, University of Jaén, Campus Lagunillas, 23071 Jaén, Spain
2
Department of Electrical Engineering, University of Jaen, Campus Lagunillas, 23071 Jaén, Spain
3
Center for Advanced Studies in Earth Sciences, Energy and Environment, University of Jaén, 23071 Jaén, Spain
*
Author to whom correspondence should be addressed.
Electronics 2020, 9(12), 2204; https://doi.org/10.3390/electronics9122204
Submission received: 11 November 2020 / Revised: 11 December 2020 / Accepted: 18 December 2020 / Published: 21 December 2020

Abstract

:
The industrial sector has a great opportunity to reduce its energy costs through distributed generation. In this sense, the potential of photovoltaic self-consumption systems in the industrial cooling and refrigeration sector is shown. Two industries with photovoltaic self-consumption installations are shown and the electricity consumption profile of this type of industry which has a remarkable basal electricity consumption during daytime is analyzed. The matching between consumption and photovoltaic generation profiles is provided through the self-consumption and self-sufficiency curves considering different reporting periods (monthly and annual). Moreover, a new index is presented: self-sufficiency index for sunshine hours, φSS,SH. This index evaluates the performance of the photovoltaic self-consumption system when facing the consumption only during sunshine hours. This index may complement the self-sufficiency index and may improve the analysis of this type of systems in the industrial sector. Self-consumption indices of 90% may be provided. Moreover, self-sufficiency indices for total (24 h) and for sunshine hours of 25% and 50%, respectively, for industry A, and 26% and 45% for industry B have been obtained. During daytime, half the load consumption in this type of industry may be covered by photovoltaics while achieving high levels of use of the photovoltaic energy generated.

1. Introduction

Renewable energies have gradually increased their contribution to global primary energy consumption; in 2018 they accounted for 10.8% of the total, according to the Association of Renewable Energy Companies (APPA). Likewise, renewable energies are still the fourth largest source of primary energy consumption in the world, after oil, coal, and natural gas. In the last place is nuclear energy, with a 4.4% representation of primary energy consumption. It is important to note that more than 84% of the primary energy consumed in the world still comes from fossil fuels. In Europe, renewable energies account for 15.5% of total primary energy consumption, 13.9% in Spain, a percentage very similar to Europe. This fact confirms the great dependence that still exists on fossil energy sources, more than 70%, and the opportunity to apply renewable energies to solve the great energy dependence of many countries [1]. In this sense, it is important to note that the industrial sector represented 68% of the total electricity demand worldwide in 2019. The trend of this demand may be affected by the current crisis caused by the SARS-CoV-2 virus. At a global level, electricity demand during the first quarter of 2020 was 2.6% lower than during the first quarter of 2019, but it should be noted that generation based on renewable energy increased by 3% [2]. According to the type of renewable energy, the most numerous installations are those of photovoltaic solar generation, which is causing a change in the electricity generation model [3].
Among the advantages that can be found in energy generation systems that use renewable resources, such as photovoltaic solar energy, is that they emit much less pollution than any other fossil fuel to produce electricity. This is in line with meeting the objectives of the Spanish and European Union energy policy. In addition, energy imports and payments for CO2 emissions are reduced, economic profitability and energy efficiency are increased, and transmission losses in the electricity networks are reduced [4,5]. In this sense, distributed generation, by means of photovoltaics, can represent an energy alternative where there is a relevant consumption of energy during daytime [6]. There are different applications, depending on technical, economic and environmental aspects, as well as user needs and the technology used [7]. The concept of distributed generation is not yet internationally agreed upon, as each country has different legislation regarding renewable energies and their connection to the electricity system [8,9]. In Spain, it is defined as the set of electricity generation systems that are connected within the distribution networks [10]. These systems are characterized by their relative small power and their location close to the points of consumption [11].
The potential for distributed generation such as photovoltaic self-consumption depends on the matching between the consumption and generation profiles. In the literature, there are several studies that analyze the suitability of photovoltaic (PV) self-consumption in the residential sector [12,13,14,15]. However, considering photovoltaic self-consumption in the industrial sector, very few references can be found in the literature that address the impact of photovoltaic solar energy on electricity consumption and energy efficiency. In this sense, an analysis of different opportunities for energy efficiency in food industry is provided in [16]. A control method based on energy optimization for a cane sugar plant, which analyses different energy sources, including photovoltaics, is given in [17]. Moreover, in Reference [18] photovoltaic systems on Algerian dairy farms are analyzed and it is shown that the reliability of the electricity grid is improved in periods of maximum load, while reducing greenhouse gas emission. In Reference [19] it is highlighted the continuous interruptions in the electricity supply suffered by the industry in Pakistan. In order to overcome this handicap and using HOMER software, a hybrid network with different renewable energies has been designed, including photovoltaics, for the industrial sector. There may be found other examples of how photovoltaic solar energy can be technically feasible in the industrial sector and could solve numerous problems, as in the Philippines [20]. Uganda has developed a study in the industrial sector, with 36 industries, focused on the inclination and the surface of photovoltaic solar plants [21]. In Reference [22] it is analyzed the viability of integrated photovoltaic systems in industrial buildings in Greece while [23] shows that the investment in photovoltaics in the industrial sector of ferroalloys in Brazil has good appeal from the financial market point of view. Moreover, it has been shown that incorporating photovoltaic systems for energy supply can make the production of this industry suffer no interruption. As is the case of the food industry, i.e., eatables items like biscuits or breads; industries placed in areas where the continuous supply of electrical energy is a major problem [24]. There may be also found different studies in wineries that provide a techno-economic analysis based on HOMER software, where the operation of the factory is driven by the renewable energy generated by a photovoltaic array during the production process [25], or the feasibility study of photovoltaic systems connected to the grid for different types of oil mills in Andalusia (southern Spain) [26]. Regarding olive mills, the effect of inclination and orientation angles of the photovoltaic array over the self-consumption and self-sufficiency indices in photovoltaic self-consumption systems without energy storage is also analyzed [27]. Moreover, the feasibility of this renewable energy source in this type of industry is shown.
It should be highlighted that there are industries that present a consumption profile with high basal consumption and little variability during daylight hours, which makes them ideal candidate for photovoltaic self-consumption. The industrial refrigeration and cooling industries stand out, which also show a notable increase in consumption in summer that can be balanced with the increase in electricity generation by photovoltaic arrays in this same season.
The refrigeration sector in Spain, according to the Association of Cold Storage Companies and their Technologies, has experienced a growth of 7 to 15 percent in the last 3 years, registering a turnover of more than 5000 million euros in 2018 and adding 22,000 direct jobs with one hundred percent employability rates. This volume includes the different activities of the value chain, from the manufacture and distribution of components to the manufacture and sale of equipment, and the execution and maintenance of commercial refrigeration and industrial refrigeration installations. Behind these figures are more than 5000 certified installation companies, more than 200 manufacturers, consultants and marketers of refrigeration supplies and equipment whose work transcends the refrigeration sector. This is because refrigeration is necessary to carry out the productive processes of a large number of business sectors. Some of them are very relevant for the Spanish economy, such as the food industry and distribution and the hotel and catering industry. Together they account for around 40 percent of GDP and both are absolutely dependent on the proper functioning of the cold chain [28]. In these sectors, refrigeration is synonymous with food safety and quality assurance for millions of consumers. Another sector of activity in which refrigeration and the cold sector are essential and which also have a great social impact is the pharmaceutical sector: many medicines—including vaccines—require cold for their manufacture and preservation. It can be also mentioned other sectors such as telecommunications, the textile sector or the automotive industry as productive areas that use in an intensive way, Table 1. In this way, cooling is an important element of productivity. However, the commitment of the refrigeration industry to environmental sustainability has also made it an ally for companies in all the sectors we have mentioned to meet their sustainability objectives and to respond to the climate change-related demands of their customers.
As stated before, additional research may be necessary in order to study the potential of photovoltaic self-consumption systems in the industrial sector. It should be noted that in this sector too many different consumption profiles can be found, depending on the productive processes that are carried out in the industries. Therefore, an ad hoc analysis is necessary to study the adequacy of the photovoltaic generation profile to the given consumption profile of each type of industry. The main objective of this manuscript is to highlight the role of this type of systems in Industrial Cooling and Refrigeration as the consumption profiles of this type of industry may be well matched with the generation profiles of photovoltaic systems. In this sense, the self-consumption and self-sufficiency curves, considering a certain range of the photovoltaic generator power, will be used to analyze the suitability of this type of distributed generation in this type of industry. Likewise, a new index will be provided: self-sufficiency index for sunshine hours, which will improve the analysis of self-consumption photovoltaic systems installed in industries. Given that the consumption profiles of companies tend to be very varied, depending on the power consumption, the equipment required for their production processes and the production schedules, this index will make it possible to quantify the level of matching of the generation and consumption profiles exclusively in the hours when photovoltaic generation exists. This parameter can be of significant interest since it indicates the level of coverage of this technology, limiting itself exclusively to the consumption existing in the period of time in which this energy source is active. At the same time, it makes it possible to better characterize this type of installation in the industrial sector where the consumption profile is very varied and can be unequally distributed throughout the day, unlike in the residential sector. It should be highlighted that in the case of the latter, electricity consumption is generally very low between 0:00 and 6:00, which is not the case in the industrial sector. Furthermore, this new parameter together with economic ones may be also used to provide a new design approach to better size the array in this type of systems.
The article is structured as follows. The first section presents the industrial refrigeration industries that have been monitored in order to provide real data. The consumption profile of this type of industry is characterized and the methodology used to analyze the suitability of the photovoltaic systems for self-consumption in this type of industry through the self-consumption and self-sufficiency indices is presented. In addition, a new self-sufficiency index for sunshine hours is provided to characterize photovoltaic self-consumption systems in the industrial sector. Moreover, Zero point Energy Industry (ZEI) point is defined. The following section analyses the different self-consumption and self-sufficiency curves, during total and regarding sunshine hours, considering different reporting periods (monthly and annual). Finally, conclusions are drawn in the last section.

2. Materials and Methods

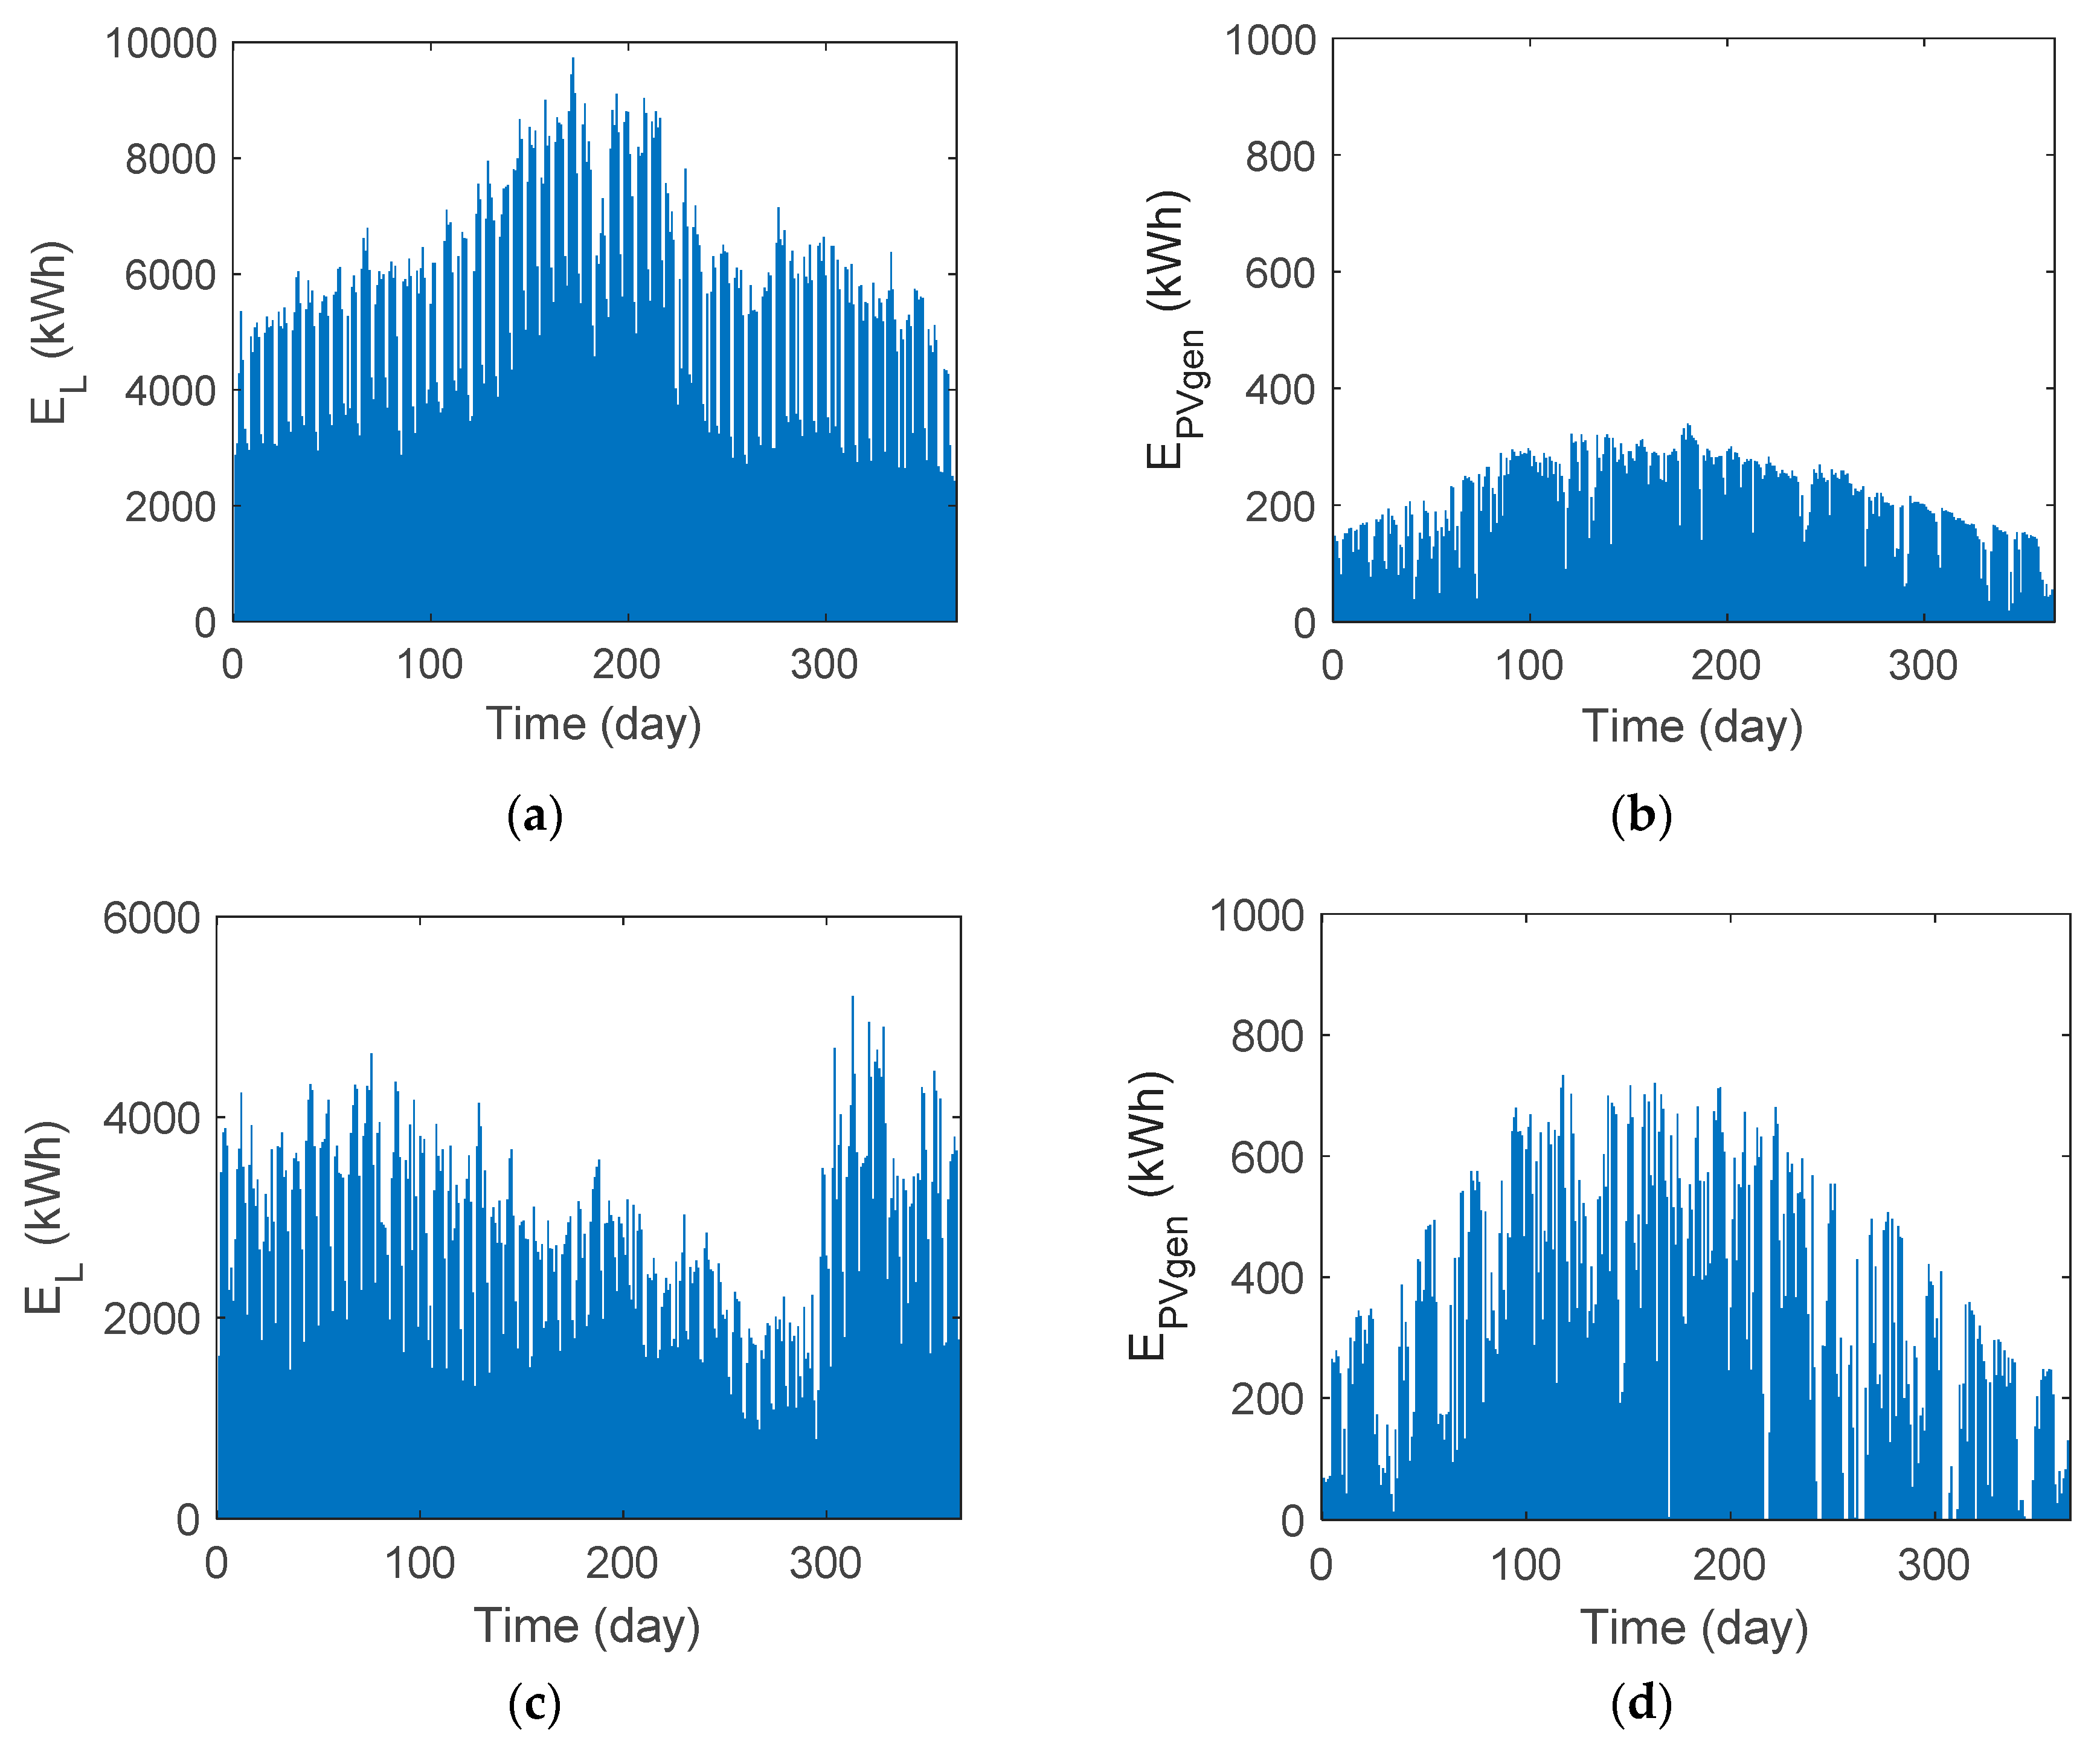
2.1. Consumer Profiles of Industrial Refrigeration and Cooling Companies

Two industries of the industrial refrigeration sector in Spain have been monitored for one year. In both industries it has been installed photovoltaic self-consumption systems. In this sense, data regarding electricity consumption, photovoltaic generation and photovoltaic self-consumption have been collected. It has been considered a storage or recording interval of 5 min either for the power consumed and the photovoltaic power generated [29]. This recording time is appropriate as the consumption profile of this type of industry shows little variability.
The first industry analyzed in this article, Industry A, and whose main activity is cold storage, is located in the southern region of Spain. It has cold stores with a capacity of 35,000 m3 and a freezing temperature of −24 °C. The annual electricity consumption corresponding to the year of measurement was 2,024,583.50 kWh, and the electricity generation of the photovoltaic self-consumption facility installed on its roof was 76,819.44 kWh. The electrical characteristics of the self-consumption photovoltaic system are shown in Figure 1a. Likewise, the accumulated daily values of energy consumption and photovoltaic generation are shown in Figure 2. Moreover, daily load and photovoltaic generation profiles are shown in Figure 3.
Industry B also belongs to the industrial refrigeration sector but differs from the previous one in that it also has a productive process of separation, calibration and packaging of its product. However, its most representative consumption is due to storage in cold rooms, as is the case with industry A. It is located in the northern region of Spain. The electricity consumption in the annual period was 1,026,312.34 kWh, and the electricity generation of the photovoltaic self-consumption facility installed on their roof was 128,307.78 kWh. The electrical characteristics of the self-consumption photovoltaic system are shown in Figure 1b. Cumulative daily consumption and generation values and daily load and photovoltaic generation profiles are shown in Figure 2 and Figure 4, respectively. It can be seen that self-consumption photovoltaic system corresponding to industry B has twice the power that industry A. However, it does not provide twice the photovoltaic generation, as irradiation is a very important variable in this type of systems (industry A is located in the south of Spain while industry B is in the north).
As can be seen in Figure 2, industry A presents high daily energy consumption on the central days of the year, coinciding with summer, reaching 8000 kWh/day on specific days of the season. On the other hand, the lowest consumption is obtained for winter days, decreasing consumption, in this case, to 4000 kWh/day. On the other hand, industry B carries out other productive and complementary activities to those of the cold sector itself, especially in the winter season, which means that the annual consumption curve has a different shape. In this way, it can be seen that, for industry B, its daily consumption reaches 2500 kWh/day in summer. With respect to photovoltaic generation in industry A, on summer days, when there is more solar radiation, generation can exceed 300 kWh/day on specific summer days. On the other hand, it can be seen in the graphs of industry B, in terms of photovoltaic generation they are similar in shape to that of industry A, but with different magnitude as the array powers of the facilities are different and they are located at different latitudes.
With regard to the daily consumption profiles, it should be noted that the industrial refrigeration industry generally presents a very characteristic consumption profile that is repeated in the majority of companies in this sector, Figure 3 and Figure 4. They differ only in the magnitude of the power consumed, which depends on the size of the industry. In this sense, this type of industry has an electricity consumption with a relative high basal consumption with little fluctuations during the day which varies throughout the year depending on the ambient temperature, with the highest electricity consumption in spring and summer when this temperature is higher and the lowest electricity consumption in winter, when the ambient temperature is lower. Likewise, the consumption may be increased during sunshine hours due to other services and management activities that are carried out during daylight hours to keep the industry running. This characteristic of increased consumption during sunshine hours can facilitate the matching between the generation and consumption profiles in this type of industry.
Based on the daily power consumption and generation profiles, it can be seen that for industry A, Figure 3, both on non-working days and on working days, and in all seasons, there is a basal consumption, which is maintained 24 h a day and it is even higher during sunshine hours in labor days. As can be seen, it is greater in summer and spring months, where it may generally reach 300 kW in labor days, while in autumn and winter months this basal consumption may be around 250 kW. For industry B, there is a basal consumption which is also greater during sunshine hours in labor days. In this case, this basal consumption may reach, at least, 100 kW.

2.2. Generation Profiles

In Figure 3 and Figure 4, the generation profiles together with the consumption profiles of each industry are shown, both for holidays and for labor days. It can be also seen that the photovoltaic generation profiles of the facilities installed in industry A and B correspond, respectively, to clear skies and to skies which often present a greater variability throughout the year. This is due to their location: industry A and B are located in southern and northern Spain, respectively. In these graphs, it is possible to appreciate the coupling that occurs in the daytime between both curves, generation and consumption, obtaining a good matching. As can be seen in Figure 3 and Figure 4, the energy production with photovoltaic from both industries is practically self-consumed. Likewise, the good coupling between photovoltaic generation and consumption in industry B is also remarkable, even better than that observed for industry A as load consumption profile is considerably above photovoltaic generation profile. However, if the aim is to supply the greatest amount of photovoltaic energy to be self-consumed, it may be possible to increase the power of the photovoltaic installation corresponding to industry A in order to increase the energy of photovoltaic generation without wasting it.
In order to analyze the suitability of photovoltaic self-consumption systems it may be plotted self-sufficiency and self-consumption curves for a given array peak power range. Moreover, the output power of a photovoltaic self-consumption system considering a determined recording interval can be calculated as:
P Pv ,   τ k k = ξ pv , τ k k   ×   P 0   ( kW )
where P Pv k , is the photovoltaic power for the photovoltaic self-consumption system for each k period, τ k is the recording period, P0 (kW) is the rated power, ξ pv k (p.u) is the per-unit PV power output at each k period which is irradiance function, ambient temperature and photovoltaic system efficiency [30]. These simplifies expressions have been used in other similar studies [31,32]. In this way, a range of P0 from 0.01 kWp to 2 MWp was used with a step of 10 kWp. The upper limit has been chosen in order to properly plot the aforementioned curves.
As mentioned above, both PV power profiles has been measured for one year. The cold storage industries A and B have a PV array of 52.8 kWp and 110.2 kWp and with a final yield (Yf) of 1455 kWh/kWp and 1164 kWh/kWp, respectively. Yf defined by IEC 61,724 is calculated as the AC net energy output of the PV system (Eout) per rated kW (DC) of installed PV array (P0) [33]:
Y f = E out P 0 ( kWh kWp )
Once the electrical consumption and generation profiles of the industries have been characterized, the self-consumption and self-sufficiency indices are used to determine the behavior of the photovoltaic self-consumption installations with respect to consumption demanded by the industry.

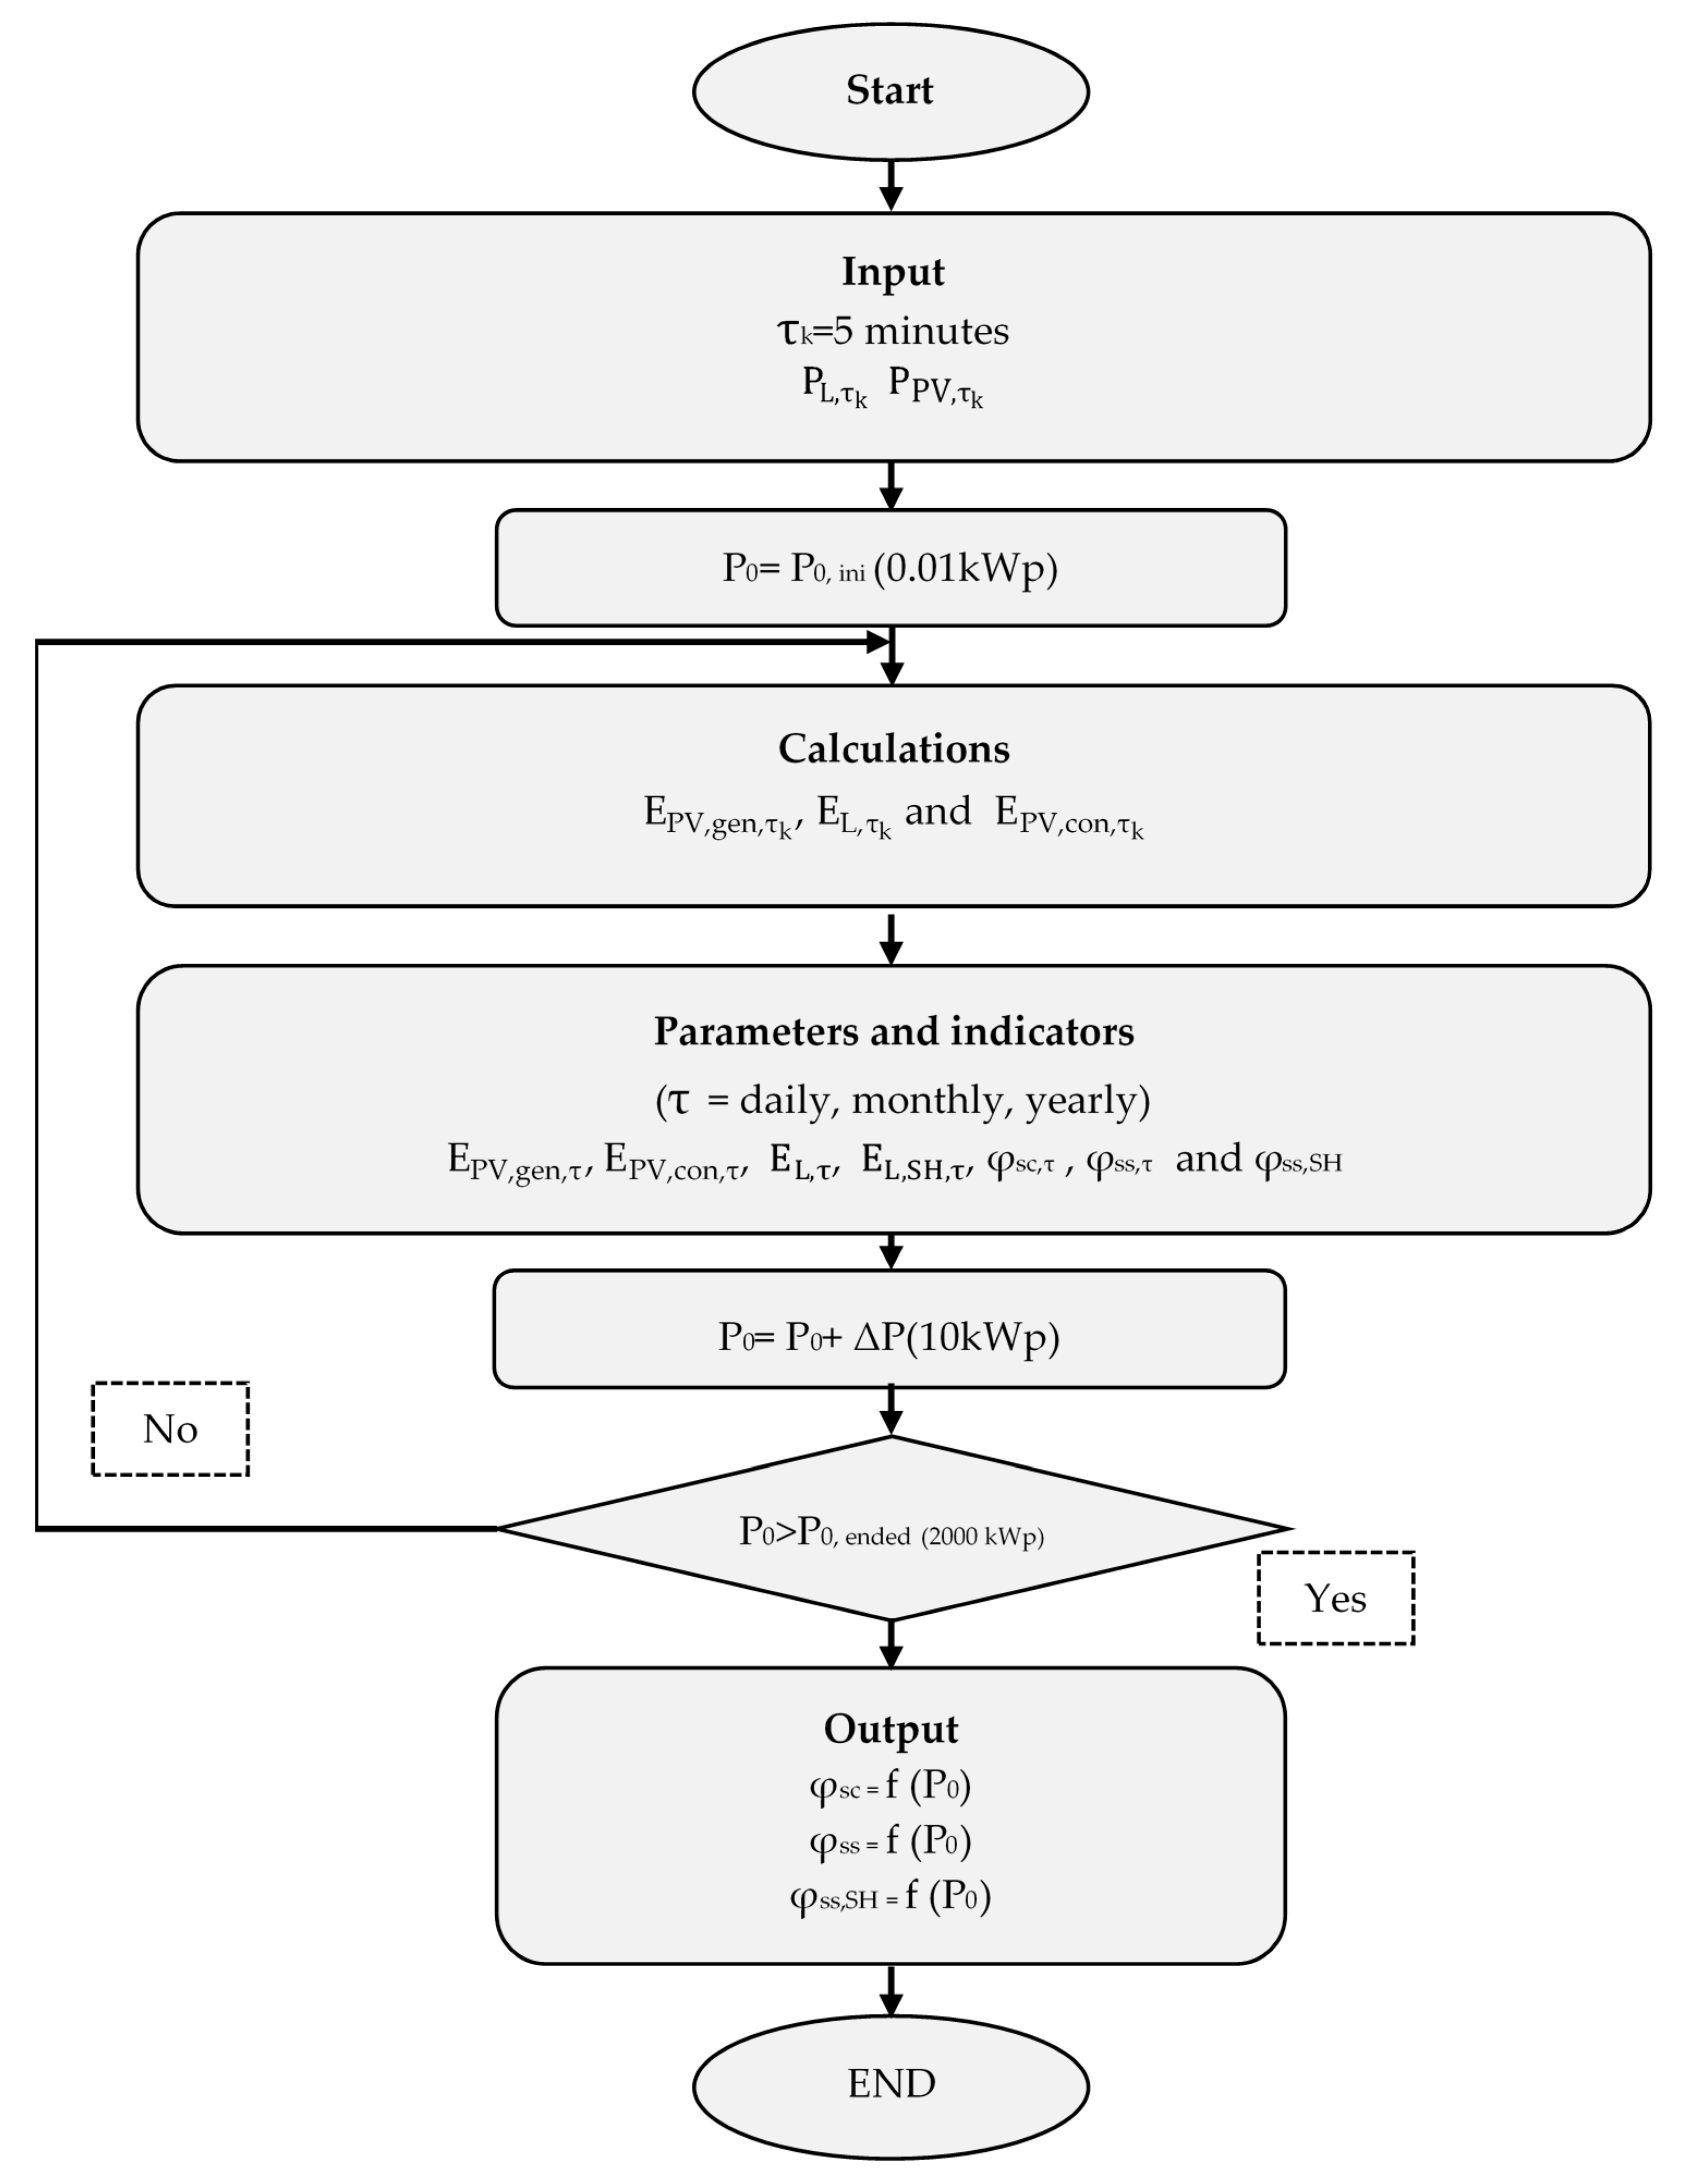
2.3. Self-Sufficiency and Self-Consumption Indices. Self-Sufficiency Index for Sunshine Hours Index φSS,SH

The self-consumption index (φsc) can be defined as the ratio of self-consumed photovoltaic energy (EPV,con) and generated photovoltaic energy (EPV,gen), Equation (3), and indicates the level of use of self-consumed photovoltaic energy with respect to the generated photovoltaic energy. On the other hand, the self-sufficiency index (φss) provides the percentage of the energy consumption (EL) that is covered from the generated photovoltaic energy, Equation (4) [34,35]. Figure 5 shows an example of a daily photovoltaic consumption and generation profiles, where the different areas used for the calculation of self-consumption and self-sufficiency indices can be observed.
φ sc , τ   = E PV , con , τ E PV , gen , τ
φ ss , τ   = E PV , con , τ E L , τ
τ corresponds to the reporting period (daily, monthly or annual). In this sense, daily, monthly and annual self-consumption and self-sufficiency curves will be obtained and analyzed, both in total hours (24 h) and in sunshine hours for a given array power range. These two indices are generally used to characterize self-consumption photovoltaic systems. The self-sufficiency index considers the total energy consumed during all the daytime, whether there is photovoltaic generation or not. It should be noted that in the case of photovoltaic generators they only generate during a fraction of the day (from sunrise to sunset). In the case of self-consumption photovoltaic systems aimed at the residential sector, the generation period generally corresponds to the activity period of the homes, except for a few hours’ delay before the tenants go to bed, so consumption decreases considerably at night (i.e., between 00:00 and 6:00 the consumption may be marginal). However, in the industrial sector each company may have a different consumption profile, which may or not depend on the photovoltaic generation period. In that sense, it may be interesting to define a new parameter that quantifies and evaluates the performance of the photovoltaic self-consumption system only during sunshine hours and evaluate the role that PV generators can play in coping with consumption in that period of time. This new parameter defined as self-sufficiency index for sunshine hours, φss,SH, may be interesting to evaluate the level of coupling between the consumption and generation profiles for the aforementioned generation time. It can be also interesting when different complementary energy sources to the electricity grid are considered (e.g., wind and photovoltaic energy. φss,SH can be estimated as:
φ ss , SH , τ ,   = E PV , con , τ E L , SH , τ
where EL,SH,τ is the energy consumed during sunshine hours (from sunrise to sunset) for a given reporting period. Sunshine and night hours can be estimated by means of an astronomical model that determines when sunrise and sunset occur [36]. Table 2 provides the value of φsc, φss and φss,SH indices for each industry.
Therefore, a photovoltaic self-consumption system can be better evaluated considering self-consumption and self-sufficiency indices together with the new proposed index. In order to get the self-sufficiency index for sunshine hours it is necessary to estimate the photovoltaic energy generated, EPV,gen, Equation (6), the energy consumed by the installation EL, Equation (7) and the energy consumed during sunshine hours, EL,SH, Equations (8) and (9), as well as the photovoltaic self-consumed energy, EPV,con, Equations (10) and (11).
E PV , gen , τ = k P PV , gen , τ k k ×   τ k
E L , τ   = k P L , τ k   k ×   τ k  
P L , SH , τ k   k = { P L , τ k   k   from   sunrise   to   sunset 0   from   sunset   to   sunrise  
E L , SH , τ   = k P L , SH , τ k   k ×   τ k  
P PV ,   con , τ k k = { P L , τ k   k   if   P PV , gen , τ k   k   P L , τ k   k P PV , gen , τ k k   if   P PV , gen , τ k k < P L , τ k   k
where τ k corresponds to the recording interval and k is the number of recording intervals in the reporting period [33]. PPV,gen and PL corresponds to the output power and to the load power, respectively, of the photovoltaic system for each k period; PL,SH is the load power during sunshine hours (from sunrise to sunset) for each k period and PPV,con is the photovoltaic self-consumed power for each k period. Once EPV,con is obtained, self-consumption and self-sufficiency indices can be estimated [32,34], Figure 6. In addition, self-sufficiency for sunshine hours, φSS,SH, has been included.
Regarding residential self-consumption, this range was considered to be between 0 and 10 kW since this interval represents the majority of power contracts in this sector [37]. In order to properly observe the shape of the curves mentioned above, the range has been extended to 2 MW. This study will make it possible to determine not only what percentage of the consumption can be covered with different array powers, it will be shown the potential of photovoltaic self-consumption for this type of industry characterized by a considerable basal consumption. To obtain the curves mentioned above, the method indicated in Figure 6 will be used for different τ : daily, monthly and annual. This will be done for each company and differentiating the analysis by total hours and sunshine hours.

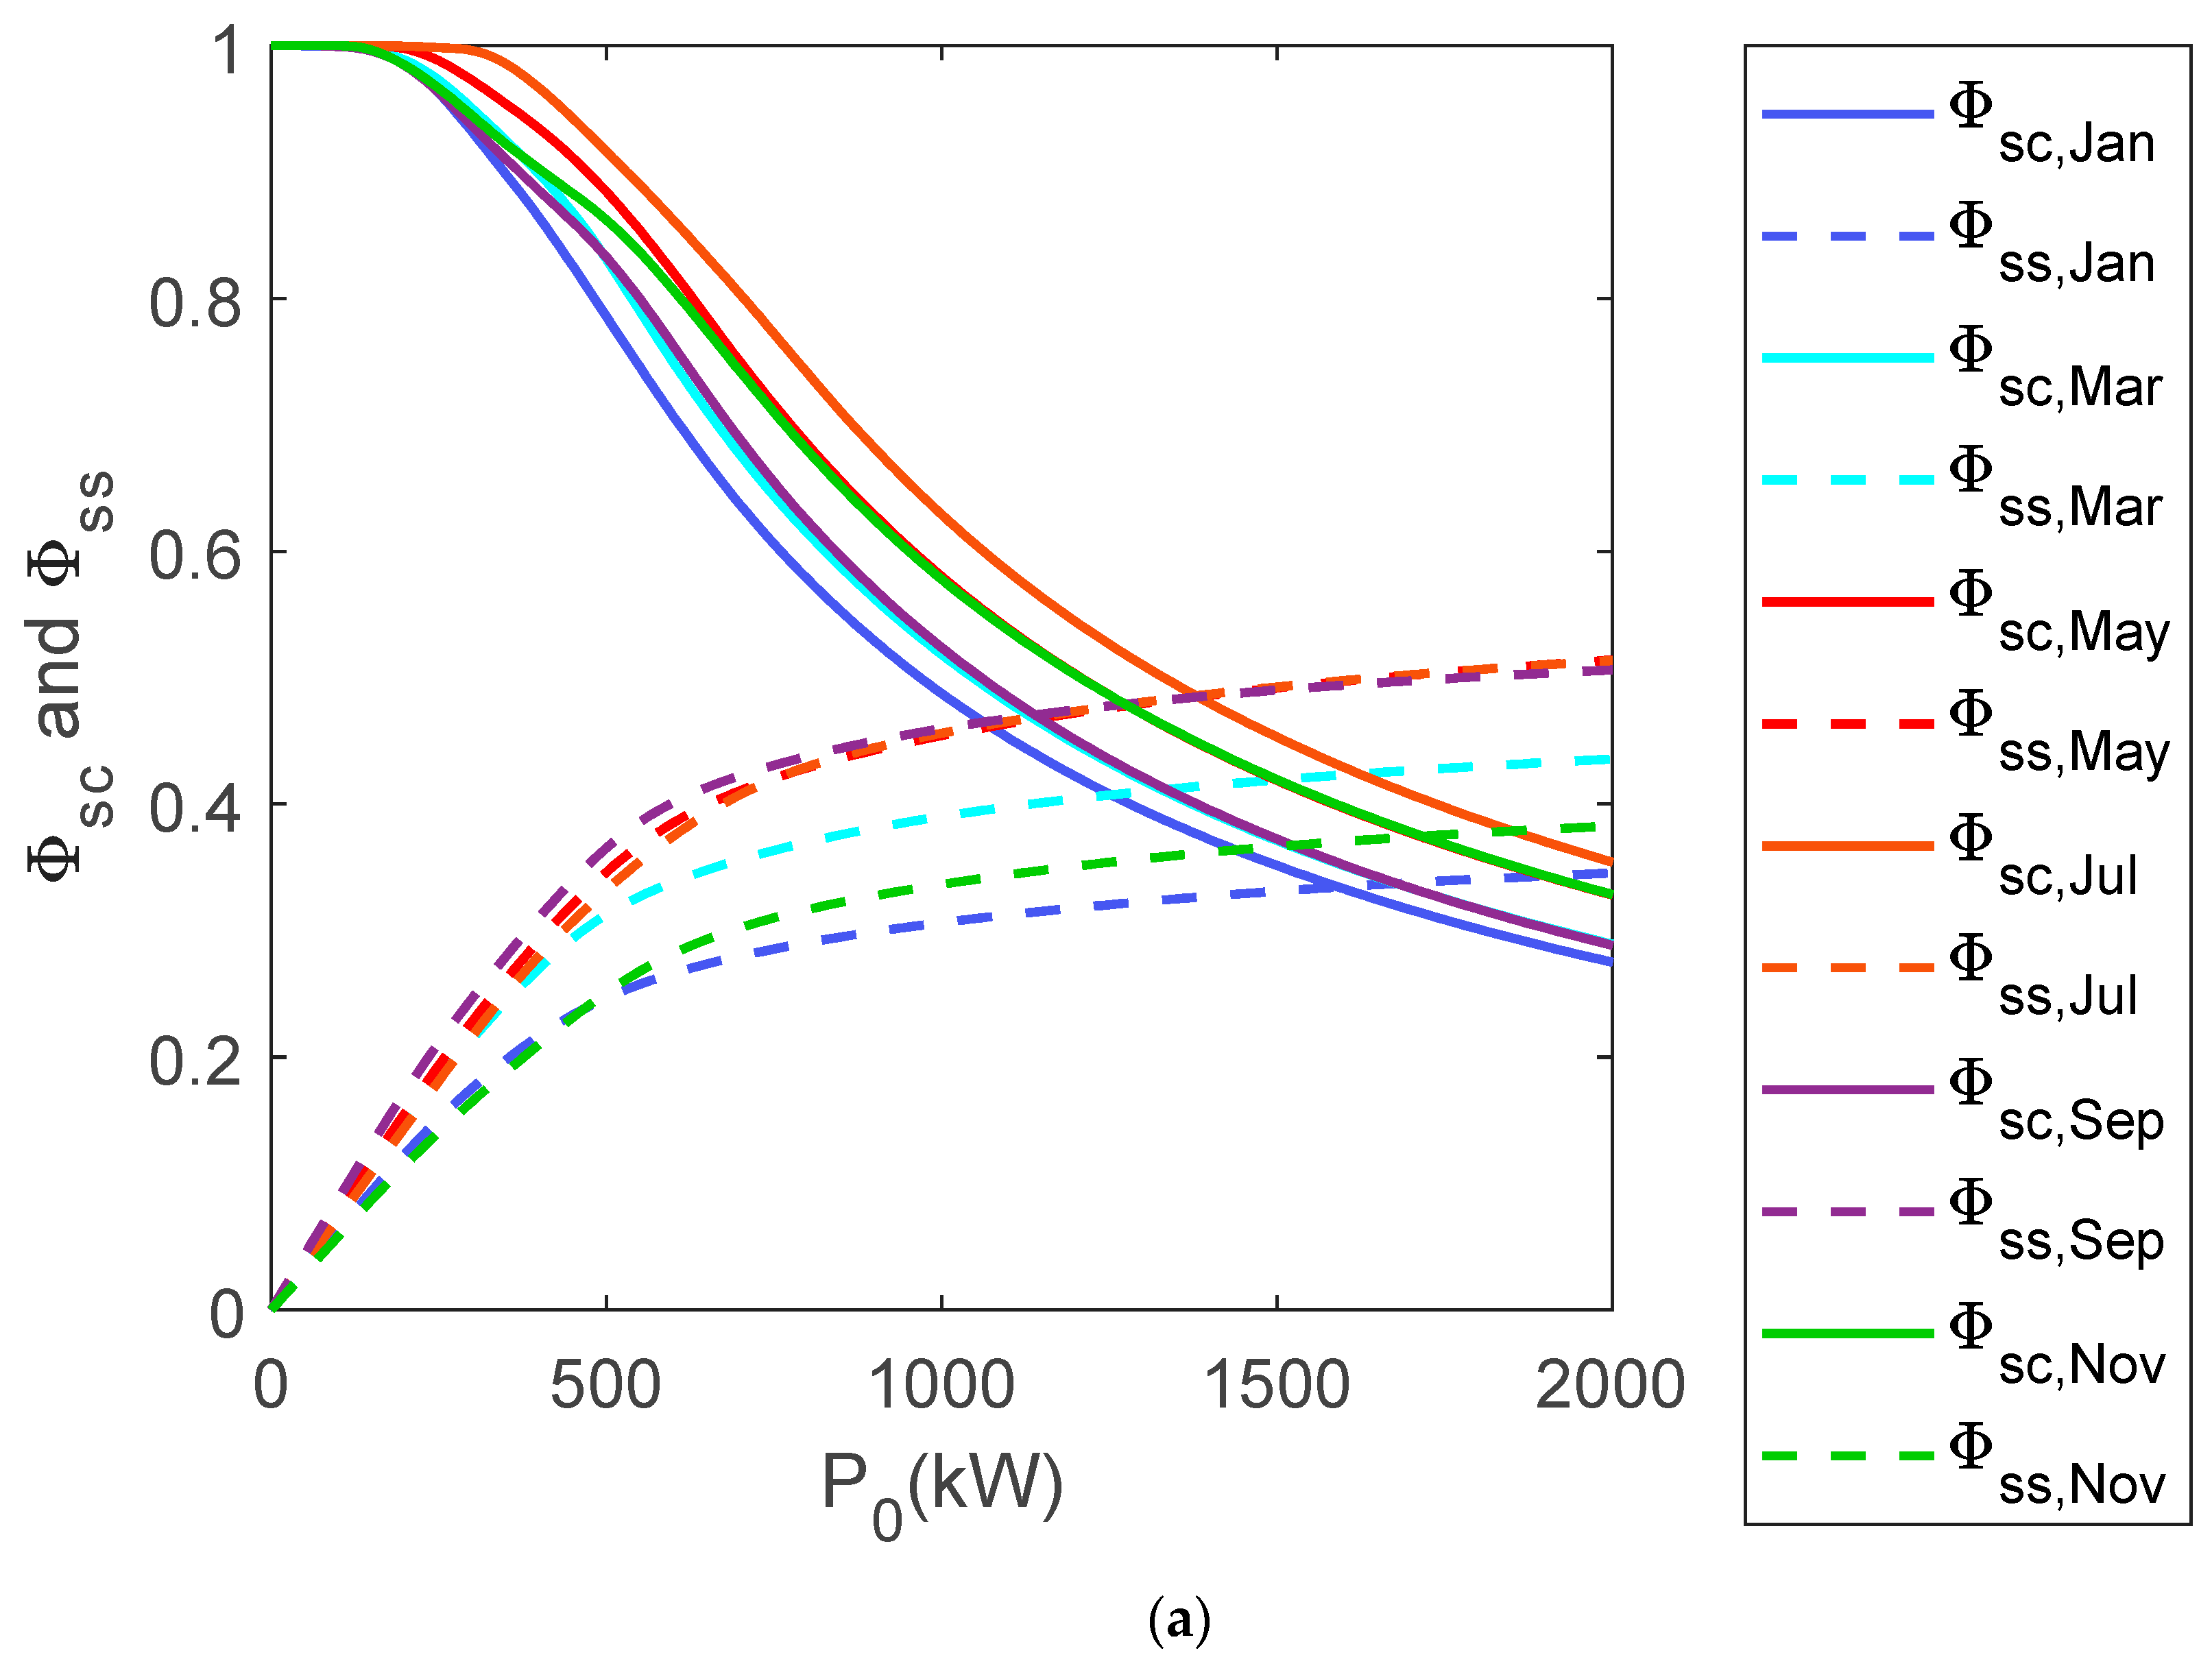
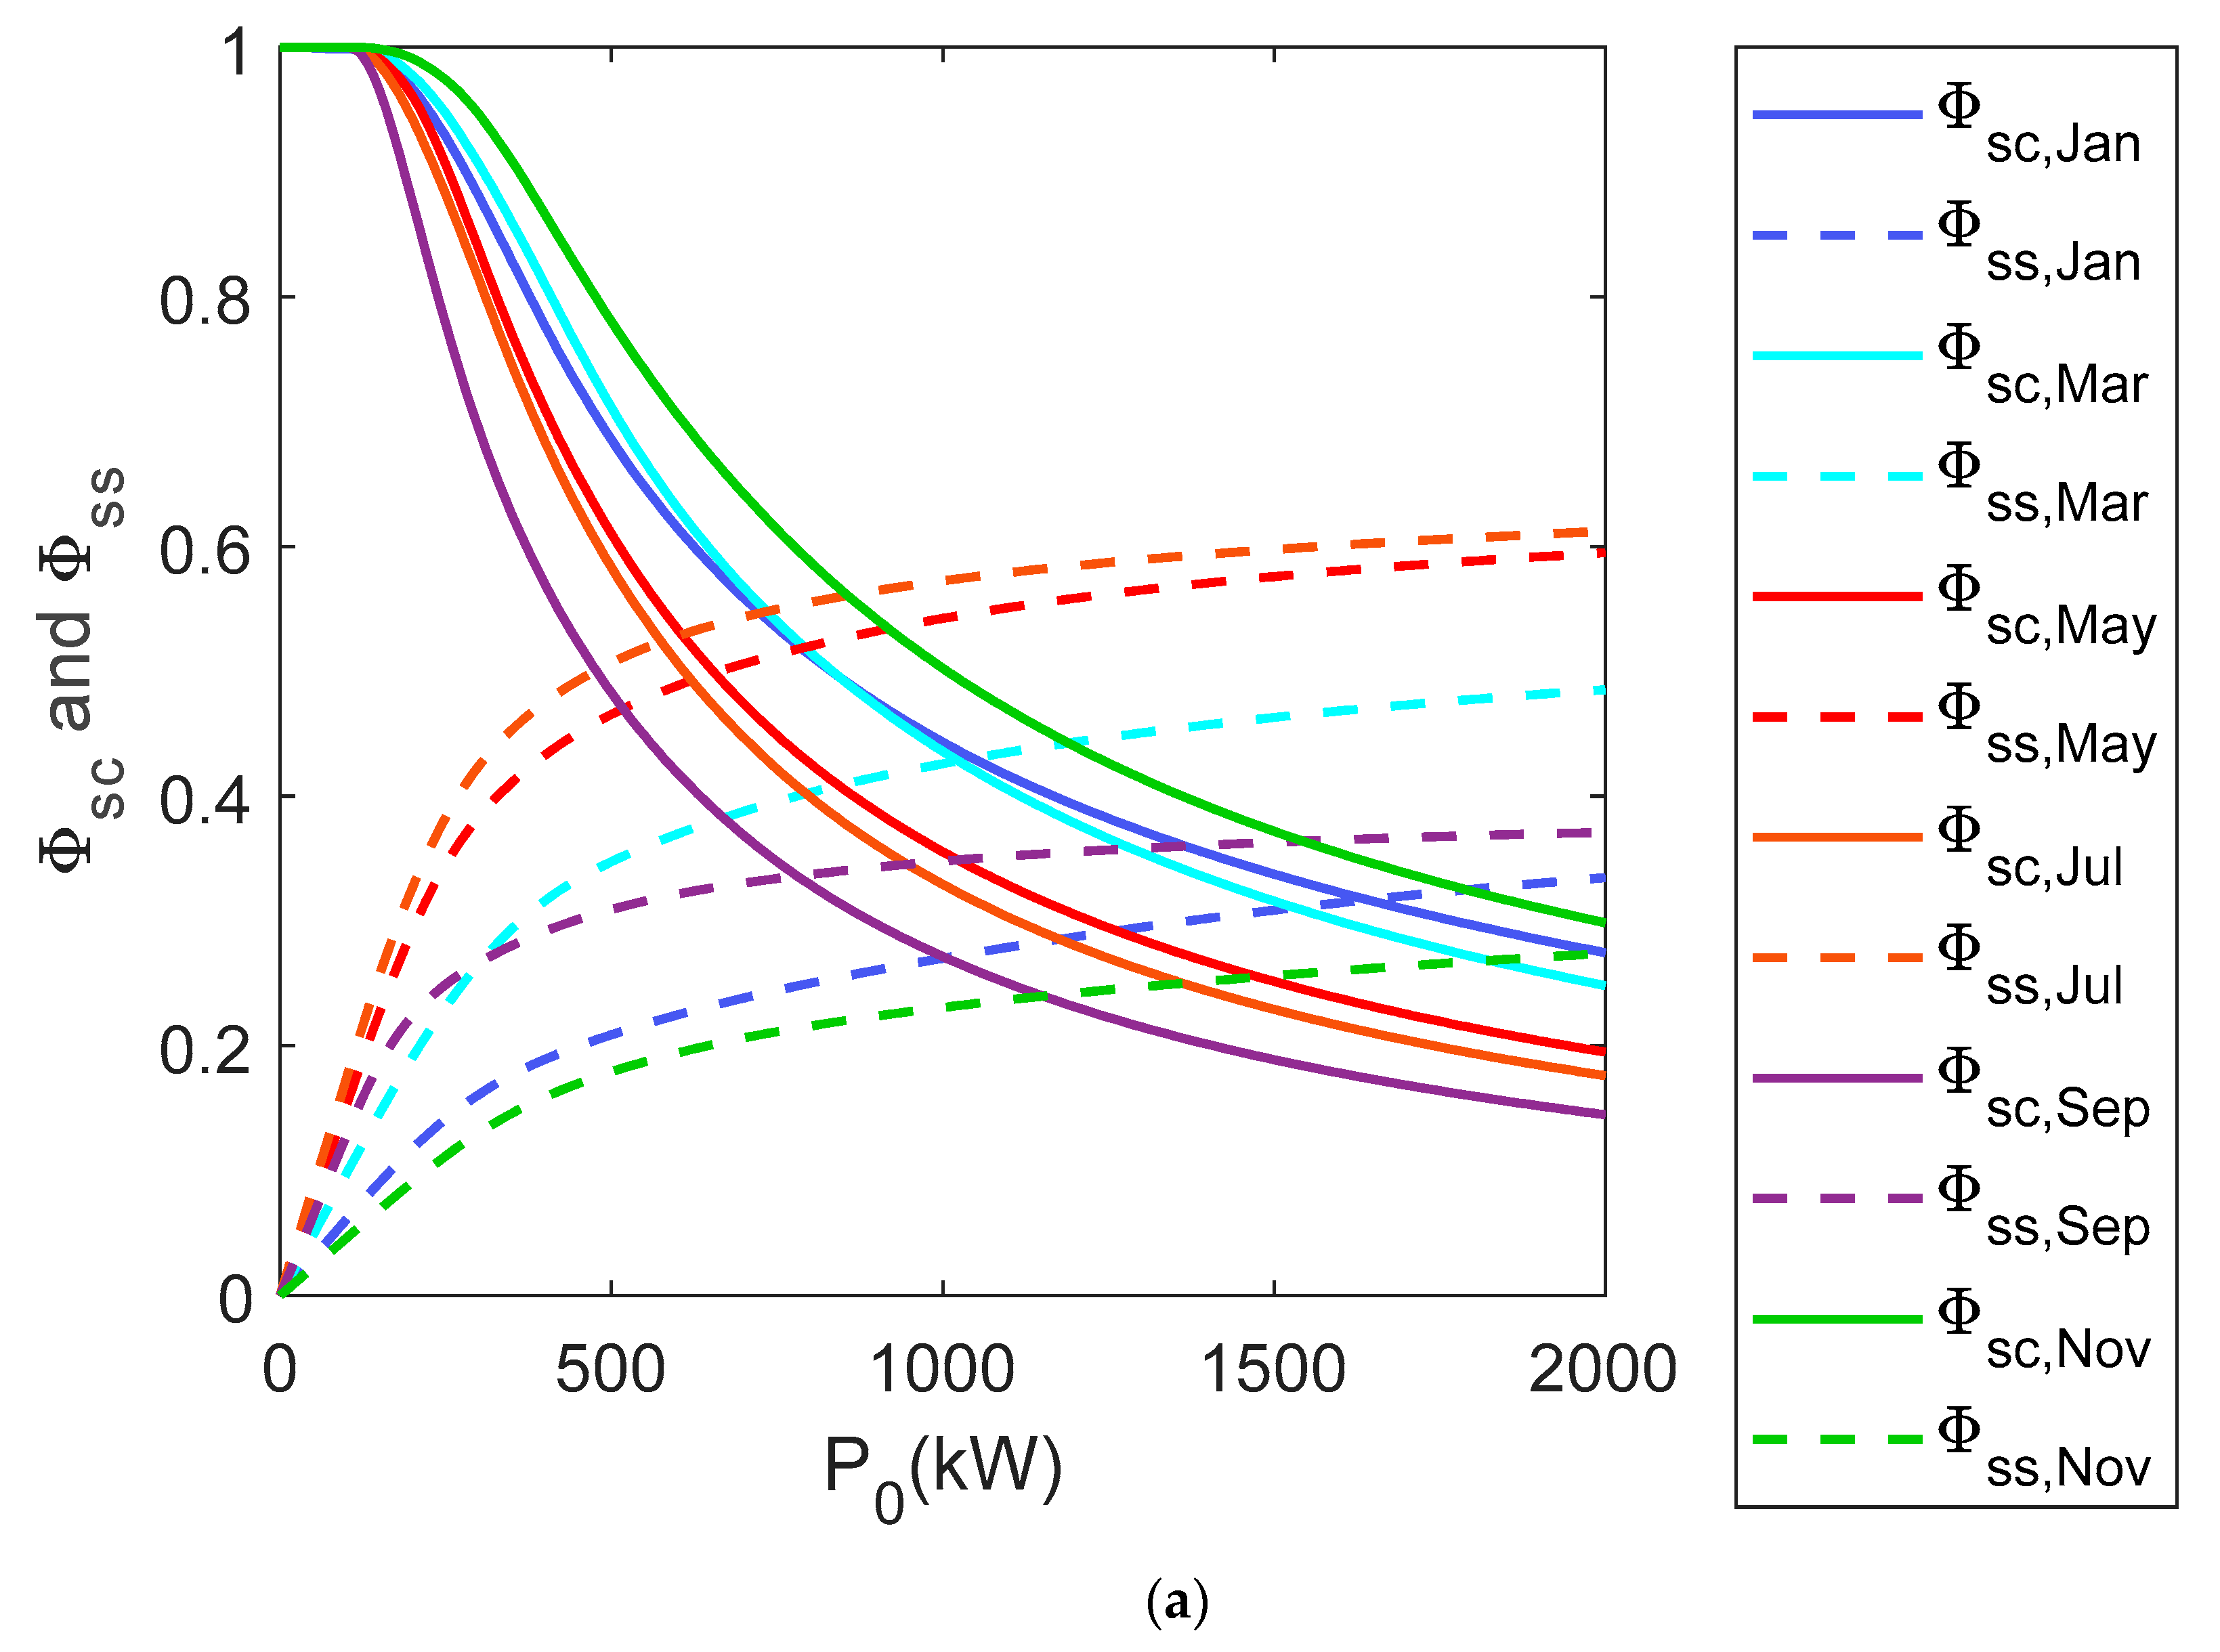
3. Results and Discussion

With regard to industry A, Figure 7a shows the self-sufficiency and self-consumption curves for each month of the year. It can be seen how the self-consumption index present a value of 100% for a certain range of power. Thus, for July, the total use of the energy generated is achieved for array powers lower than 370 kW. On the other hand, January only provides a 100% self-consumption index up to 110 kW. In relation to the monthly self-sufficiency curves, it should be noted that these show a linear behavior for a certain array power range. Outside this interval, the growth is no longer linear, becoming asymptotic. For July, a self-sufficiency index of 52% is reached for a power of the array of 2 MW, while if this same power is considered in the month of January this index is slightly higher than 30%. Moreover, if the analysis is focused on the region of lineal behavior, for an array power of 400 kWp a self-sufficiency index of 28% and 17% may be reached for July and January, respectively.
If a period of analysis of one year is considered, the annual self-sufficiency and self-consumption curves are obtained ( τ = year), Figure 7b. As already indicated, a high level of use of the photovoltaic generated energy with a self-consumption index of 90 and 80% for generator powers of 400 and 600 kWp, respectively, stands out. Likewise, the self-sufficiency index shows a linear behavior up to a considerable array power: 400 kWp, where a self-sufficiency index slightly higher than 25% is achieved. From that point on, the self-sufficiency index increases as the generator power does, but this increase is no longer lineal. In fact, the slope of the curve decreases as the power increases. At the end of the power range studied, the increase in the self-sufficiency index is very poor in relation to the increase in power. The intersection of the two curves indicates the ZEI (Zero Energy Industry) point as an analogy related with Zero Energy Building (ZEB) point which corresponds to the residential sector [38,39], and in this case, it is reached for 1400 kW. This point is characterized by the fact that the two indices are equal. From Equations (2) and (3) it can be deduced that for ZEI point the annual energy consumed matches the annual photovoltaic generated energy, i.e., if it were possible to use all the photovoltaic energy (e.g., using storage systems and demand side management, DSM), the company’s entire consumption could be covered.
ZEI     E L , τ   =   E PV , gen , τ
Considering the new index defined in Section 2.2, new self-sufficiency curves, both monthly and annual, are now obtained, Figure 8. It can be seen that these curves have a similar shape to those shown in Figure 7, except that they are less asymptotic while relatively large self-sufficiency values are obtained. This new index restricts the analysis to sunshine hours where the photovoltaic array is generating. This index is not intended to replace the self-sufficiency index defined in the literature but to complement it as it can provide important information on the operation of PV self-consumption systems specially in the industrial sector. For monthly reporting analysis, Figure 8a, the curves are already more profiled, and higher self-sufficiency values are obtained than in the previous analysis of total hours, between 40% and 56%, for a self-consumption index up to 90%. Finally, if we consider an annual reporting period, Figure 8b, it is obtained a curve where the self-sufficiency index shows a linear behavior up to 400 kWp, where the annual self-sufficiency index for sunshine hours is close to 50%: half the annual consumption in the daytime may be covered by photovoltaics. For the array power range considered it may be higher than 85%. That is, considering daytime hours and an array power of 2 MW, the self-consumption system may practically cover the energy consumption associated with that period. Moreover, as can be seen, a new point can be defined: ZEISH. Now at this point, the energy consumed during sunshine hours would be equal to the energy provided by the array. In this sense, if all the photovoltaic generated energy would be used, it would be possible to face all the consumption restricted to sunshine hours, Equation (12). On this occasion, the ZEISH point drops to 750 kW.
ZEI SH E L , SH , τ =   E PV , gen , τ
Considering the different self-sufficiency and self-consumption curves shown in Figure 7 and Figure 8, it can be indicated that the photovoltaic self-consumption system of 52.8 kW currently installed in industry A could increase its peak power up to 180 kWp while maintaining a self-consumption index of 100% (all the energy generated would be completely used) and self-sufficiency indices, total and for sunshine hours, of 14 and 30%, may be achieved, respectively. The usefulness of these curves for dealing with an appropriate sizing of this type of installation should be highlighted.
Regarding industry B, monthly self-consumption and self-sufficiency curves are shown in Figure 9a. It can be observed that there is a self-consumption of 100% between 100 kW and 150 kW depending on the month of the year, with self-sufficiency indices between 5% and 15%. Thus, in January, the total use of the energy generated is achieved for powers below 150 kW. On the other hand, April only presents a 100% self-consumption value to array powers below 100 kW. In relation to the monthly self-sufficiency curves, it should be noted that these ones show a linear tendency for a certain power interval. Outside this interval, the growth is no longer linear, becoming asymptotic as aforementioned. For July, a self-sufficiency index of 62% is reached for an array power of 2 MW, while if this same power is considered in the month of January this index is slightly higher than 23%.
If an annual reporting period is considered, the annual self-consumption and self-sufficiency curves may be obtained, Figure 9b. As it occurred with industry A, a high level of use of the generated energy with a self-consumption index of 90 and 80% for array powers of 250 and 310 kWp, respectively, stands out. Likewise, the self-sufficiency index shows a linear behavior up to 200 kWp where this index is close to 22%. From that point on, the self-sufficiency index increases as the generator power does, but this increase is no longer proportional. At the end of the array power range considered, the increase in the self-sufficiency index is very poor in relation to the increase in power. Point ZEI, on this occasion, is placed at 900 kWp.
If the analysis is focused on daytime, the self-sufficiency index for sunshine hours may be considered, Figure 10. As in industry A, the curves obtained in this case are different from the ones shown in Figure 9a. For τ = month, Figure 10a, higher self-sufficiency values than those estimated in the previous analysis of total hours are obtained, between 30% (January) and 64%, (September) for a 90% self-consumption index. Finally, if an annual reporting period is taken into account, Figure 10b a self-consumption index of 90% may be obtained for a photovoltaic generator power of 300 kW, providing a self-sufficiency index for sunshine hours slightly higher than 45%. In this case, ZEISH point brings down to 450 kW.
These self-sufficiency and self-consumption curves, for both, total for sunshine hours, indicate that photovoltaic self-consumption may be a good choice for this type of industry characterized by a high basal and low variability consumption during daytime where a complete use of the photovoltaic energy generated may be achieved. Moreover, theses curves show that the photovoltaic installation of 110.2 kWp currently installed in industry B is properly sized in order to cover a considerable portion of the consumption due to industrial cooling, maintaining a self-consumption rate of 100% and a self-sufficiency index for sunshine hours around 20%.
To conclude the discussion and the analysis of the results, the self-consumption and self-sufficiency curves, curves for both total hours and sunshine hours are shown in Figure 11. The use of these self-sufficiency curves may be an interesting indicator when sizing the array in photovoltaic self-consumption systems in the industrial sector.

4. Conclusions

The suitability of photovoltaic self-consumption systems depends on the matching between photovoltaic generation and consumption profiles. In the industrial sector, unlike the residential one, it may be found too much different consumption profiles. In this sense, it is necessary to study the suitability of this technology to each type of industry considering its own consumption profile. Moreover, it may be necessary to define new indices and parameters which take into account the idiosyncrasy of this sector and, therefore, estimate better the performance of photovoltaic self-consumption systems in this sector.
In this manuscript it has been analyzed two photovoltaic self-consumption systems installed in two industries corresponding to the industrial refrigeration and cooling sector which have been monitored during a year. The nominal array power for industries A and B are 52 and 110 kWp, respectively. It has been shown how this type of industry presents a consumption profile with high basal and little variability consumption during daylight hours, and it may be an interesting candidate for photovoltaic self-consumption. Moreover, they suffer a considerable increase in consumption in summer that can be compensated for by the increase in electricity generation by the photovoltaic arrays in this same season. The self-consumption and self-sufficiency curves, considering a certain range of the photovoltaic generator power, have been used to analyze the suitability of photovoltaic self-consumption systems in this type of industry. In order to improve the matching analysis between the generation and consumption profiles of this type of systems, a new index, self-sufficiency index for sunshine hours, has been defined. This index, which complement the information provided by self-sufficiency index, evaluates the performance of the photovoltaic self-consumption system when facing the consumption only during sunshine hours. It indicates the level of coverage of this technology, limiting itself exclusively to the consumption existing in the period of time in which this energy source is active. At the same time, it makes it possible to better characterize photovoltaic self-consumption systems in the industrial sector where the consumption profile is very varied and can be unequally distributed throughout the day. It can be also interesting when different complementary energy sources to the electricity grid may be considered (e.g., wind and photovoltaic energy).
For industry A and considering an annual reporting period, a high level of use of the energy generated may be achieved with a self-consumption index of 90% for array powers up to 400 kWp. Likewise, the self-sufficiency index shows an almost linear behavior up to this power, where a self-sufficiency index close to 25% is reached. Moreover, the annual self-sufficiency index for sunshine hours reaches almost 50%. Regarding industry B, a 90% self-consumption index may be reached for an array power range up to 300 kWp. For this array power, self-sufficiency and a self-sufficiency for sunshine hours indices of 26 and 45%, respectively, may be obtained. In this sense, the suitability of photovoltaic self-consumption systems for industrial cooling and refrigeration has been shown. Consumption and generation profiles corresponding to both industries provide a very high level of coupling for a relative high array power interval, up to 300 kWp, as self-consumption indices may be higher than 90%. Moreover, taking into account the new index defined, both industries may cover half the annual consumption during daytime by photovoltaics considering the aforementioned array powers. These values highlight the suitability of photovoltaic self-consumption systems to this type of industry to photovoltaic self-consumption systems.
Furthermore, the new parameter defined here together with economic ones may be also used to provide a new design approach to better size the array in this type of systems. Further research should be done in this way.

Author Contributions

All authors contributed significantly to this study. Conceptualization, Methodology, Writing-original draft, Investigation: A.J.M.-C., F.J.M.-R., G.J.-C., P.G.-V., C.R.-C.; Data Curation: A.J.M.-C., G.J.-C., Supervision and technical review: A.J.M.-C., F.J.M.-R. All authors have read and agreed to the published version of the manuscript.

Funding

This research received no external funding.

Acknowledgments

The authors would like to thank the University of Jaén for its support in carrying out this research. It belongs to the the programme: Acción 2 «Segunda Fase» comprendida en la “Línea de Actuación: Fomento y divulgación de la transferencia”, enmarcada en el Objetivo 1: “Apoyo a las actividades de trasferencia del conocimiento”, del Plan de Apoyo a la Transferencia del Conocimiento, el Emprendimiento y la Empleabilidad año 2017, para la contratación de doctorandos industriales

Conflicts of Interest

The authors declare no conflict of interest.

Abbreviations

EL,τTotal energy consumption during the reporting period
ELSH,τTotal energy consumption during the reporting period for sunshine hours
EoutEnergy output
EPV,con,τPhotovoltaic energy consumed during the reporting period
EPV,gen,τPhotovoltaic energy generated during the reporting period
GDPGross domestic product
HOMERHybrid optimization model for electricity renewables
LLoad
PLLoad power (Wp)
PL,SHLoad power (Wp) for sunshine hours
P0 PVNominal power (Wp)
PPVPhotovoltaic output power (W)
PPV,conPhotovoltaic self-consumed power (W)
PPV,genPhotovoltaic output power (W)
PRPerformance Ratio
PVPhotovoltaic
τ Reporting period (daily, monthly or annual)
τ kRecording interval
YFAnnual final yield of a PV System (kWh/kWp)
ZEBZero Energy Building
ZEIZero Energy Industry
ZEISHZero Energy Industry for sunshine hours
φscSelf-consumption index
φssSelf-sufficiency index
φSS,SHSelf-sufficiency index for sunshine hours

References

  1. BP Statistical Review of World Energy. 2019. Available online: https://www.bp.com/content/dam/bp/business-sites/en/global/corporate/pdfs/energy-economics/statistical-review/bp-stats-review-2019-full-report.pdf (accessed on 20 December 2020).
  2. IEA. Global Energy Review 2020; IEA Publication: Paris, France, 2020. [Google Scholar]
  3. IDAE Institute for the Diversification and Saving of Energy. Available online: http://informeestadistico.idae.es/t10.htm (accessed on 8 September 2020).
  4. Chiaroni, D.; Chiesa, V.; Colasanti, L.; Cucchiella, F.; D’Adamo, I.; Frattini, F. Evaluating solar energy profitability: A focus on the role of self-consumption. Energy Convers. Manag. 2014, 88, 317–331. [Google Scholar] [CrossRef]
  5. Ehsan, A.; Yang, Q. Optimal integration and planning of renewable distributed generation in the power distribution networks: A review of analytical techniques. Appl. Energy 2018, 210, 44–59. [Google Scholar] [CrossRef]
  6. Anuario Fotovoltaico. 2018. Available online: https://proyectotransicionenergetica.org/AnuarioFotovoltaico2018.pdf (accessed on 20 December 2020).
  7. Sarasa-Maestro, C.J.; Dufo-López, R.; Bernal-Agustín, J.L. Analysis of Photovoltaic Self-Consumption Systems. Energies 2016, 9, 681. [Google Scholar] [CrossRef]
  8. European Parliament Directive 2009/2/EC of the European Parliament and of the Council of 13 July 2009. Available online: https://eur-lex.europa.eu/eli/dir/2009/72/oj (accessed on 20 December 2020).
  9. Jenkins, N.; Strbac, J.; Ekanayake, G. Distributed Generation; Renewable Energy Series; IET: London, UK, 2010; ISBN 9780863419584. [Google Scholar]
  10. Pelegry, Á.; Legarza, C. Generación Distribuida y Autoconsumo Análisis Regulatorio; Cátedra de Energía de Orkestra: Deusto, Spain, 2014. [Google Scholar]
  11. González-Longatt, F.; Unefa, M.U.C.D.V.; Fortoul, C. Review of the Distributed Generation Concept: Attempt of Unification. Renew. Energy Power Qual. J. 2005, 1, 281–284. [Google Scholar] [CrossRef]
  12. Luthander, R.; Nilsson, A.M.; Widén, J.; Åberg, M. Graphical analysis of photovoltaic generation and load matching in buildings: A novel way of studying self-consumption and self-sufficiency. Appl. Energy 2019, 250, 748–759. [Google Scholar] [CrossRef]
  13. Lang, T.; Ammann, D.; Girod, B. Profitability in absence of subsidies: A techno-economic analysis of rooftop photovoltaic self-consumption in residential and commercial buildings. Renew. Energy 2016, 87, 77–87. [Google Scholar] [CrossRef]
  14. Paciello, L.; Pedale, A.; Scaradozzi, D.; Conte, G. A design tool for modelling and sizing of energy production/storage home system. In Proceedings of the 2014 IEEE Workshop on Environmental, Energy, and Structural Monitoring Systems Proceedings, Naples, Italy, 17–18 September 2014; pp. 1–6. [Google Scholar]
  15. Ghiani, E.; Vertuccio, C.; Pilo, F. Optimal sizing and management of a smart Microgrid for prevailing self-consumption. In Proceedings of the 2015 IEEE Eindhoven PowerTech, Eindhoven, The Netherlands, 29 June–2 July 2015; pp. 1–6. [Google Scholar]
  16. Clairand, J.-M.; Briceno-Leon, M.; Escriva-Escriva, G.; Pantaleo, A.M. Review of energy efficiency technologies in the food industry: Trends, barriers, and opportunities. IEEE Access 2020, 8, 48015–48029. [Google Scholar] [CrossRef]
  17. Bernardi, E.; Bordons, C.; Mendes, P.R.; Normey-Rico, J.E.; Adam, E.J. Fault-tolerant energy management for an industrial microgrid: A compact optimization method. Int. J. Electr. Power Energy Syst. 2021, 124, 106342. [Google Scholar] [CrossRef]
  18. Nacer, T.; Hamidat, A.; Nadjemi, O. A comprehensive method to assess the feasibility of renewable energy on Algerian dairy farms. J. Clean. Prod. 2016, 112, 3631–3642. [Google Scholar] [CrossRef]
  19. Javid, Z.; Li, K.-J.; Hassan, R.U.; Chen, J. Hybrid-microgrid planning, sizing and optimization for an industrial demand in Pakistan. Teh. Vjesn. Tech. Gaz. 2020, 27, 781–792. [Google Scholar] [CrossRef]
  20. Jara, P.G.B.; Castro, M.T.; Esparcia, J.E.A.; Ocon, J.D. Quantifying the techno-economic potential of grid-tied rooftop solar photovoltaics in the Philippine industrial sector. Energies 2020, 13, 5070. [Google Scholar] [CrossRef]
  21. Mukisa, N.; Zamora, R.; Lie, T.T. Feasibility assessment of grid-tied rooftop solar photovoltaic systems for industrial sector application in Uganda. Sustain. Energy Technol. Assess. 2019, 32, 83–91. [Google Scholar] [CrossRef]
  22. Vokas, G.; Klironomos, P.; Kaldellis, J. Evaluation of building integrated photovoltaic systems’ potential in the industrial sector: Case study of Oinofyta-Viotia zone, Greece. J. Energy Power Eng. 2013, 7, 2211–2219. [Google Scholar]
  23. E Silva, L.G.L.; Dias, W.P.; Vieira, C.B.; Assis, P.S. Solar photovoltaic energy applied to ferroalloy industry. REM—Int. Eng. J. 2019, 72, 251–255. [Google Scholar] [CrossRef]
  24. Saxena, S.; Gaur, M.K.; Sinha, D.; Malvi, C.S.; Mishra, S.; Professor, A. Design of photovoltaic system for a biscuit packing machine. Int. J. Eng. Sci. Emerg. Technol. 2013, 6, 2231–6604. [Google Scholar]
  25. Gómez-Lorente, D.; Rabaza, O.; Dols, F.A.; Mercado-Vargas, M.J. Economic and environmental study of wineries powered by grid-connected photovoltaic systems in Spain. Energies 2017, 10, 222. [Google Scholar] [CrossRef] [Green Version]
  26. Rabaza, O.; Contreras-Montes, J.; García-Ruiz, M.J.; Hervás-Gámez, C.; Gómez-Lorente, D. Techno-economic performance evaluation for olive mills powered by grid-connected photovoltaic systems. Energies 2015, 8, 11939–11954. [Google Scholar] [CrossRef]
  27. Jiménez-Castillo, G.; Muñoz-Rodríguez, F.; Martinez-Calahorro, A.J.; Tina, G.M.; Rus-Casas, C. Impacts of array orientation and tilt angles for photovoltaic self-sufficiency and self-consumption indices in olive mills in Spain. Electronics 2020, 9, 348. [Google Scholar] [CrossRef] [Green Version]
  28. International Institute of Refrigeration. 29th Informatory Note on Refrigeration Technologies: The Role of Refrigeration in the Global Economy; IIF-IIR: Paris, France, 2015. [Google Scholar]
  29. Jiménez-Castillo, G.; Rus-Casas, C.; Tina, G.M.; Muñoz-Rodriguez, F. Effects of smart meter time resolution when analyzing photovoltaic self-consumption system on a daily and annual basis. Renew. Energy 2020, 164, 889–896. [Google Scholar] [CrossRef]
  30. Hernandez, J.C.; Ruiz-Rodriguez, F.; Jurado, F. Modelling and assessment of the combined technical impact of electric vehicles and photovoltaic generation in radial distribution systems. Energy 2017, 141, 316–332. [Google Scholar] [CrossRef]
  31. Gomez-Gonzalez, M.; Hernandez, J.C.; Vera, D.; Jurado, F. Optimal sizing and power schedule in PV household-prosumers for improving PV self-consumption and providing frequency containment reserve. Energy 2020, 191, 116554. [Google Scholar] [CrossRef]
  32. Jiménez-Castillo, G.; Muñoz-Rodríguez, F.; Rus-Casas, C.; Talavera, D. A new approach based on economic profitability to sizing the photovoltaic generator in self-consumption systems without storage. Renew. Energy 2020, 148, 1017–1033. [Google Scholar] [CrossRef]
  33. IEC. Photovoltaic System Performance—Part. 1: Monitoring, 1st ed.; IEC Publications: Geneva, Switzerland, 2017; ISBN 9782832239889. [Google Scholar]
  34. Talavera, D.; Muñoz-Rodríguez, F.; Jimenez-Castillo, G.; Rus-Casas, C. A new approach to sizing the photovoltaic generator in self-consumption systems based on cost–competitiveness, maximizing direct self-consumption. Renew. Energy 2019, 130, 1021–1035. [Google Scholar] [CrossRef]
  35. Luthander, R.; Widén, J.; Nilsson, D.; Palm, J. Photovoltaic self-consumption in buildings: A review. Appl. Energy 2015, 142, 80–94. [Google Scholar] [CrossRef] [Green Version]
  36. Iqbal, M. An Introduction to Solar Radiation; Elsevier: Amsterdam, The Netherlands, 1983. [Google Scholar]
  37. Wolisz, H.; Schütz, T.; Blanke, T.; Hagenkamp, M.; Kohrn, M.; Wesseling, M.; Mueller, D. Cost optimal sizing of smart buildings’ energy system components considering changing end-consumer electricity markets. Energy 2017, 137, 715–728. [Google Scholar] [CrossRef]
  38. Vieira, F.M.; Moura, P.S.; De Almeida, A.T. Energy storage system for self-consumption of photovoltaic energy in residential zero energy buildings. Renew. Energy 2017, 103, 308–320. [Google Scholar] [CrossRef]
  39. Torcellini, P.A.; Crawley, D.B. Understanding zero-energy buildings. Ashrae J. 2006, 48, 62–69. [Google Scholar]
Figure 1. (a) Data of the photovoltaic self-consumption generation installation, industry A; (b) Data of the photovoltaic self-consumption generation installation, industry B.
Electronics 09 02204 g001
Figure 2. Bar graphs for cumulative daily consumption and photovoltaic generation (kWh/day) corresponding to industry A and B throughout a year (365 bars). (a) Industry A-Daily consumption data; (b) Industry A-Daily generation data; (c) Industry B-Daily consumption data; (d) Industry B-Daily generation data.
Electronics 09 02204 g002
Figure 3. Daily load and photovoltaic generation profiles. Industry A. (a) Weekend-May 6; (b) Labor Day-May 4; (c) Weekend-August 6; (d) Labor Day-August 7; (e) Weekend-November 5; (f) Labor Day-November 6; (g) Weekend-February 4; (h) Labor Day-February 6.
Electronics 09 02204 g003
Figure 4. Load and photovoltaic generation profiles. Industry B.(a) Weekend-May 6; (b) Labor Day-May 4; (c) Weekend-July 30; (d) Labor Day-July 31; (e) Weekend-October 22; (f) Labor Day-October 26; (g) Weekend-February 5; (h) Labor Day-February 6.
Electronics 09 02204 g004
Figure 5. Daily load and photovoltaic generation profiles. Load consumption (blue + orange areas), EL, photovoltaic generation (orange + green areas), EPV,gen, and photovoltaic self-consumed energy (orange area), EPV,con.
Electronics 09 02204 g005
Figure 6. Method followed to estimate φSC, φSS and φSS,SH, as a function of the nominal power of the array, P0.
Electronics 09 02204 g006
Figure 7. (a) Monthly self-consumption and self-sufficiency curves; (b) Annual self-consumption and self-sufficiency curves. Industry A.
Electronics 09 02204 g007aElectronics 09 02204 g007b
Figure 8. (a) Monthly self-consumption and self-sufficiency curves during sunshine hours; (b) Annual self-consumption and self-sufficiency curves during sunshine hours. Industry A
Electronics 09 02204 g008
Figure 9. (a) Monthly self-consumption and self-sufficiency curves; (b) Annual self-consumption and self-sufficiency curves. Industry B.
Electronics 09 02204 g009aElectronics 09 02204 g009b
Figure 10. (a) Monthly self-consumption and self-sufficiency during curves sunshine hours; (b) Annual self-consumption and self-sufficiency curves during sunshine hours. Industry B.
Electronics 09 02204 g010
Figure 11. Annual self-consumption and self-sufficiency curves calculated with total hours (24h) and sunshine hours. (a) Industry A; (b) Industry B.
Electronics 09 02204 g011
Table 1. Industrial cold applications by type of industrial sector.
SectorApplication
Pharmaceutical and hospitalWhite and clean rooms
LogisticRobotic cold stores
Picking areas
Antechambers
Self-supporting warehouses
Fruit vegetableCold rooms with controlled atmospheres
Rapid forced air cooling
Water cooling
High vacuum cooling
MeatChannel cold rooms
Process rooms
Clean or white rooms
Dryers
Cold rooms for finished products
Freezing tunnels
Blast chillers
Freezing cold rooms
Heated packaging rooms
DairyCold rooms for dairy products
FishingBoat cooling
Refrigeration of reception areas and markets
Ice factories
Cold storage
Refrigeration of fish workers
Freezing
Hospitality and restorationCold rooms in large central kitchens
Small cold rooms for restaurants
Installation of blast chillers
Freezing tunnels
Bakery and pastryFreezing tunnels, continuous static or spiral
Refrigerated bakery workers
Controlled fermentation chambers
Freezing chamber for precooked
Small pastry chambers
Distribution, hypermarkets and supermarketsSeparate cold rooms
Cold storage plants for vegetables, meat, fish, dairy
Freezer chambers
Butcher shop workers with a view towards the store
Bread workers
Refrigeration equipment by air or by water
Ice and flake generators
Table 2. Final PV system yield, annual self-consumption index, annual self-sufficiency index and annual self-sufficiency index during sunshine hours.
ParameterIndustry AIndustry B
Yf (kWh/kW)14551164
φsc0.99990.9995
φss0.03750.1249
φSS,SH0.07260.2361
Publisher’s Note: MDPI stays neutral with regard to jurisdictional claims in published maps and institutional affiliations.

