Article

Method for Estimating Solar Energy Potential Based on Photogrammetry from Unmanned Aerial Vehicles

by
Jose Eduardo Fuentes
1,*,
Francisco David Moya
2,* and
Oscar Danilo Montoya
3,4
1
AGESAT Research Group, Geography Department, Universidad del Valle, 760031 Cali, Colombia
2
GESETIC Research Group, School of Electrical Engineering, Universidad Distrital Francisco José de Caldas, 11021 Bogotá, Colombia
3
Facultad de Ingeniería, Universidad Distrital Francisco José de Caldas, 11021 Bogotá D.C., Colombia
4
Laboratorio Inteligente de Energía, Universidad Tecnológica de Bolívar, 131001 Cartagena, Colombia
*
Authors to whom correspondence should be addressed.
Electronics 2020, 9(12), 2144; https://doi.org/10.3390/electronics9122144
Submission received: 20 October 2020 / Revised: 10 December 2020 / Accepted: 11 December 2020 / Published: 14 December 2020
(This article belongs to the Special Issue Emerging Technologies for Photovoltaic Solar Energy)

Abstract

:
This study presents a method to estimate the solar energy potential based on 3D data taken from unmanned aerial devices. The solar energy potential on the roof of a building was estimated before the placement of solar panels using photogrammetric data analyzed in a geographic information system, and the predictions were compared with the data recorded after installation. The areas of the roofs were chosen using digital surface models and the hemispherical viewshed algorithm, considering how the solar radiation on the roof surface would be affected by the orientation of the surface with respect to the sun, the shade of trees, surrounding objects, topography, and the atmospheric conditions. The results show that the efficiency percentages of the panels and the data modeled by the proposed method from surface models are very similar to the theoretical efficiency of the panels. Radiation potential can be estimated from photogrammetric data and a 3D model in great detail and at low cost. This method allows the estimation of solar potential as well as the optimization of the location and orientation of solar panels.

1. Introduction

Around the world, renewable energies are promoted, especially solar energy, in the drive to achieve smart cities and environmentally sustainable cities. The active and passive use of solar energy can make energy use more effective in commercial and urban spaces, feeding power plants that are complementary or primary energy suppliers. Photovoltaic energy can be actively applied for electricity generation in a distributed generation style; it can also be applied passively by taking into account architectural designs and civil works where the building includes photovoltaic systems on its roofs and facades. In Colombia, for example, the company Celsia is a pioneer and leader in the development of large-scale photovoltaic solar energy projects at companies, real estate and industrial projects, and logistics complexes for the generation of electricity in residential and commercial buildings. In the vast majority of buildings, the roof space is available to exploit the solar radiation. As an illustration, in Colombia, the available sources on solar resource information indicate that the country has an average irradiation of 4.5 (kWh/m2/d) [1], which exceeds the global average of 3.9 (kWh/m2/d) [2]. This shows a significant and untapped resource for the deployment of photovoltaic systems. The potential solar radiation maps for Colombia have been developed by the Institute of Hydrology, Meteorology, and Environmental Studies (Instituto de Hidrología, Meteorología y Estudios Ambientales—IDEAM) and the Mining and Energy Planning Unit (Unidad de Planeación Minero-Energética—UPME). These maps show the wide geographic distribution of the solar radiation resource available in the country (Figure 1).
In this document, a methodology based on geographic information system (GIS) and photogrammetric data with tridimensional features using an unmanned aerial vehicle is presented, to estimate the solar potential on a building. Our contributions are listed as follows: (i) the application of the solar radiation hemispheric model on a university campus building; (ii) development of a solar radiation map prior and later on solar panels installation; (iii) development of a methodology for estimating the solar potential for roof mounted PV systems and (iv) the comparison between data results of the solar panels with the solar radiation model and software PVSyst. This software is widely accepted in in literature and industry as a practical and easy tool in photovoltaic system designs. PVSyst allows to carry out simulations on architectural plans, considering the georeferenced positioning of the study place, and the acquisition of data from databases such as NASA’s. These arguments led to the decision to use the PVSyst as a verification tool seeking to compare the data with the model proposed in this work.
In this work, Section 2 shows the relationship between solar radiation analysis and geographic information systems; Section 3 illustrates the case study; Section 4 illustrates the study methods; in Section 5, the results are analyzed; and finally, in Section 6, the conclusions are drawn.

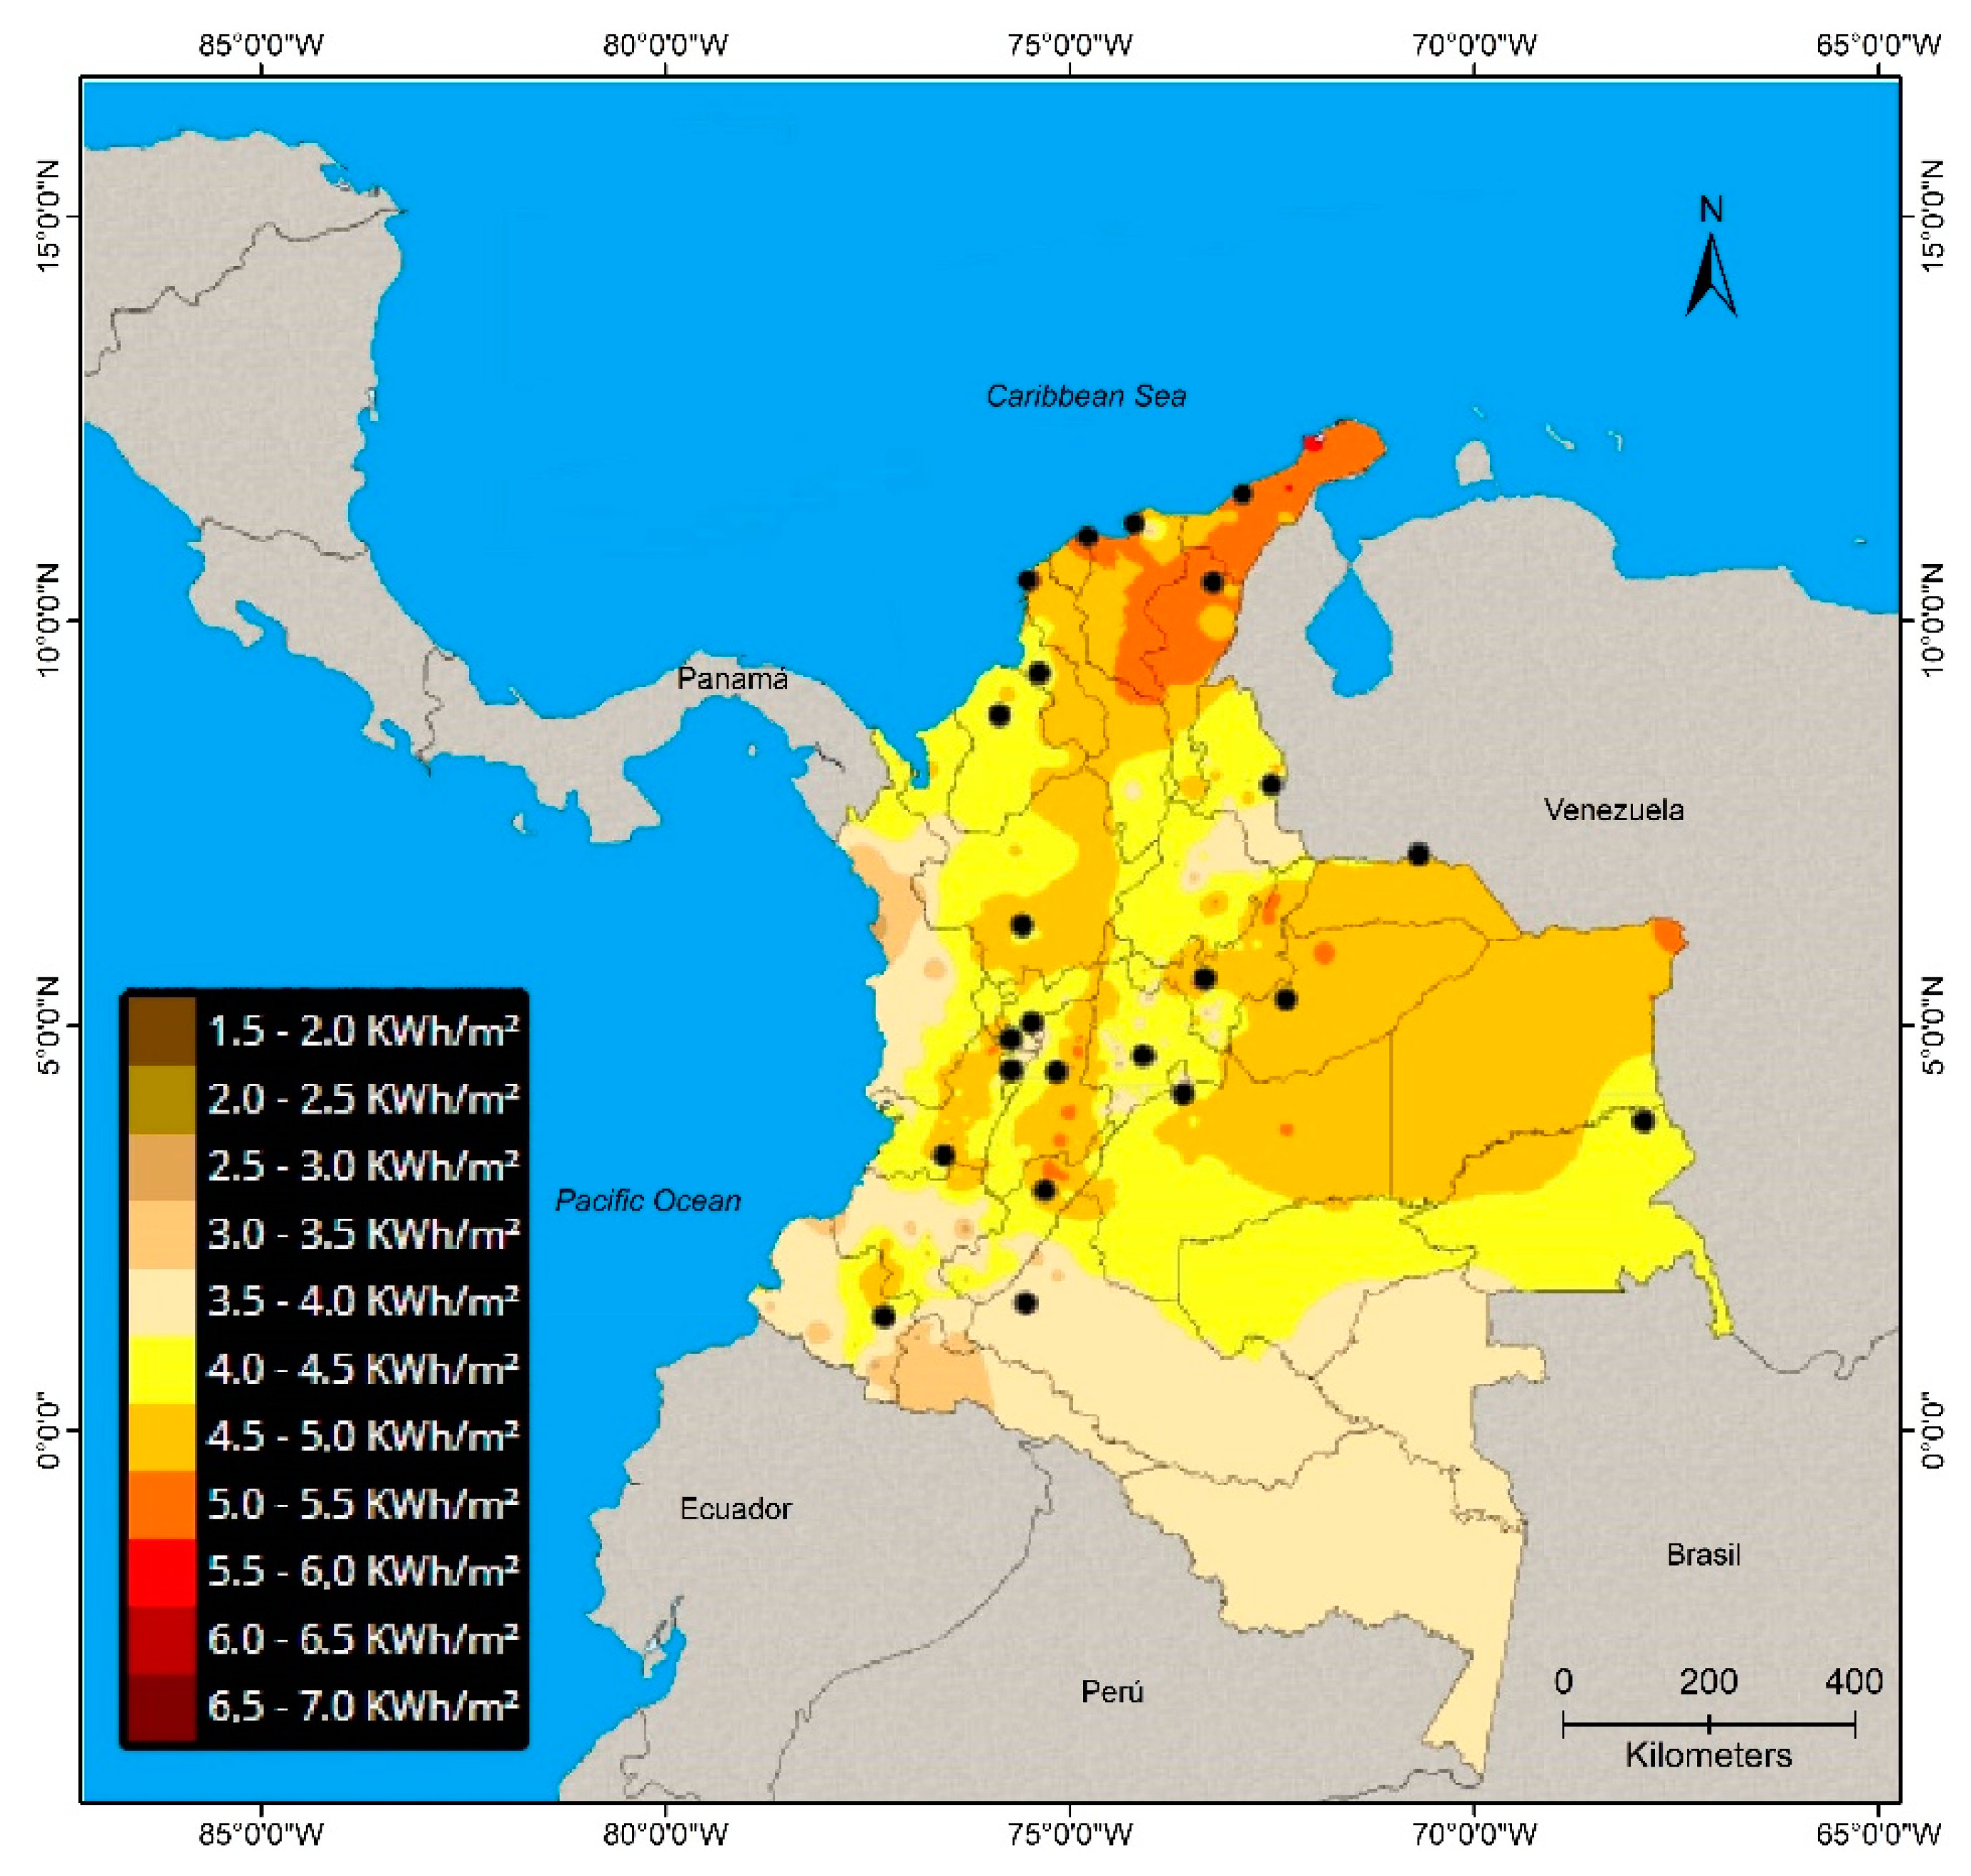
2. Analysis of Solar Radiation and Geographic Information Systems

Photovoltaic systems installed on roofs of buildings decrease the connections to extensive transmission lines since they are installed closer to the load; they require little or no investment in land because the buildings are already built; they are less vulnerable to vandalism because they are not in isolated or easily accessible areas; and they can be more aesthetically attractive to neighbors than some of the other distributed renewable options, such as wind energy [4]. Considering the potential that Colombia has to increase the number of photovoltaic systems mounted on roofs, there is a need to identify the buildings and roofs with the greatest suitability for photovoltaic and thermal installations and evaluating their performance.
The identification and analytical methods should be accurate, fast, and inexpensive, allowing us to reduce the number of complex analyses and field visits from the number currently used in estimations of this type. The lack of information on the daily, monthly, or annual solar radiation specific to each building or construction limits our ability to analyze and identify the potential photovoltaic electrical performance. Although there are thousands of solar radiation monitoring stations throughout the world (many associated with weather stations), for most geographic areas, there are no accurate data on insolation. The ability to model the solar potential on the roofs of buildings with three-dimensional (3D) data can offer an efficient and more accessible way to characterize the potential of a specific area or place.
According to the UPME Atlas of solar radiation, particular regions of Colombia, such as La Guajira, a large part of the Atlantic Coast, and other specific regions in the departments of Arauca, Casanare, Vichada, and Meta, among others, present levels of radiation above the national average that can reach the order of 6.0 (kWh/m2/d) [5]. On the other hand, regions such as the Pacific Coast receive below-average levels, though these are still above the average annual levels received in, for example, Germany [6]. Table 1 presents the average annual calculation of irradiation in the 12 largest cities of the country according to IDEAM.
However, the potential data of the large cities of Colombia presented in Table 1 are not adequate to calculate the photovoltaic potential in different areas, especially on rooftops, mainly because, to understand the behavior at detailed scales, a high spatial resolution of the area is needed. To model the solar energy potential, characteristics of the roof such as its geographic location, slope, shape, inclination, and shadows must be taken into account. To improve the modeling of the solar potential for different photovoltaic and thermal applications, software tools have been developed for the modeling of specific solar systems. These tools include the following: Clean Energy Management Software (RETScreen), a program developed by the Natural Resources Agency of Canada [7]; Hybrid Optimization of Multiple Energy Resources (HOMER), a program of the National Renewable Energy Laboratory (NREL) of the US Department of Energy [8]; INSEL, from the German company of the same name, which provides parameters for the simulation of all photovoltaic modules and inverters available on the market [9,10]; Solar Advisor Model (SAM), also developed by the National Renewable Energy Laboratory, which can model many types of renewable energy systems [9,11]; PVsyst, developed by the Institute of Environmental Sciences (ISE, for its initials in French) of the University of Geneva in Switzerland, which simulates autonomous and networked photovoltaic systems [12]; Transient System Simulation Tool (TRNSYS), developed by the University of Wisconsin solar energy laboratory, which is a model for the simulation of autonomous and networked photovoltaic systems [13]. Many of these tools aim at estimating the solar energy potential in various areas for both photovoltaic and thermal systems. Some also evaluate the possible economic benefits of, for example, a given configuration of photovoltaic systems. However, they do not take into account the complex modeling of the 3D surfaces and the precise geographical position of a roofs. In addition, they do not take into account the specific characteristics of the building, such as trees and adjacent buildings, which could affect the estimation of the solar potential.
In recent years, significant advances have been made in the modeling of solar radiation using such approaches as numerical simulation, statistics, analytics, artificial intelligence, and geographic information systems (GIS) [4]. Many solar radiation models require many parameters that are determined empirically and in conjunction with complementary data acquired with measurement tools that are not widely available in many areas. As a result, the models have difficulty simulating the long-term solar potential for making predictions in areas where measurement instruments are not available or where data are missing from the solar radiation database.
Many of the models where solar radiation simulations have been developed by taking into account the complexity of the terrain and the shapes of the roofs are based on the use of GIS in conjunction with digital surface models (DSMs) or digital terrain models (DTMs) from different types of source data, as illustrated in Table 2. So far, advanced models have been implemented for mapping the urban and rural solar potential through terrain modeling, from photogrammetric, satellite, or aerial sources such as light detection and ranging (LIDAR) and unmanned aerial vehicles (UAVs). These models have allowed the reconstruction of the 3D shape of buildings and other constructions with great detail and precision.
One of the main models developed in a GIS tool is the one developed by Fu and Rich [40], called The Solar Analyst, as a module of the GIS computational tool ArcView 3.0 of the company Environmental Systems Research Institute (ESRI), which was based on the theory of a model called SolarFlux [41,42,43,44]. With the evolution of the ArcGIS 10 program from ESRI, an extension known as the Solar Radiation Toolset was developed. This model generates an ascending hemispheric basin based on a digital terrain model and is suitable for fine-scale or detailed studies [3]. This model is the theoretical and methodological basis of this work. We present the unmanned aerial vehicles–digital surface model (UAV-DSM) method based on the calculation of the hemispheric basin to estimate the solar energy potential in different areas, such as the roofs of buildings, through analysis of GIS data in conjunction with high-resolution surface data resulting from the processing of images taken by an UAV. As a fundamental part of the characterization of the energy potential for photovoltaic systems, the area of roof coverage is analyzed before and after the installation of solar panels, which allowed us to know the relationship between the different variables involved in the development and distribution of the solar energy potential.

3. Case Study

The roof of a building on the Santiago de Cali University campus was used as a case study. Located to the south of the city of Cali, this structure is surrounded by a large residential area and has a footprint of approximately 2078 m2, framed between the geographical coordinates 3°24′14.00″ N and 76°32′51.17″ W (Figure 2). The urban relief of the city is largely flat, though there are mountains and low hills towards the western side. It has a high density of arboreal vegetation and multiple green spaces. The city of Santiago de Cali is located at an average altitude of 1018 m above sea level, covering an area of approximately 619 km2. The average temperature is 23.9 °C. At noon, the maximum temperature is 30–31 °C. At dawn, the minimum temperature is 19–20 °C [45]. The sun shines on average approximately 4 h per day, with good radiation in the rainy months, but in the dry months, the insolation reaches 6 h per day of full radiation on average [45].

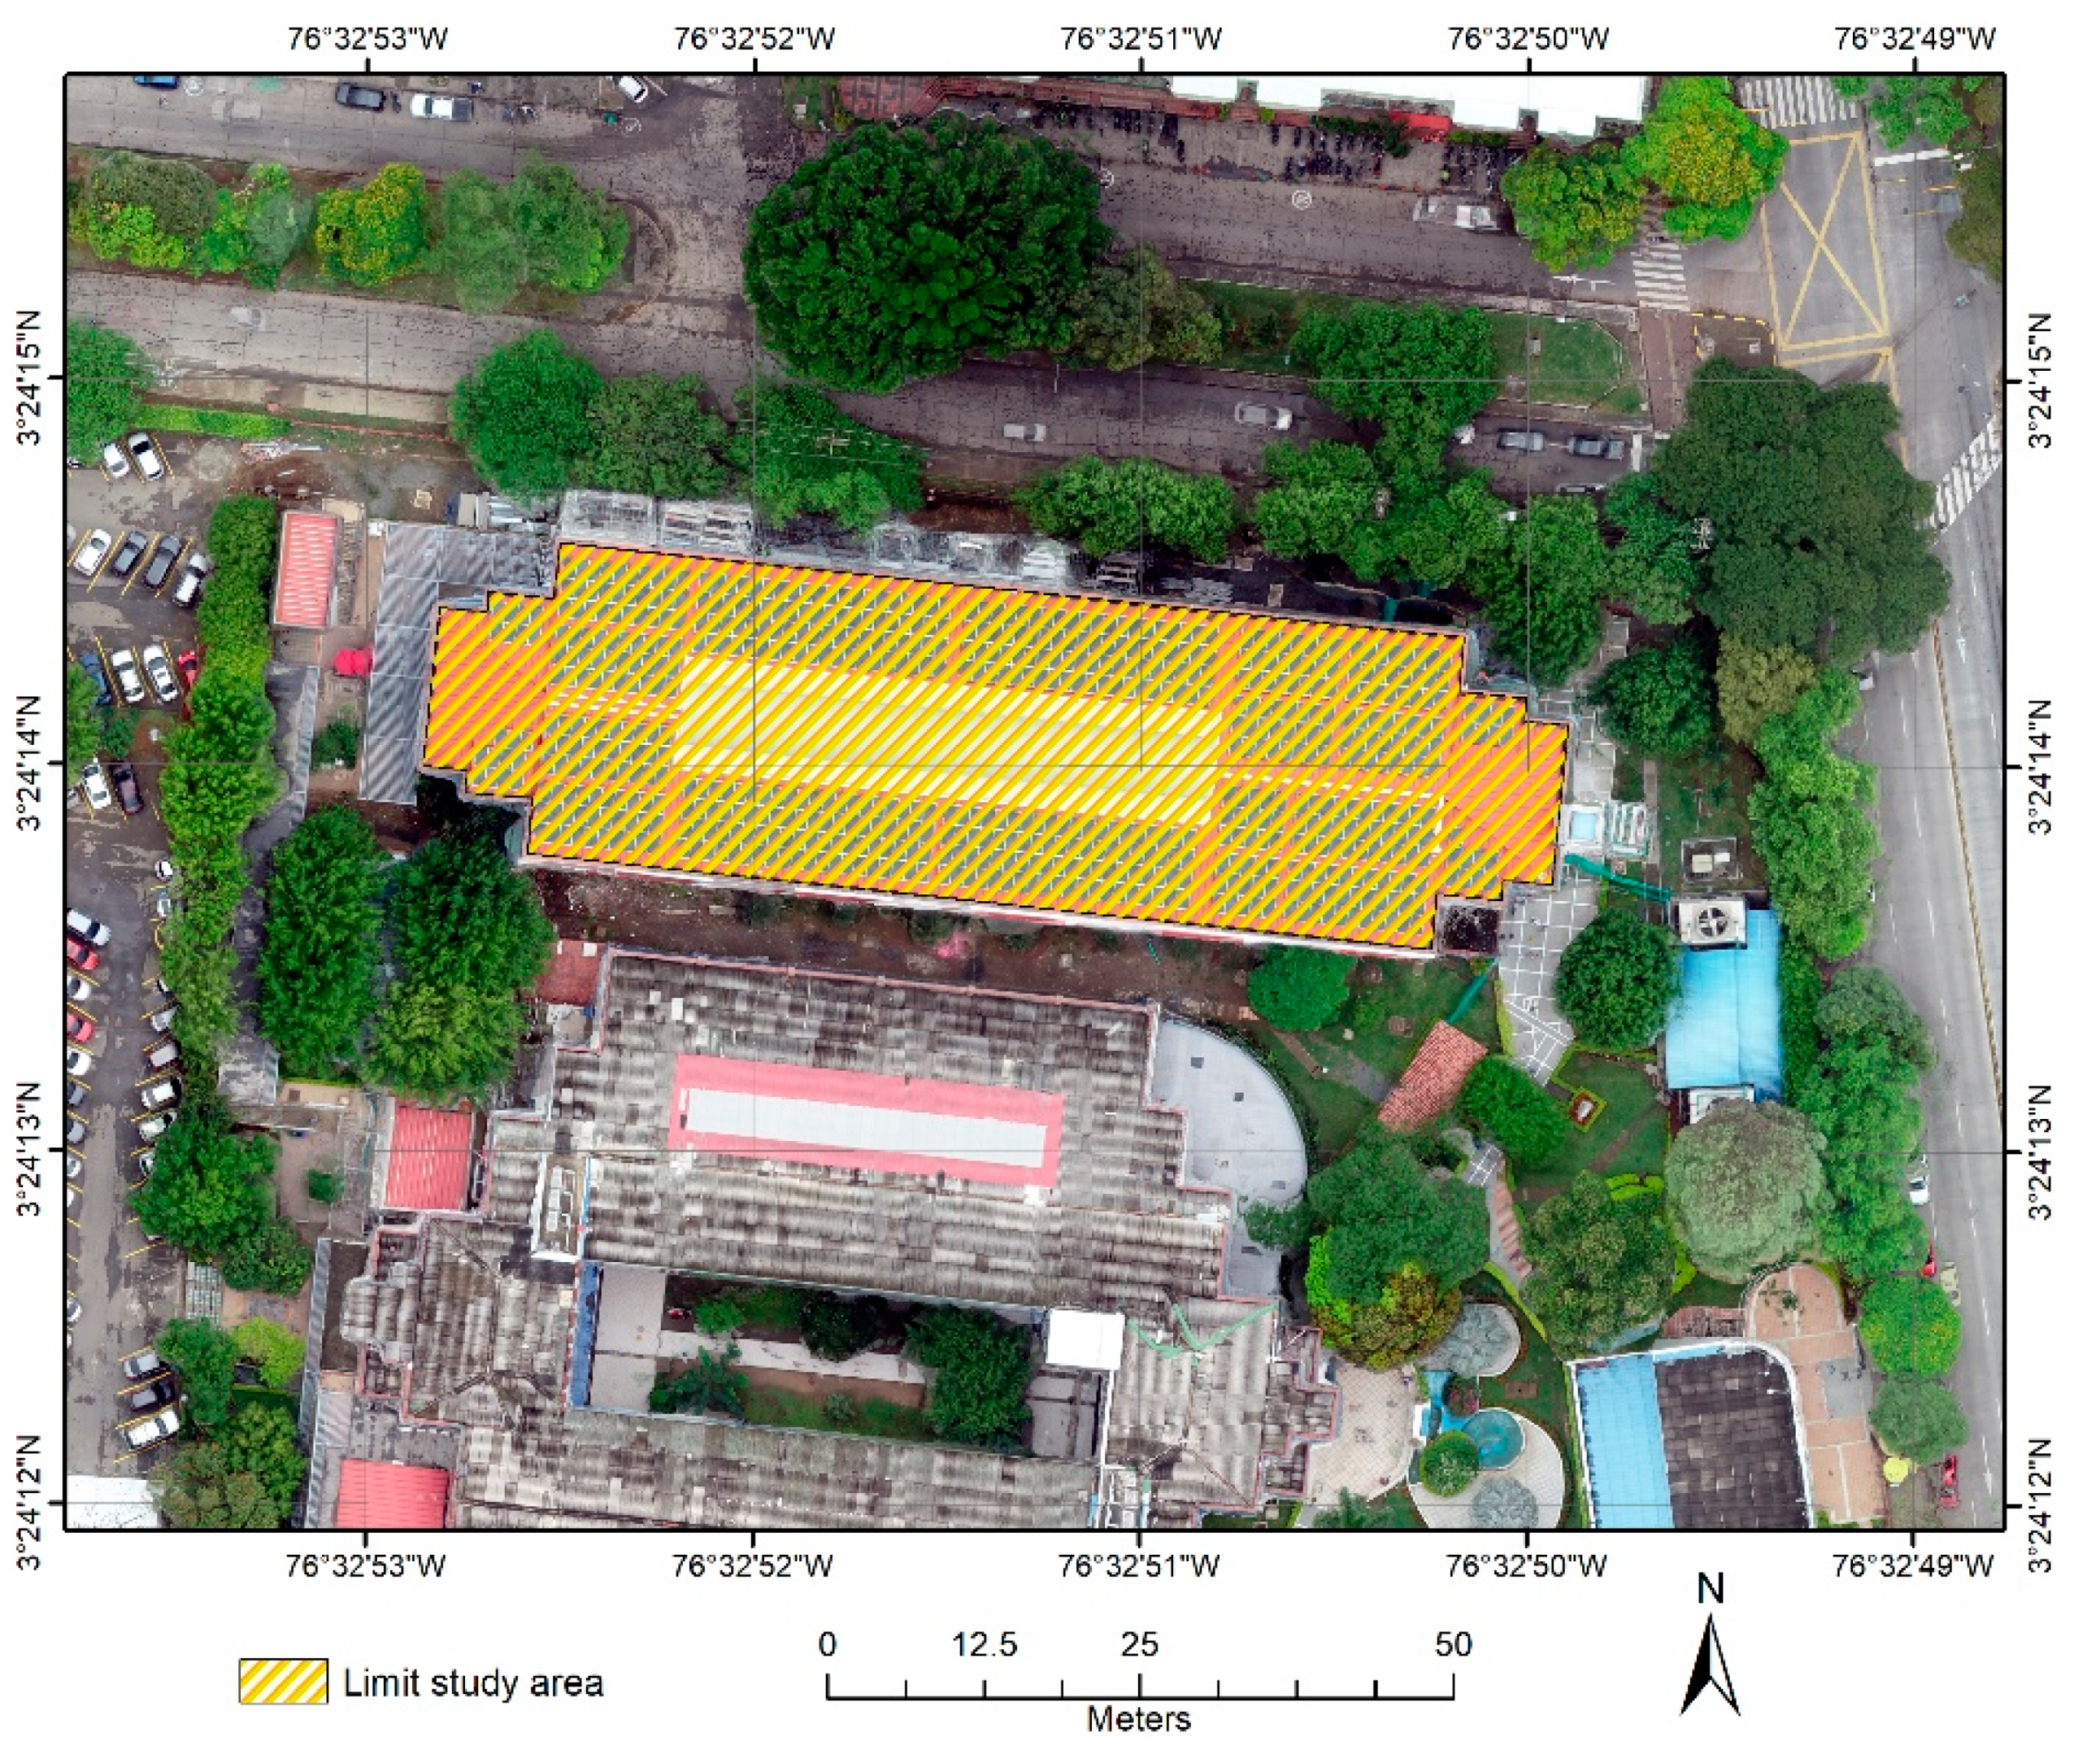
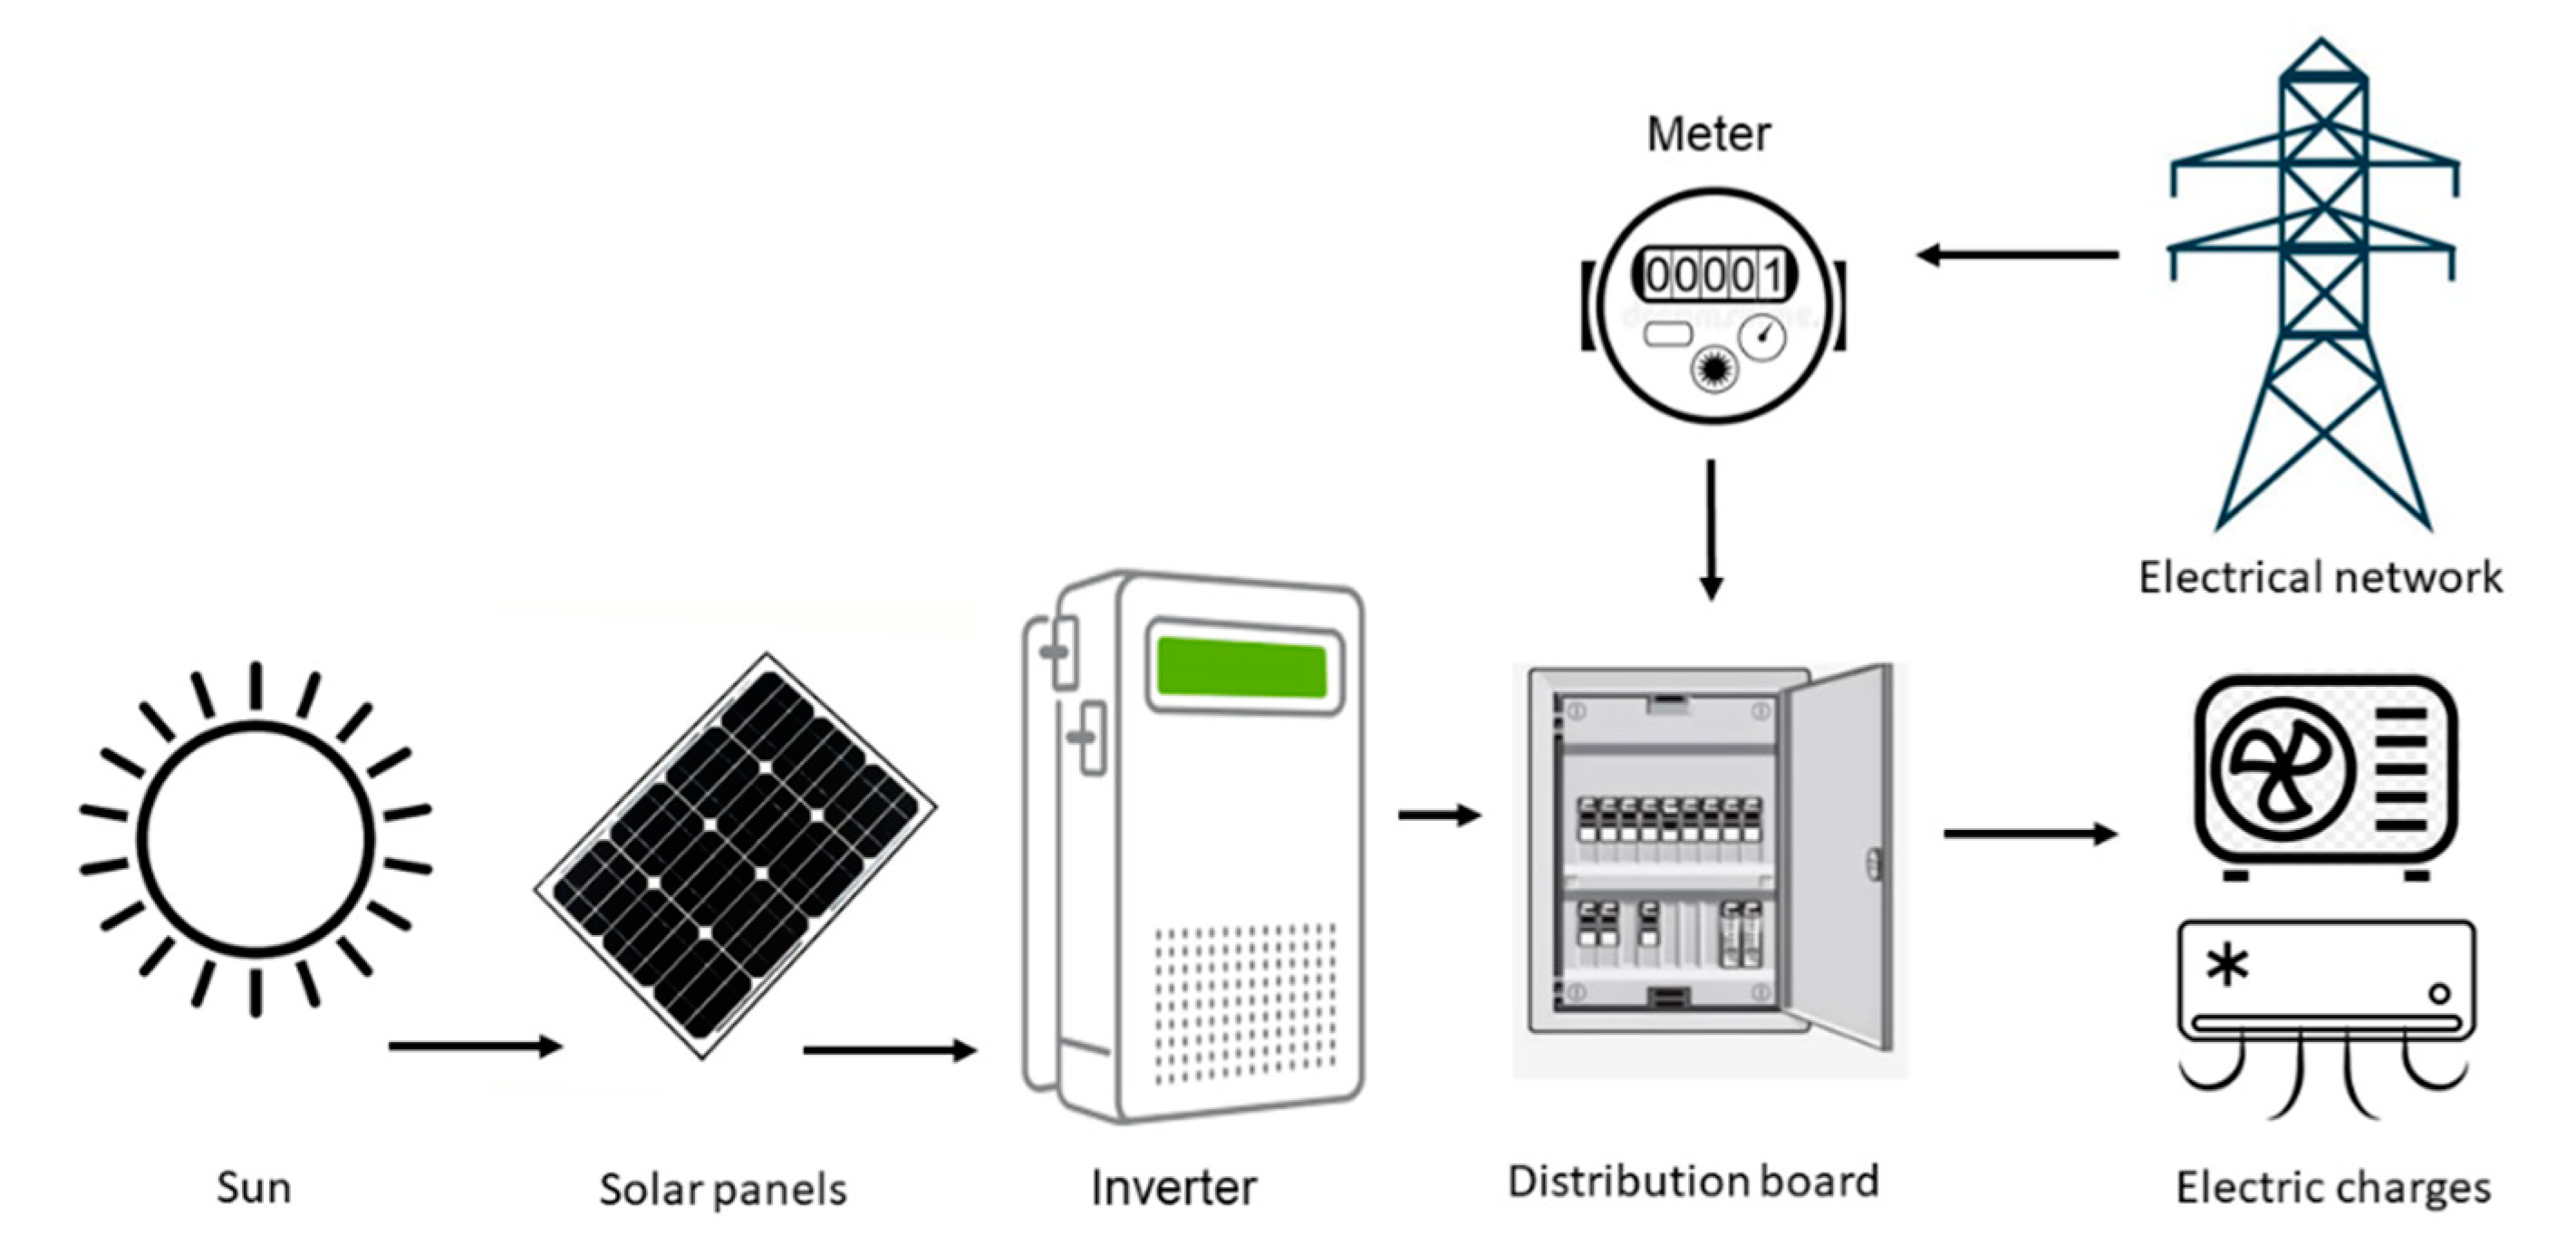
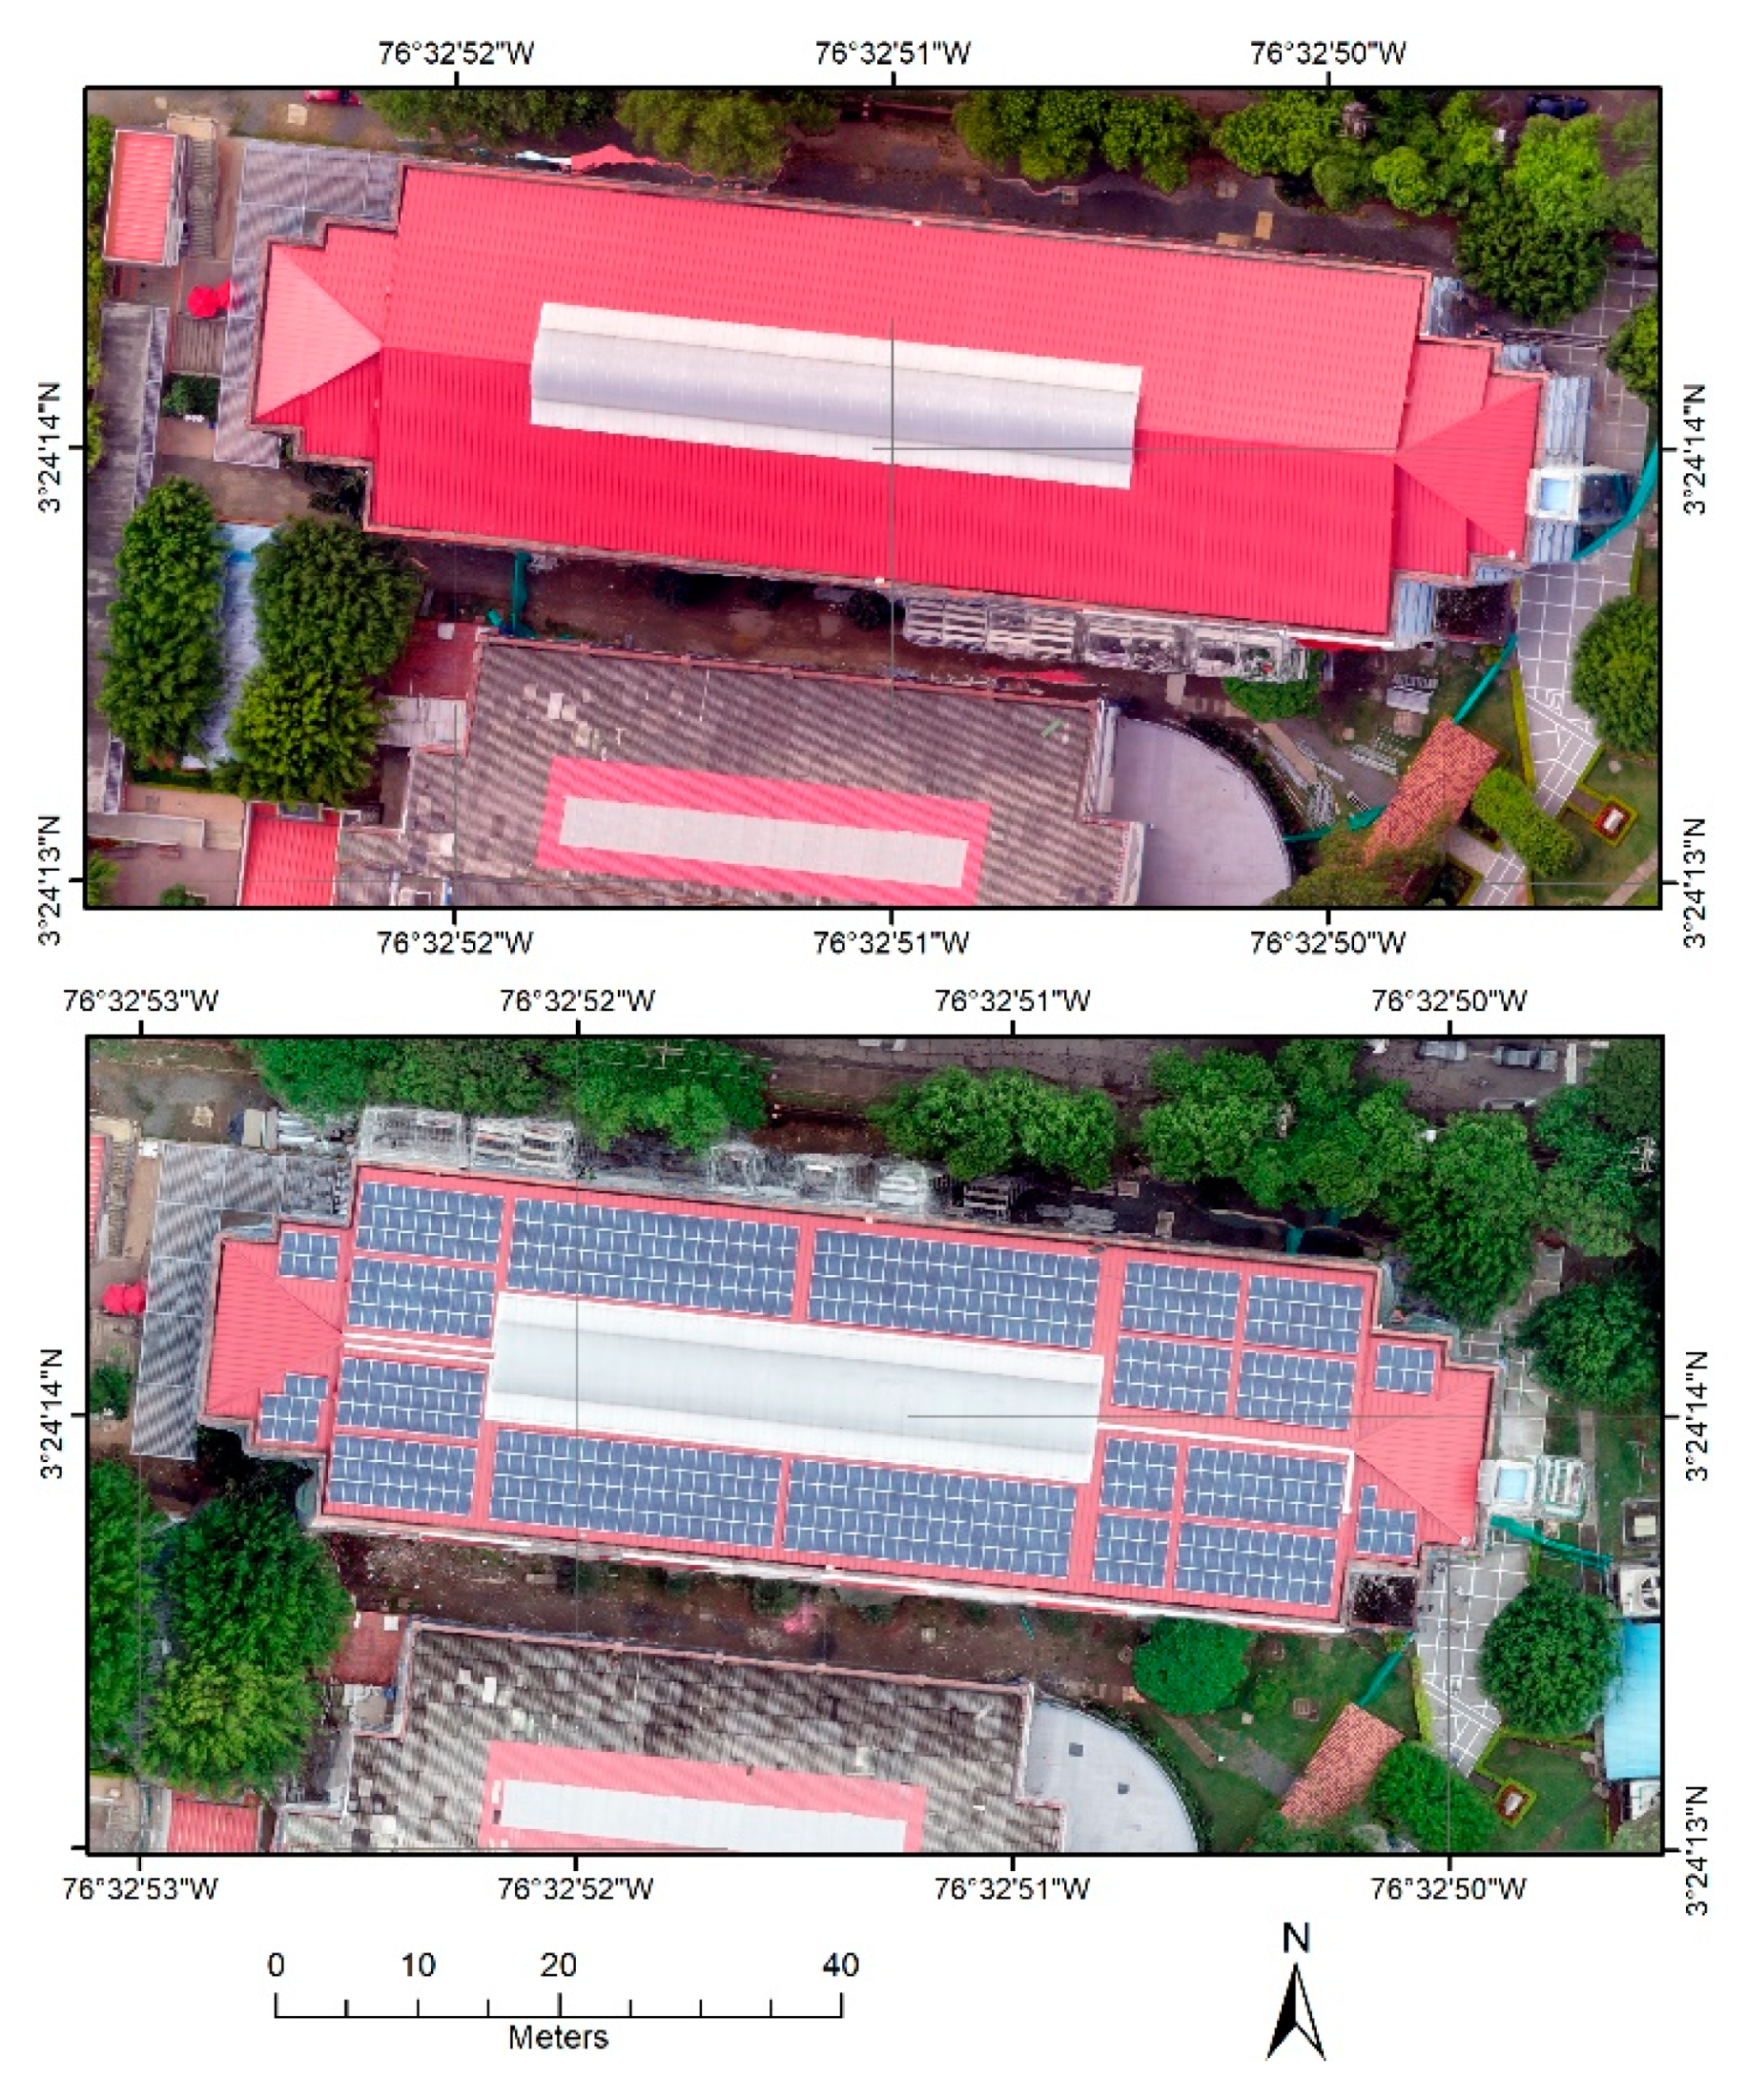
3.1. Photovoltaic System Case Study

The Santiago de Cali University installed in 2018 a photovoltaic system on a building of the campus known as Block 1. This project developed a solution that is interconnected to the grid and operates without a battery. The energy consumed comes simultaneously from the photovoltaic system and the electrical grid, making it ideal for buildings with high energy consumption during daylight hours, as it takes full advantage of this natural, renewable, and clean electricity production resource. The system in question consists of 668 JA Solar polycrystalline solar panels, each with a power of 275 watts peak (Wp) and an area of 1.63 square meters, such that the total area used on the roof of Block 1 covers an area of 1092 square meters. The solar panels in question operate at a peak efficiency of 16.82%.
In this work, the veracity of these data provided by the manufacturers is evaluated over a period of one year of electrical energy production, specifically the year 2019. All the technical information of the panels of the case study can be found in the Solar Design Tool application [46]. The photovoltaic system has six inverters (24,000 W each; Fronius Symo 24.0-3 three-phase), which have data acquisition systems for electrical parameters such as voltage, current, electrical power, energy produced, and power factor. The photovoltaic system also has a sensor for the meteorological parameters environmental temperature, irradiation, and temperature of the solar panels. The general scheme of the photovoltaic project of the case study is illustrated in Figure 3.

4. Study Methods

This section details the methods based on the use of photogrammetric data from a UAV, which we call the DSM-UAV method. This method facilitates and improves the estimates of the radiation potential from a 3D model in great detail and at low cost.

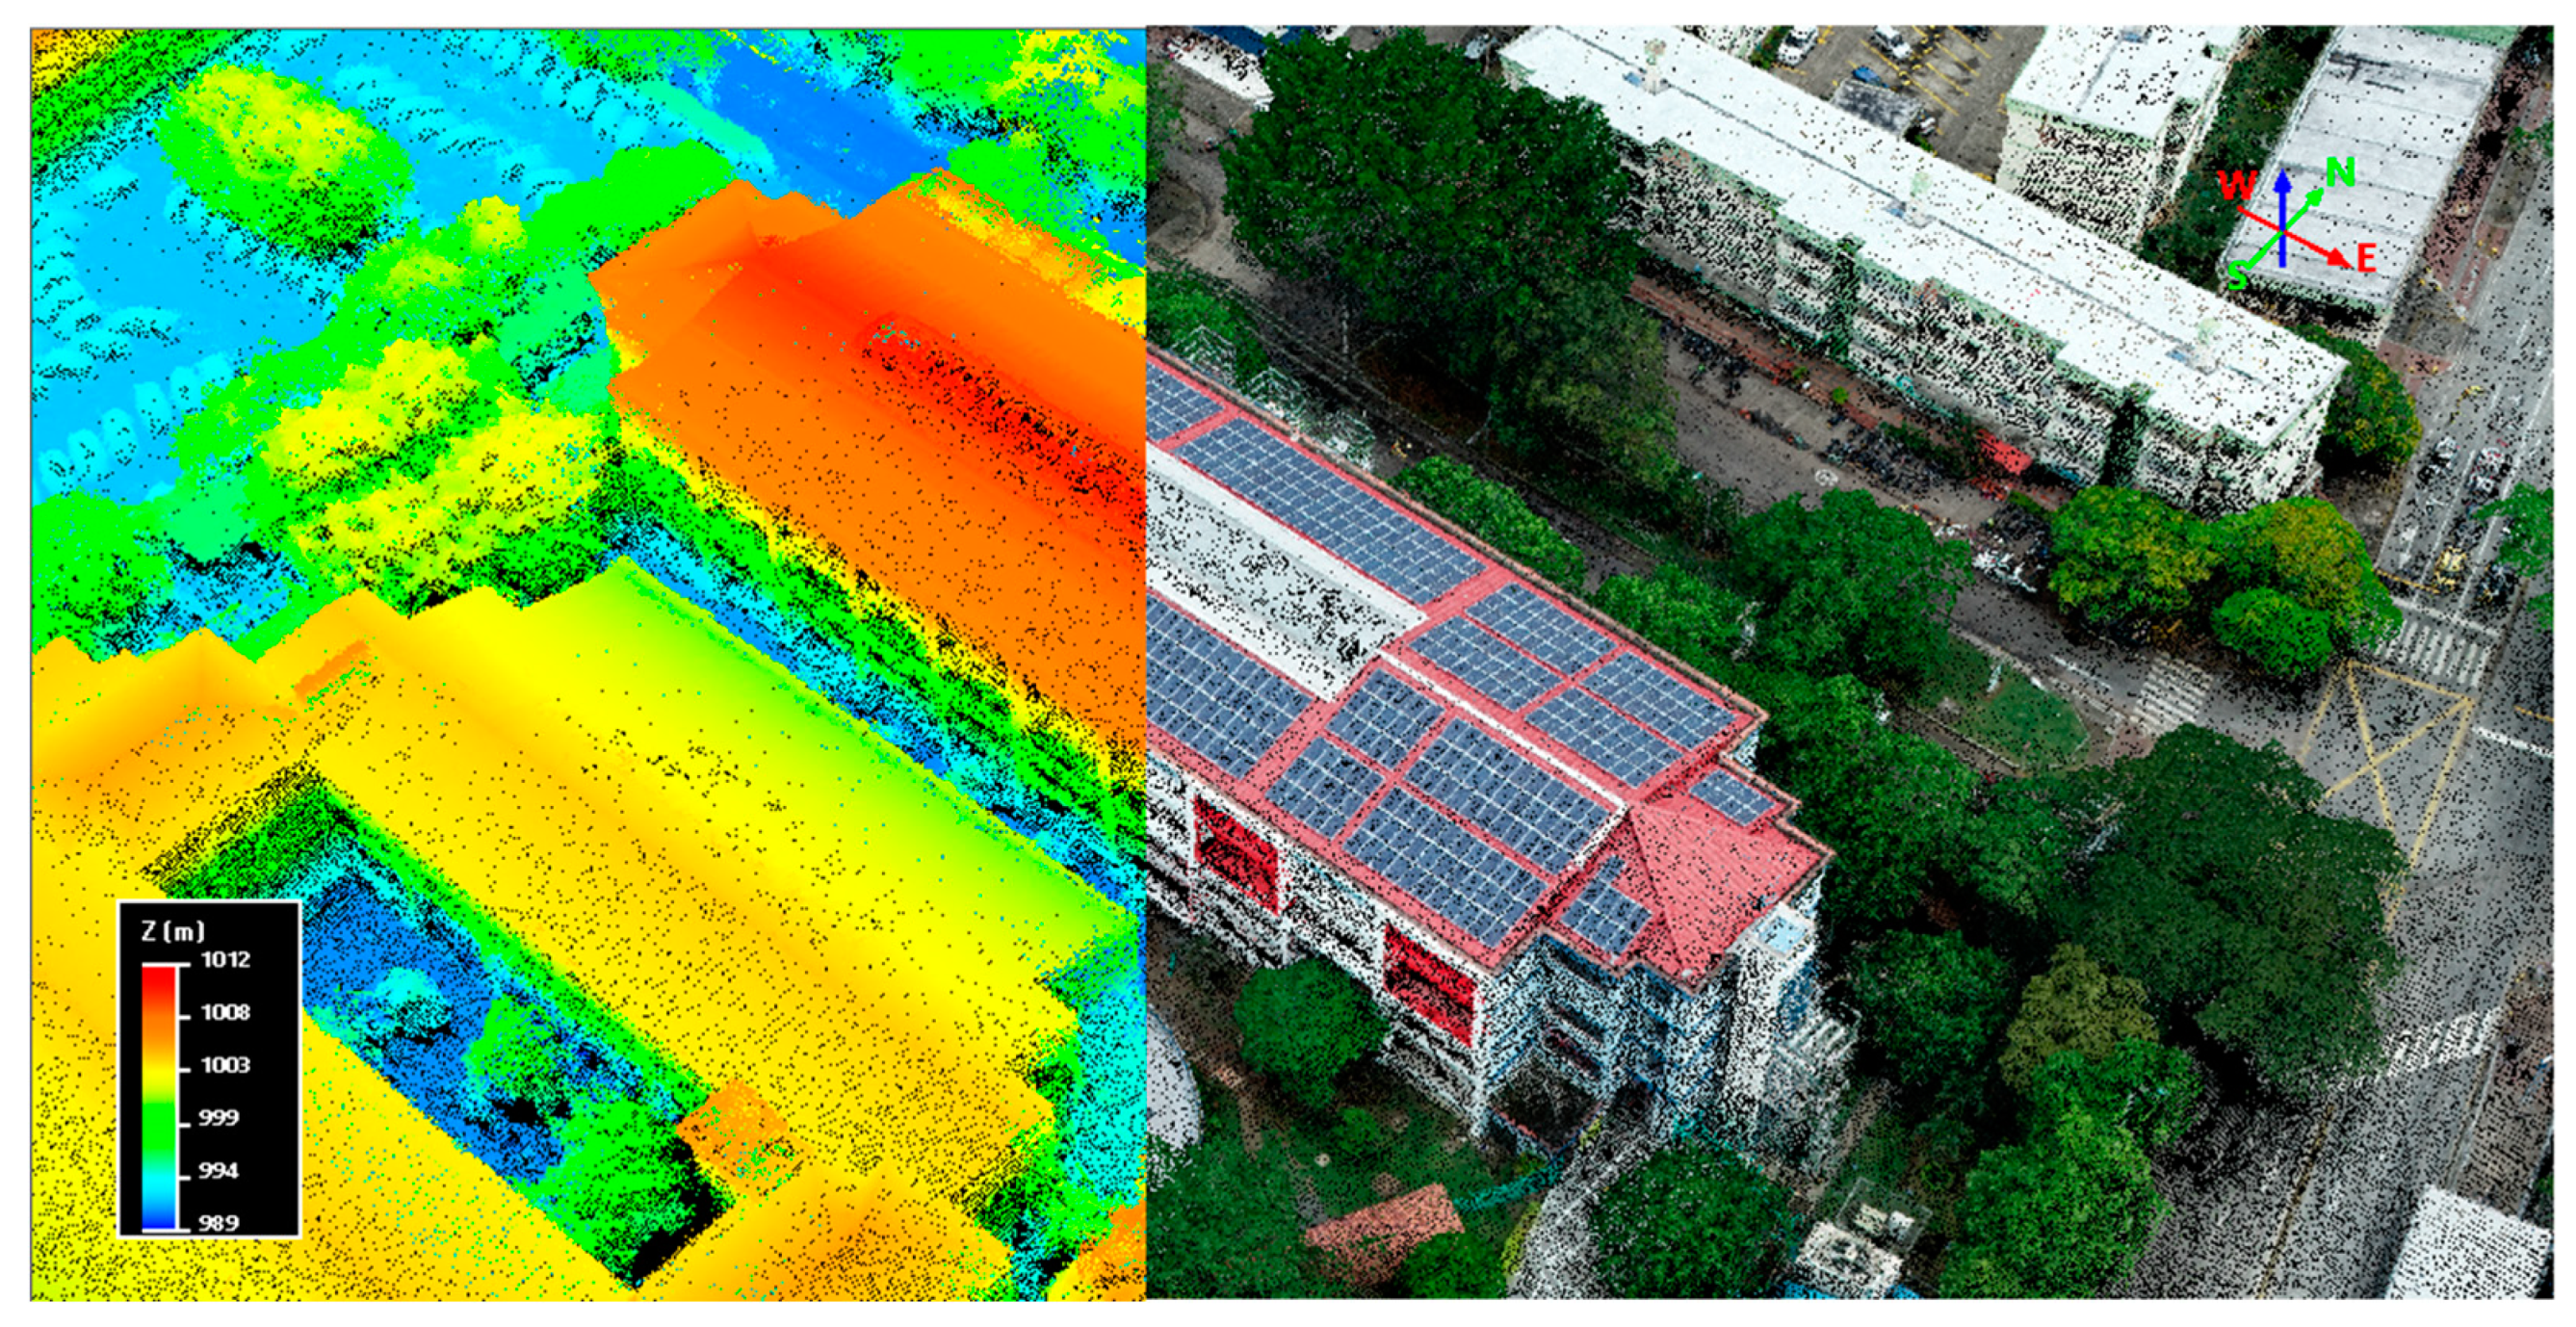
4.1. Digital Surface Models Based on UAVs

Photogrammetry is a 3D reconstruction technique based on stereoscopic images that is used to capture topographic information of the Earth’s surface from platforms such as airplanes, satellites, and UAVs. The UAV system involves the use of photographic sensors mounted on the body of the aerial platform. During a flight, the onboard camera captures hundreds of photos with an overlap of at least 60% between aerial images [48]. Aerial photographs must contemplate a height and a flight plan referring to the object to be measured in order to construct a 3D image. These aerial images by themselves do not include elevation data. For the data to be useful for the calculation of the elevation, the position of each image at the time of shooting must be known. To capture elevation, a global positioning system (GPS) is mounted on the UAV. As the photographic sensors take the images, the GPS sensor records the location of the data. The final product is the photograph with its exact geographically recorded longitude, latitude, and elevation. These data are fed into collinearity algorithms to reconstruct the 3D shape of the terrain in a surface model.
UAVs have several advantages: it is easy to collect many photos from low altitudes (less than 150 m) and in small areas because the photography portion of the project is reduced from days to hours, and the data collected are of greater precision and detail than those taken with satellites or conventional aircraft. The large amount of high-resolution 3D data collected from a UAV and the products derived from surface models that in turn come from aerial photos are the basis of the proposed UAV-DSM method. We use this method for the estimation of solar energy potential on different surfaces, especially roofs of buildings. The resolution of the elevation model to estimate the solar potential on roofs should accurately reflect the unique characteristics of the roof, such as slope, orientation, adjacent structures, and vegetation. In this study, a DJI Phantom 3 Advanced multicopter equipped with a 12.4-megappixel camera was used for image collection.
The height of the flights performed in this study was approximately 80 m above the ground, and more than 400 images were selected for further processing and 3D point cloud generation. The acquired images were processed in Pix4D version 4.5 software, which uses a combination of stereo camera motion approaches and collinearity algorithms in a widely used method to derive point clouds known as DSMs. Some examples of these derivations in geospatial data can be found in works based on high-resolution photogrammetric sources [44,49,50,51].
The UAV-DSM method performs an alignment procedure, iteratively refining the external and internal orientations of the camera and the camera locations through a least-squares method, generating a scattered point cloud, followed by a 3D reconstruction algorithm. The alignment is completed using the alignment precision parameter and the preselection of pairs in the point cloud and mesh. High-precision GPS support points are introduced to improve the accuracy established in the “high” configuration, guaranteeing a correct mapping of the position, while the preselection of images guarantees the best image coincidence with the terrain support points. The DSM and the photomosaic model are generated after adjusting the photogrammetric block to generate a dense point cloud, as illustrated in Figure 4, where the 3D shapes are reconstructed with high quality. We georeferenced the point clouds using 10 ground support points established within the study area that were taken with a high-precision GPS receiver (MobileMapper CX, Magellan, France).

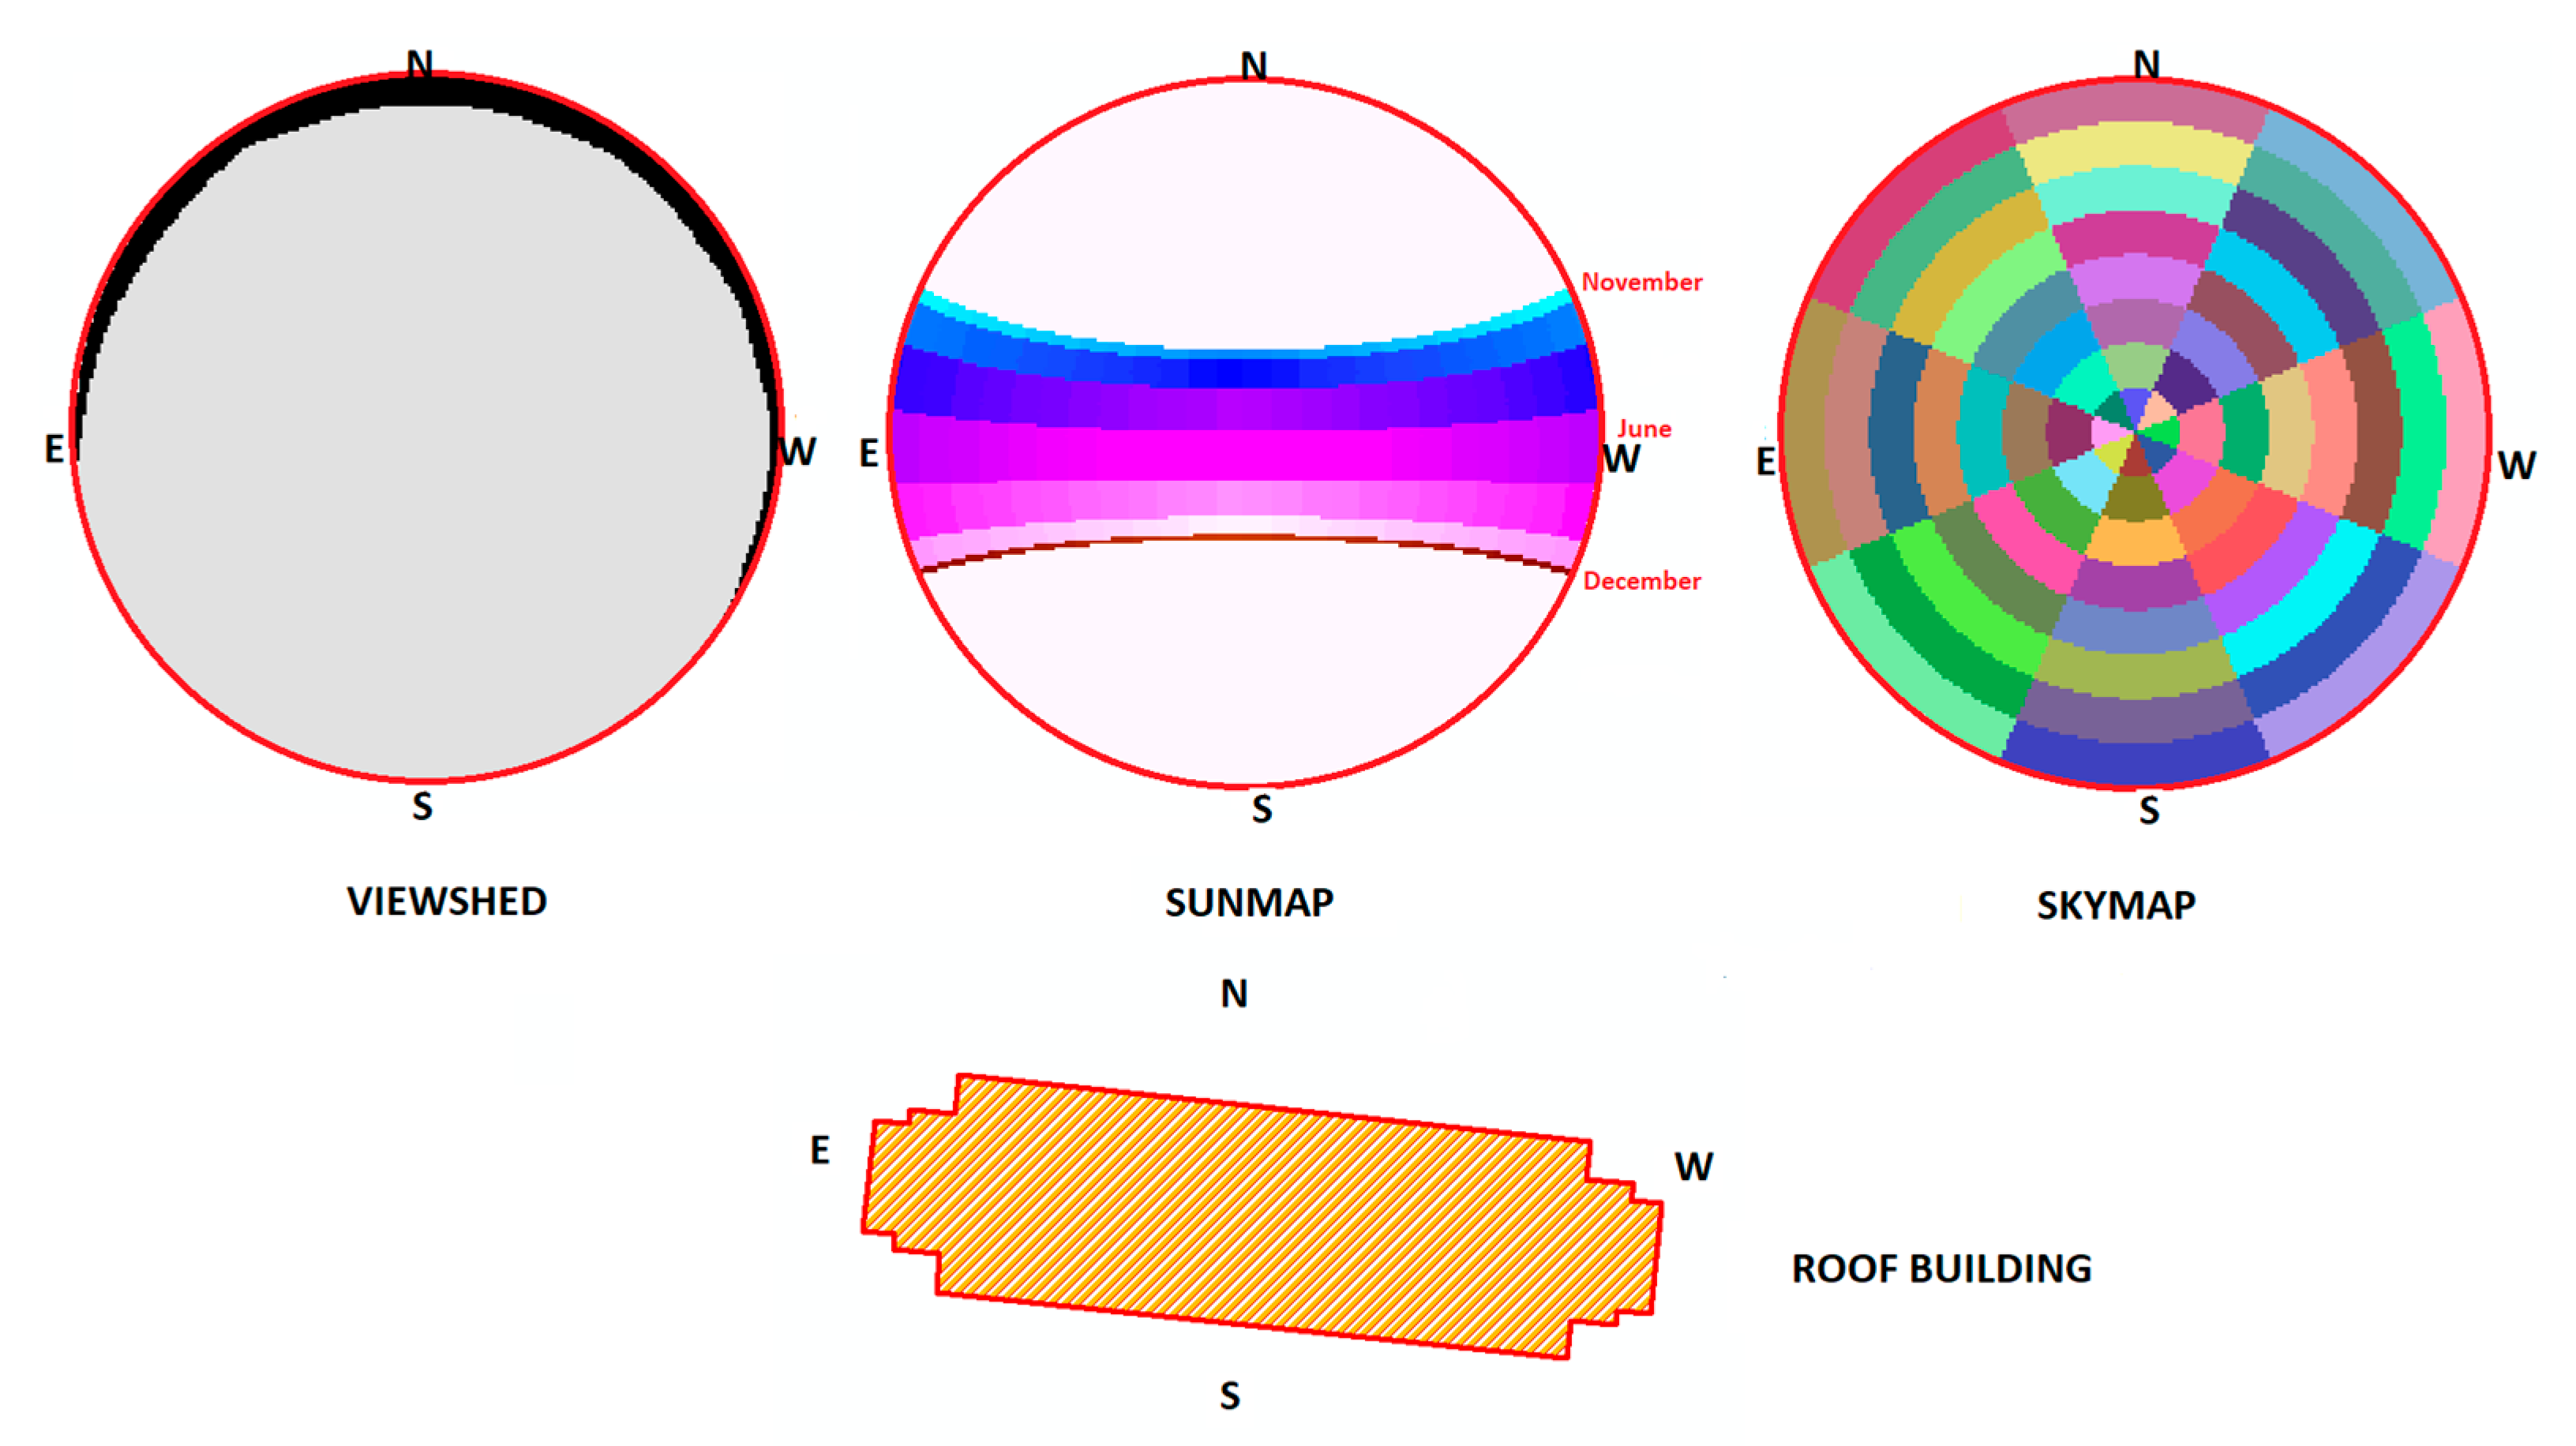
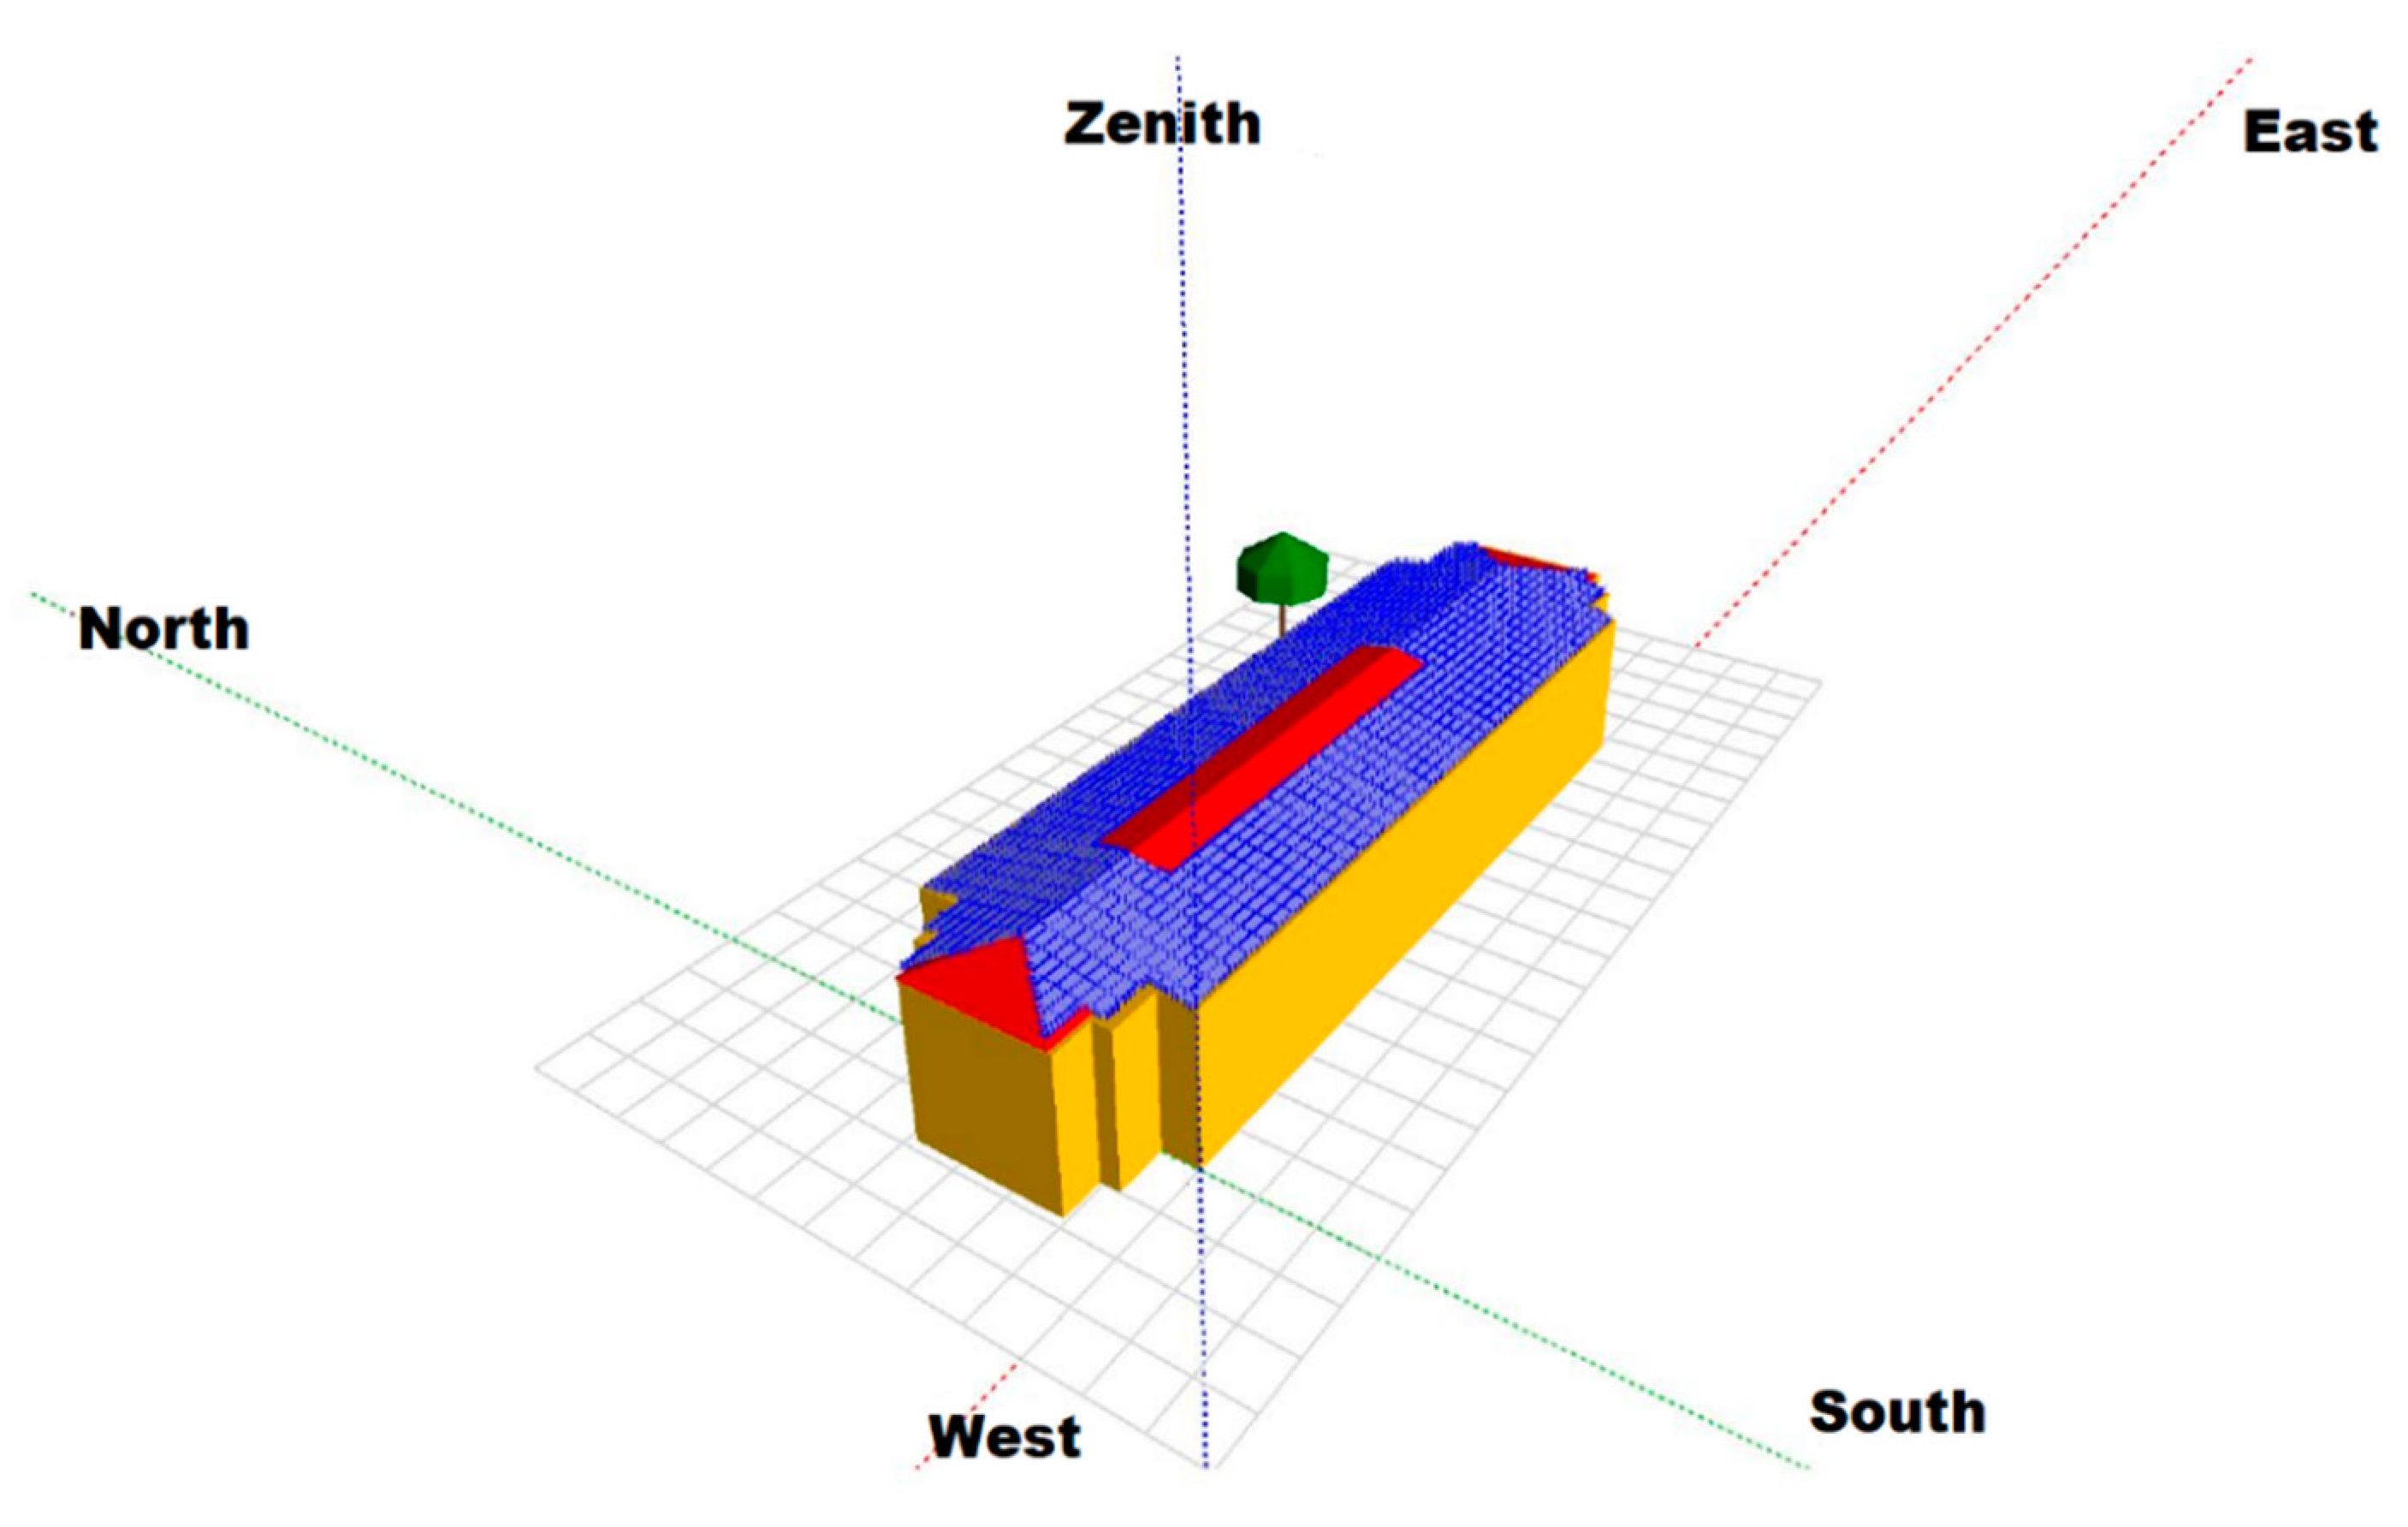
4.2. Solar Simulation of the Celestial Vault

Simulating the solar energy potential of some surfaces, such as the roofs of buildings, is complex and requires very detailed information to achieve good results. The large amount of radiation from the sun, modified as it travels through the atmosphere, is calculated as the solar constant, which is approximately 1367 [kW/m2]. The extraterrestrial solar radiation that actually reaches the Earth and is usable is highly variable. According to Šúri and Hofierka [52], three main factors determine the interaction of solar radiation with the Earth’s atmosphere and surface: (i) the position of the Earth with respect to the sun; (ii) the land surface; and (iii) the atmosphere. To estimate solar irradiance, GIS models must take into account these three factors, usually in the form of (i) solar parameters; (ii) a DSM to estimate the orientation of the building, roof slope, and shading; and (iii) information on the atmospheric absorption and dispersion of solar radiation. Climate and other atmospheric considerations, such as the effect of aerosols (solid or liquid substances present in the atmosphere) and atmospheric diffusion, also affect the final values of solar radiation.
The elevation model is used to project the hemispherical viewshed in a two-dimensional grid where we can characterize all possible directions around the geographical position and analyze the maximum possible angle of obstruction around the surface model. To perform this calculation, the shadow effect of the highest pixels in relation to their lowest neighbors is used. The resulting viewshed shows the directions in which the sky is visible and obstructed. After the calculation of the viewshed from the surface model, the sunmap is produced, which is equivalent to a representation of the apparent solar path of the sun according to its variation over time in certain intervals (hours, days, months), according to the latitude and location of the study area, as shown in Figure 5. This map is used to estimate the amount of direct solar radiation that a certain location in the surface model receives. The solar position (zenith and azimuth angles) is calculated as a function of latitude, day, time, and year using astronomical formulas [53]. The skymap in Figure 5 subdivides the sky vault into zenith and azimuth, grouped into different sectors. This map is used in the calculation of the diffuse solar radiation received by the surface model. Diffuse solar radiation originates from all directions in the sky as a result of the scattering of sunlight by the atmosphere (due to the presence of particles, aerosols, dust, and clouds). The different visible sectors of the sky show the central point and the azimuth angles that represent the direction of each sector of the sky when assigning a single identification value.

4.3. Calculation of Solar Radiation

After obtaining the calculations of the viewshed, the sunmap, and the skymap, this information is taken to calculate the diffuse and direct radiation received by the elevation model. The total solar radiation or global solar radiation (Rad_Glob) is calculated as the sum of the direct (Rad_Dir) and diffuse solar radiation (Rad_Dif) of all sectors of the sunmap and the skymap according to Fu [54]. This calculation takes into account the position of the sun, the attenuation of the atmosphere, and how the topographic reception surface is oriented. The result is a solar radiation map for the entire area of interest, as illustrated in Equation (1):
Rad_Glob = Rad_Dir + Rad_Dif
The total direct radiation (Rad_Dir) for a given location is the sum of the direct insolation (Dir) of a sector of the sunmap with a centroid at the zenith angle θ and azimuth angle α, as expressed in Equation (2):
Rad_Dir = Σ Dir θ,α
The total diffuse solar radiation (Rad_Dif) for a given location is the sum of the diffuse radiation (Dif) of a sector of the sunmap with a centroid in the zenith angle θ and azimuth angle α, as illustrated in Equation (3):
Rad_Dif = Σ Dif θ,α
Direct insolation is calculated using Equation (4):
Dir = ConS × βm (θ) × SolDurθ,α × SolGapθ,α × cos (AngInθ,α)
where:
  • ConS is the solar constant and has a value of 1367 [kW/m2], as calculated in 1981 by the World Radiation Center [55];
  • β is the transmissivity of the atmosphere for the shortest path in the zenith direction;
  • m (θ) is the relative length of the optical path;
  • SolDurθ,α is the duration of time represented by the sky factor;
  • SolGapθ,α is the fraction of space for the sunmap sector;
  • AngInθ,α is the angle of incidence between the centroid of the sky sector and the normal axis to the surface.
Diffuse radiation (Diff) is calculated using Equation (5):
Dif = Rglo × Pfr × Dur × SkyGapθ,α × Weightθ,α × cos (AngInθ,α)
where:
  • Rglo is the global normal solar radiation;
  • Pfr is the proportion of the global normal solar radiation flux that is diffused; it is approximately 0.2 for very clear sky conditions and 0.7 for very cloudy sky conditions;
  • Dur is the time interval for the analysis;
  • SkyGapθ,α is the fraction of space (proportion of visible sky) for the sky sector;
  • Weightθ,α is the proportion of diffuse radiation originating in a certain sector of the sky in relation to all sectors;
  • AngInθ,α is the angle of incidence between the centroid of the sky sector and the intercept surface.

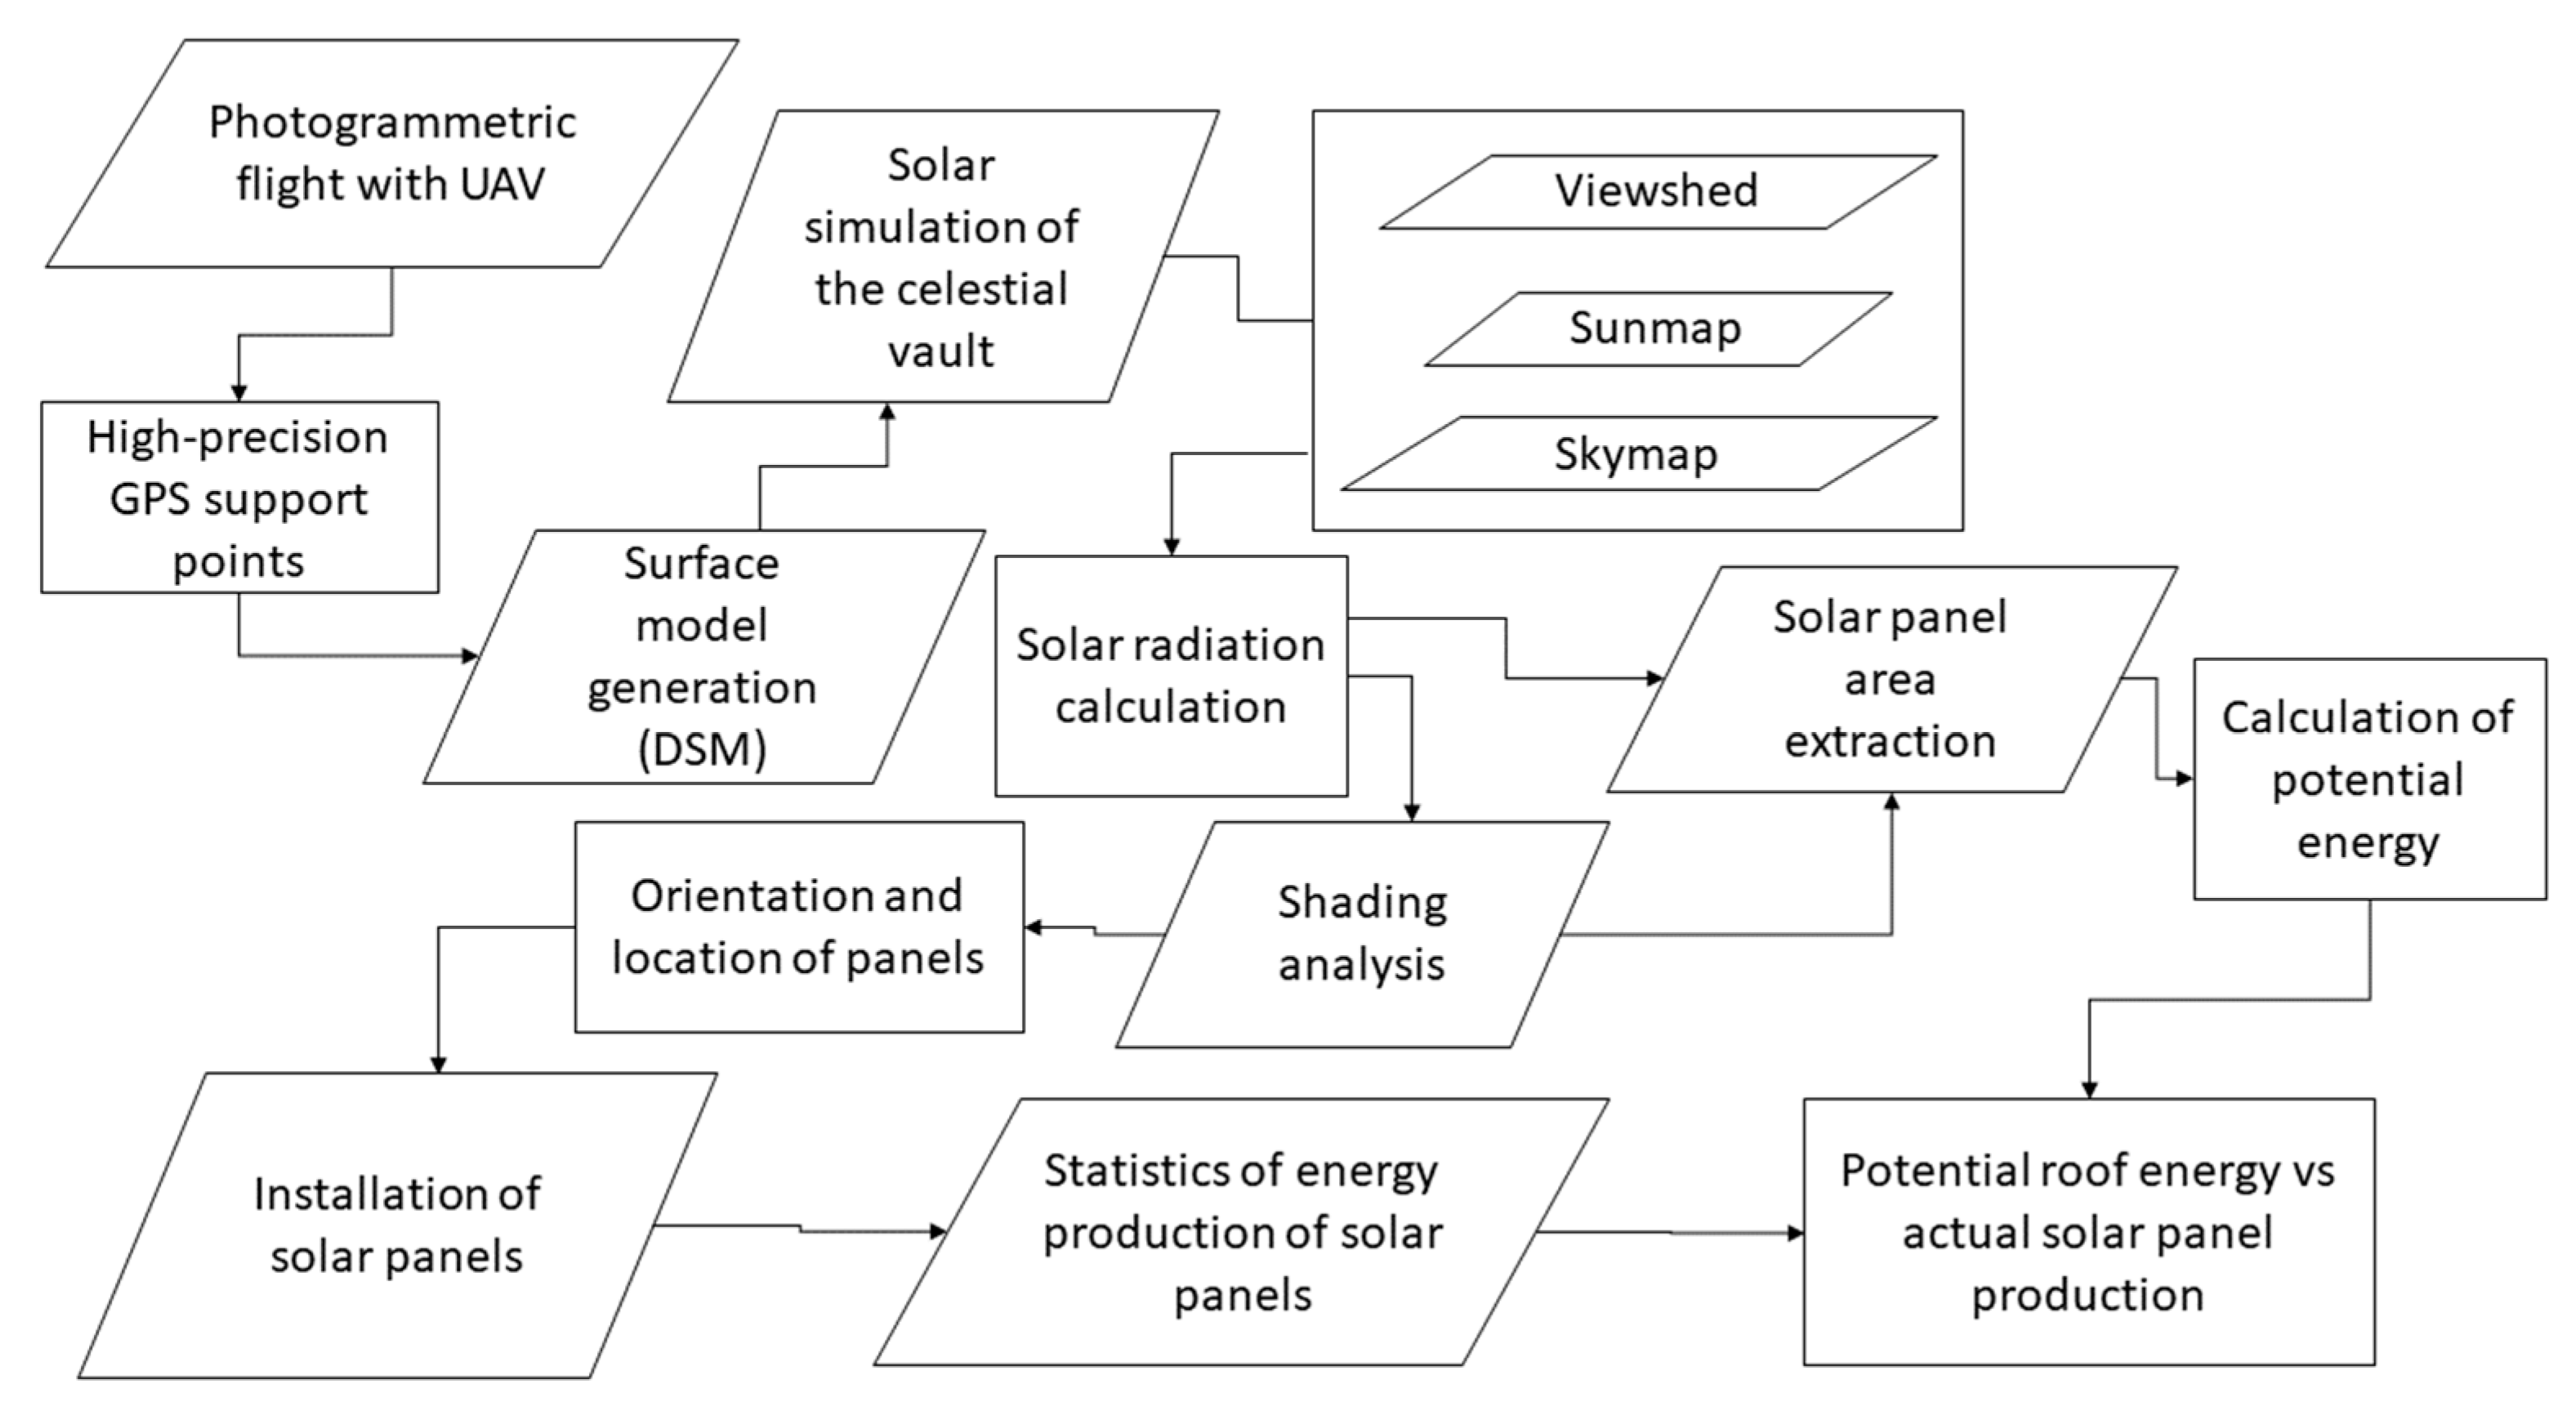
4.4. UAV-DSM Method Workflow

The unique capabilities of the UAV-DSM method for estimating the solar energy potential from GIS data based on surface models from UAV data facilitate the creation of solar radiation maps on rooftops with high precision. These two tools are integrated into the above workflow to analyze the solar radiation potential of a specific area. In this work, the solar potential of the UAV-DSM method is compared against the real performance obtained from the solar panels in the case study. Figure 6 shows a flowchart of the UAV-DSM method performed in this work.

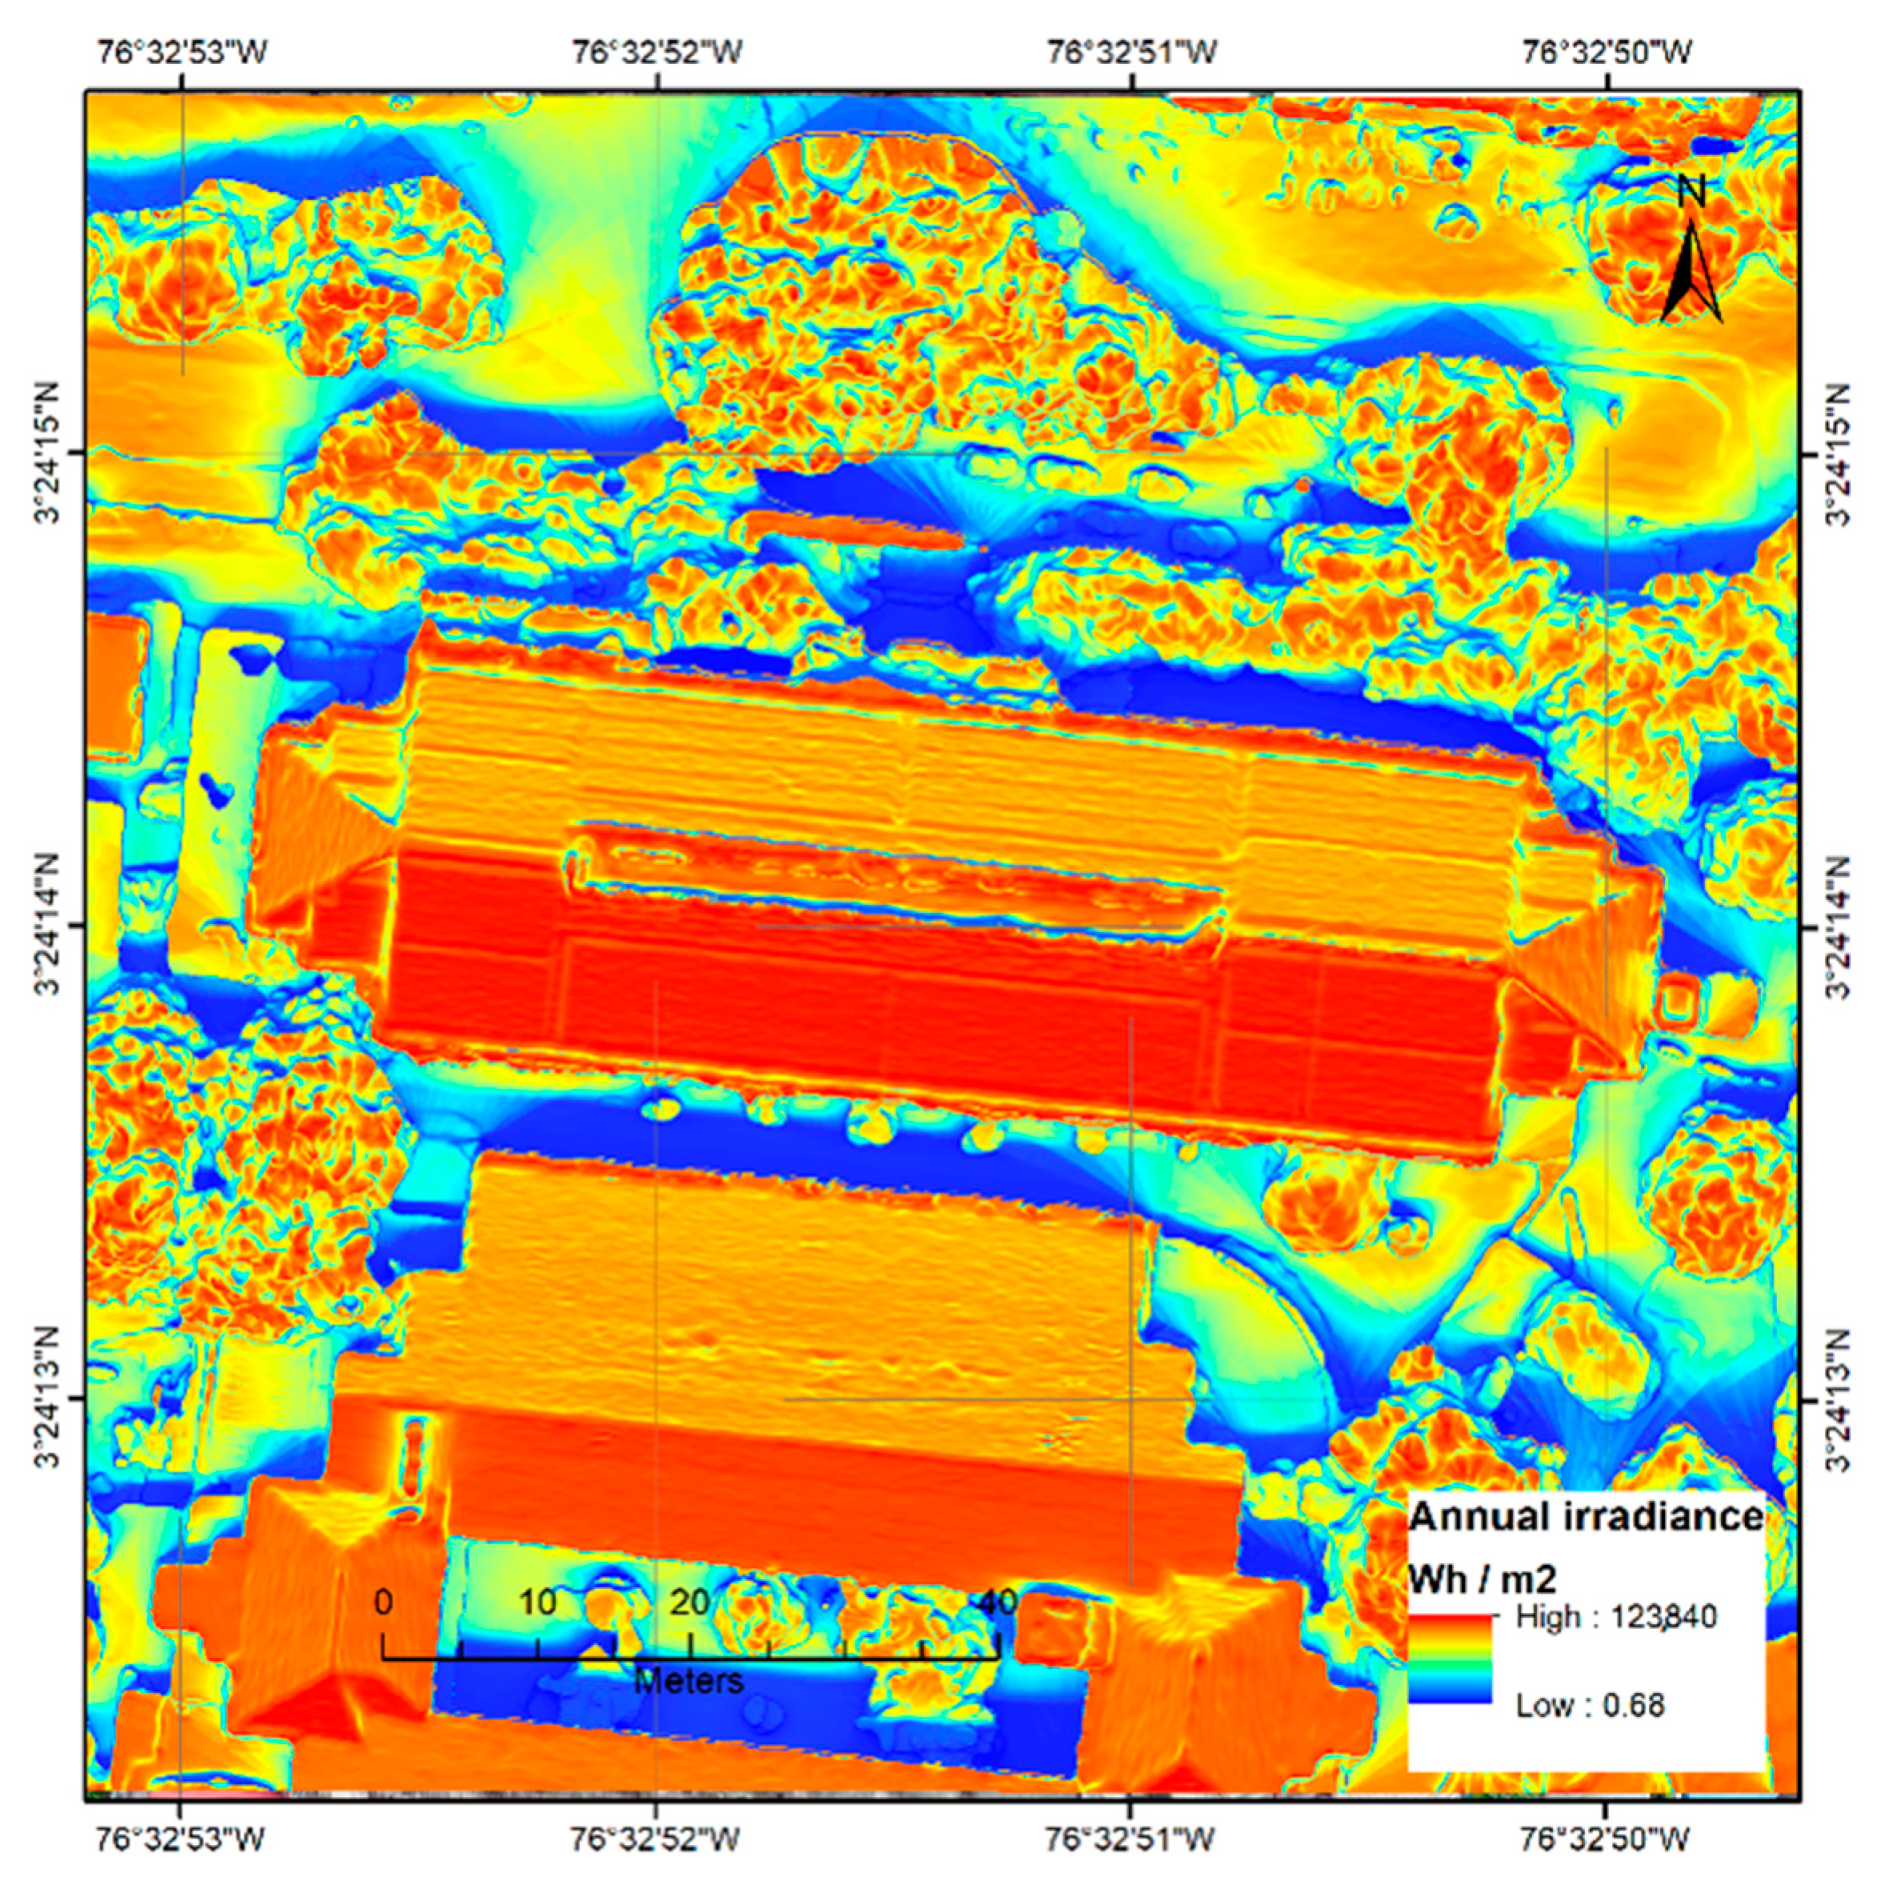
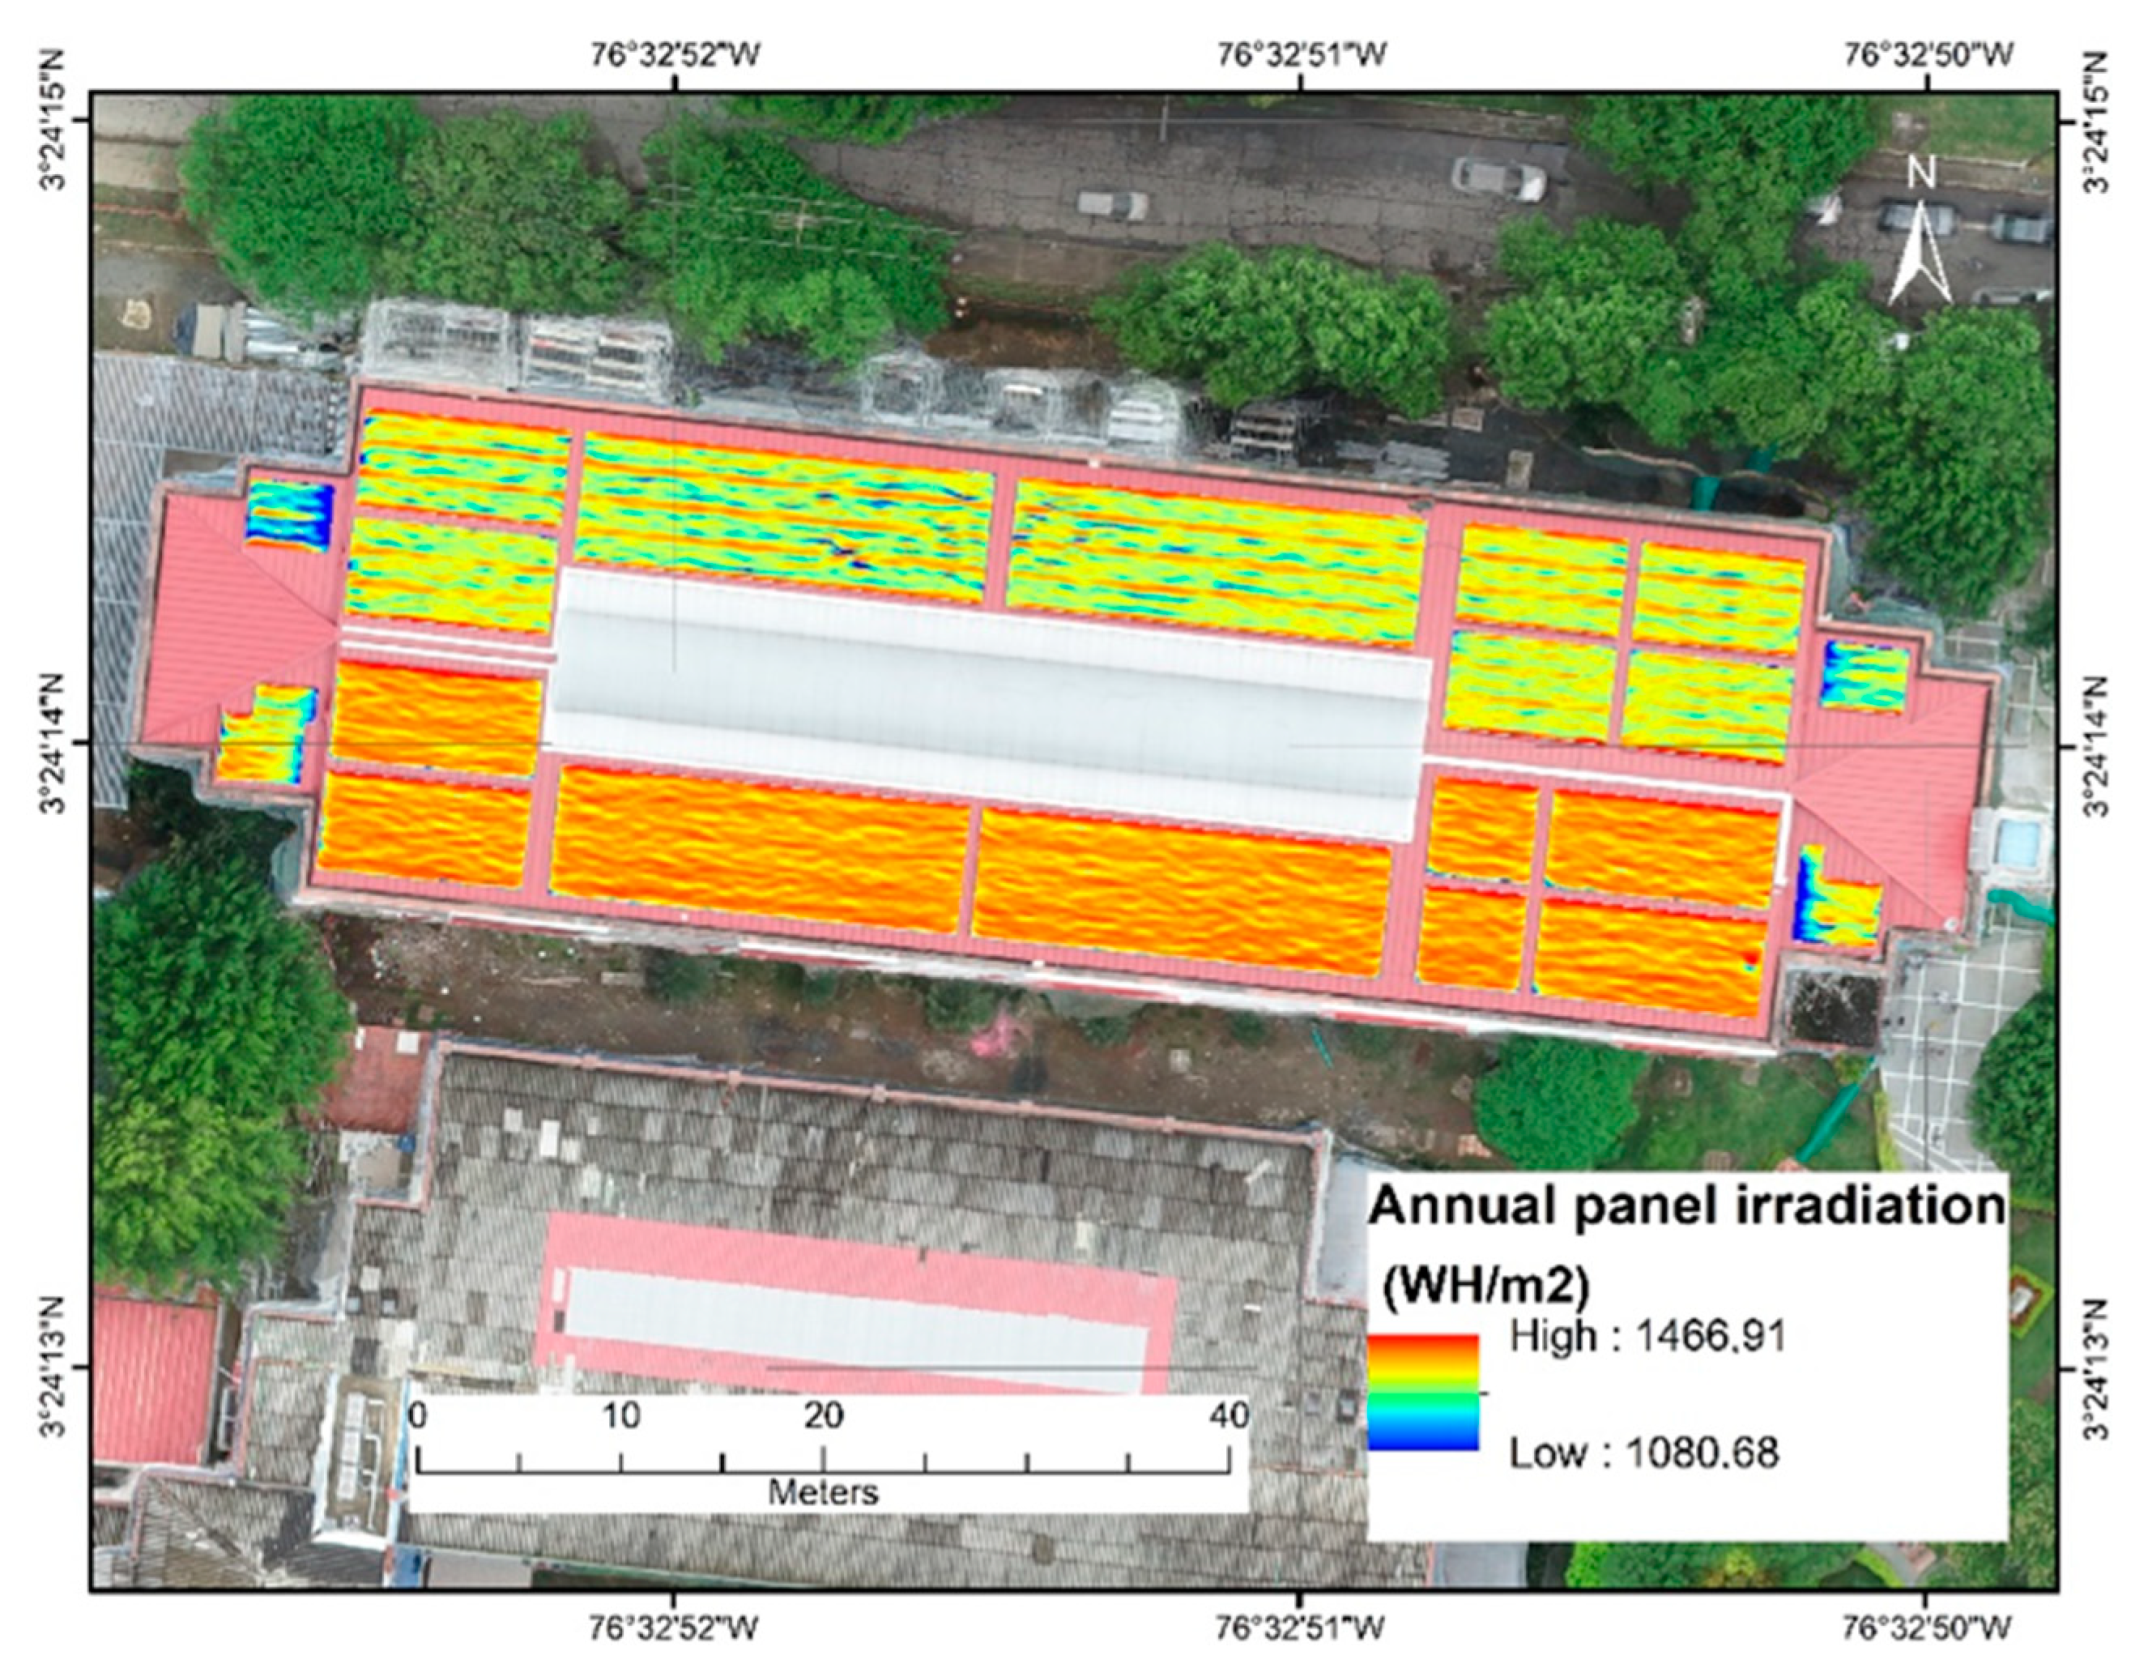
4.5. Solar Irradiance Model of the Roof

The first step was to analyze the irradiance of the ceiling of the case study before the placement of the panels. This provided a total viable surface to determine the correct installation position of solar panels, as illustrated in Figure 7. The ArcGIS solar analysis tool was used to determine the values of solar radiation over the entire roof and in the specific area of the solar panels. The analysis tools require information on the elevation, slope, and shape of the roof, which were obtained from the DSM derived from the UAV flights. The monthly atmospheric transmission values of transmissibility of the study area were obtained from the Gaisma climate website [56].
With this information input into ArcGIS software, the viewshed algorithm was used to divide the sky into zenith and azimuth directions and to calculate the diffuse and direct radiation that falls within the pixels of the surface model. Due to the small size of the study area and the high spatial resolution of the DSM, the shape of the building was used to mask the roof structure throughout the calculations. The result was a raster surface that contained values for the height of the roofs with the annual irradiance specification of 2019. Each point in the output file was subject to 12 irradiation measurements calculated in watt-hours per square meter (Wh/m2), one for each month of the year. The annual total Wh/m2 was determined for each point by summing the monthly values of irradiance. The result is illustrated in Figure 8.

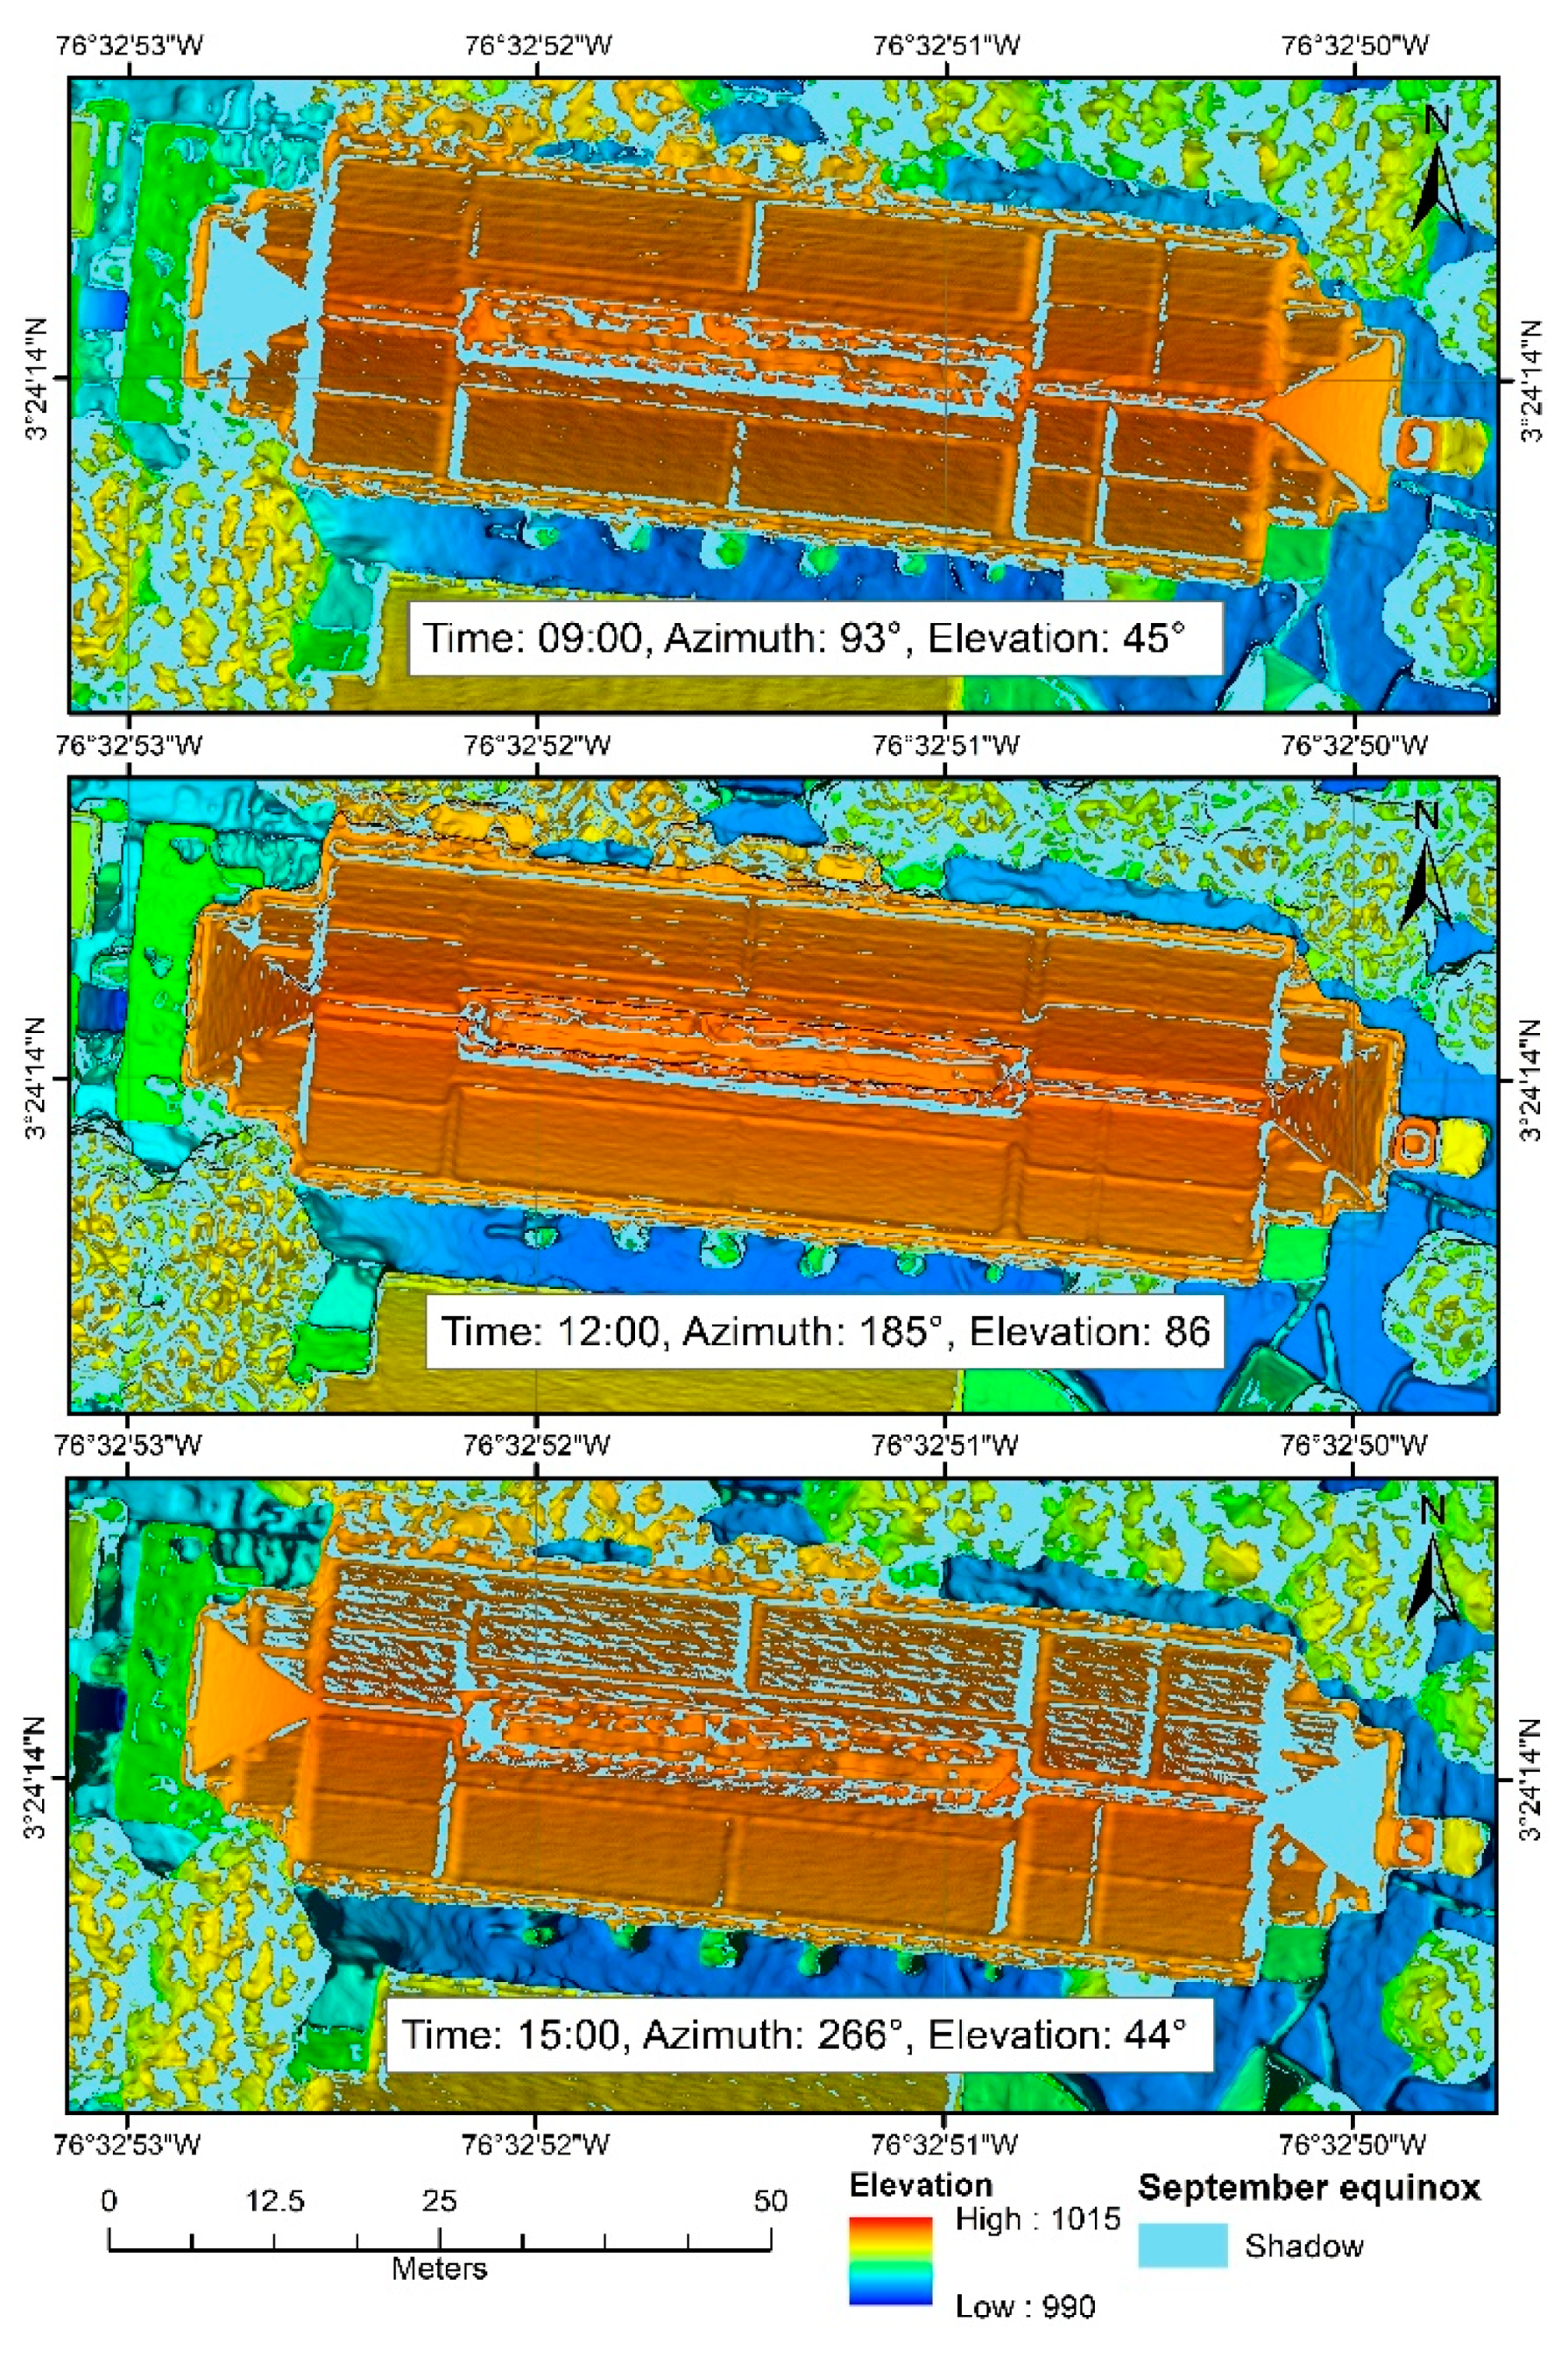
4.6. Shading Analysis

Shading analysis is a prominent step to calculate the photovoltaic capacity in a urban environment as the case under study, due to the trees and power networks that project shading over the PV systems. This type of analysis is used to determine the optimal location of the photovoltaic panels, considering that there is a variation in function of length and direction of the shades projected by the structures in the surroundings. Irradiation losses due to shades were estimated based on 23 September 2019 irradiation information during equinox above Earth’s Equator, taken as the closest value to the year irradiation average. Hilshade incorporated in ArcGis was used to perform the shading analysis over the DSM.
One of the results was the irradiation of the direct solar energy on each grid cell of the DSM. This output file was subsequently reclassified to create three files containing all the shade cells for the three most representative hours, i.e., 09:00, 12:00, 15:00 (Figure 9). This way, it could be possible to identify that the most affected areas due to shade effect were the right and left edges of the roofs, which had the largest loss due to shade, without panels installed accordingly.

4.7. Extraction of Solar Panel Area

One of the underlying challenges to estimating the solar energy potential of rooftops is to determine the real solar energy potential available in the area where the solar panels would be installed. This requires identifying the portions of each roof on which the solar panels would be installed and being able to accurately model their position.
We used the edges of the installed panels to create polygons for each object. The area of each polygon was calculated after generating an irradiance model in the DSM after the installation of the solar panels, as shown in Figure 10. After completing all the calculations and extractions of specific areas, we had two sets of data representing the solar area for each structure in the study area: one the total area of viable roof before the installation of the solar panels, and the other the optimal area after placing the panels on the roof. The total solar energy potential of the area of the panels as a whole was calculated using the UAV-DSM method, and this was compared to the actual production obtained directly from the installed photovoltaic system over one year of activity. The averages of all the points that fell within each roof structure were calculated for each month, as well as for the whole yar. The final shape files of the rooftop contained the total annual average irradiance value seen in Figure 10.

4.8. Comparison with PVSyst Software

To validate the accuracy of the DSM-UAV methodology, it was performed the comparison simulation of the study case using PVSyst software. This latter corresponds to a design and optimization tool of a PV solar system. The software simulates systems of any size, including the installation details [57]. Using PVSyst software, a layout of the campus building can be obtained in the simple 3D vectorial space, with the corresponding positions and orientations. This allows to identify the site on the roof with the best solar radiation according to the sun trajectory over the course of the day, and consequently, determine the place for panels installation [58]. To decide the most appropriate design for each PV system, the campus building was recreated in a 3D dimensional environment, which contains the detailed dimensions, such as heights, lengths, widths, among others. Once the building model was obtained, several simulations with software PVSyst were performed. Figure 11 shows simulation for solar panels installation on the campus building roof under study:

4.9. Electricity Production of the Photovoltaic System

The photovoltaic system of the case study was turned on 16 December 2018. It generates clean energy that is consumed in real time during daylight hours. The following can be highlighted about this system:
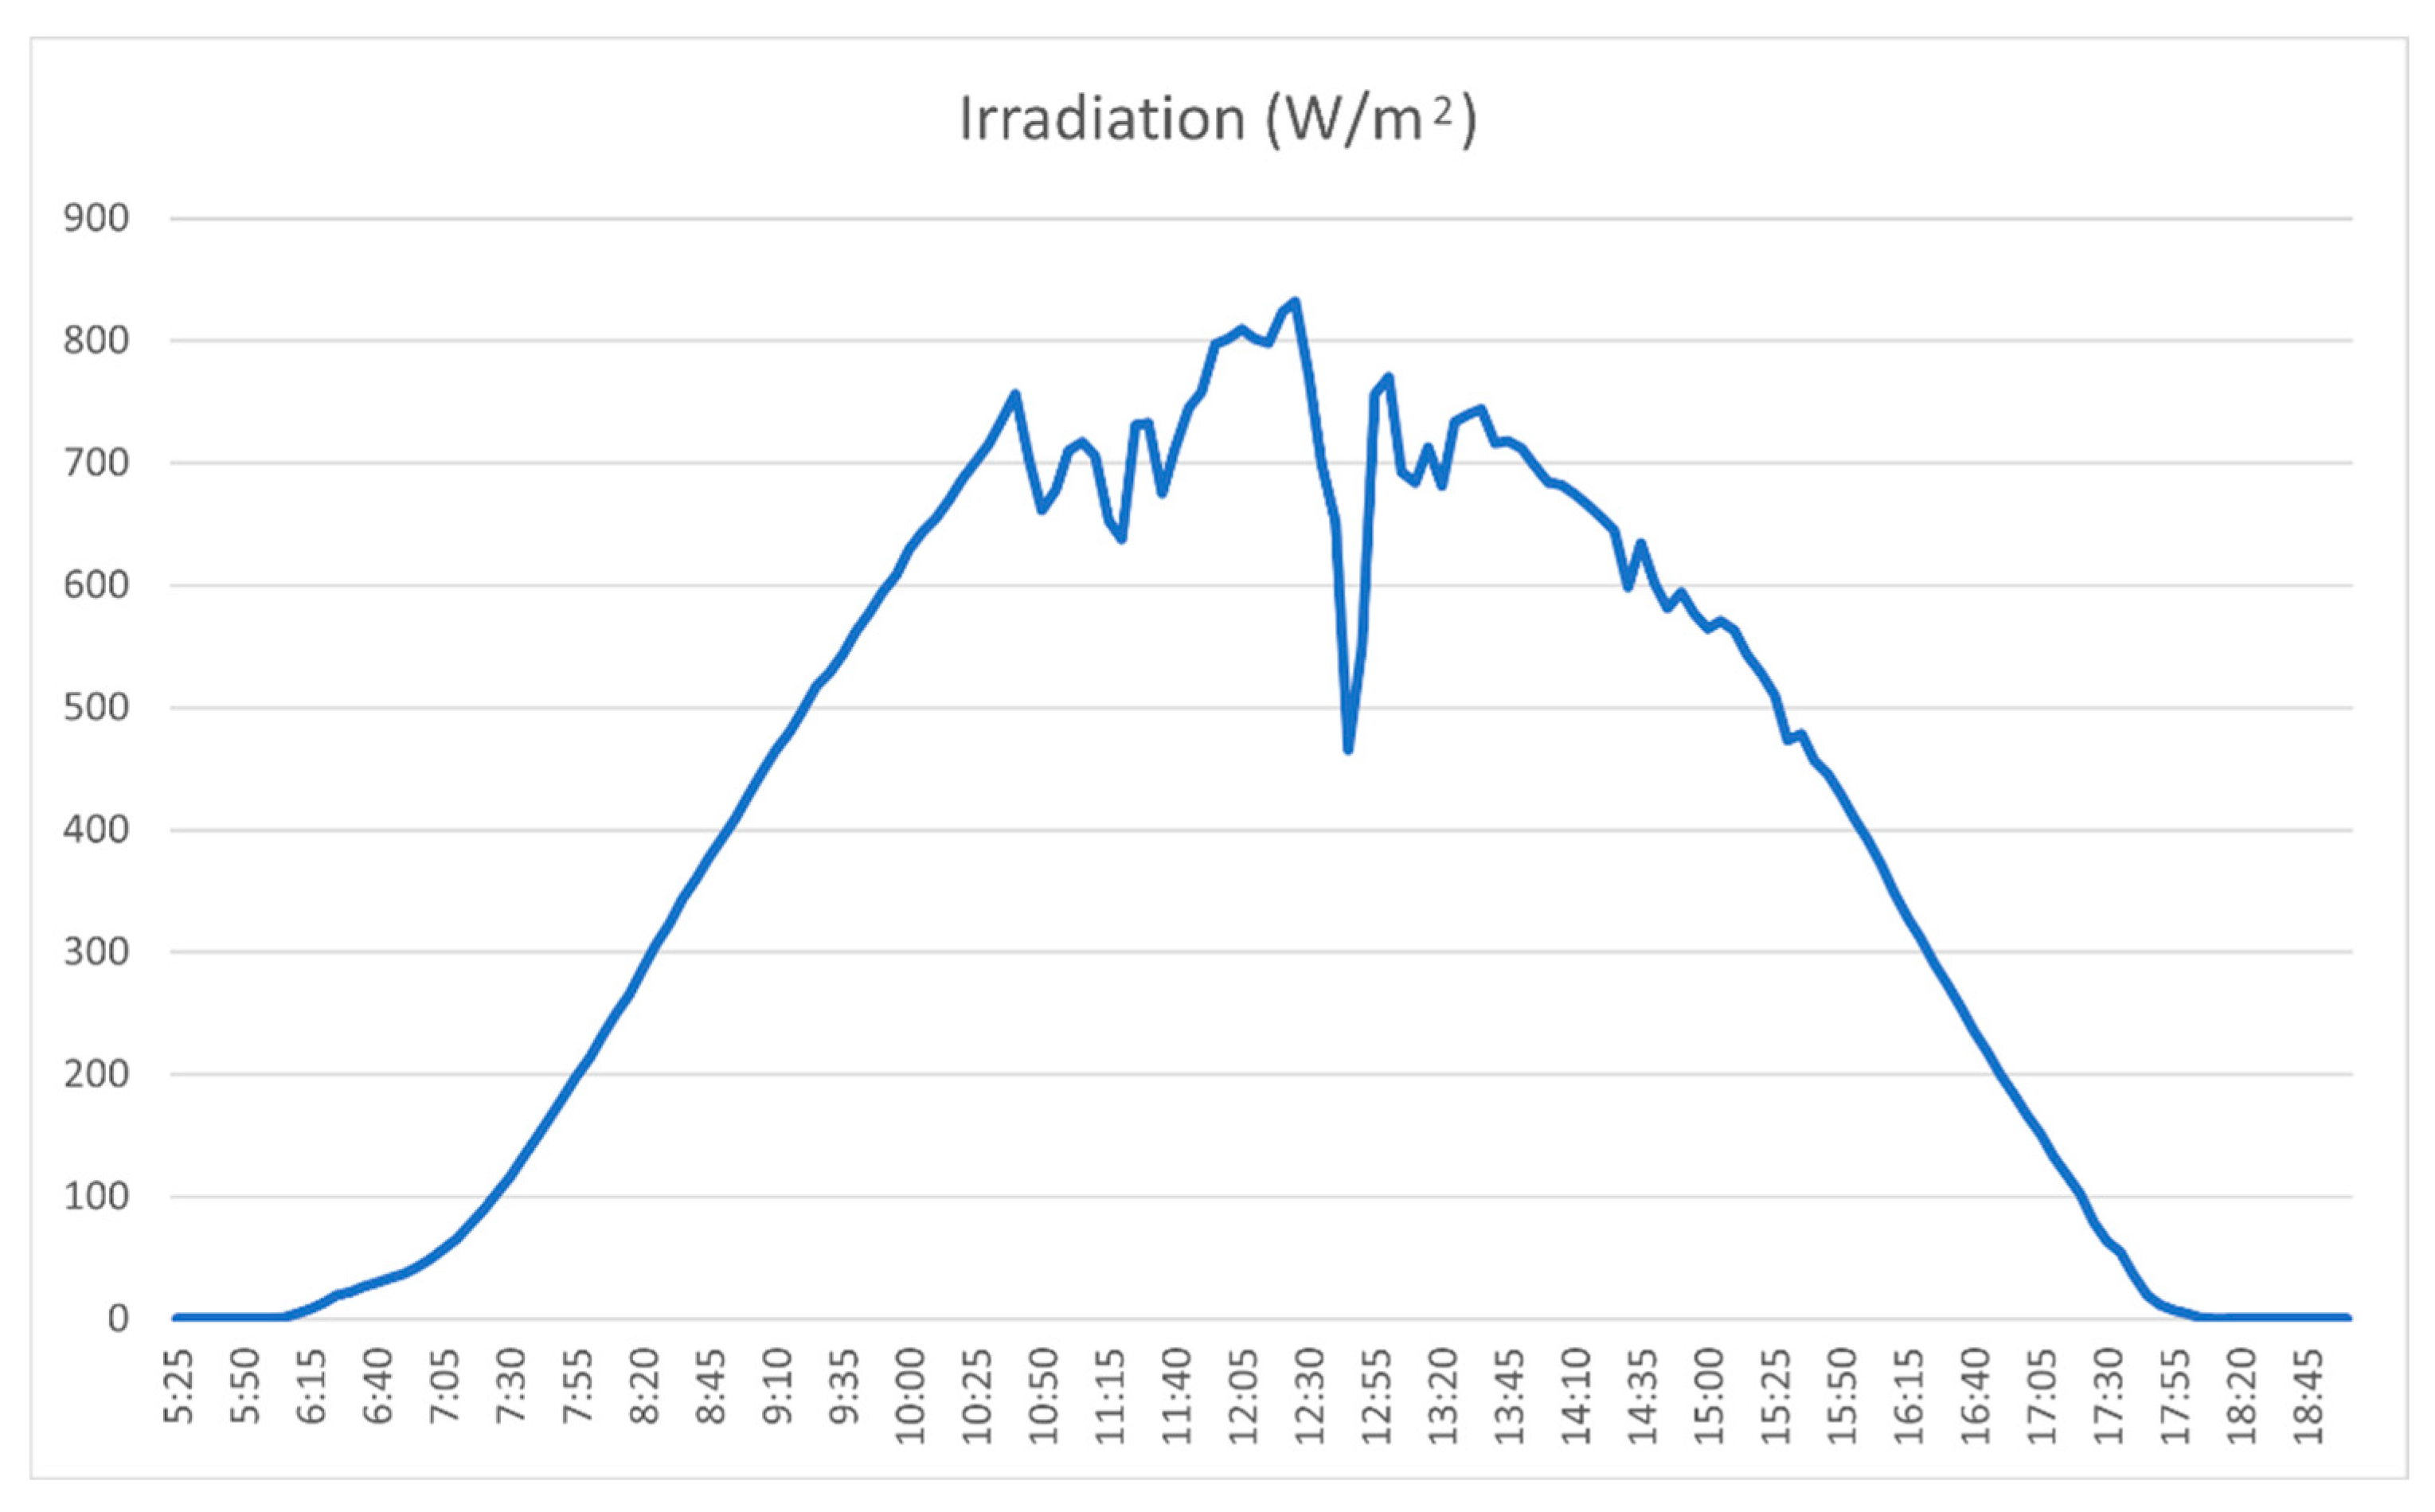
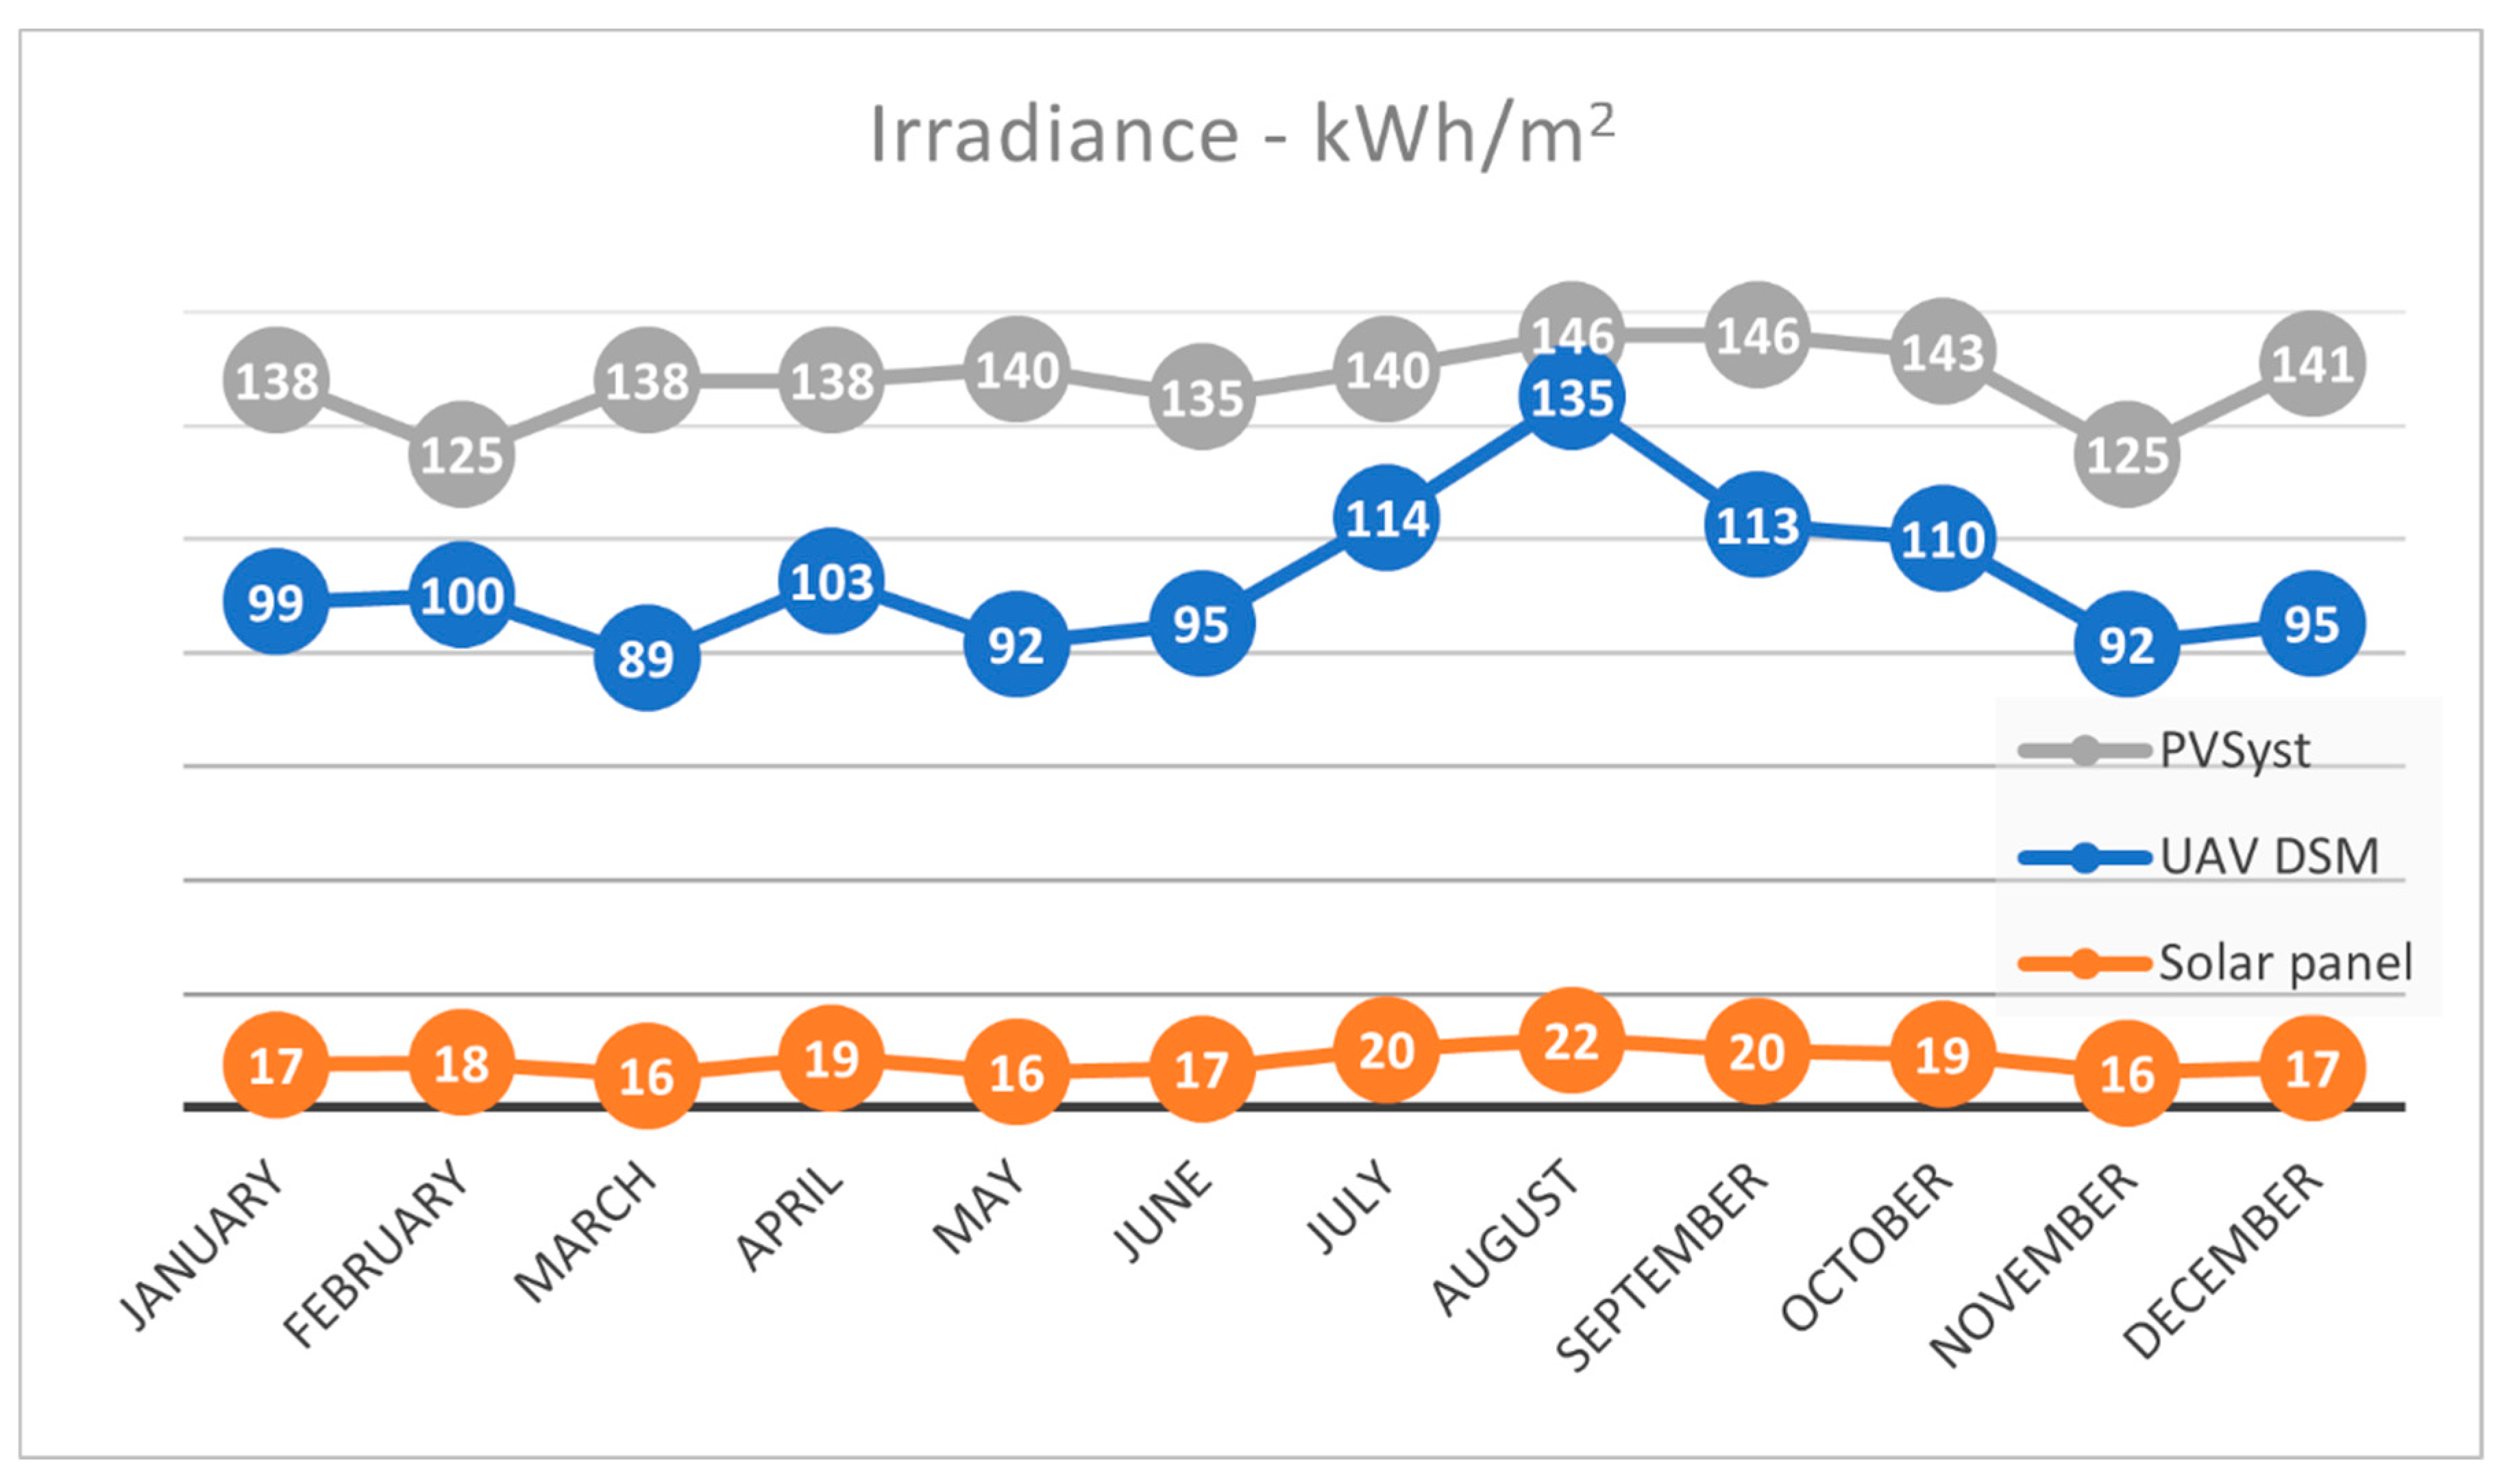
  • Adequate atmospheric conditions: The city of Cali has excellent atmospheric conditions for the production of electric solar energy, with 2019 being optimal in radiation, as illustrated in Figure 12 in the example for a typical day.
2.
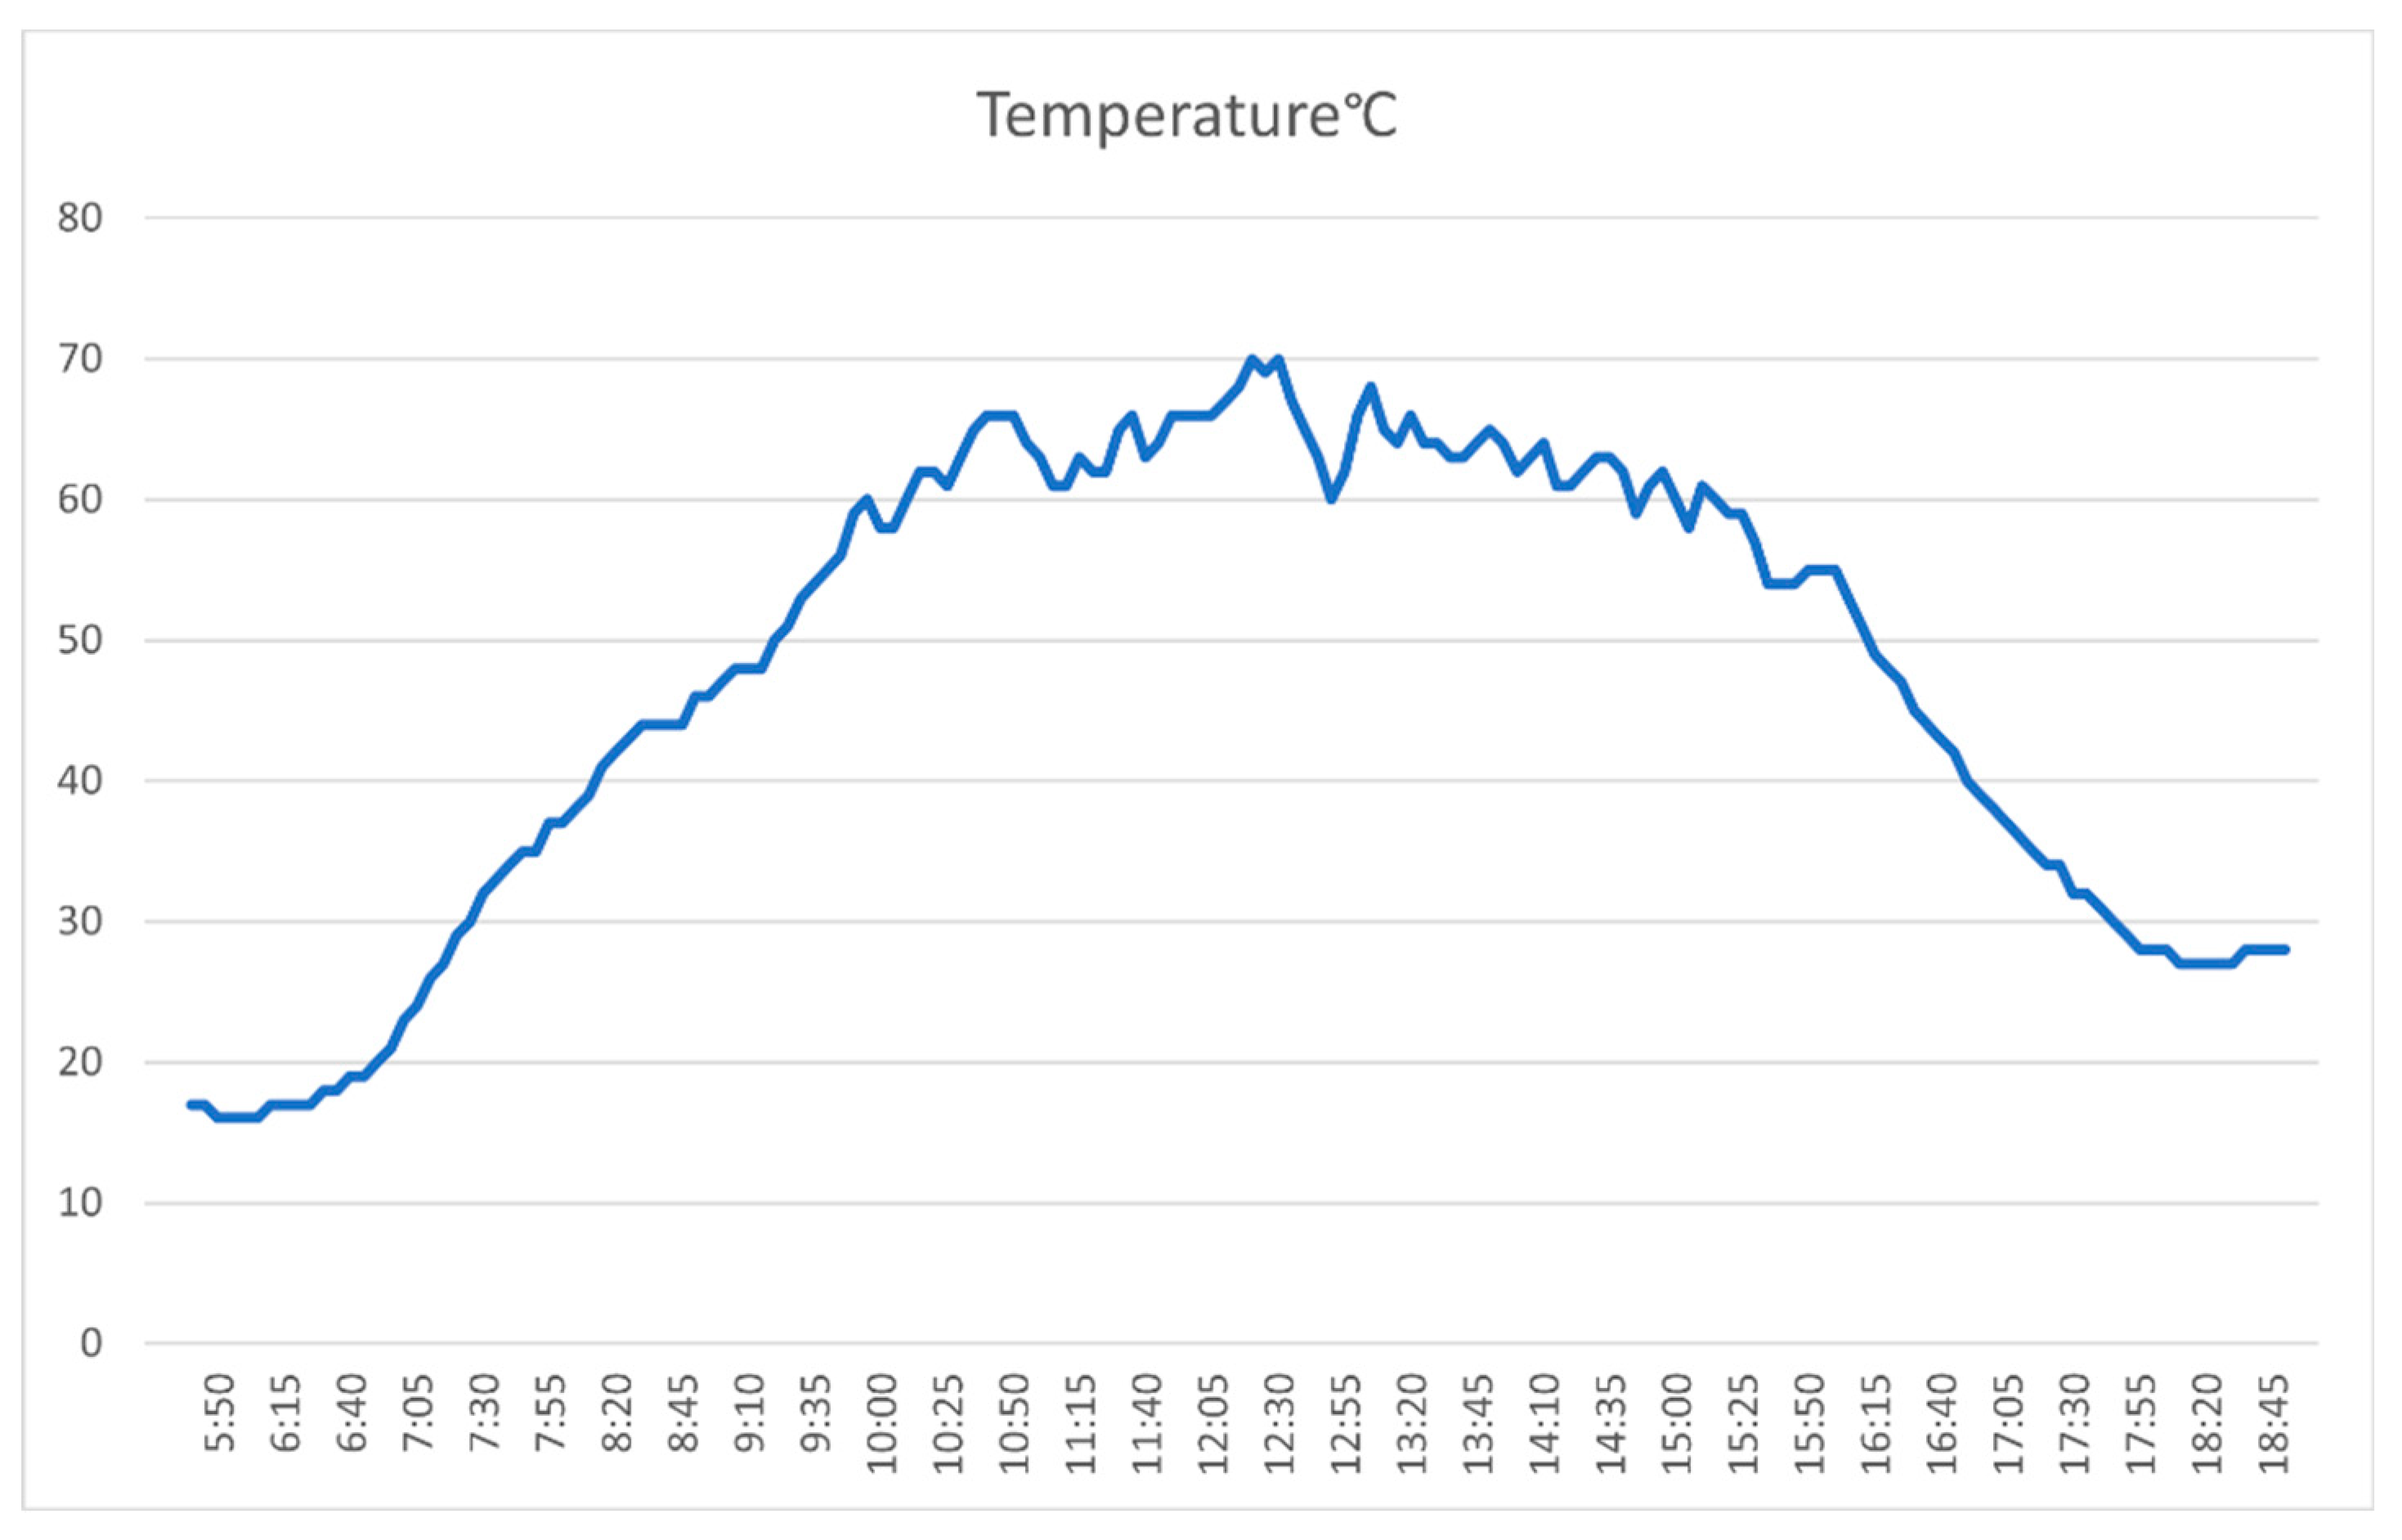
The adequate temperature present in the solar panels allows the establishment of optimal conditions for the production of electricity (as indicated by the manufacturer) (Figure 13). The data were obtained from the meteorological sensor of the case study as described in Section 3.1.
3.
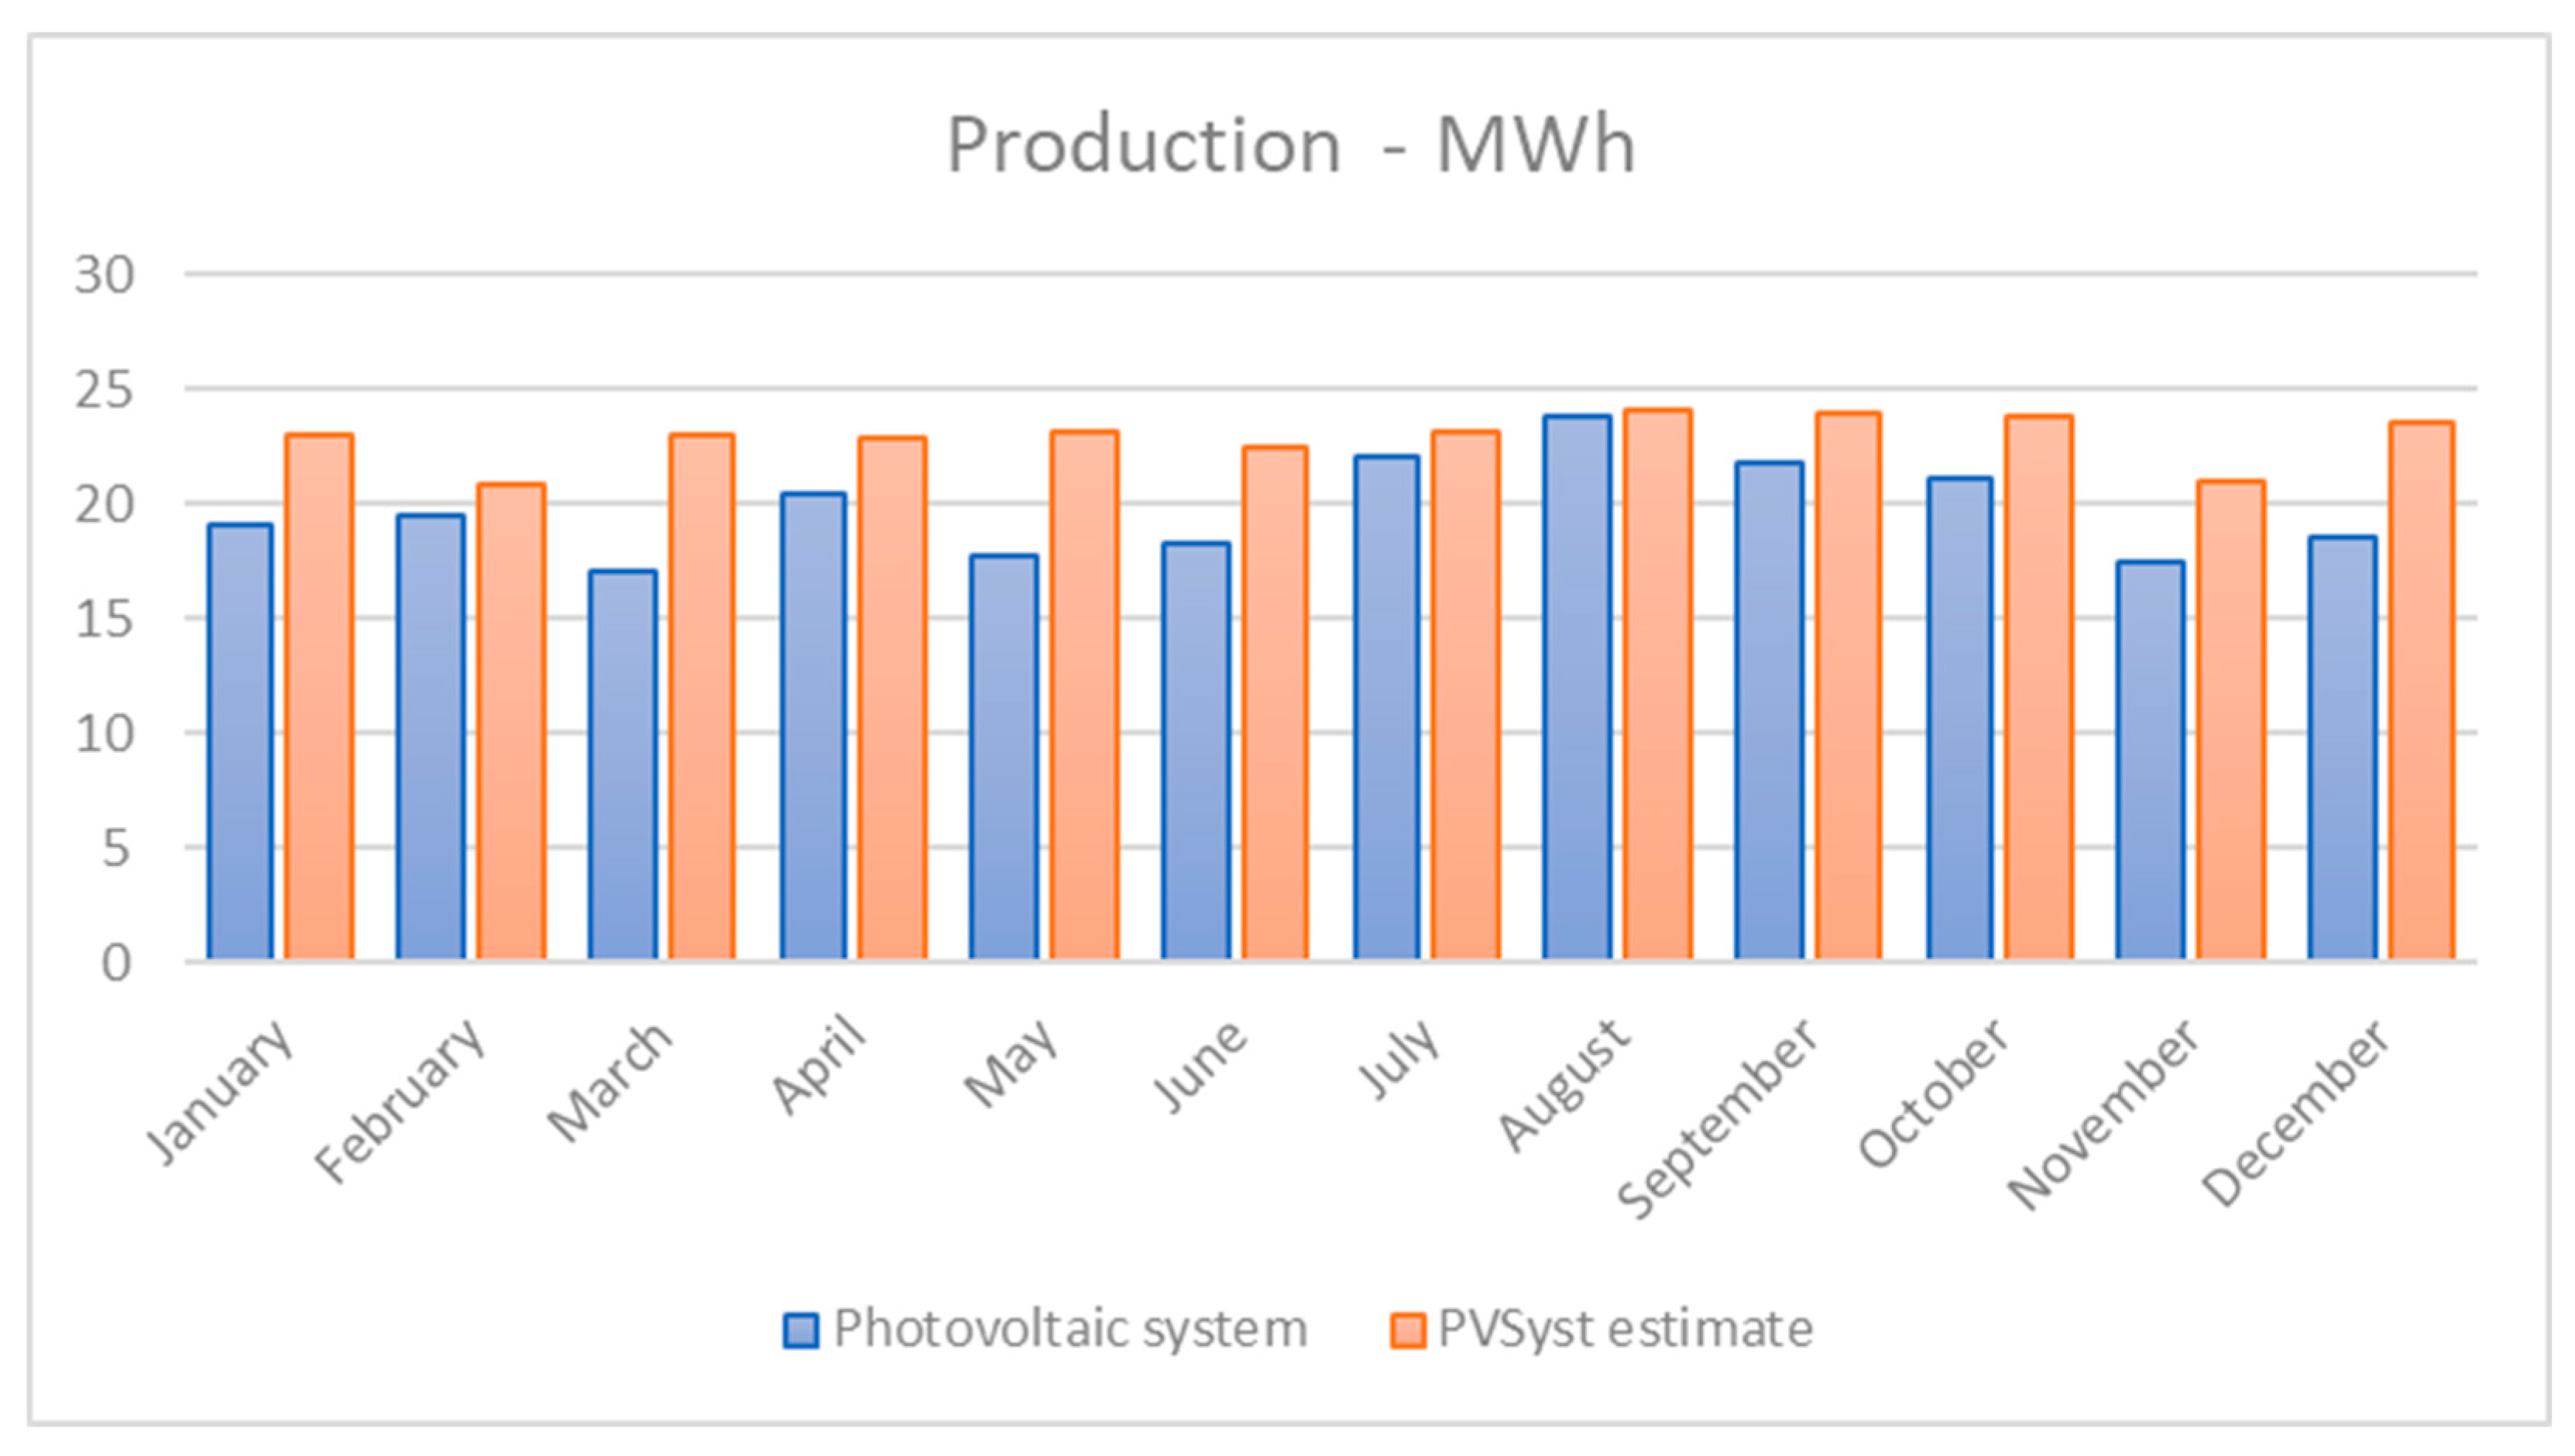
The generation of clean energy highlights the optimal environmental conditions. Figure 14 shows the contribution of electrical energy made by the photovoltaic system in each month of 2019. Besides, PVSyst software simulation can be seen for the same period.
4.
Rapid recovery of investment: Currently, the photovoltaic system of the case study supplies approximately seven percent (7%) of the total electrical energy demanded by the university campus, for an estimated recovery of financial investment (payback) in 5.71 years.
5.
Environmental benefits: One of the most important aspects in the installation of photovoltaic systems is the environmental benefits. For the case study, for the year 2019, approximately 105 tons of CO2 were saved from being emitted into the atmosphere because the building no longer acquired electricity from the Colombian electricity system, whose power plants emit pollutant gases (gas, diesel, gasoline, and coal) that have a CO2 emission factor of 164.38 g of CO2 per kilowatt hour (kWh), according to XM data [59].

5. Analysis of Results

To evaluate the potential solar irradiance and the real energy potential of solar panels in an urban roof, the solar irradiance values obtained by the UAV-DSM method and PVSyst estimate, were compared with the electrical energy data obtained from the photovoltaic system in the case study. In the UAV-DSM method, the DSM and the related layers were processed at a spatial resolution (details visible in an image) of 2.79 cm. The horizontal accuracies in the X and Y planes and the vertical accuracy in the Z plane in the elevation models from the UAV data approached 1 cm. The DSM used for the modeling in this work was developed with an accuracy of 45 cm horizontally and 1.5 m vertically.
The estimates of annual irradiance with the UAV-DSM method and PVSyst estimate, were compared with the electricity production of the solar panels over all of 2019. The DSM data created from the UAV accurately estimated the shape and the optimal area of the roofs, which contributed to calculating the energy potential that could be obtained from the solar panels to be installed. The differences between the PVSyst and the UAV-derived estimates of irradiance and energy production and the real data recorded by the solar panels are shown in Table 3.
The average annual irradiance on the roof (given in kWh/m2) of the photovoltaic system was obtained from the meteorological sensor installed on the roof of the building of the case study. This value was 7.05% lower than the estimate of the UAV-DSM method PVSyst and 26.1% respect to the data obtained with PVSyst. The electricity energy production of the photovoltaic system for 2019 was 17.7% (in kWh/m2) and 17.5% (in MWh) of the total energy calculated using the UAV-DSM method. Compared with the result values of the PV system versus the PVSyst software, this one estimated the energy in 19.90% (in kWh/m2) and 20.1% (in MWh). In the case of the UAV-DSM method, this percentage agrees with the 16.82% efficiency of the solar panels according to the technical data of the manufacturer. This is an important finding because these differences in irradiance values approximate the reality of energy production models. This work thus verified the efficiency of the polycrystalline technology of the solar panels when installed in the study area, coinciding with data reported in other studies [60,61], where the average efficiency has been below 20%.
In this case, the solar potential for a roof was estimated by considering the local effect of the topography on solar radiation using a hemispherical algorithm. In other experiences of implementing the hemispheric viewshed [4,15], it was found that the models are highly accurate for a specific location, which we corroborated in this work by modeling in great detail all the aspects of the shape and position of the roof of the case-study building. The estimated monthly solar irradiation upon the roof of the case study illustrates the differences between the real values of the panels, the UAV-DSM model and the PVSyst estimate. (Figure 15). In this sense, the UAV-DSM methodology gets the closest to real data, considering the topography shapes and not the simplified shapes, as performed by the algorithm with simulated data in PVSyst.
The estimates made from the UAV-DSM data are higher than the recorded values of irradiation of the solar panel data, which is consistent with the expected efficiency of the solar panels in the technical reference. The most pronounced variations appeared in August, theoretically the month with the most solar radiation. This was corroborated by the production of electrical energy for the month of August 2019, which was the highest observed, mainly because this month has the most solar radiation since June to August is usually a dry period with less precipitation and less cloudiness [1].

6. Conclusions

Based on the results of this study, the good performance of the proposed UAV-DSM method was verified. The UAV-DSM method optimizes the process of solar panel placement, orientation, and energy generation with high efficiency in places with high irradiation by modeling the solar potential for systems such as photovoltaic and thermal systems. The use of photogrammetric data taken from an UAV facilitates and improves the estimates of the radiation potential from a highly detailed, inexpensive 3D model to easily obtain photogrammetric information from a conventional UAV. It should be taken into account that the topographic accuracy of the surface models is a function of the ground control points, which must be taken with high-precision GPS devices to obtain the best results in terms of correct spatial location.
This work verified the efficiency of the polycrystalline material of solar panels on the case-study building, in line with data showing that this material is the state of the art for solar panels. The described method predicts with high accuracy the energy that will be produced by a photovoltaic station, broken down by month according to the technical, geographical, and seasonal factors that have been considered. It should be added, by extension, that photovoltaic installations similar to those described in this study continue to be a profitable and safe investment against other types of real estate or banking investments.

Author Contributions

Conceptualization, J.E.F. and F.D.M.; methods, J.E.F.; software, J.E.F.; validation, J.E.F. and F.D.M.; formal analysis, J.E.F. and F.D.M.; investigation, J.E.F. and F.D.M.; resources, J.E.F. and F.D.M.; data curation, F.D.M.; writing—original draft preparation, J.E.F. and F.D.M.; writing—review and editing, J.E.F. and F.D.M.; visualization, J.E.F.; supervision, J.E.F., F.D.M. and O.D.M.; project administration, F.D.M.; funding acquisition, J.E.F., F.D.M., and O.D.M. All authors have read and agreed to the published version of the manuscript.

Funding

This work was supported in part by the Centro de Investigación y Desarrollo Científico de la Universidad Distrital Francisco José de Caldas under grants 1643-12-2020 and 1654-12-2020 associated with the projects: “Desarrollo de una metodología de optimización para la gestión óptima de recursos energéticos distribuidos en redes de distribución de energía eléctrica”, and “Modelo de optimización para la gestión colectiva de la demanda en redes eléctricas de distribución contemplando alta penetración de energías renovables y vehículos eléctricos”.

Acknowledgments

In this work, the information provided by the photovoltaic data collection system of Universidad Santiago de Cali was used.

Conflicts of Interest

The authors declare no conflict of interest.

References

  1. IDEAM; UPME. Atlas de radiación solar de Colombia. UPME (Unidad de Planeación Minero-Energética), IDEAM (Instituto de Hidrología, Meteorología y Estudios Ambientales). 2005. Available online: http://www.cambioclimatico.gov.co/documents/21021/21129/1-+Preliminares.pdf/2a207e33-fe43-4aa3-930d-70ba60b10d57 (accessed on 15 August 2020).
  2. Sawin, J.L.; Sverrisson, F.; Rickerson, W. Renewables 2014 Global Status Report; Renewable Energy Policy Network for the 21 Century: Paris, France, 2014; p. 46. [Google Scholar]
  3. Benavides Ballesteros, H.O.; Simbaqueva Fonseca, O.; Zapata Lesmes, H.J. Atlas de Radiación Solar, Ultravioleta y Ozono de Colombia; IDEAM-UPME-Fundación Universitaria Los Libertadores-Colciencias: Bogotá, Colombia, 2017. [Google Scholar]
  4. Kodysh, J.B.; Omitaomu, O.A.; Bhaduri, B.L.; Neish, B.S. Methodology for estimating solar potential on multiple building rooftops for photovoltaic systems. Sustain. Cities Soc. 2013, 8, 31–41. [Google Scholar] [CrossRef]
  5. Renné, D.; George, R.; Wilcox, S.; Stoffel, T.; Myers, D.; Heimiller, D. Solar Resource Assessment; National Renewable Energy Lab. (NREL): Golden, CO, USA, 2008. [Google Scholar]
  6. UPME. Integración de las Energías Renovables no Convencionales en Colombia; Ministerio de Minas y Energía: Bogotá, Colombia, 2015; p. 370. [Google Scholar] [CrossRef]
  7. Leng, G.J. RETScreenTM international: A decision support and capacity building tool for assessing potential renewable energy projects. Ind. Environ. 2000, 23, 22–23. [Google Scholar]
  8. Lambert, T.; Gilman, P.; Lilienthal, P. Micropower system modeling with HOMER. Integr. Altern. Sources Energy 2006, 1, 379–385. [Google Scholar]
  9. Lalwani, M.; Kothari, D.P.; Singh, M. Investigation of solar photovoltaic simulation softwares. Int. J. Appl. Eng. Res. 2010, 1, 585–601. [Google Scholar]
  10. Turcotte, D.; Ross, M.; Sheriff, F. Photovoltaic Hybrid System Sizing and Simulation Tools: Status and Needs. 2001; pp. 1–10. Available online: http://www.rerinfo.ca/documents/prPVHorizon2001SizingSim1.pdf (accessed on 25 July 2020).
  11. Turchi, C. Parabolic Trough Reference Plant for Cost Modeling with the Solar Advisor Model (SAM); National Renewable Energy Laboratory (U.S.): Golden, CO, USA, 2010. [Google Scholar]
  12. Mermoud, A.; Wittmer, B. PVSYST User’s Manual. Switzerland, January 2014. Available online: https://d3pcsg2wjq9izr.cloudfront.net/files/73830/download/660275/100.pdf (accessed on 21 August 2020).
  13. Shrivastava, R.L.; Vinod, K.; Untawale, S.P. Modeling and simulation of solar water heater: A TRNSYS perspective. Renew. Sustain. Energy Rev. 2017, 67, 126–143. [Google Scholar] [CrossRef]
  14. Colak, H.E.; Memisoglu, T.; Gercek, Y. Optimal site selection for solar photovoltaic (PV) power plants using GIS and AHP: A case study of Malatya Province, Turkey. Renew. Energy 2020, 149, 565–576. [Google Scholar] [CrossRef]
  15. Nelson, J.R.; Grubesic, T.H. The use of LiDAR versus unmanned aerial systems (UAS) to assess rooftop solar energy potential. Sustain. Cities Soc. 2020, 61, 102353. [Google Scholar] [CrossRef]
  16. Guo, Z.; Zhang, Z.; Wu, X.; Wang, J.; Zhang, P.; Ma, D.; Liu, Y. Building shading affects the ecosystem service of urban green spaces: Carbon capture in street canyons. Ecol. Model. 2020, 431, 109178. [Google Scholar] [CrossRef]
  17. Huang, Z.; Mendis, T.; Xu, S. Urban solar utilization potential mapping via deep learning technology: A case study of Wuhan, China. Appl. Energy 2019, 250, 283–291. [Google Scholar] [CrossRef]
  18. Moudrý, V.; Beková, A.; Lagner, O. Evaluation of a high resolution UAV imagery model for rooftop solar irradiation estimates. Remote Sens. Lett. 2019, 10, 1077–1085. [Google Scholar] [CrossRef]
  19. Quirós, E.; Pozo, M.; Ceballos, J. Solar potential of rooftops in Cáceres city, Spain. J. Maps 2018, 14, 44–51. [Google Scholar] [CrossRef]
  20. Machete, R.; Falcão, A.P.; Gomes, M.G.; Moret Rodrigues, A. The use of 3D GIS to analyse the influence of urban context on buildings’ solar energy potential. Energy Build. 2018, 177, 290–302. [Google Scholar] [CrossRef]
  21. Togawa, T.; Fujita, T.; Dong, L.; Ohnishi, S.; Fujii, M. Integrating GIS databases and ICT applications for the design of energy circulation systems. J. Clean. Prod. 2016, 114, 224–232. [Google Scholar] [CrossRef]
  22. Halama, J.J.; Kennedy, R.E.; Graham, J.J.; McKane, R.B.; Barnhart, B.L.; Djang, K.S.; Pettus, P.B.; Brookes, A.F.; Wingo, P.C. Penumbra: A spatially distributed, mechanistic model for simulating ground-level incident solar energy across heterogeneous landscapes. PLoS ONE 2018, 13, e0206439. [Google Scholar] [CrossRef]
  23. Usta, Z.; Comert, C.; Yilmaz, V. Solar Energy Potential of Cities in Turkey; a Gis Based Analysis. Fresenius Environ. Bull. 2017, 26, 80–83. [Google Scholar]
  24. Salimzadeh, N.; Hammad, A. High-level framework for GIS-based optimization of building photovoltaic potential at urban scale using BIM and LiDAR. In Proceedings of the International Conference on Sustainable Infrastructure, New York, NY, USA, 26–28 October 2017; pp. 123–134. [Google Scholar]
  25. Lingfors, D.; Bright, J.M.; Engerer, N.A.; Ahlberg, J.; Killinger, S.; Widén, J. Comparing the capability of low- and high-resolution LiDAR data with application to solar resource assessment, roof type classification and shading analysis. Appl. Energy 2017, 205, 1216–1230. [Google Scholar] [CrossRef]
  26. Chow, A.; Li, S.; Fung, A.S. Modeling urban solar energy with high spatiotemporal resolution: A case study in Toronto, Canada. Int. J. Green Energy 2016, 13, 1090–1101. [Google Scholar] [CrossRef]
  27. Szabó, S.; Enyedi, P.; Horváth, M.; Kovács, Z.; Burai, P.; Csoknyai, T.; Szabó, G. Automated registration of potential locations for solar energy production with Light Detection And Ranging (LiDAR) and small format photogrammetry. J. Clean. Prod. 2016, 112, 3820–3829. [Google Scholar] [CrossRef]
  28. Fogl, M.; Moudrý, V. Influence of vegetation canopies on solar potential in urban environments. Appl. Geogr. 2016, 66, 73–80. [Google Scholar] [CrossRef]
  29. Li, X.; Zhang, S.; Chen, Y. Error assessment of grid-based diffuse solar radiation models. Int. J. Geogr. Inf. Sci. 2016, 30, 2032–2049. [Google Scholar] [CrossRef]
  30. Huang, Y.; Chen, Z.; Wu, B.; Chen, L.; Mao, W.; Zhao, F.; Wu, J.; Wu, J.; Yu, B. Estimating Roof Solar Energy Potential in the Downtown Area Using a GPU-Accelerated Solar Radiation Model and Airborne LiDAR Data. Remote Sens. 2015, 7, 17212–17233. [Google Scholar] [CrossRef] [Green Version]
  31. Ko, L.; Wang, J.-C.; Chen, C.-Y.; Tsai, H.-Y. Evaluation of the development potential of rooftop solar photovoltaic in Taiwan. Renew. Energy 2015, 76, 582–595. [Google Scholar] [CrossRef]
  32. Byrne, J.; Taminiau, J.; Kurdgelashvili, L.; Kim, K.N. A review of the solar city concept and methods to assess rooftop solar electric potential, with an illustrative application to the city of Seoul. Renew. Sustain. Energy Rev. 2015, 41, 830–844. [Google Scholar] [CrossRef]
  33. Erdélyi, R.; Wang, Y.; Guo, W.; Hanna, E.; Colantuono, G. Three-dimensional SOlar RAdiation Model (SORAM) and its application to 3-D urban planning. Sol. Energy 2014, 101, 63–73. [Google Scholar] [CrossRef]
  34. Lukač, N.; Žlaus, D.; Seme, S.; Žalik, B.; Štumberger, G. Rating of roofs’ surfaces regarding their solar potential and suitability for PV systems, based on LiDAR data. Appl. Energy 2013, 102, 803–812. [Google Scholar] [CrossRef]
  35. Agugiaro, G.; Nex, F.; Remondino, F.; De Filippi, R.; Droghetti, S.; Furlanello, C. Solar radiation estimation on building roofs and web-based solar cadaster. ISPRS Ann. Photogramm. Remote Sens. Spat. Inf. Sci. 2012, I-2, 177–182. [Google Scholar] [CrossRef] [Green Version]
  36. Hofierka, J.; Kaňuk, J. Assessment of photovoltaic potential in urban areas using open-source solar radiation tools. Renew. Energy 2009, 34, 2206–2214. [Google Scholar] [CrossRef]
  37. Izquierdo, S.; Rodrigues, M.; Fueyo, N. A method for estimating the geographical distribution of the available roof surface area for large-scale photovoltaic energy-potential evaluations. Sol. Energy 2008, 82, 929–939. [Google Scholar] [CrossRef]
  38. Gadsden, S.; Rylatt, M.; Lomas, K. Putting solar energy on the urban map: A new GIS-based approach for dwellings. Sol. Energy 2003, 74, 397–407. [Google Scholar] [CrossRef]
  39. Fu, P.; Rich, P.M. A geometric solar radiation model with applications in agriculture and forestry. Comput. Electron. Agric. 2002, 37, 25–35. [Google Scholar] [CrossRef]
  40. Fu, P.; Rich, P.M. The Solar Analyst 1.0 User Manual; Helios Environmental Modeling Institute: Washington DC, USA, 2000. [Google Scholar]
  41. Hetrick, W.A.; Rich, P.M.; Weiss, S.B. Modeling insolation on complex surfaces. In Proceedings of the Thirteenth Annual ESRI User Conference, Palm Springs, CA, USA, 24–28 May 1993; pp. 447–458. [Google Scholar]
  42. Rich, P.; Dubayah, R.C.; Hetrick, W.; Saving, S. Using Viewshed Models to Calculate Intercepted Solar Radiation: Applications in Ecology; American Society for Photogrammetry and Remote Sensing Technical Papers; American Society for Photogrammetry and Remote Sensing: Bethesda, MD, USA, 1994; pp. 524–529. Available online: http://professorpaul.com/publications/rich_et_al_1994_asprs.pdf (accessed on 20 September 2020).
  43. Rich, P.M.; Hetrick, W.A.; Saving, S.C. Modeling Topographic Influences on Solar Radiation: A Manual for the SOLARFLUX Model; Los Alamos National Lab: Santa Fe, NM, USA, 1995. [Google Scholar]
  44. Růžičková, K.; Inspektor, T. Surface Models for Geosciences; Springer: Berlin/Heidelberg, Germany, 2015. [Google Scholar]
  45. IDEAM. Características Climatológicas de Ciudades Principales y Municipios Turísticos de Colombia; IDEAM: Bogotá, Colombia, 2012; p. 48. Available online: http://www.ideam.gov.co/documents/21021/418894/Caracter%C3%ADsticas+de+Ciudades+Principales+y+Municipios+Tur%C3%ADsticos.pdf/c3ca90c8-1072-434a-a235-91baee8c73fc (accessed on 20 September 2020).
  46. Verdiseno. Solar Design Tool. 2020. Available online: https://get.solardesigntool.com/ (accessed on 10 August 2020).
  47. Hybrytec. Informe Técnico Sistema Fotovoltaico Universidad Santiago de Cali; Hybrytec: Itagüí, Colombia, 2018; p. 50. [Google Scholar]
  48. Peppa, M.V.; Hall, J.; Goodyear, J.; Mills, J.P. Photogrammetric Assessment and Comparison of Dji Phantom 4 Pro and Phantom 4 Rtk Small Unmanned Aircraft Systems. ISPRS Int. Arch. Photogramm. Remote Sens. Spat. Inf. Sci. 2019, XLII-2/W13, 503–509. [Google Scholar] [CrossRef] [Green Version]
  49. Fuentes, J. Comparación de modelos de altura de la vegetación para estimación de biomasa en un bosque de manglar en el Caribe Colombiano. Entorno Geográfico 2020, 1–18. [Google Scholar] [CrossRef]
  50. Prošek, J.; Šímová, P. UAV for mapping shrubland vegetation: Does fusion of spectral and vertical information derived from a single sensor increase the classification accuracy? Int. J. Appl. Earth Obs. Geoinf. 2019, 75, 151–162. [Google Scholar] [CrossRef]
  51. Fuentes, J.; Varga, D.; Boada, M. Distribución del Patrón espacial tipo Leopardo en regiones áridas y semiáridas del mundo. Boletín Asoc. Geógrafos Españoles 2016. [Google Scholar] [CrossRef]
  52. Šúri, M.; Hofierka, J. A New GIS-based Solar Radiation Model and Its Application to Photovoltaic Assessments. Trans. GIS 2004, 8, 175–190. [Google Scholar] [CrossRef]
  53. Mauro-Díaz, G.; Lencinas, J.D.; del Valle, H. Introducción a la fotografía hemisférica en ciencias forestales. Madera y Bosques 2014, 20, 109–117. [Google Scholar] [CrossRef] [Green Version]
  54. Fu, P.; Rich, P.M. Design and Implementation of the Solar Analyst: An ArcView Extension for Modeling Solar Radiation at Landscape Scales. 1999; pp. 1–31. Available online: https://proceedings.esri.com/library/userconf/proc99/proceed/papers/pap867/p867.htm (accessed on 15 May 2020).
  55. Fröhlich, C.; Brusa, R.W. Solar radiation and its variation in time. Sol. Phys. 1981, 74, 209–215. [Google Scholar] [CrossRef]
  56. Tukiainen, M. Sunrise, Sunset, Dawn and Dusk Times around the World. 2019. Available online: https://www.gaisma.com/en/location/cali.html (accessed on 10 July 2020).
  57. Kandasamy, C.P.; Prabu, P.; Niruba, K. Solar potential assessment using PVSYST software. In Proceedings of the 2013 International Conference on Green Computing, Communication and Conservation of Energy (ICGCE), Tamil Nadu, India, 12–14 December 2013; pp. 667–672. [Google Scholar]
  58. Masoum, A.S.; Moses, P.S.; Masoum, M.A.S.; Abu-Siada, A. Impact of rooftop PV generation on distribution transformer and voltage profile of residential and commercial networks. In Proceedings of the 2012 IEEE PES Innovative Smart Grid Technologies (ISGT), Washington, DC, USA, 16–20 January 2012; pp. 1–7. [Google Scholar]
  59. Xm. Carbon Dioxide Emissions per Unit of Energy. Indicators Database. 2020. Available online: https://www.xm.com.co/Paginas/Indicadores/Oferta/Indicador-aportes-hidricos.aspx (accessed on 12 August 2020).
  60. Almosni, S.; Delamarre, A.; Jehl, Z.; Suchet, D.; Cojocaru, L.; Giteau, M.; Behaghel, B.; Julian, A.; Ibrahim, C.; Tatry, L.; et al. Material challenges for solar cells in the twenty-first century: Directions in emerging technologies. Sci. Technol. Adv. Mater. 2018, 19, 336–369. [Google Scholar] [CrossRef]
  61. Green, M.A.; Emery, K.; Hishikawa, Y.; Warta, W.; Dunlop, E.D. Solar cell efficiency tables (Version 45). Prog. Photovolt. Res. Appl. 2015, 23, 1–9. [Google Scholar] [CrossRef]
Figure 1. Annual average daily horizontal global irradiation in Colombia [3].
Electronics 09 02144 g001
Figure 2. Location of study area, Santiago de Cali University.
Electronics 09 02144 g002
Figure 3. Photovoltaic system case study [47].
Electronics 09 02144 g003
Figure 4. 3D point cloud; the left part shows the elevation, and the right part shows the natural color of the elements.
Electronics 09 02144 g004
Figure 5. Viewshed, sunmap, and skymap on the roof of the case-study building.
Electronics 09 02144 g005
Figure 6. Flowchart of the unmanned aerial vehicles–digital surface model (UAV-DSM) method.
Electronics 09 02144 g006
Figure 7. Mosaic of UAV images before and after the placement of the solar panels.
Electronics 09 02144 g007
Figure 8. Annual irradiance of the study area in 2019.
Electronics 09 02144 g008
Figure 9. Shading on the DSM during equinox of September 2019.
Electronics 09 02144 g009
Figure 10. Whole-year (2019) irradiance solar panel area.
Electronics 09 02144 g010
Figure 11. Photovoltaic PVSyst simulation in case study in 2019.
Electronics 09 02144 g011
Figure 12. Irradiation in the case study for the day 27 August 2019.
Electronics 09 02144 g012
Figure 13. Temperature in the solar panels of the case study for day 27 August 2019.
Electronics 09 02144 g013
Figure 14. Electricity production by photovoltaic system case study in 2019 and PVSyst estimate.
Electronics 09 02144 g014
Figure 15. Comparative solar irradiance in 2019, PVsyst data, UAV-DSM data and solar panels.
Electronics 09 02144 g015
Table 1. Annual global irradiation averages in the largest cities of Colombia [3].
CityElevation (MSL)Annual Average (Wh/m2)
Santa Marta75606.4
Barranquilla85601.4
Cartagena25552.5
Valledupar1845423.6
Cucuta3115301.6
Villavicencio4444704.1
Ibagué13234679.2
Medellin14404530.9
Cali9964521.0
Pereira13424210.9
Armenia14854081.0
Bogotá25474037.7
Table 2. Studies around the world that have implemented solar radiation analysis with geographic information systems.
Place Technique Reference
Turkey GIS, 3D ModelsColak et al., 2020 [14].
USA GIS, LIDAR, UAVNelson, and Grubesic., 2020 [15].
China GIS, SatelliteGuo et al., 2020 [16].
China GIS, LIDARHuang et al., 2019 [17].
Czech Republic GIS, UAVFogl and Moudrý, 2019 [18].
Spain GIS, LIDARQuirós et al., 2018 [19].
Argentina GIS, LIDARMachete et al., 2018 [20].
Japan GIS, 3D ModelsTogawa et al., 2018 [21].
USA GIS, LIDAR,Halama et al., 2018 [22].
Turkey GIS, DRONEUsta et al., 2017 [23].
Canada GIS, LIDARSalimzadeh, and Hammad, 2017 [24].
Sweden GIS, LIDAR,Lingfors et al., 2017 [25].
Canada GIS, Aerial photoChow et al., 2016 [26].
Burkina Faso and Mali GIS, LIDAR, UAVSzabo et al., 2016 [27].
Czech Republic GIS, LIDARFogl and Moudrý 2016 [28].
Theoretical GISLi et al., 2016 [29].
China GIS, LIDARHuang et al., 2015 [30].
Taiwan GISKo et al., 2015 [31].
Korea GIS, 3D ModelsByrne et al., 2015 [32].
UK GIS, 3D ModelsErdelyi et al., 2014 [33].
Slovenia GIS, LIDARLukač et al., 2013 [34].
Italy GIS, LIDARAgugiaro et al., 2012 [35].
Slovakia GIS, 3D ModelsHofierka and Kaňuk, 2009 [36].
Spain GISIzquierdo et al., 2008 [37].
UK GISGadsden et al., 2003 [38].
U.S.A. GISFu and Rich 2002 [39].
Table 3. Differences in the variables related to the calculations of solar irradiance from UAV data, PVSyst estimate and solar panels.
Variable UAV-DSM Data (Solar Panel Area) PVSyst EstimateData of the Photovoltaic System Case Study
Average annual irradiance on the roof (kWh/m2)1417.981661.51317.88
Average monthly irradiance on the roof (kWh/m2)118.16138.46109.8
Average daily irradiance on the roof (kWh/m2)3.884.613.66
Energy production for the year 2019 (Wh/m2)1236.96246.92217
Average annual energy production (MWh) for 20191334.68268.9236.95
Publisher’s Note: MDPI stays neutral with regard to jurisdictional claims in published maps and institutional affiliations.

