Article

Development of a Wearable Reflection-Type Pulse Oximeter System to Acquire Clean PPG Signals and Measure Pulse Rate and SpO2 with and without Finger Motion

1
Korea I.T.S. Co., Ltd., Gangnam, Seoul 06373, Korea
2
School of Electronics Engineering, Kookmin University, Seoul 02707, Korea
*
Author to whom correspondence should be addressed.
Electronics 2020, 9(11), 1905; https://doi.org/10.3390/electronics9111905
Submission received: 12 October 2020 / Revised: 2 November 2020 / Accepted: 3 November 2020 / Published: 13 November 2020
(This article belongs to the Section Circuit and Signal Processing)

Abstract

:
Clinical devices play a vital role in diagnosing and monitoring people’s health. A pulse oximeter (PO) is one of the most common clinical devices for critical medical care. In this paper, we explain how we developed a wearable PO. We propose a new electronic circuit based on an analog filter that can separate red and green photoplethysmography (PPG) signals, acquire clean PPG signals, and estimate the pulse rate (PR) and peripheral capillary oxygen saturation (SpO2). We propose a PR and SpO2 measurement algorithm with and without the motion artifact. We consider three types of motion artifacts with our acquired clean PPG signal from our proposed electronic circuit. To evaluate our proposed algorithm, we measured the accuracy of our estimated SpO2 and PR. To evaluate the quality of our estimated PR (bpm) and SpO2 (%) with and without the finger motion artifact, we used the quality evaluation metrics: mean absolute percentage error (MAPE), mean absolute error (MAE), and reference closeness factor (RCF). Without the finger motion condition, we found that our proposed wearable PO device achieved an average 2.81% MAPE, 2.08 bpm MAE, 0.97 RCF, and 98.96% SpO2 accuracy. With a finger motion, the proposed wearable PO device achieved an average 4.5% MAPE, 3.66 bpm MAE, 0.96 RCF, and 96.88% SpO2 accuracy. We also show a comparison of our proposed PO device with a commercial Fingertip PO (FPO) device. We have found that our proposed PO device performs better than the commercial FPO device under finger motion conditions. To demonstrate the implementation of our wearable PO, we developed a smartphone app to allow the PO device to share PPG signals, PR, and SpO2 through Bluetooth communication. We also show the possible applications of our proposed PO as a wearable, hand-held PO device, and a PPG signal acquisition system.

1. Introduction

Stroke and cardiovascular diseases are the main causes of human disability and death [1,2] and can seriously affect the elderly populations. For the continuous monitoring of these patients, prolonged care is necessary, which poses unique challenges worldwide. Pulse rate (PR) and peripheral capillary oxygen saturation (SpO2) are the most popular physiological parameters for the continuous medical monitoring of patients. These parameters vitally enable the continuous monitoring of heart activities.
Wearable medical devices offer some advantages in the continuous monitoring of the health condition of the patients. These devices can provide non-invasive, low-powered, and convenient ways of measurement, among other features. In medical applications, photoplethysmography (PPG) is an optical measurement method that can be obtained noninvasively. PPG is also known as photoelectric plethysmography. The word “plethysmography” comes from two Greek words: plethysmos and graph [3]. The word “plethysmos” means “increase” [4,5]. Different types of plethysmographs exist that can measure changes in blood volume using different transducers for particular types of applications. PPG is one of these and is also known as the “digital volume pulse” [3]. To form a PPG waveform, optoelectronic components are required. These components contain a light source that illuminates the tissue (e.g., the skin) and a photodetector (PD) that measures variations in blood volume through a change in light intensity [6].
A PPG signal consists of AC and DC components. The AC component indicates the change in blood volume, which occurs as a result of the cardiac function. The DC component indicates light absorption in different layers of the skin. Figure 1 displays the AC and DC components of the PPG signal. In Figure 1, the red waveform is the AC component, which arises from the cardiac function (the change in the blood volume). The DC component represents the light absorption of arterial blood (the yellow area), venous blood (the blue area), different types of tissues (epidermis, dermis, subcutis, or hypodermis), and the bones (the orange area). The bone absorption, shown in Figure 1, is exclusively for transmission-type PPG signals. In reflection-type signals, bone absorption does not occur and can be ignored when measuring the PPG signal.
A pulse oximeter (PO) is a device that measures the proportion of oxygenated hemoglobin (HbO) in the blood of pulsating vessels, especially the capillaries of the fingers and ears. This medical device is also used for measuring PR, the perfusion index, the respiratory rate, and the pleth variability index. Figure 2 shows a commercial Masimo MightySat Rx Fingertip PO. In a PO, two PPG signals obtained with light sources at two different wavelengths are used to measure SpO2. Generally, red and infrared light-emitting diodes (LEDs) are used. However, in our experiment, we used red (620–625 nm) and green (520–525 nm) LEDs because near-infrared LEDs exhibit lower efficiencies in solutions [7]. Additionally, Hossain et al. have shown that red (660 nm) and green (525 nm) pairs provide the highest possible accuracy for SpO2 measurement both with and without consideration of scattering effects [8]. In [9,10], the authors showed an experimental implementation and comparison of organic and inorganic LED-PD based pulse oximeters using a red-green pair of LEDs. In [11], the authors experimentally showed that green LEDs have a better performance and higher correlation for measuring SpO2 at room temperature (25 °C) and IR LEDs at temperatures below 15 °C. Additionally, green wavelength has an almost exact penetration depth compared with the IR wavelength. In [12,13], the authors showed the possible range of blood vessel depth, from skin to deep blood net plexus during a Monte-Carlo experiment using Bear–Lambert law. The range was from 1.75 to 2.1 mm. Green wavelength penetration depth ranges from 1.35 to 1.60 mm, which is lower than the possible blood vessel depth [14]. For this reason, green is the one and only LED that is both commercially available as well as suitable for measuring SpO2 in terms of blood vessel penetration depth from the skin.
Two types of PO exist: (a) transmission- and (b) reflection-type. The transmission-type PO requires LED and PD to be placed on the opposite side of the finger. However, the reflection-type PO requires LED and PD to be placed side by side, where PD measures the variations of reflected light intensity arising from the variations of blood volume.
Figure 3a,b show the transmission-type and reflection-type of PO, respectively. The transmission-type exhibits some disadvantages over the reflection-type. At low ambient temperatures, human arteries contract to retain the body temperature by reducing the heat loss. Hence, from the arterial capillaries in the transmission-type, the signal drops and undermines the accuracy of the measurement. The reflection-type PO does not create such a problem because the sensor (consisting of LEDs and a PD) can be placed close to any part of the body [15]. In [16], the authors addressed the challenges and limitations of reflectance-type pulse oximeters at the fingertips and wrist. They claimed that the reflective mode exhibits pressure and ambient light sensitivity, which leads to DC instability of the PPG signal. Such an ambiguity is also true for transmission-type PO, as described in [15]. Therefore, to calibrate and measure SpO2, we only considered the AC part of the red and green PPG signals. In [17], the authors showed the performance comparison between finger and forehead location to determine the SpO2 by reflectance PO. They experimentally showed that finger probes yield better performance than forehead probes. In [18], the authors compare the acceptability of reflectance forehead and transmittance earlobe PO during vascular surgery. They confirmed that reflectance forehead PO is acceptable for use during vascular surgery. We can see that the researchers in [15,16,17,18] show several advantages and acceptability of reflectance PO compared with transmission-type PO. Hence, in our experiment, we developed a reflection-type PO to estimate PR and SpO2.
We developed an electronic circuit to acquire clean PPG signals. After obtaining these signals, we formulate an algorithm to estimate PR and SpO2 with and without considering the motion artifact. The rest of this paper is structured as follows. In Section 2, we describe the related works. We briefly describe our contributions in Section 3. In Section 4, we elaborately describe our proposed electronic circuit for PPG signal acquisition and describe an algorithm to estimate PR and SpO2. In Section 5, we demonstrate the hardware implementation. In Section 6, we discuss the results and evaluate the performance of our proposed electronic hardware and algorithm. In Section 7, we show some possible applications of our proposed wearable PO device. We conclude our paper in Section 8.

2. Related Works

In this section, we analyze some related works. As our work concerns the implementation of the PO device, we describe some implementation and PR algorithm based related works and describe our contribution to overcome their limitations.
Pang and Ma proposed a concave housing structure sensor (LEDs and PD) [19]. They used analog bandpass filtering and amplification stage and showed the SpO2 calibration equation. However, they did not show any approach to separate the two PPG signals and did not measure the performance of their device. Khan et al. proposed a transmission-type PO system based on organic LED (OLED) and organic PD (OPD) using red (626 nm) and green (532 nm) LEDs [10]. They needed a driver circuit with an extra bipolar junction transistor with high-power consumption (around 180 mW) to control the OLED and OPD. Their extracted red and green PPG signals were very weak (peak-to-valley amplitude: around 4 mV) and likely responsible for the low accuracy during the measurement of PR and SpO2, which was the main limitation of their research. Furthermore, they did not show any approach to separate the two PPG signals. Mohan et al. performed the time- and frequency-domain analysis to estimate PR [20]. However, they hardly demonstrated any hardware implementation of their proposed algorithm for the estimation of PR. Maeda et al. compared the green light (525 nm) and infrared light (880 nm) of the reflection-type PO and noticed that the green PPG signal demonstrates a high correlation with the electrocardiogram (ECG) results [11]. Their acquired PPG signals from their proposed hardware contain less morphological features. Elsewhere, Oliver and Flores-Mangas proposed a low-power wearable PO device that could measure PR and SpO2 [21]. Although their focus was on the implementation of the PO device, they did not evaluate the PR and SpO2 measurements using their device, which is important to verify their implementation. Clarke et al. managed to record clean PPG signals. After that, they contaminated the PPG signal by adding identical noise additive white Gaussian noise (AWGN) to both the red and infrared PPG signals [22]. The aim of Joseph et al. is to determine the different parameters of PPG signal [23]. They used the wavelet de-noising approach to remove AWGN from the synthetic PPG signal. In [10] and [22], the simulation was performed on the synthesized motion corrupted PPG signal, while we consider the practical motion corrupted PPG signal to develop our PO system. Ram et al. proposed an adaptive step-size least mean squares adaptive filter to reduce the motion artifact corrupted PPG signal [24]. Their motion artifact removal algorithm was dependent on the noise-free reference of the PPG signal, which was the main limitation of their proposed method. Li and Warren designed a filter-free hardware circuit for wearable and surface-based applications [25]. In their proposed method, they considered the slight motion of the fingers in such a way that the PPG signal would not be influenced by motion. A filter-free PO circuit needs to be dependent on extreme software filtering for which the signal processing unit requires more memory and power for the consumption of the hardware unit, which is the main limitation of their study. Yang et al. used adaptive spectrum noise cancellation to remove the motion artifacts from the PPG signals [26]. To detect the frequency of motion, they used onboard accelerometer and gyroscope sensors. An external sensor dependent motion removal algorithm based on their PO system is extremely difficult to use as a wearable PO device. Fu and Liu proposed a hardware design to develop a wearable PO device whereby an accelerometer sensor was used to detect motion [27]. Ali et al. proposed a type of hardware for wearable PO devices for which they used an active low-pass filter with a 10 Hz cutoff frequency [28]. The selected cutoff frequency was more than the pulse frequency. This condition allowed the noise of other low frequencies into the circuit and reduced the accuracy of the PO measurements. They used a sample and hold circuit (SAH) to read the two PPG signals, however, the PPG signals can affect each other because of the capacitance effect of the filtering stage.

3. Our Contribution

The above analysis shows that various limitations were identified in the works of [10,11,19,20,21,22,23,24,25,26,27,28]. Our proposed electronic circuit can provide clean and strong PPG cycles, while the proposed electronic circuit of [19] and [10] cannot achieve this kind of PPG signal. We considered three kinds of practical finger motions for our PR measurement algorithm, while [22,23] proposed a motion removal algorithm using synthesized noise on synthetic PPG signals. Our electronic circuit with an analog filter and an optocoupler ensured no interference from other low- and high-frequency noises. This feature inspired us to develop a simple motion removal algorithm for estimating PR and SpO2, which was a drawback in [25]. Our entire system does not need any external hardware to detect the motion artifact of the algorithm for measuring PR and SpO2, while [26,27] used an accelerometer to detect motion, which helped them develop their motion removal algorithms. The contributions of our proposed wearable PO system are summarized as follows:
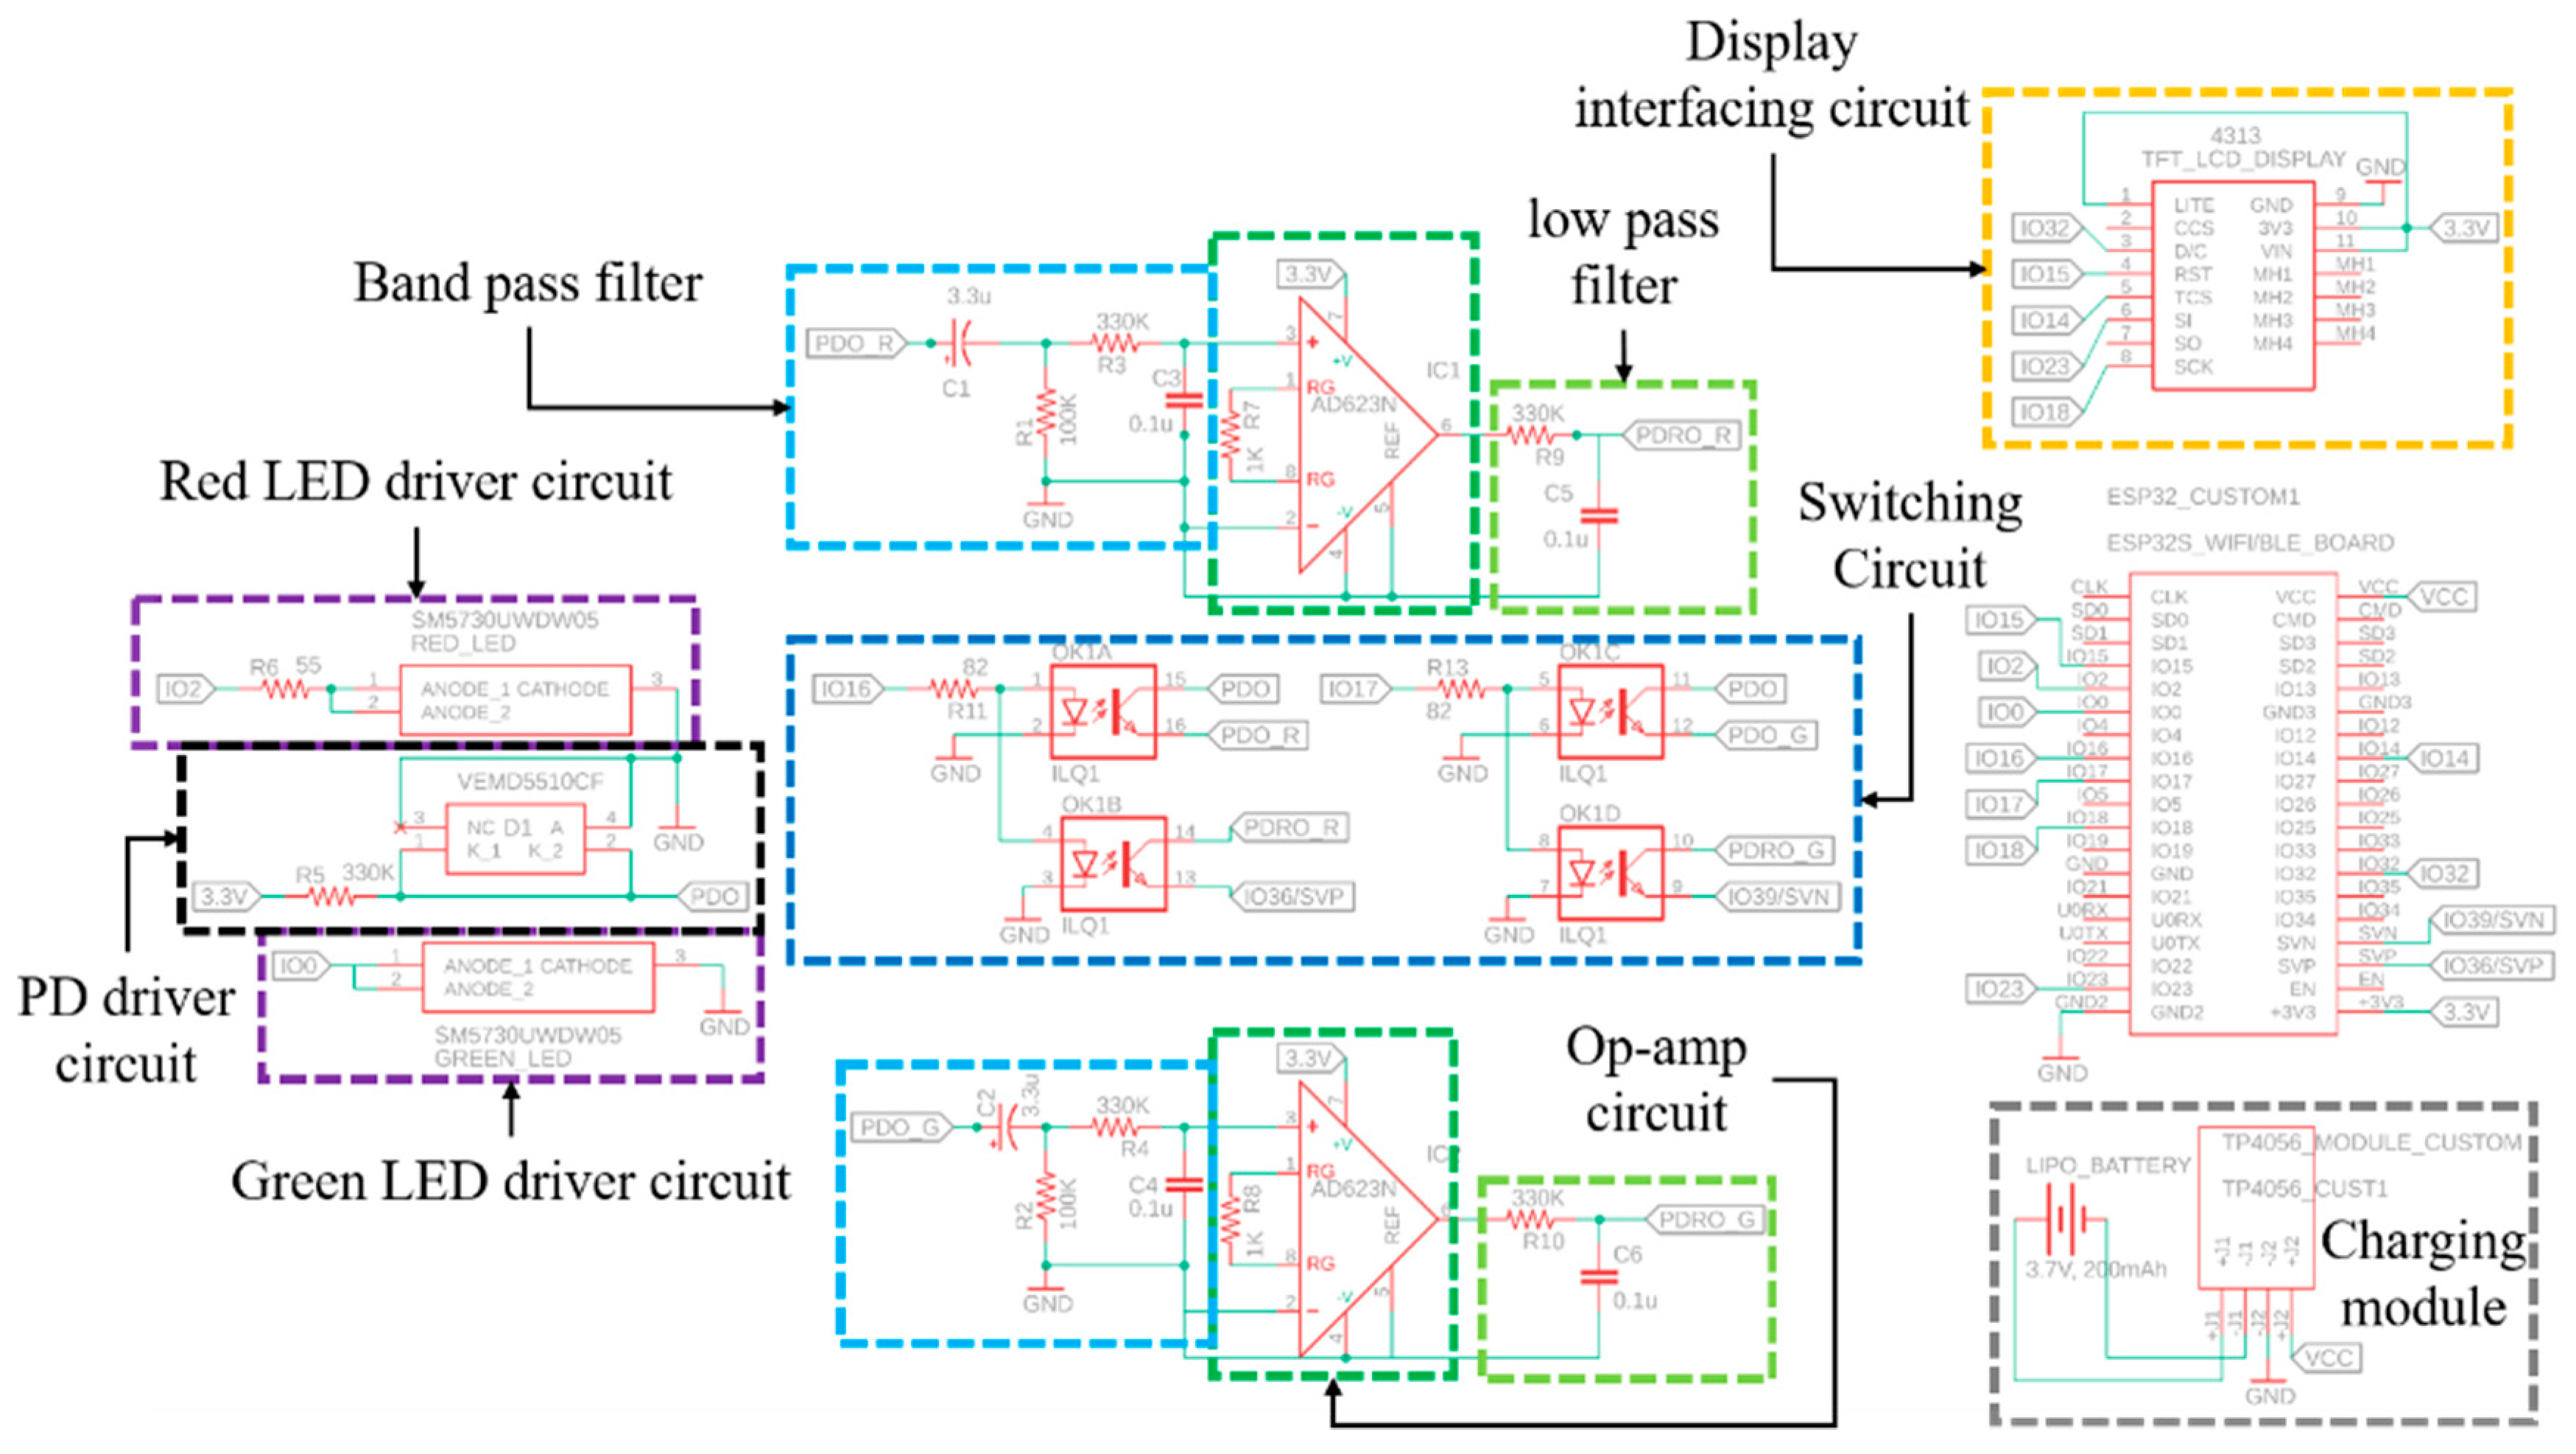
  • We propose an electronic circuit using an analog filter that contributes to acquire clean PPG signals.
  • To measure SpO2, our proposed system interfaces with an optocoupler, which serves to separate the red and green LED signals.
  • Generally, it is known that a single cycle of the PPG signal can be used to measure PR. However, our experiments showed that the pulse period for each PPG cycle was not the same. Hence, we propose an algorithm that can detect similar periods of PPG cycles, which we call “true” PPG signals. In this manuscript, our proposed PR measurement algorithm also helps in distinguishing the true PPG signals from the sequential PPG signals.
  • We also consider three kinds of finger motions while measuring PR. By increasing the moving average window for processing the PPG signals, we mitigate the finger motion artifact noise. This feature can be used for monitoring seriously ill patients.
  • We show possible applications of our proposed wearable PO device as a wearable, hand-held device, and clean PPG signal acquisition system through USB to serial communication.
  • To use our proposed wearable PO device as a hand-held PO device, we design a smartphone app that can be used to monitor PR and SpO2 through a Bluetooth connection between the smartphone and device.

4. Proposed Method

In this section, we describe our proposed PO system. We divide the discussion of our proposed system into two parts: (a) proposed electronics circuit for PPG signal acquisition and (b) proposed PR and SpO2 measurement algorithm with and without the motion artifact. Figure 4 shows the steps of PO development. First, we extract the LED signals from PD by placing a finger on the sensor (PD and LEDs). Then, we follow the filtering and amplification steps to filter out the unwanted noise from the PPG signal, as shown in Figure 4. After that, we interface an optocoupler in our circuit to separate the red and green LED signals and read the PPG signals through the analog-to-digital converter (ADC) pin of the microcontroller unit (MCU). Finally, we develop the PR and SpO2 measurement algorithm by monitoring the PPG signals and display the PR and SpO2.

4.1. Proposed Electronic Circuit for PPG Signal Acquisition

To design our proposed electronic circuit, we use the following components, detailed in Table 1.
Herein, we develop an electronic circuit in a manner such that we can acquire clean PPG signals from the proposed electronic circuit. Therefore, we use analog filtering and amplification stage in our proposed electronic circuit. Owing to the use of the analog filtering stage, the capacitance effect of one PPG signal can be affected by another PPG signal. This interference can lead to inaccurate SpO2 measurements. So, to measure SpO2 appropriately, it is important to separate red and green PPG signals. Thus, we use two same filtering and amplification circuits for separately filtering and amplifying two PPG signals. The block diagram of our proposed electronic circuit is shown in Figure 5, in which we show four switching circuits and two PD reader circuits. The switching circuits represent the optocoupler-based circuits. We use optocoupler because it can produce electronic isolation of the interference between input and output. The two PD reader circuits represent the same analog filtering and amplification circuit to separate red and green LED signals. The two optocoupler-based left switching circuits are used for isolating the two outputs of the PD driver circuit (red and green PPG signals), and the two optocoupler-based right switching circuits are used to isolate the output of the PD reader circuit. Owing to the presence of the analog filter circuit in the PD reader circuit, the two amplified and filtered LED signals can interfere or overlap with each other, which may not lead to separation of the LED signals. Hence, we isolate the input and output part of PD reader circuit using an optocoupler-based switching circuit. Moreover, we blink the red and green LEDs at 100 Hz with a 50% duty cycle because, each time, PD can only measure one LED signal. Figure 6 shows the LED switching states of the green and red LEDs. The isolated LED signals are read using the two ADC pins of MCU, as shown in Figure 5.
Our proposed electronic circuit contains five parts: (a) a sensor circuit, (b) a PD reader circuit, (c) a switching circuit, (d) a display interfacing circuit, and (e) a charging circuit. Figure 7 shows the complete schematic diagram of the proposed electronic circuit. The sensor circuit consists of an LED and a PD driver circuit. In Figure 7, we can see the red and green LED driver circuits as well as the PD driver circuit. We set the LED current at 20 mA through the LED driver circuit. The PD reader circuit consists of a bandpass filter, an op-amp, and a low-pass filter. We set the cutoff frequency of the bandpass filter from 0.48 to 4.82 Hz. For the op-amp circuit, we set the gain at 100. The cutoff frequency of the low-pass filter is 4.82 Hz. The output of the low-pass filter is the output of the PD reader circuit. The switching circuit is implemented with an optocoupler.
As we need four switching circuits, we use a quad-channel optocoupler. For the optocoupler input, we set the LED forward current at 20 mA. This switching circuit is controlled by the digital pin of MCU. In this case, the IO16 and IO17 pins of ESP32-WROOM-32 are used for controlling the input of the optocoupler. The output of the optocoupler is the output of the PD reader circuit. The IO36 and IO39 pins of ESP32-WROOM-32 are the 12-bit ADC pins for reading the filtered and amplified PPG signals. We use ST7789, a 1.3-inch thin-film-transistor (TFT) liquid crystal display (LCD), to show the PR and SpO2. In Figure 7, we can see the display circuit, marked by an orange rectangular box. For the charging circuit, we use a TP4056 IC-based charging module. Figure 8 shows the schematic diagram of the charging module, which is required to be used because of the lithium polymer battery in our proposed electronic circuit.

4.2. Proposed PR and SpO2 Measurement Algorithm

In this section, we discuss the algorithm of the proposed PR and SpO2 measurements. Figure 9 shows the block diagram of the PR measurement. For measuring PR, we have to detect the peak or valley of the PPG waveform. By measuring the interval between two peaks or valleys of the PPG signal, we can easily estimate the PR of each PPG cycle. Normally, the filtered and amplified PPG signal is affected by a very weak high-frequency noise. Thus, to remove this type of noise, we use the moving average filter with a window size of 15. Here, window size indicates the number of samples. Then, we take the differentiation on the moving average of the PPG signal.
After applying the differentiation, we found zero crossing samples. However, they are noisy because the sample to sample difference in the PPG waveform does not follow any specific increment or decrement order. Hence, we apply the moving average filtering on the differentiated PPG signal with a window size of 20. The differentiation of the PPG cycle has three zero crossing points because a full cycle of PPG signal consists of two peaks and one valley or two valleys and one peak, and the differentiation of peak or valley is always zero. Therefore, to detect the full cycle of the PPG signal, we have to count this zero-crossing point until it reaches three. After detecting the full cycle of the PPG signal, we can estimate the PR using the formula (60 × 1000/time for a single cycle in millisecond) shown in Figure 9. In this way, we can measure the PR for each cycle. Generally, the time of each PPG cycle may be changed because of the slight motion of the finger and the quantity of this type of PPG cycle is significantly less. This type of PPG cycle is called the “false” PPG cycle. We have to detect the false and true PPG cycles. Then, we consider only true PPG cycles to estimate our PR and SpO2. The true PPG cycles are the PPG cycles where the estimated PRs exhibit very low variations. In our experiment, we set the variation from the mean at 15 beats per minute (bpm). Then, we take the average of PR of the true PPG signals to estimate the final PR. Finally, we verify if the difference between the previous average and current average is less than 2 or not. After consecutively checking it five times, the current average PR is set as the output PR. To measure the final SpO2, we calculate the average of estimated SpO2 from 10 true PPG cycles.
Figure 10 shows the flow chart of the false PPG signal detection and PR measurement algorithm. To measure PR, we use a red LED PPG signal. To detect the peak or valley point of the red LED signal, we calculate the moving average of the red LED signal, the differentiation of the moving average of the red LED signal, and the moving average of the differentiation. After detecting the peak point of the red LED signal, we can detect the full cycle of the red LED signal. The full cycle is detected when the two consecutive peaks are detected. After that, we measure the time interval of the two consecutive peaks of the red LED signal. Then, we measure the PR of the detected cycle. We verify it with “max_avg_hr”, which is set at 200 during the initialization of the algorithm. Here, “max_avg_hr” stands for maximum average PR. If PR is greater than “max_avg_hr”, then we will again read the red LED signal from the ADC pin of MCU; otherwise, we check “max_avg_hr” with “mhr”, which indicates the maximum PR of a PR array. We consider 20 PR values in the array, which is always updated until the final PR is measured. If “mhr” is less than the “max_avg_hr”, the estimated PR will be counted as a PPG cycle; hence, the “bpm_count” variable will increase by one. The variable “bpm_count” indicates the number of PPG cycles. After increasing “bpm_count”, we store the estimated PR in the PR array. Then, we measure the summation of all PRs, called “sum_hr”. If “mhr” is greater than “max_avg_hr”, we set “mhr” at 0 and detect the PRs that are greater than “max_avg_hr” from the PR array to measure their summation. We have to delete those PRs from the “sum_hr”. Therefore, we call it “del_hr”. Herein, we also refer to those corresponding PPG cycles of those PRs as “false PPG cycles”. Later, we measure the average PR (i.e., “avg_hr”) and, to estimate “max_avg_hr”, we add “false_PPG_det_th” to “avg_hr”. We set the value of “false_PPG_det_th” at 15, experimentally. To show the stable PR, we measure the difference between five consecutive instances of “avg_hr” and, if their differences are less than two, we take “avg_hr” as the final estimated PR. For this decision, we use two variables “count_stable” and “stable_limit”, which indicate the number of the consecutive stable PRs and the limit of the consecutive counts, respectively.
SpO2 (%) indicates the percentage of oxy-hemoglobin (HbO2) concentration in blood as defined in (1):
SpO 2 = HbO 2 Total   Hemoglobin × 100 %
Here, “Total Hemoglobin” indicates the sum of oxy (HbO2) and deoxy-hemoglobin (Hb) concentration. The Beer–Lambert law describes the relationship between the attenuation of light through a substance and the properties of this substance. Light attenuation relates to the absorptivity of light for a particular substance. Herein, we used red and green lights; therefore, the green and red LED light absorptivities for Hb and HbO2 are shown in Figure 11.
The absorptivities of green LED for Hb and HbO2 are almost identical. Therefore, only one LED is unreasonable for measuring SpO2. For red LED, we can see a significant difference in the absorptivity of Hb and HbO2. If we consider the significant absorptivity difference in red and green light wavelength, we expect more precise measurements of SpO2 using red and green light. In [8,9,10], researchers have already shown theoretical and experimental analysis of measuring SpO2 using red-green LEDs instead of red-IR or green-IR LEDs. In [11], it was experimentally proven that the red-green ratio is higher than the red-IR ratio at 25 °C and below 15 °C. Furthermore, the correlation between PPG pulse and ECG RR interval is higher in green LED than IR LED at 25 °C and below 15 °C, and it is more than 0.95 [11]. In [8], using the Beer–Lambert law, theoretically, they showed prominent simulation results for red-green LED than red-IR LED. The value of theoretical “R” of red-green has a higher range than red-IR from 70% to 100% SpO2. So, the Beer–Lambert law also provides strong supports to select green LED compared with IR LED. Therefore, the green LED is more important than the IR LED. Thus, it indicates that, for measuring SpO2, we need two LEDs, red and green LEDs. We can obtain the red and green PPG signals using red and green LEDs through our proposed electronic circuitry. The red and green PPG signals indicate the light absorption of blood molecules (i.e., Hb and HbO2). By measuring the ratio of PPG signal components (AC and DC components), SpO2 can be measured from the molar extinction coefficient of Hb and HbO2 for red and green wavelengths, shown in (2) and (3), respectively [8,9,10,15,19,22,28,29,30].
R = A red A green ( AC / DC ) red ( AC / DC ) green
SpO 2 = ε red , Hb ε green , Hb R ( ε red , Hb ε red , HbO 2 ) + ( ε green , HbO 2 ε green , Hb ) R
In (2), “R” indicates the ratio of absorptivity of red ( A r e d ) and green ( A green ) LED and (AC/DC) represents the ratio of AC and DC component of PPG signal. In (3), ε red , Hb , ε green , Hb ,   ε red , HbO 2 and ε green , HbO 2 are the molar extinction coefficients of red and green LED for Hb and HbO2 substances, respectively. If we substitute the values of R and molar extinction coefficients of Hb and HbO2 for the respective red and green LED lights, we can determine the uncalibrated SpO2 value.
To measure SpO2, we follow the flowchart in Figure 10 until we detect the true PPG signal for the red and green PPG signals. Then, we measure the only AC part of the true PPG signal. Next, we calculate the root mean square (RMS) of the AC part of the two PPG signals. After that, we take the ratio of the RMS value of red and green LED signals and we estimate the calibrated equation for the calculation of SpO2. Finally, we measure the average of 10 consecutive SpO2 values. Figure 12 shows the block diagram of the SpO2 measurement.
Experimentally, we found that RMS of the AC part is highly correlated to SpO2 calibration. Therefore, we consider RMS of the AC part in (2). To determine the calibrated curve, we plot the reference SpO2 values and ratio of AC RMS of red and green PPG signal (from (2), R). Figure 13 shows the calibrated curve between reference SpO2 and the ratio of AC RMS. From Figure 13, we can see that our proposed device is calibrated in the range of 80% to 100% SpO2. For SpO2 calibration, as the trained individual, we hold our breaths for about 2 minutes to make the variation of SpO2 during the signal acquisition from our proposed device. We calcuate the average value of the ratio of two PPG signals five times, and then plot our averaged data with the reference SpO2 data. Figure 14 shows the reference SpO2 variation over 330 s while holding a breath for 2 min (from around 90 s to 210 s). By the breath holding process, we vary the SpO2 from 100% to 80%. This is the maximum range to vary the SpO2 for calibration. We measured the R value and used MATLAB’s quadratic polynomial curve fitting tool to fit the scattered points of reference SpO2 and R value. The equation of the fitted curve is given as follows:
SpO 2 = 100.4 × R 2     90.98 × R   +   98.46
In (4), R indicates the ratio of RMS values of the AC parts of red and green PPG signals.

4.3. Analyzing and Removing Finger Motion Artifact

We consider three kinds of finger motion: (a) up-down, (b) left-right, and (c) round-up. Figure 15 shows these three types. To remove the finger motion noise, we use the same PR and SpO2 measurement algorithms as those in Figure 10, Figure 11 and Figure 12. In this case, we use different sizes of moving average window (i.e., 30). To determine the size of the moving average window in our experiment, we increase the window size from 10 to 40 and measure the accuracy of the measured PR using the algorithm of Figure 10. From Figure 16, we can see that accuracy improves with an increase in the window size; however, after a certain window size, the accuracy is not improved. This could be attributed to the two properties of moving average. They are (a) moving average can eliminate high-frequency noise as well as higher window size can eliminate higher frequency noise; however, (b) the enormous size of a moving average window can change the original shape of the signal. In our case, owing to the effect of the finger motion artifact, the PPG signal is influenced by noise. So, we have to determine the window size by experimentally increasing the window size of the moving average and checking the performance of our proposed PR algorithm. The increase in the window size may remove the noise from the noisy PPG signal, which can result in enhancing the accuracy of the proposed PR algorithm until the window size of 30, as shown in Figure 16. However, if we apply a window size greater than 30, the signal can lose its original shape, undermining the performance of the proposed PR algorithm. Hence, we set the moving average window size at 30 for the processing of the three types of finger motion affecting the PPG signal.

5. Hardware Implementation

In this section, we discuss the hardware implementation of our proposed electronic circuit used for estimating PR and SpO2. We implement our proposed algorithms (described in Figure 9, Figure 10 and Figure 12) on the ESP32 MCU to measure the PR and SpO2. Figure 17 shows the hardware implementation of our proposed electronic circuit, which is the prototype version of a wearable PO device.
To develop a wearable version of the proposed PO system, we use surface-mount device (SMD) type components for our proposed electronic circuit. In this case, three components are changed: (a) an op-amp, (b) an optocoupler, and (c) an MCU. In the printed circuit board (PCB) of our final wearable PO device, we use the AD623 ARMZ op-amp, the TCMT4106 optocoupler, and the ESP32-PICO-D4 MCU. Figure 18 shows the implementation of the wearable version of the proposed electronic circuit.
We remove the LCD from the wearable version. To display the PPG signals, PR, and SpO2, we develop a smartphone app. Figure 19 demonstrates the developed smartphone app used to display the PPG signal, PR, and SpO2. For this purpose, we connect our wearable PO device to the smartphone via Bluetooth. The ESP32 MCU has built-in Bluetooth to communicate and share data with other devices. We use this built-in Bluetooth to share the data of our proposed wearable PO device with the smartphone device using the app.

6. Results and Discussion

In this section, we show the red and green PPG signals of our proposed electronic circuit, the moving average output of them, the differentiation of the moving average output, and the moving average output of differentiation under the three types of finger motion as well as without finger motion. PPG signal can also be easily induced through finger motion. It depends on the quality of finger and sensor attachment. The best location of the finger depends on the physical structure of the finger related to the capillary density of finger muscles. Moreover, the best location varied from man to man. Therefore, during experiments, we consider random finger location like the following Figure 20a, and confirm the affirmed attachment of finger to sensor in a manner that, during finger motion, the sensor is not displaced from the sensor-finger attachment like Figure 20b. In Figure 20b, the sensor is placed in the probe (blue color) and the black dotted circle shows a comfortable, flexible, soft adhesive tape attachment to the sensor-finger attachment.
We evaluate the accuracy of our PR and SpO2 measurements. To evaluate the PR algorithm, we use three quality metrics: mean absolute percentage error (MAPE), mean absolute error (MAE), and reference closeness factor (RCF) [20]. The definitions of these quality metrics are given below.

6.1. MAPE

MAPE presents the accuracy of an algorithm as a percentage and is expressed as follows. The absolute difference between PRref and PRest is divided by the reference value PRref and then summed up for every PRest point in time. PRref is the actual value attained from the commercial PR monitoring device. PRest is the estimated PR. Finally, the summed output is divided by the number of window points (Wn) and multiplied by 100, yielding the percentage error. Equation (5) shows the expression of MAPE.
MAPE = ( ( 1 W n ) i = 1 W n PR ref ( i ) PR est ( i ) PR ref ( i ) ) × 100

6.2. MAE

MAE is a metric that measures the closeness of the estimated PR outputs to the PR from the reference device. Equation (6) shows the expression of MAE.
MAE =   ( 1 W n ) i = 1 W n | PR ref ( i ) PR est ( i ) |

6.3. RCF

RCF is a prominent metric that also determines the closeness of the measurement of an algorithm to the reference PR; it ranges from 0 to 1. The expression of RCF is given in (7).
RCF = ( 1 W n ) i = 1 W n ( 1 | PR ref ( i ) PR est ( i ) | 100 )

6.4. Evaluation of the Proposed Electronic Circuit

For this evaluation, we need a reference device. In this case, we use a clinical device, known as a Schiller Argus OXM plus (2020) [31]. Figure 21 shows the reference device.
Figure 22a shows the output of the red and green PPG signals of the proposed electronic circuit, read by the ADC pins of the MCU. Our PPG signal is free from high-frequency noise. Figure 22b shows the moving average output (with a window size of 15) of the two PPG signals. Figure 22c shows the differentiation of the two PPG signals. In Figure 22c, we can see the secondary peak aligned with the 0 value of the y-axis for green LED signal, which can make the error in determining a full cycle to estimate the PR. The moving average of differentiation can eliminate this issue. Figure 22d exhibits the moving average (with a window size of 20) of Figure 22c.
Figure 23a, Figure 24a and Figure 25a exhibit the red and green PPG signals considering the up-down, left-right, and round-up finger motions, respectively. Figure 23b, Figure 24b and Figure 25b show the peak detection of the three finger motions. From Figure 23b, Figure 24b and Figure 25b, we can see that our algorithm can detect the peak of two motion artifact-induced signals, which ensures the higher quality of our proposed method.
For the systematic evaluation of our proposed wearable pulse oximeter (PO) device, we vary the signal-to-noise ratio (SNR) from 5 dB to 60 dB with a step of 5 dB and measure the mean absolute error (MAE), mean absolute percentage error (MAPE), reference closeness factor (RCF), and SpO2 accuracy. Figure 26 shows the MAE, MAPE, RCF, and SpO2 accuracy curves with respect to different SNRs. We add white Gaussian noise to the acquired clean PPG signal by our proposed wearable PO device. In this case, we use the MATLAB “awgn” function, which takes SNR in dB and clean PPG signal as inputs and provides the noisy PPG signal as the output.
From Figure 26, we can see that, at 5 dB SNR, our proposed device achieved maximum MAE and MAPE close to 9 and 7, respectively. Here, 5 dB is the lowest SNR value in our experiment and indicates the noisiest PPG signal. So, from this experimental result, we can say our proposed PR measuring algorithm can estimate PR with reasonable accuracy for noisy PPG signal. At the lowest SNR, the SpO2 accuracy and RCF value are more than 90%, as shown in Figure 26, which indicates that our proposed PO device can measure PR and SpO2 for the noisy PPG signal with at least 90% accuracy.
Table 2, Table 3, Table 4 and Table 5 show the evaluation results of our proposed device and PR-SpO2 measuring algorithm for 15 subjects. The subjects are healthy and their age range is from 25 to 55 years old. The number of male and female subjects is 9 and 6, respectively. We collect 1 min of red and green PPG signals from our proposed wearable PO device and the reference device with and without motion. For each case of with (finger) motion, the subjects move their fingers for 1 minute. From Table 2, Table 3, Table 4 and Table 5, we present the values of the MAPE, MAE, and RCF quality metrics for four conditions: (a) without motion, (b) left-right finger motion, (c) up-down finger motion, and (d) round-up finger motion, to evaluate our proposed PR algorithm. We also show the SpO2 percentage of our proposed device and reference device from Table 2, Table 3, Table 4 and Table 5. From Table 2, we can see that we achieved a maximum error of 5.6% in MAPE, 3.94 bpm in MAE, a minimum of 0.96 in RCF, and maximum 2.24% SpO2 variation to the reference SpO2. By analyzing Table 2, we can say that the average MAPE (%), MAE (bpm), RCF, and SpO2 (%) accuracy (%) of the 15 subjects is 2.86, 2.08, 0.97, and 98.96, respectively. Thus, without finger motion, our proposed PO device can make approximately a maximum of 4 bpm error and 2% SpO2 error. From Table 3, we found that the maximum MAPE and MAE are 8.85% and 8.94 bpm, respectively, and the minimum RCF is 0.92 for left-right finger motion and the maximum SpO2 (%) error is 5.88. By analyzing Table 3, we can say that the average MAPE (%), MAE (bpm), RCF, and SpO2 (%) accuracy (%) of the 15 subjects is 4.95, 4.16, 0.95, and 96.96, respectively. So, for finger left-right motion, the approximate PR and SpO2 error are 9 bpm and 6%, respectively. For up-down finger motion, the maximum MAPE and MAE are 8.03% and 6.79 bpm, respectively; the minimum RCF is 0.93; and the maximum SpO2 error is 7.78%, as shown in Table 4. By analyzing Table 4, we can find the average MAPE (%), MAE (bpm), RCF, and SpO2 (%) accuracy (%) of the 15 subjects is 4.06, 3.18, 0.96, and 2.76, respectively. So, for up-down finger motion, the approximate maximum PR and SpO2 error is 7 bpm and 8%, respectively. From Table 5, the maximum MAPE and MAE are 8.47% and 7.16 bpm, respectively; the minimum RCF is 0.92; and the maximum SpO2 error is 8.11%. From Table 5, we can measure that the average MAPE (%), MAE (bpm), RCF, and SpO2 (%) accuracy (%) of the 15 subjects is 4.46, 3.64, 0.96, and 96.52, respectively. So, for round-up finger motion, the approximate maximum bpm and SpO2 error is 7 bpm and 8%, respectively. Finally, from the analysis of Table 2, Table 3, Table 4 and Table 5, we can say that the maximum PR error range and SpO2 error range with and without finger motion are from 4 to 9 bpm and 2% to 8%, respectively.
To the best of our knowledge, no wearable device can serve as a wearable, data acquisition, and hand-held PO device. There are so many commercial devices and they are the state-of-the-art wearable devices. We select one of the devices called the Fingertip Pulse Oximeter (FPO). We record the FPO and our proposed device performance for six subjects with and without motion conditions. The age of the subjects is from 35 to 55 years old and they are healthy human beings. The subjects comprised three males and three females. Here, Table 6 shows the performance comparison between our proposed device and the FPO device.
From Table 6, we can see that the FPO device achieves reasonable results in terms of MAPE, MAE, RCF, and SpO2 accuracy for the “without motion” condition. In almost every condition and subject, our proposed device achieved superior performance compared with the commercial FPO device. Therefore, we can infer that the wearable commercial device can work reasonably better in the “without motion” condition, but not in the finger motion condition, where our device performs better in both conditions, with and without finger motion.

7. Possible Application of Our Proposed Wearable PO Device

The goal of our work is to develop a wearable pulse oximeter device that can be used as a wearable, data acquisition, and portable hand-held PO device. For wearable purposes, it can be used in the following locations of the human body using fabric, as shown in Figure 27.
Figure 28a shows a possible application as a wearable finger PO device. Our proposed circuit can be used in hand-gloves using fabric. In winter season-oriented countries, people generally wear hand gloves during walking or for any form of light exercise. By implementing our proposed reflectance type PO circuit to the fabric of hand-gloves like Figure 28a, the hand-gloves will be turned into a wearable finger PO device. In Figure 28a, every unit is shown and the orange dotted line represents a flexible wire connection between each unit. As a portable hand-held device, it can also be used like in Figure 28b. By placing a finger on the sensor and connecting the device with smartphone through Bluetooth communication, the user can easily monitor PR and SpO2 in the smartphone display. The user can use it for further research purposes as the PPG signal acquisition device, as shown in Figure 28c.

8. Conclusions

The implementation of the analog filter circuit illustrates the possibility of attaining clean PPG signals from our proposed electronic circuit. Researchers may use this proposed PO device for the acquisition of clean PPG signals. In our experiment, we considered three types of finger motion to develop our PR measurement algorithm for finger motion. Our proposed PR measuring algorithm can detect the false PPG signal with and without the motion artifact and can also successfully measure the PR. We also show the calibrated curve and equation for the SpO2 measured using our proposed wearable PO device. The main contribution of this work is the combination of the hardware electronic circuit and the PR-SpO2 measurement algorithm with and without finger motions. From the evaluation of our proposed PR and SpO2 algorithm, shown from Table 2, Table 3, Table 4 and Table 5, and the superior performance of our proposed device over a commercial FPO device, shown in Table 6, we can claim that our proposed wearable PO device can be used as the daily health monitoring device. By analyzing from Table 2, Table 3, Table 4 and Table 5, however, we found that our proposed PO device also achieves the minimum SpO2 accuracy 97.67%, 94%, 92.06%, and 91.63% for no finger motion, left-right finger motion, up-down finger motion, and round-up finger motion, respectively. In the case of finger motion, the lowest SpO2 accuracy (91.63%) leads us to not use our proposed PO device as a clinical device. Therefore, in the future, we will also consider further different types of motion (e.g., motion of arms and legs) and will consider ICU patients for evaluating our device to claim our proposed device as the clinical device. We will also consider realistic types of motions that occur during extreme exercise (e.g., tapping, jumping, running, walking, and typing) for our proposed wearable PO device to analyze the effects of motion artifacts on the PPG signal, and we will also propose an algorithm to effectively measure the PR and SpO2 under these motions.

Author Contributions

Conceptualization, P.P.B. and S.H.; methodology, P.P.B. and S.H.; formal analysis, K.-D.K.; data curation, P.P.B.; writing—original draft preparation, P.P.B.; writing—review and editing, T.-H.K. and K.-D.K.; visualization, H.K. and P.P.B; supervision, K.-D.K.; project administration, T.-H.K. All authors have read and agreed to the published version of the manuscript.

Funding

This research was supported by Basic Science Research Program through the National Research Foundation (NRF) of Korea funded by the Ministry of Education (NRF-2019R1F1A1062317) and was also supported by the National Research Foundation of Korea Grant funded by the Ministry of Science, ICT, and Future Planning [2015R1A5A7037615].

Conflicts of Interest

The authors declare no conflict of interest. The funders had no role in the design of the study; in the collection, analyses, or interpretation of data; in the writing of the manuscript; or in the decision to publish the results.

References

  1. Winkley, J.; Jiang, P.; Jiang, W. Verity: An ambient assisted living platform. IEEE Trans. Consum. Electron. 2012, 58, 364–373. [Google Scholar] [CrossRef]
  2. Mukhopadhyay, S.C. Wearable sensors for human activity monitoring: A review. IEEE Sens. J. 2015, 15, 1321–1330. [Google Scholar] [CrossRef]
  3. Elgendi, M. On the analysis of fingertip photoplethysmogram signals. Curr. Cardiol. Rev. 2012, 8, 14–25. [Google Scholar] [CrossRef] [PubMed]
  4. Shelley, K.H. Photoplethysmography: Beyond the calculation of arterial oxygen saturation and heart rate. Anesth. Analg. 2007, 105 (Suppl. S6), S31–S36. [Google Scholar] [CrossRef] [PubMed] [Green Version]
  5. Alnaeb, M.E.; Alobaid, N.; Seifalian, A.M.; Mikhailidis, D.P.; Hamilton, G. Optical techniques in the assessment of peripheral arterial disease. Curr. Vasc. Pharmacol. 2007, 5, 53–59. [Google Scholar] [CrossRef] [PubMed]
  6. Allen, J. Photoplethysmography and its application in clinical physiological measurement. Physiol. Meas. 2007, 28, R1–R39. [Google Scholar] [CrossRef] [PubMed] [Green Version]
  7. Sommer, J.R.; Farley, R.T.; Graham, K.R.; Yang, Y.; Reynolds, J.R.; Xue, J.; Schanze, K.S. Efficient near-infrared polymer and organic light-emitting diodes based on electrophosphorescence from (tetraphenyltetranaphtho[2,3]porphyrin)platinum(II). ACS Appl. Mater. Interfaces 2009, 1, 274–278. [Google Scholar] [CrossRef] [PubMed]
  8. Hossain, S.; Kwon, T.-H.; Kim, K.-D. Comparison of different wavelengths for estimating SpO2 using beer-lambert law and photon diffusion in PPG. In Proceedings of the 10th International Conference on Information and Communication Technology Convergence (ICTC 2019), Jeju Island, Korea, 16–18 October 2019; pp. 1377–1379. [Google Scholar]
  9. Lochner, C.M.; Khan, Y.; Pierre, A.; Arias, A.C. All-organic optoelectronic sensor for pulse oximetry. Nat. Commun. 2014, 5, 5745. [Google Scholar] [CrossRef] [Green Version]
  10. Khan, Y.; Lochner, C.M.; Pierre, A.; Arias, A.C. System design for organic pulse oximeter. In Proceedings of the 6th International Workshop on Advances in Sensors and Interfaces (IWASI), Gallipoli, Italy, 18–19 June 2015; pp. 83–86. [Google Scholar] [CrossRef]
  11. Maeda, Y.; Sekine, M.; Tamura, T.; Moriya, A.; Suzuki, T.; Kameyama, K. Comparison of reflected green light and infrared photoplethysmography. In Proceedings of the IEEE Engineering in Medicine and Biology Society. Annual Conference, Vancouver, BC, Canada, 20–25 August 2008; pp. 2270–2272. [Google Scholar] [CrossRef]
  12. Chatterjee, S.; Abay, T.Y.; Phillips, J.P.; Kyriacou, P.A. Investigating optical path and differential pathlength factor in reflectance photoplethysmography for the assessment of perfusion. J. Biomed. Opt. 2018, 23, 075005. [Google Scholar] [CrossRef] [Green Version]
  13. Dremin, V.; Zherebtsov, E.; Bykov, A.; Popov, A.; Doronin, A.; Meglinski, I. Influence of blood pulsation on diagnostic volume in pulse oximetry and photoplethysmography measurements. Appl. Opt. 2019, 58, 9398–9405. [Google Scholar] [CrossRef]
  14. Alharbi, S.; Hu, S.; Mulvaney, D.; Barrett, L.; Yan, L.; Blanos, P.; Elsahar, Y.; Adema, S. Oxygen saturation measurements from green and orange illuminations of multi-wavelength optoelectronic patch sensors. Sensors 2018, 19, 118. [Google Scholar] [CrossRef] [PubMed] [Green Version]
  15. Chacon, P.J.; Pu, L.; da Costa, T.H.; Shin, Y.-H.; Ghomian, T.; Shamkhalichenar, H.; Wu, H.-C.; Irving, B.A.; Choi, J.-W. A wearable pulse oximeter with wireless communication and motion artifact tailoring for continuous use. IEEE Trans. Bio-Med. Eng. 2019, 66, 1505–1513. [Google Scholar] [CrossRef] [PubMed]
  16. Lee, H.; Ko, H.; Lee, J. Reflectance pulse oximetry: Practical issues and limitations. ICT Express 2016, 2, 195–198. [Google Scholar] [CrossRef] [Green Version]
  17. Schouweiler, A.; Miller, J.; Mottram, C.; Hynes, K. Comparison of Reflectance Pulse Oximetry and Finger Pulse Oximetry to Blood Co-Oximetry. Respir. Care 2018, 63, 3010837. [Google Scholar]
  18. Wax, D.B.; Rubin, P.; Neustein, S. A comparison of transmittance and reflectance pulse oximetry during vascular surgery. Anesth. Analg. 2009, 109, 1847–1849. [Google Scholar] [CrossRef] [PubMed]
  19. Pang, G.; Ma, C. A neo-reflective wrist pulse oximeter. IEEE Access 2014, 2, 1562–1567. [Google Scholar] [CrossRef] [Green Version]
  20. Mohan, P.M.; Nagarajan, V.; Vignesh, J.C. Spot and continuous monitoring of heart rate by combining time and frequency domain analysis of photoplethysmographic signals at rest conditions. IET Signal Process. 2017, 11, 1076–1082. [Google Scholar] [CrossRef]
  21. Oliver, N.; Flores-Mangas, F. HealthGear: A real-time wearable system for monitoring and analyzing physiological signals. In Proceedings of the International Workshop on Wearable and Implantable Body Sensor Networks (BSN’06), Cambridge, MA, USA, 3–5 April 2006. [Google Scholar] [CrossRef] [Green Version]
  22. Clarke, G.W.J.; Chan, A.D.C.; Adler, A. Quantifying blood-oxygen saturation measurement error in motion contaminated pulse oximetry signals. In Proceedings of the World Congress on Medical Physics and Biomedical Engineering, Toronto, ON, Canada, 7–12 June 2015; pp. 986–989. [Google Scholar] [CrossRef]
  23. Joseph, G.; Joseph, A.; Titus, G.; Thomas, R.M.; Jose, D. Photoplethysmogram (PPG) signal analysis and wavelet de-noising. In Proceedings of the Annual International Conference on Emerging Research Areas: Magnetics, Machines and Drives (AICERA/ICMMD), Kottayam, India, 24–26 July 2014; pp. 1–5. [Google Scholar] [CrossRef]
  24. Ram, M.R.; Madhav, K.V.; Krishna, E.H.; Komalla, N.R.; Reddy, K.A. A novel approach for motion artifact reduction in PPG signals based on AS-LMS adaptive filter. IEEE Trans. Instrum. Meas. 2012, 61, 1445–1457. [Google Scholar] [CrossRef]
  25. Li, K.; Warren, S. A wireless reflectance pulse oximeter with digital baseline control for unfiltered photoplethysmograms. IEEE Trans. Biomed. Circuits Syst. 2012, 6, 269–278. [Google Scholar] [CrossRef]
  26. Yang, D.; Cheng, Y.; Zhu, J.; Xue, D.; Abt, G.; Ye, H.; Peng, Y. A novel adaptive spectrum noise cancellation approach for enhancing heartbeat rate monitoring in a wearable device. IEEE Access 2019, 6, 8364–8375. [Google Scholar] [CrossRef]
  27. Fu, Y.; Liu, J. System design for wearable blood oxygen saturation and pulse measurement device. Procedia Manuf. 2015, 3, 1187–1194. [Google Scholar] [CrossRef] [Green Version]
  28. Ali, M.M.; Haxha, S.; Alam, M.M.; Nwibor, C.; Sakel, M. Design of Internet of Things (IoT) and android based low cost health monitoring embedded system wearable sensor for measuring SpO2, heart rate and body temperature simultaneously. Wirel. Pers. Commun. 2020, 111, 2449–2463. [Google Scholar] [CrossRef]
  29. Yousefi, R.; Nourani, M.; Ostadabbas, S.; Panahi, I. A motion-tolerant adaptive algorithm for wearable photoplethysmographic biosensors. IEEE J. Biomed. Health Inform. 2014, 18, 670–681. [Google Scholar] [CrossRef] [PubMed]
  30. Sangeeta, B.; Laxmi, S. A real time analysis of PPG signal for measurement of SpO2 and pulse rate. Int. J. Comput. Appl. 2011, 36, 45–50. [Google Scholar]
  31. Schiller Argus OXM Plus. Available online: https://www.schiller.ch/bn/en/product/argus-oxm-plus (accessed on 6 April 2020).
Figure 1. AC and DC components of a photoplethysmography (PPG) waveform.
Electronics 09 01905 g001
Figure 2. A commercial Masimo MightySat Rx Fingertip pulse oximeter (PO).
Electronics 09 01905 g002
Figure 3. PO types: (a) transmission and (b) reflection. LED, light-emitting diode; PD, photodetector.
Electronics 09 01905 g003
Figure 4. PO device development procedures. ADC, analog-to-digital converter; MCU, microcontroller unit.
Electronics 09 01905 g004
Figure 5. Proposed electronic circuit blocked diagram.
Electronics 09 01905 g005
Figure 6. Switching states of red and green LEDs at 100 Hz.
Electronics 09 01905 g006
Figure 7. Complete schematic diagram of the proposed electronic circuit.
Electronics 09 01905 g007
Figure 8. Schematic diagram of the charging module.
Electronics 09 01905 g008
Figure 9. Block diagram for estimating pulse rate (PR) and SpO2.
Electronics 09 01905 g009
Figure 10. Flow chart of PR measurement with false PPG signal detection.
Electronics 09 01905 g010
Figure 11. Absorptivities of oxy-hemoglobin (HbO2) and deoxyhemoglobin (Hb) [10].
Electronics 09 01905 g011
Figure 12. Block diagram of SpO2 measurement. RMS, root mean square.
Electronics 09 01905 g012
Figure 13. SpO2 calibration curve for our proposed wearable PO device.
Electronics 09 01905 g013
Figure 14. Reference SpO2 variation over 330 s while holding a breath for 2 min (from point A to point B).
Electronics 09 01905 g014
Figure 15. Three kinds of finger motion: (a) up-down, (b) left-right, and (c) round-up.
Electronics 09 01905 g015
Figure 16. Window size vs. accuracy curve.
Electronics 09 01905 g016
Figure 17. Hardware implementation of the proposed electronic circuit: (a) top view and (b) bottom view of the PO device. TFT, thin-film-transistor; LCD, liquid crystal display.
Electronics 09 01905 g017
Figure 18. Implementation of the wearable version of the PO system. PCB, printed circuit board. (a) Serial Converter (b) PCB.
Electronics 09 01905 g018
Figure 19. Smartphone app for the display of PR and SpO2. (a) Bluetooth off (b) Bluetooth on
Electronics 09 01905 g019
Figure 20. (a) Finger location to randomly attach the sensor to acquire PPG signals with and without motion for evaluation purposes, and (b) affirmed finger-sensor attachment in finger probe.
Electronics 09 01905 g020
Figure 21. Schiller Argus OXM plus reference device.
Electronics 09 01905 g021
Figure 22. Output of red and green PPG signals and the peak detection of the PPG signals: (a) output of the proposed electronic circuit, (b) the moving average output (with a window size of 15), (c) differentiation of the moving average output, and (d) the moving average of the differentiation (with a window size of 20).
Electronics 09 01905 g022
Figure 23. (a) Output of red and green PPG signals with the up-down finger motion, (b) peak detection of the PPG signals.
Electronics 09 01905 g023
Figure 24. (a) Output of red and green PPG signals with the left-right finger motion, (b) peak detection of the PPG signals.
Electronics 09 01905 g024
Figure 25. (a) Output of red and green PPG signals with the round-up finger motion, (b) peak detection of the PPG signals.
Electronics 09 01905 g025
Figure 26. Proposed wearable PO device performance for different signal-to-noise ratio (SNR) values. MAE, mean absolute error; MAPE, mean absolute percentage error; RCF, reference closeness factor.
Electronics 09 01905 g026
Figure 27. Possible body locations for the proposed wearable PO device.
Electronics 09 01905 g027
Figure 28. Applications of our proposed wearable PO device: (a) possible idea of wearable finger PO device, (b) handheld type application of our proposed wearable PO device, and (c) data acquisition type application of our proposed wearable PO device.
Electronics 09 01905 g028aElectronics 09 01905 g028b
Table 1. List of the components to develop the pulse oximeter (PO) device. LED, light-emitting diode; PD, photodetector; MCU, microcontroller unit; TFT, thin-film-transistor.
Serial No.Component NameCharacteristicsManufacturer
01Red LED, 5730 SMD LEDOperating voltage: 1.9–2.1 V, wavelength: 620–625 nm, maximum power dissipation: 0.5 W,
light intensity: 14–16 lumen.
Cam Farm
02Green LED, 5730 SMD LEDOperating voltage: 3.1–3.2 V, wavelength: 520–525 nm, maximum power dissipation: 0.5 W, light intensity: 20–25 lumen.Cam Farm
03PD, VEMD5510 COperating maximum reverse voltage: 20 V, dark current: 0.2–10 nA, maximum power dissipation: 215 mW, peak sensitivity: 550 nm, spectral bandwidth: 440–700 nm.Vishay Semiconductor Opto Division
04Op-amp, AD623 ANOperating voltage: 2.7–12 V, power dissipation: 650 mW, slew rate: 0.3 V/µs, gain: 1–1000.Analog Devices Inc.
05Optocoupler, ILQ1, quad channelMaximum forward current: 60 mA, LED forward voltage: 1.25–1.65 V, collector-emitter saturation voltage: 0.25–0.4 V, current transfer ratio: 20–300%, power dissipation: 250 mW, propagation delay high to low: 0.7 µs, propagation delay low to high: 1.4 µs.Vishay Semiconductor Opto Division
06Battery charging IC, TP4056Operating voltage: 4–8 V, regulated output voltage: 4.137–4.263 V, charging current up to 1000 mA, charge threshold 2.9 V.NanJing Top Power ASIC Corp.
07MCU, ESP-WROOM-32Two CPU cores, CPU clock frequency: 80–240 MHz, operating voltage: 2.7–3.6 V, operating average current: 80 mA, Bluetooth protocols: v4.2, and Wi-Fi protocols: 802.11 n up to 150 Mbps.Espressif Systems
08Resistors55 Ω, 82 Ω, 1 KΩ, 100 KΩ, 330 KΩ.Cheil Electronics
09Capacitors3.3 µF (electrolytic), 0.1 µF (ceramic).SAMWON
10Lithium Polymer Battery, TW451635Voltage supply: 3.7 V, capacity: 200 mAh, power rating: 0.74 W.The Han Co., Ltd.
11Adafruit 1.3 inch TFT display, ST7789, 240 × 240Operating voltage: 3.3–5 V, 16-bit full-color pixels, pixel density: 260 ppi.ADAFRUIT
Table 2. Performance of our proposed wearable pulse oximeter device without motion condition. MAE, mean absolute error; MAPE, mean absolute percentage error; RCF, reference closeness factor.
SubjectMAPE
(%)
MAE
(bpm)
RCFSpO2 (%)
(Our)
SpO2 (%)
(Reference)
15.603.940.9697.3399
24.143.610.9699.2598
34.163.120.9797.6397
42.802.130.9795.2796
53.873.060.9696.0096
63.152.180.9796.5995
70.270.220.9995.9797
82.441.930.9898.1397
91.701.360.9898.2496
101.751.140.9899.0099
113.222.140.9798.0998
120.020.010.9999.0397
133.572.770.9794.8795
142.181.190.9896.1194
153.372.480.9797.3497
Table 3. Performance of our proposed wearable pulse oximeter device for the left-right finger motion condition.
SubjectMAPE
(%)
MAE
(bpm)
RCFSpO2 (%)
(Our)
SpO2 (%)
(Reference)
17.896.460.9592.1298
28.857.820.9291.5597
36.785.590.9494.1899
44.133.220.9698.5796
51.230.960.9995.8996
67.436.160.9392.4496
73.362.650.9797.5499
81.821.670.9898.8898
97.646.800.9393.1298
105.853.690.9696.1999
112.962.180.9796.4598
120.560.400.9994.9697
137.138.940.9492.5997
143.311.880.9895.4597
155.394.070.9694.5597
Table 4. Performance of our proposed wearable pulse oximeter device for the up-down finger motion condition.
SubjectMAPE
(%)
MAE
(bpm)
RCFSpO2 (%)
(Our)
SpO2 (%)
(Reference)
17.896.460.9592.1298
28.857.820.9291.5597
36.785.590.9494.1899
44.133.220.9698.5796
51.230.960.9995.8996
67.436.160.9392.4496
73.362.650.9797.5499
81.821.670.9898.8898
97.646.800.9393.1298
105.853.690.9696.1999
112.962.180.9796.4598
120.560.400.9994.9697
137.138.940.9492.5997
143.311.880.9895.4597
155.394.070.9694.5597
Table 5. Performance of our proposed wearable pulse oximeter device for the round-up finger motion condition.
SubjectMAPE
(%)
MAE
(bpm)
RCFSpO2 (%)
(Our)
SpO2 (%)
(Reference)
17.136.220.9290.0697
25.615.450.9392.7996
35.914.420.9695.6399
40.100.070.9995.3995
50.490.360.9996.1196
62.161.530.9894.8596
76.415.190.9990.3196
87.677.160.9689.7297
98.476.850.9688.8997
101.931.310.9898.9399
114.243.100.9696.5098
121.531.120.9898.8498
135.864.560.9592.4196
142.991.780.9896.4198
156.515.530.9790.2697
Table 6. Performance comparison between our proposed device and the Fingertip Pulse Oximeter (FPO) device.
ConditionSubjectMAPE (%)MAE (bpm)RCFSpO2 Accuracy (%)
OurFPOOurFPOOurFPOOurFPO
Without motion13.603.452.732.390.970.9899.5199.89
26.285.774.964.330.950.9799.6099.12
33.263.442.252.390.970.9698.7398.86
40.391.270.311.350.990.9896.9095.73
52.443.131.922.660.980.9796.9096.22
62.201.771.761.340.980.9995.8397.41
Left–right finger motion19.639.225.314.90.920.9495.5596.39
23.278.362.558.110.970.9396.4491.32
36.738.124.407.220.950.9296.1792.57
44.129.673.259.130.960.9198.9894.73
58.7810.157.209.680.930.997.9594.19
67.2811.375.6010.550.940.8798.0493.89
Up-down finger motion14.885.623.564.780.960.9495.8391.73
21.952.321.411.980.980.9696.7790.56
33.818.772.707.970.970.9496.2593.78
47.5910.115.528.910.940.8997.9591.33
53.599.652.848.740.970.9195.8388.48
68.9413.557.6911.290.920.8498.3789.77
Round-up finger motion10.335.480.254.670.990.9394.7387.71
29.6113.127.2112.420.920.8896.9093.05
35.4910.163.908.780.960.995.8389.09
48.8111.587.0910.370.920.8897.5791.88
58.6716.628.1615.220.910.8596.9084.43
67.9819.116.7018.610.940.8195.7585.67
Publisher’s Note: MDPI stays neutral with regard to jurisdictional claims in published maps and institutional affiliations.

