1. Introduction
The adoption of digital modulation and advanced video compression techniques for terrestrial TV broadcasting, replacing analog broadcasting, resulted in considerable improvements in the efficiency of frequency spectrum utilization, making it possible to broadcast several TV programs in multiplex in a single 8 MHz TV channel. This transition set a part of the TV spectrum free for utilization for other applications, and thus, the wireless communications industry saw this transition as an opportunity to use the released frequency spectrum for mobile communication services. In turn, that led to European Member States being urged by the European Parliament to make sure that the frequency spectrum is efficiently utilized [
1]. The European Commission (EC) investigated the allocation of the 790–862 MHz frequency band (the so-called 800 MHz band and part of the former UHF TV band) to Long Term Evolution (LTE-800) wireless services as a “digital dividend”, thus redistributing the benefits of digital TV migration [
2]. The EC decision described in [
3] suggests a harmonized plan that was adopted by European states (ITU Region 1) for LTE network deployment in the 800 MHz band. This band is particularly important for the mobile communications industry because of its relatively low building material penetration radio losses and the fact that most of the time mobile phones are used indoors. According to this plan, the spectrum of 790–862 MHz involves the use of chunks of 30 MHz uplink and 30 MHz downlink transmissions in the FDD (Frequency Division Duplex). Moreover, the uplink spectrum is separated from the downlink spectrum using an 11 MHz-wide frequency gap. On the other hand, DTT (Digital Terrestrial Television) is allocated the 470 MHz to 790 MHz band and that just leaves a 1 MHz-wide frequency gap between DTT broadcasting and LTE-800 mobile communications. A useful study performed in [
4] investigates the effects of interference on the degradation of the QoS (quality-of-service) in the TV broadcasting band due to its vicinity with the LTE-800 band. Following the clearance of the 800 MHz band, the requirement of allocating the 700 MHz band (694–790 MHz) was stated in a worldwide resolution [
5], which was later approved in the 2012 World Radiocommunication Conference (WRC-12) of ITU-R [
6]. Thereafter, the 2015 World Radiocommunication Conference (WRC-15) [
7] of ITU-R states the provisions used to deploy the 700 MHz band in ITU Region 1. Another significant study is presented in [
8] and investigates the interference effects due to coexistence of the DTT broadcasting service and LTE service in both the 700 MHz and 800 MHz bands.
This paper is an extended version of a paper submitted to the IEEE NEMO-2019 conference [
9]. Moreover, the proposed antenna in this paper has been further optimized to achieve higher and flatter realized gain (RG) along with a higher FBR (front-to-back ratio) throughout the DTT reception passband.
2. Conventional LPDA Geometry
LPDAs (Log Periodic Dipole Arrays) or simply log-periodic antennas are frequently used for TV reception since the 1960s because of their excellent wideband properties and high directivity despite the fact that their peak gain is generally lower than that of similar size Yagi-Uda antennas [
10]. Furthermore, LPDAs provide flat gain throughout their operating band and are thus considered as the best solution for applications where broadband behavior and gain flatness are important [
11,
12]. Compared to Yagi-Uda antennas, which are generally narrowband, LPDAs provide better gain flatness but a relatively lower RG. The performance of these antennas differs also because of their different feeding pattern [
13]. Conventional LPDAs are usually designed using calculation guidelines proposed by Carrel in [
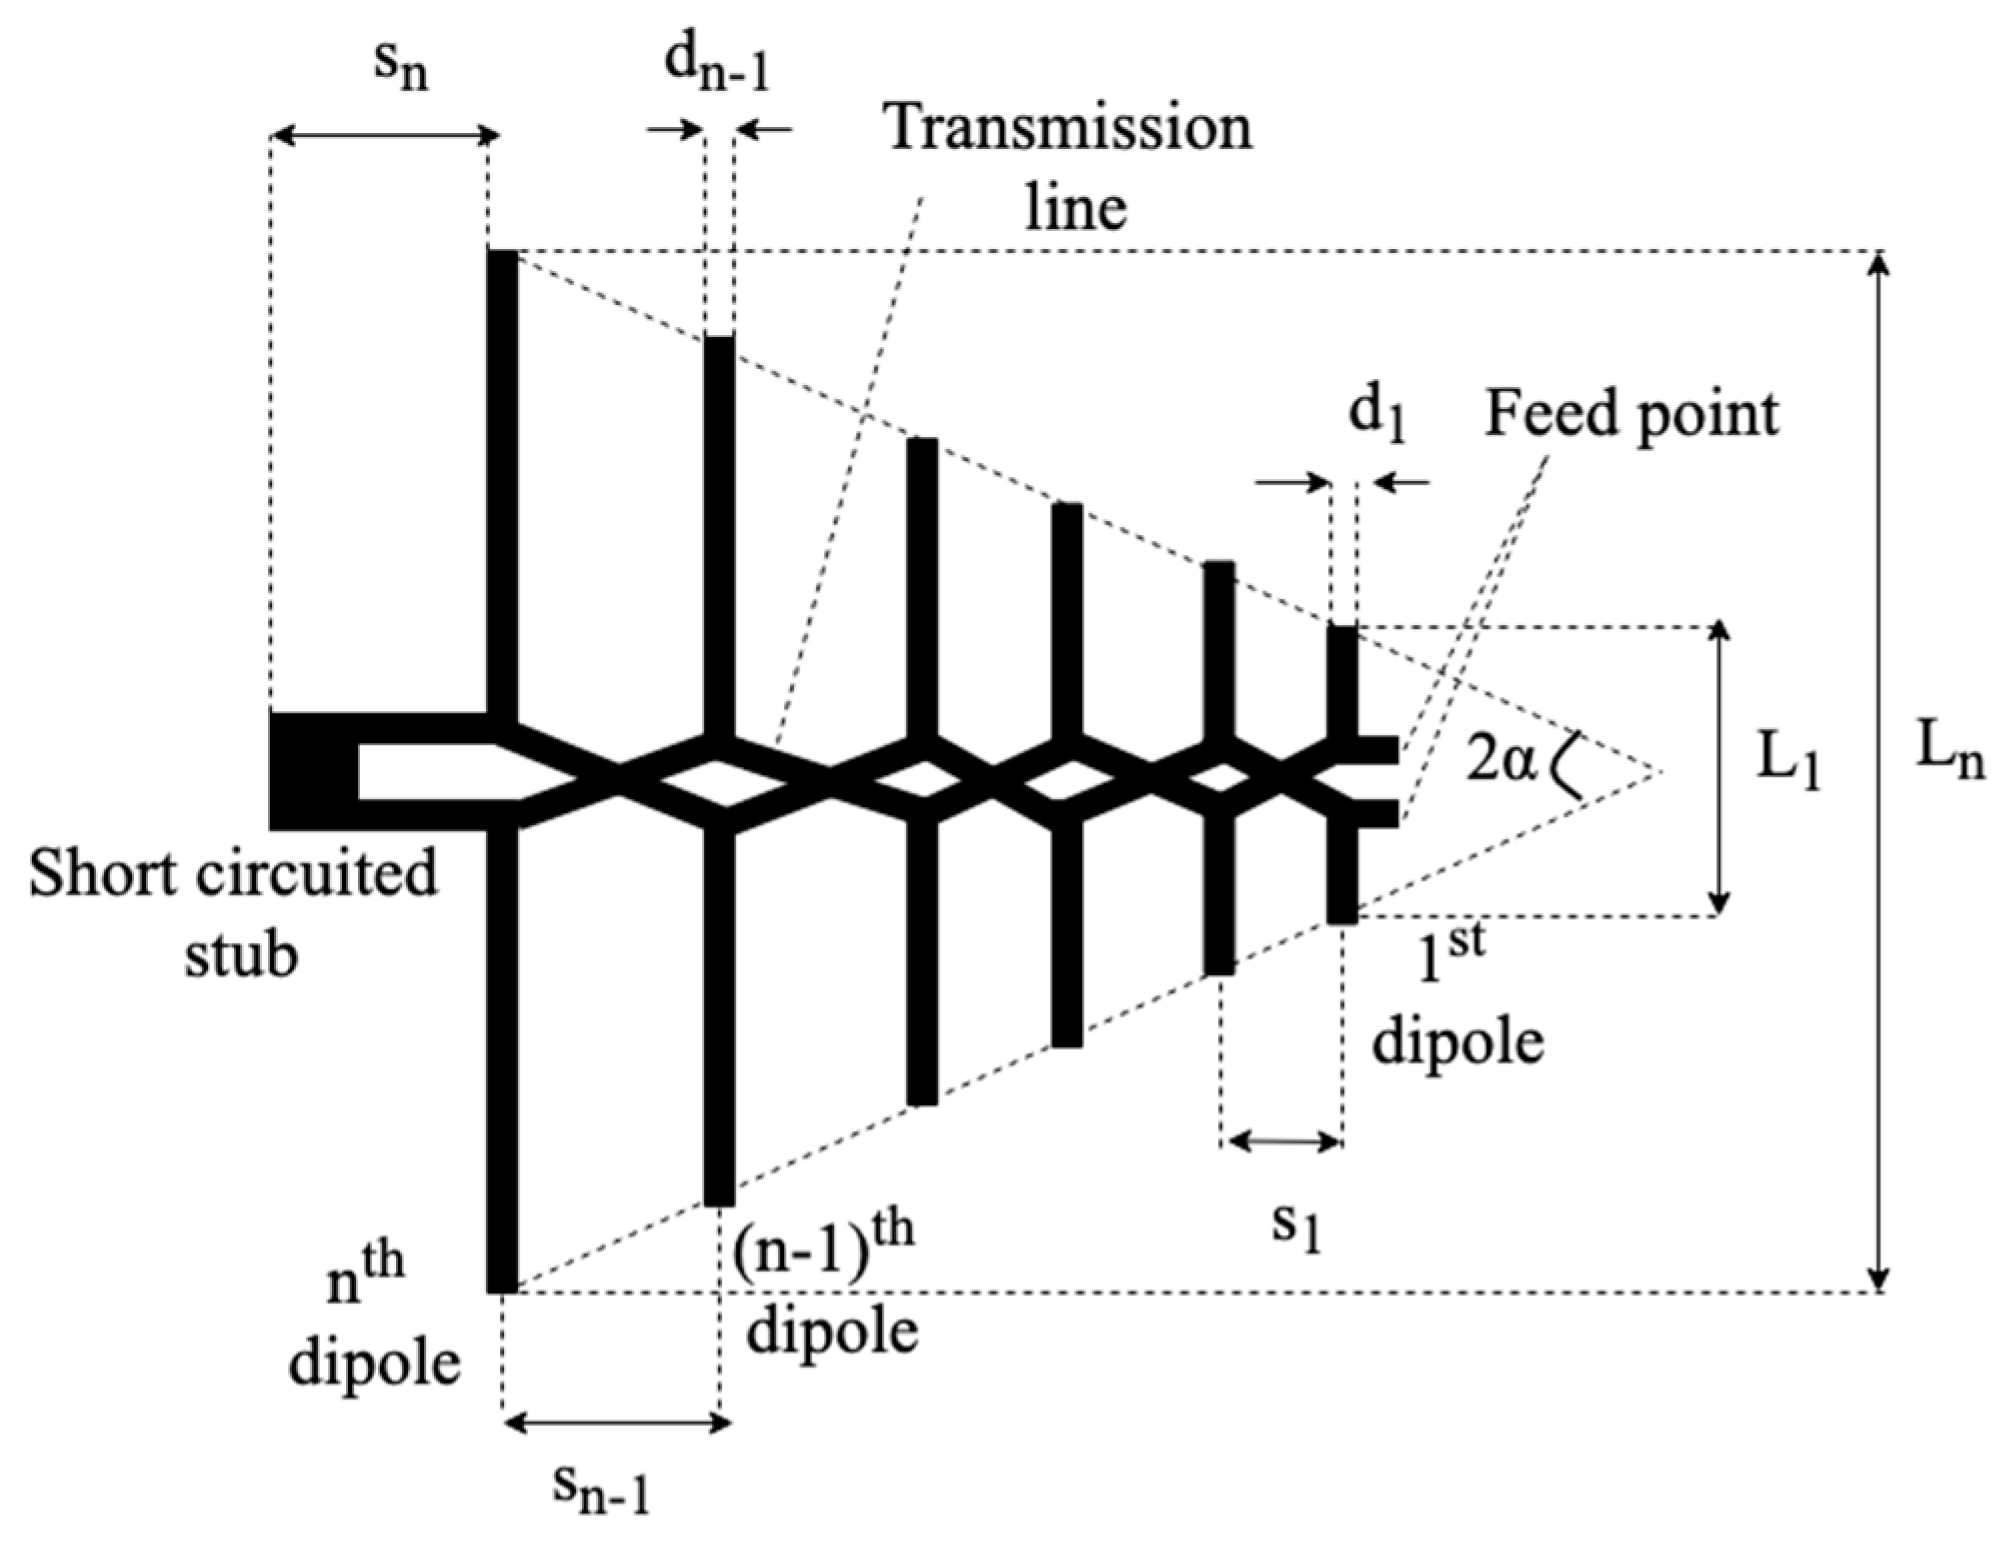
14]. The basic LPDA geometry is shown in
Figure 1.
A conventional LPDA is constructed using two booms arranged parallel to each other and separated by air using insulating or metallic fasteners at the rear end, as well as the front end, and sometimes in the middle of the antenna (see Figure 3). The two booms are forming a two-line air-dielectric transmission line, which feeds the antenna dipoles. The rear end fastener is usually metallic and acts also as a short-circuit stub. The spacing between the two conducting booms along with their cross-section size and shape controls the transmission line characteristic impedance, and therefore, it is important for matching of the antenna to a feeder cable [
15]. In most cases, the antenna is matched to a feeding cable impedance of 50 Ohms in general or 75 Ohms for TV reception. The dipoles are fixed to the booms in such a way that the length of the dipoles decreases as we move from the rear end of the antenna toward the front end. In addition, half-dipoles are alternatively connected to the upper and lower booms, and two half-dipoles together form a complete dipole. The phase inversion between the feeds of the two consecutive dipoles is achieved because of the dipoles being arranged in a criss-cross fashion. This phase inversion ensures that the antenna always radiates as an end-fire dipole antenna array [
16]. Contrary to Yagi-Uda antennas, where there is only one dipole that is active and all the other dipoles are passive, all the dipoles in an LPDA are fed by the conducting booms transmission line, and therefore all the dipoles are active. Depending on dipole length and thickness, each dipole of the LPDA resonates around a specific frequency. Antenna gain and/or bandwidth significantly increase with the total number of dipoles used [
17]. The feeding is provided at the front end of the booms (left end of the booms in Figure 3) using a coaxial cable that is usually passing though one of the booms that are hollow.
Carrel [
14] introduced design equations for the calculation of the dimensions in the case of the conventional LPDA geometry. The apex angle is the half angle in which all the dipoles are confined, and it is mathematically expressed as
In the above expression, the parameter
τ is called the “scaling factor” and is the ratio of the lengths or diameters of two consecutive dipoles as shown by the following expression:
where
Ln and
dn are, respectively, the length and the diameter of the
nth dipole. In addition, the parameter
σ shown in (1) is called the “spacing factor” and is defined as:
where
sn is the spacing between the
nth dipole and its consecutive (
n + 1)th dipole. The overall physical dimensions of the antenna significantly depend on the above two factors (
τ and
σ). Sometimes, a fixed diameter is used for the dipoles in order to simplify the antenna design and reduce costs.
3. Proposed LPDA Geometry
The proposed LPDA geometry can be used to mitigate the interference caused by the LTE-800 and GSM-900 mobile communications band transmissions to the TV broadcasting service band. This solution is actually a UHF TV reception log-periodic antenna composed, in this example, of 10 dipoles that can act as a filter and reject frequencies in the 800 MHz and 900 MHz bands. One of the already existing solutions that is most widely used to mitigate interference is the use of a conventional TV reception antenna along with an external bandstop filter that rejects the undesired 800 MHz and 900 MHz bands. However, not enough research work has been performed on TV reception antennas without using external bandstop filters. In [
18], an LPDA is proposed that is optimized by a variant of the PSO (Particle Swarm Optimization) method, i.e., by PSOvm (PSO with velocity mutation). This antenna design is capable of rejecting signals, which reside in the 800 MHz band and are directed toward the antenna axis; however, relatively low VSWR values in the 800 MHz band still raise a concern of receiving interference signals from other directions. In the above-mentioned LPDA design, the first dipole is longer in length compared to its adjacent dipoles (i.e., 2nd and 3rd dipole) and therefore acts as reflector for signals that reside in the 800 MHz band.
An early effort was made in [
19] to design an LPDA that rejects the 800 MHz band without using any external filters and avoids LTE-800 signals from every direction of arrival. As a starting point, Carrel’s design procedure [
14] was used to calculate the antenna dimensions. Then, the shorter dipole lengths and the distances between these dipoles were optimized using the TRF optimization algorithm in CST (Trusted Region Framework) in order to obtain rejection in the 800 MHz band. This type of optimization achieves LTE-800 rejection by finding appropriate values for the lengths of some (two or three) of the shorter dipoles and for the distances between them.
Extending the LPDA design presented in [
19], an improved version of this LPDA [
9,
20] is proposed in this paper. Instead of optimizing the whole antenna geometry, which would lead to an increased computational burden and doubtful convergence, this design is the result of optimizing the lengths of the front three dipoles only as well as the distances between these dipoles. The rest of the antenna is identical to the conventional design. In comparison to the conventional LPDA design (Carrel’s model) and the LPDA design given in [
19], the antenna presented in this paper achieves lower values of S11 (i.e., better matching) as well as higher and flatter RG and FBR throughout the passband, and it concurrently provides better rejection of the LTE-800 and GSM-900 services. The TRF algorithm, which is available in the CST environment, is employed to optimize the antenna according to the goals listed in
Table 1. The antenna optimization could also have been carried out using several other algorithms, such as IWO (Invasive Weed Optimization) in [
21,
22,
23,
24], PSO in [
25,
26], and PSOvm in [
27].
The reason that only the front three dipoles take part in the optimization is due to the fact that the front dipoles determine the behavior of an LPDA at higher frequencies. So, the lengths of the first three dipoles, i.e., L
1, L
2 and L
3, and their distances, i.e., s
0, s
1, s
2, and s
3, are the only parameters considered for optimization. The optimization settings for the TRF algorithm are taking into consideration that the optimal values of these parameters cannot deviate more than 30% from the respective values of a conventional LPDA design. Therefore, by multiplying the parameter values of this conventional design by 0.7 (30% less) or by 1.3 (30% more), we find the parameter boundaries, which are listed in
Table 2. These boundaries are used to restrict the search area of every parameter and thus help the optimization algorithm converge faster.
Table 1 shows the optimization goals that were used to optimize the LPDA parameters that are specified in
Table 2. This LPDA optimization resulted in a design, where the first four dipoles are arranged in an unusal pattern compared to the conventional LPDA design. The arrangement of first four dipoles were such that the 1st (front) dipole is longer than the 2nd dipole. Furthermore, the length of 2nd dipole is longer than the 3rd dipole, and the length of 4th dipole is longer than the 3rd dipole. The optimized antenna design follows the conventional LPDA design rule after the 4th dipole, whereafter, the lengths of dipole keep increasing until the last (rear) dipole.
The physical dimensions of the optimized LPDA design are 356 mm × 302.6 mm × 35 mm (length × width × thickness). In order to mantain the seperation gap between the two booms, a cuboidal fastener is embodied at the rear end of the antenna, which also provides an advantage of acting as a short-circuit stub. Additionally, this fastener is used to mechanically attach the antenna to any external support. The physical dimensions of this cuboidal fastener are 45 mm × 15 mm × 35 mm (length × width × thickness).
Figure 2 presents the top view of the conventional LPDA design as well as the optimized LPDA design. The side view of the LPDA design is shown in
Figure 3. The dimensions of the conventional LPDA design, the antenna design in [
19], and the proposed antenna design are shown in
Table 3. It also shows the list of parameters used for designing the CAD model of the antenna, where L
n is length of the
nth dipole,
sn is distance between the
nth and (
n + 1)th dipole, s0 is the distance between the start of the boom and the first dipole, L-boom is length of the boom, W-boom is width of the boom, H-boom is height of the boom, and gap is the distance between the two parallel booms. The cuboidal fastener for the antenna was designed using the dimensions specified for Stub_length, Stub_width, and Stub_height in
Table 3. An LPDA can be matched to the desired impedance by varying the seperation gap between the two conducting booms. The initial model that was designed using Carrel’s design equation had a matching impedance of 75 ohms, where the booms were 10 mm apart. However, in case of the proposed optimized LPDA, the separation gap between the booms was reduced from 10 mm to 5 mm in order to match the antenna to 50 ohms impedance. Thereafter, the proposed antenna was fabricated using alluminium components at the University of Huddersfield Manufacturing laboratory.
Figure 4 shows the fabricated model that follows the exact dimensions of the CST-optimized LPDA design.
4. LPDA Simulations and Measurements
Maxwell’s equations are often solved using FDTD (Finite-difference time-domain) variants in various electromagnetic simulation software packages. CST is one of the many electromagnetic simulation software packages that utilizes FDTD for simulations. This software offers a user-friendly interface that allows the user to model fully parametric CAD models. It has a wide range of solvers that can be used for simulations such as time domain solvers, frequency domain solvers, and an integral solver. However, any electromagnetic simulation requires an accurate meshing of the model. Another advantage of CST is that it provides a fast, automatic meshing with mesh refinement capabilities that adapt the quality of meshing depending on the model and uses Perfect Boundary Approximations (PBA) [
28]. For this paper, the Finite Integration Technique (FIT) included in CST was used to simulate the proposed antenna design. The model was hexahedrally meshed using 4,668,482 mesh cells, and the simulations were performed with −50 dB accuracy. Open boundary conditions with a reflection level of approximately 10
−4 were used to model this antenna in CST. A discrete 50 Ω port that connects the center points of both the booms at front end of the antenna is used to provide the excitation. The antenna was simulated in the frequency range from 450 MHz to 1000 MHz with 10 MHz resolution, because the frequency of interest involves UHF TV, LTE-800, and GSM-900 bands. The anechoic chamber at the National Physical Laboratory (NPL), UK was used to test and measure the fabricated LPDA design.
The surface current density of the optimized antenna was simulated in order to obtain the current distribution at four specific frequency points: (a) 470 MHz, (b) 630 MHz, (c) 790 MHz, and (d) 960 MHz as shown in
Figure 5. The four frequency points were specifically selected such that three of the frequency points lie in the passband (470–790 MHz), and a frequency point is in the stopband/rejection band (810–960 MHz) of the antenna. The surface current density presented in
Figure 5 validates the fact that each dipole resonates at a specific frequency.
Figure 5a suggests that the longest dipole of the antenna has the highest surface current density, as the longest dipole will resonate at the lowest frequency of bandwidth. However,
Figure 5b shows a shift in maximum surface current density to the 7th dipole at 630 MHz, which is approximately the center frequency of the bandwidth.
Figure 5c demonstrates that the maximum current density is at the 2nd and 6th dipoles of the antenna, thereby stating that both the dipoles resonate at 790 MHz. The reason for this is the intentionally created anomaly in the antenna design, which results in the energy getting trapped between these two dipoles, which ultimately leads to high rejection beyond this frequency. As seen in
Figure 5d, at 960 MHz, very minimal current density is seen throughout the antenna model, which suggests that none of the dipoles of the antenna resonates at this frequency.
The S11 values of the simulated and the measured LPDA design using Carrel’s design guidelines are shown in
Figure 6. In addition, the S11 values of the optimized antenna are also shown in
Figure 6. The graphs suggest that the S11 values of the optimized antenna are relatively lower compared to the Carrel’s model in the passband, hence validating the improved S11 of the optimized antenna. This also demonstrates excellent antenna matching for the reception in the passband. Furthermore, in the LTE-800 and GSM-900 mobile service bands (stopband), the S11 values of the optimized antenna are significantly higher compared to the Carrel’s model. This demonstrates the ability of the optimized antenna to reject the interference from the stopband from all the directions. This figure also indicates a good agreement between the simulated and the measured S11 values of the proposed antenna design. The measured S11 values have been corrected in order to take into account some extra losses in the fabricated antenna.
Figure 7 compares the simulated and measured RG of Carrel’s conventional LPDA with the simulated RG of the optimized LPDA and the measured results. The measured RG of the proposed antenna has been corrected in order to take into account some extra losses in the fabricated antenna. This result shows that the optimized antenna achieves a higher RG compared to that derived by Carrel’s model. Furthermore, the optimized antenna demonstrates a steep rejection in the stopband, where the RG drops below 0 dBi. This ensures that that antenna rejects the signals from all the angles of arrival of radiation. The measured realized gain of the proposed antenna follows closely the simulated RG inside the passband. However, some difference can be seen between the measured and simulated RG of the proposed antenna from 700 MHz to 1000 MHz. The RG drops faster in the stopband in the measurement than in the simulation.
The simulated FBR of the optimized LPDA is compared with Carrel’s conventional LPDA in
Figure 8. This plot shows that the proposed antenna exhibits highly directive characteristics in the passband. In contrary to this, Carrel’s model demonstrates a highly directive nature in the passband as well as stopband, therefore being vulnerable to the interference. Furthermore, in comparison to Carrel’s model, the optimized antenna also achieves a somewhat improved FBR in the passband.
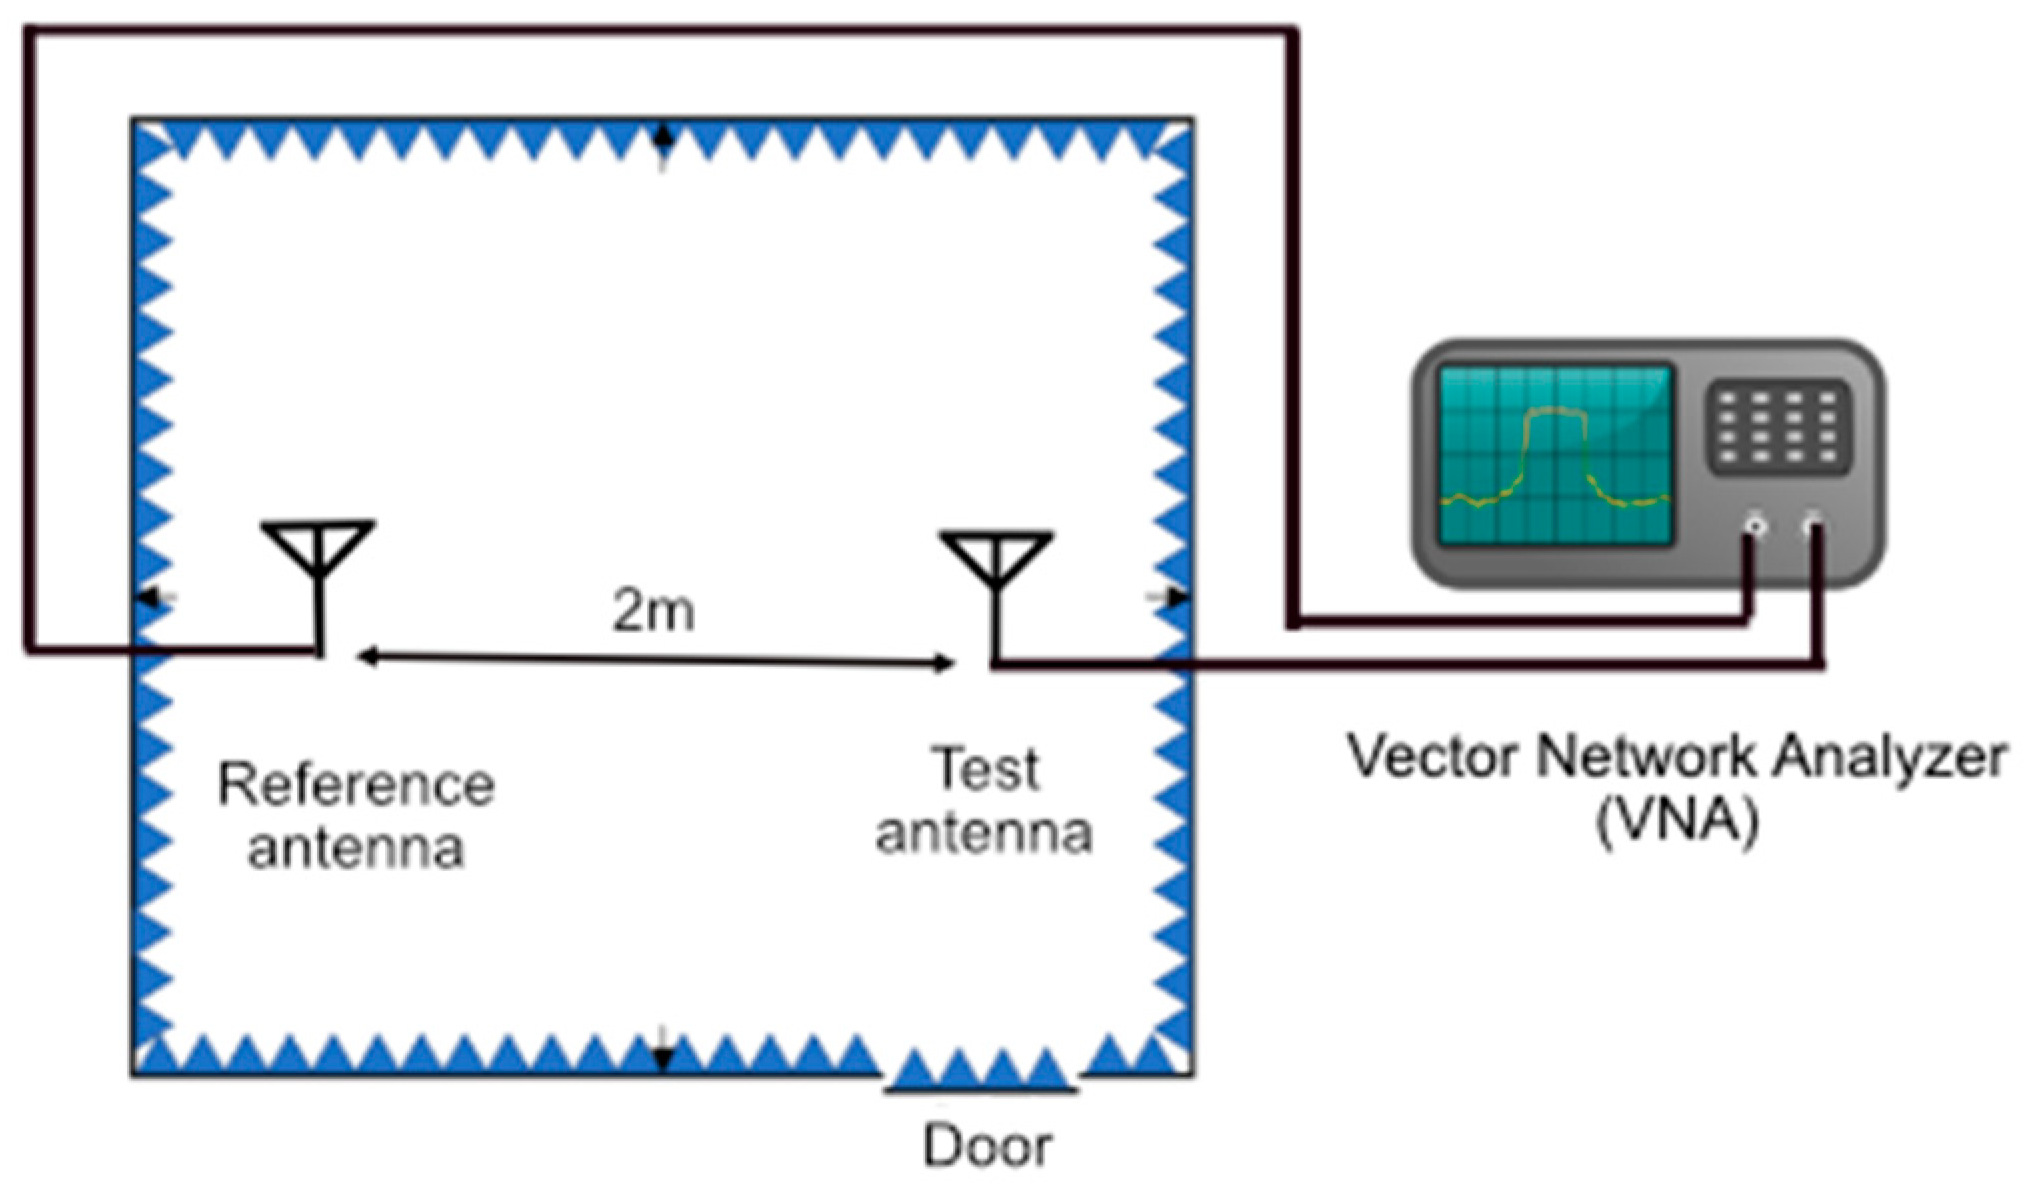
Figure 9 shows the test setup in an NPL anechoic chamber for the measurement of realized gain and radiation patterns of the optimized LPDA. The Schwarzbeck USLP-9143B LPDA was used as a reference antenna in these measurements. The AUT (Antenna Under Test) was placed 2 m apart from the reference antenna, and both the antennas were placed at 1.2 m above the absorbing floor. A schematic diagram of the test setup for gain measurements is shown in
Figure 9. The S12 from the test antenna to the reference antenna was measured using a Vector Network Analyzer (VNA). Then, these data were used along with the already known gain values of the reference antenna to calculate the RG of the test antenna. As shown in
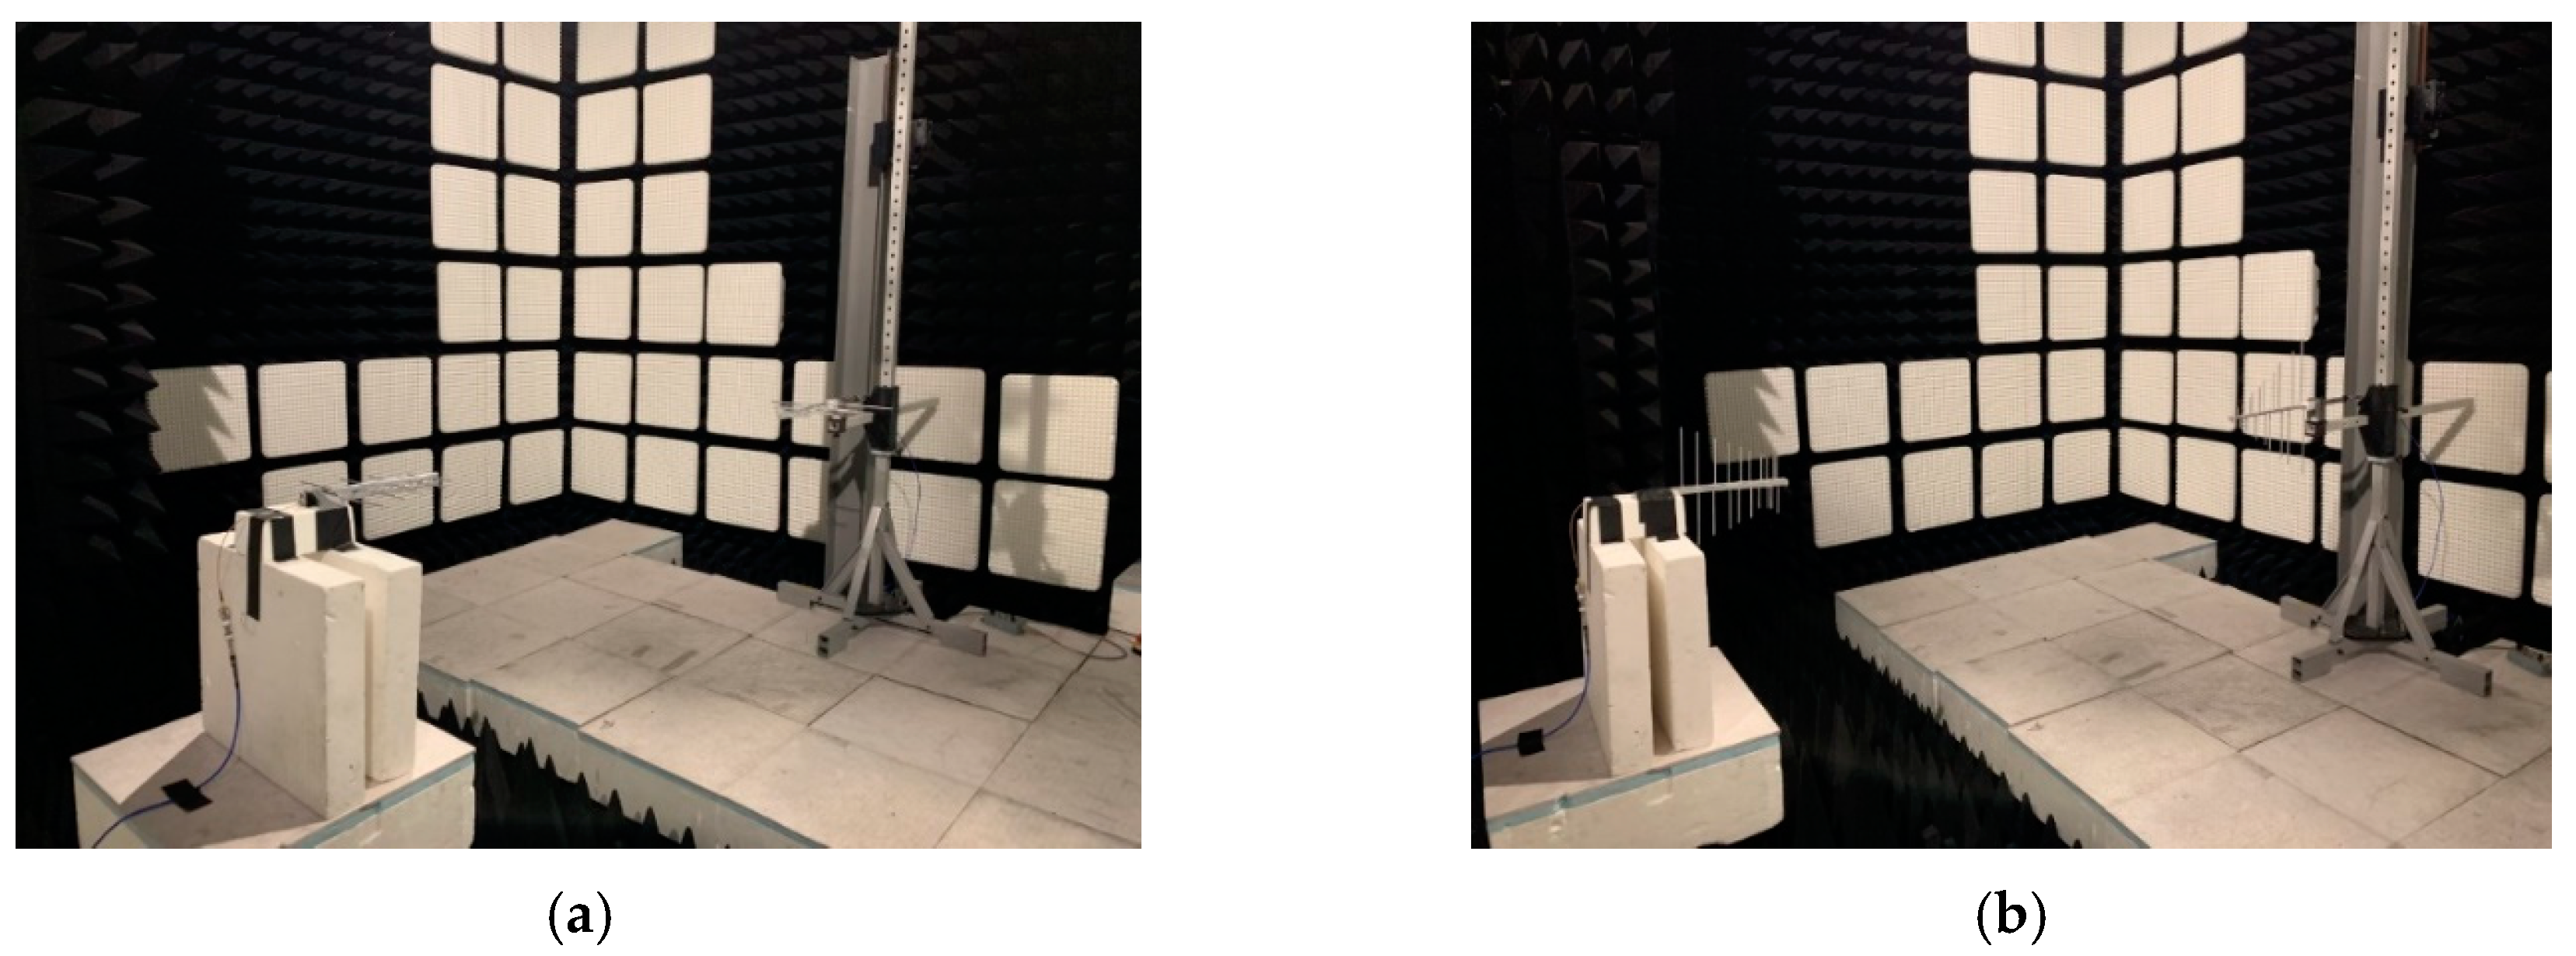
Figure 10, the reference antenna and the test antenna are oriented parallel to the ground in order to perform E-plane measurements.
Figure 11 presents the simulated and the measured E-plane normalized radiation patterns of the optimized antenna at (a) 470 MHz, (b) 630 MHz, (c) 790 MHz, and (d) 960 MHz. These plots suggest that the simulated radiation patterns and the measured radiation pattern in the E-plane are in good agreement. It also validates the highly directional behavior of the antenna in the passband as shown in
Figure 11a–c. The directional behavior of the antenna degrades in the stopband as shown in
Figure 11d at 960 MHz.
After the radiation pattern measurements on the E-plane, the radiation patterns of the optimized LPDA were measured at the same frequency points on the H-plane. The test setup for H-plane radiation pattern measurements used exactly the same test setup as the E-plane radiation pattern measurements, where only the orientation of the test antenna and the reference antenna were changed to be perpendicularly aligned with respect to the absorbing floor, as shown in
Figure 10. The simulated and the measured radiation patters at four frequency points are compared in
Figure 12. The results show satisfactory agreement between measurements and simulations.


 ,
, 


