Study on Battery Charging Converter for MPPT Control of Laser Wireless Power Transmission System


Abstract
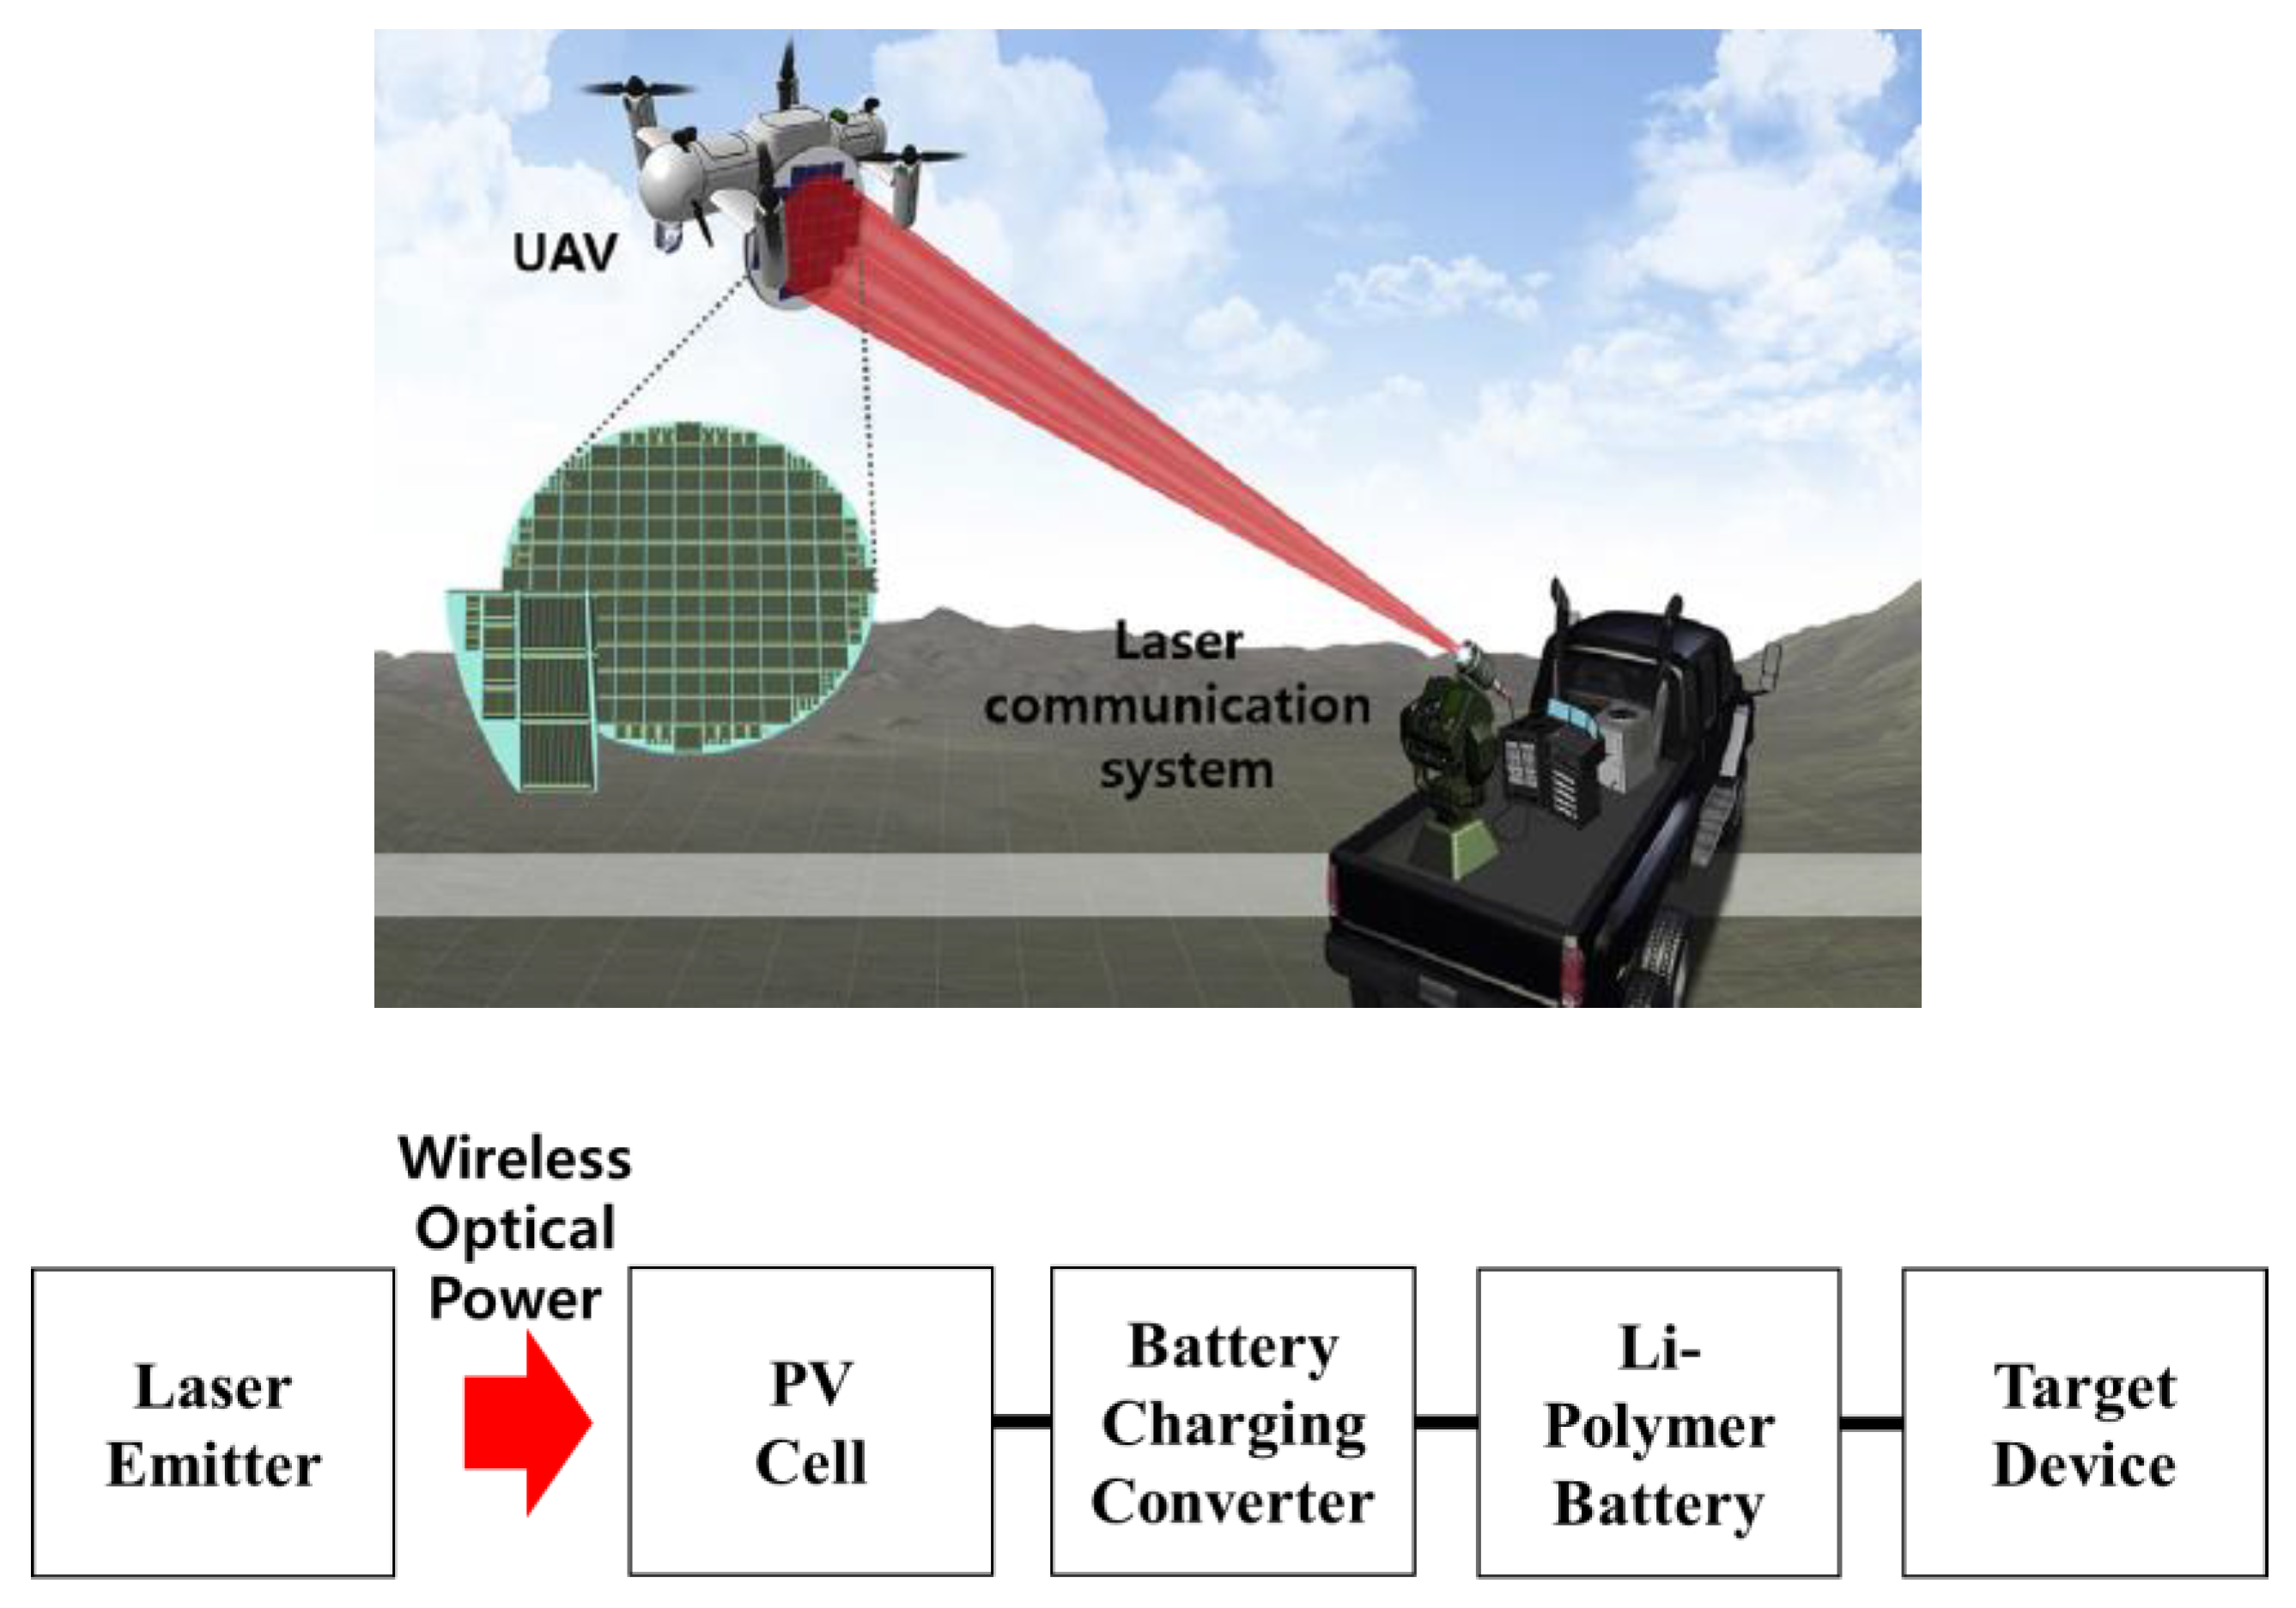
:1. Introduction
2. Modeling and Controller Design of Laser Wireless Power Transmission System
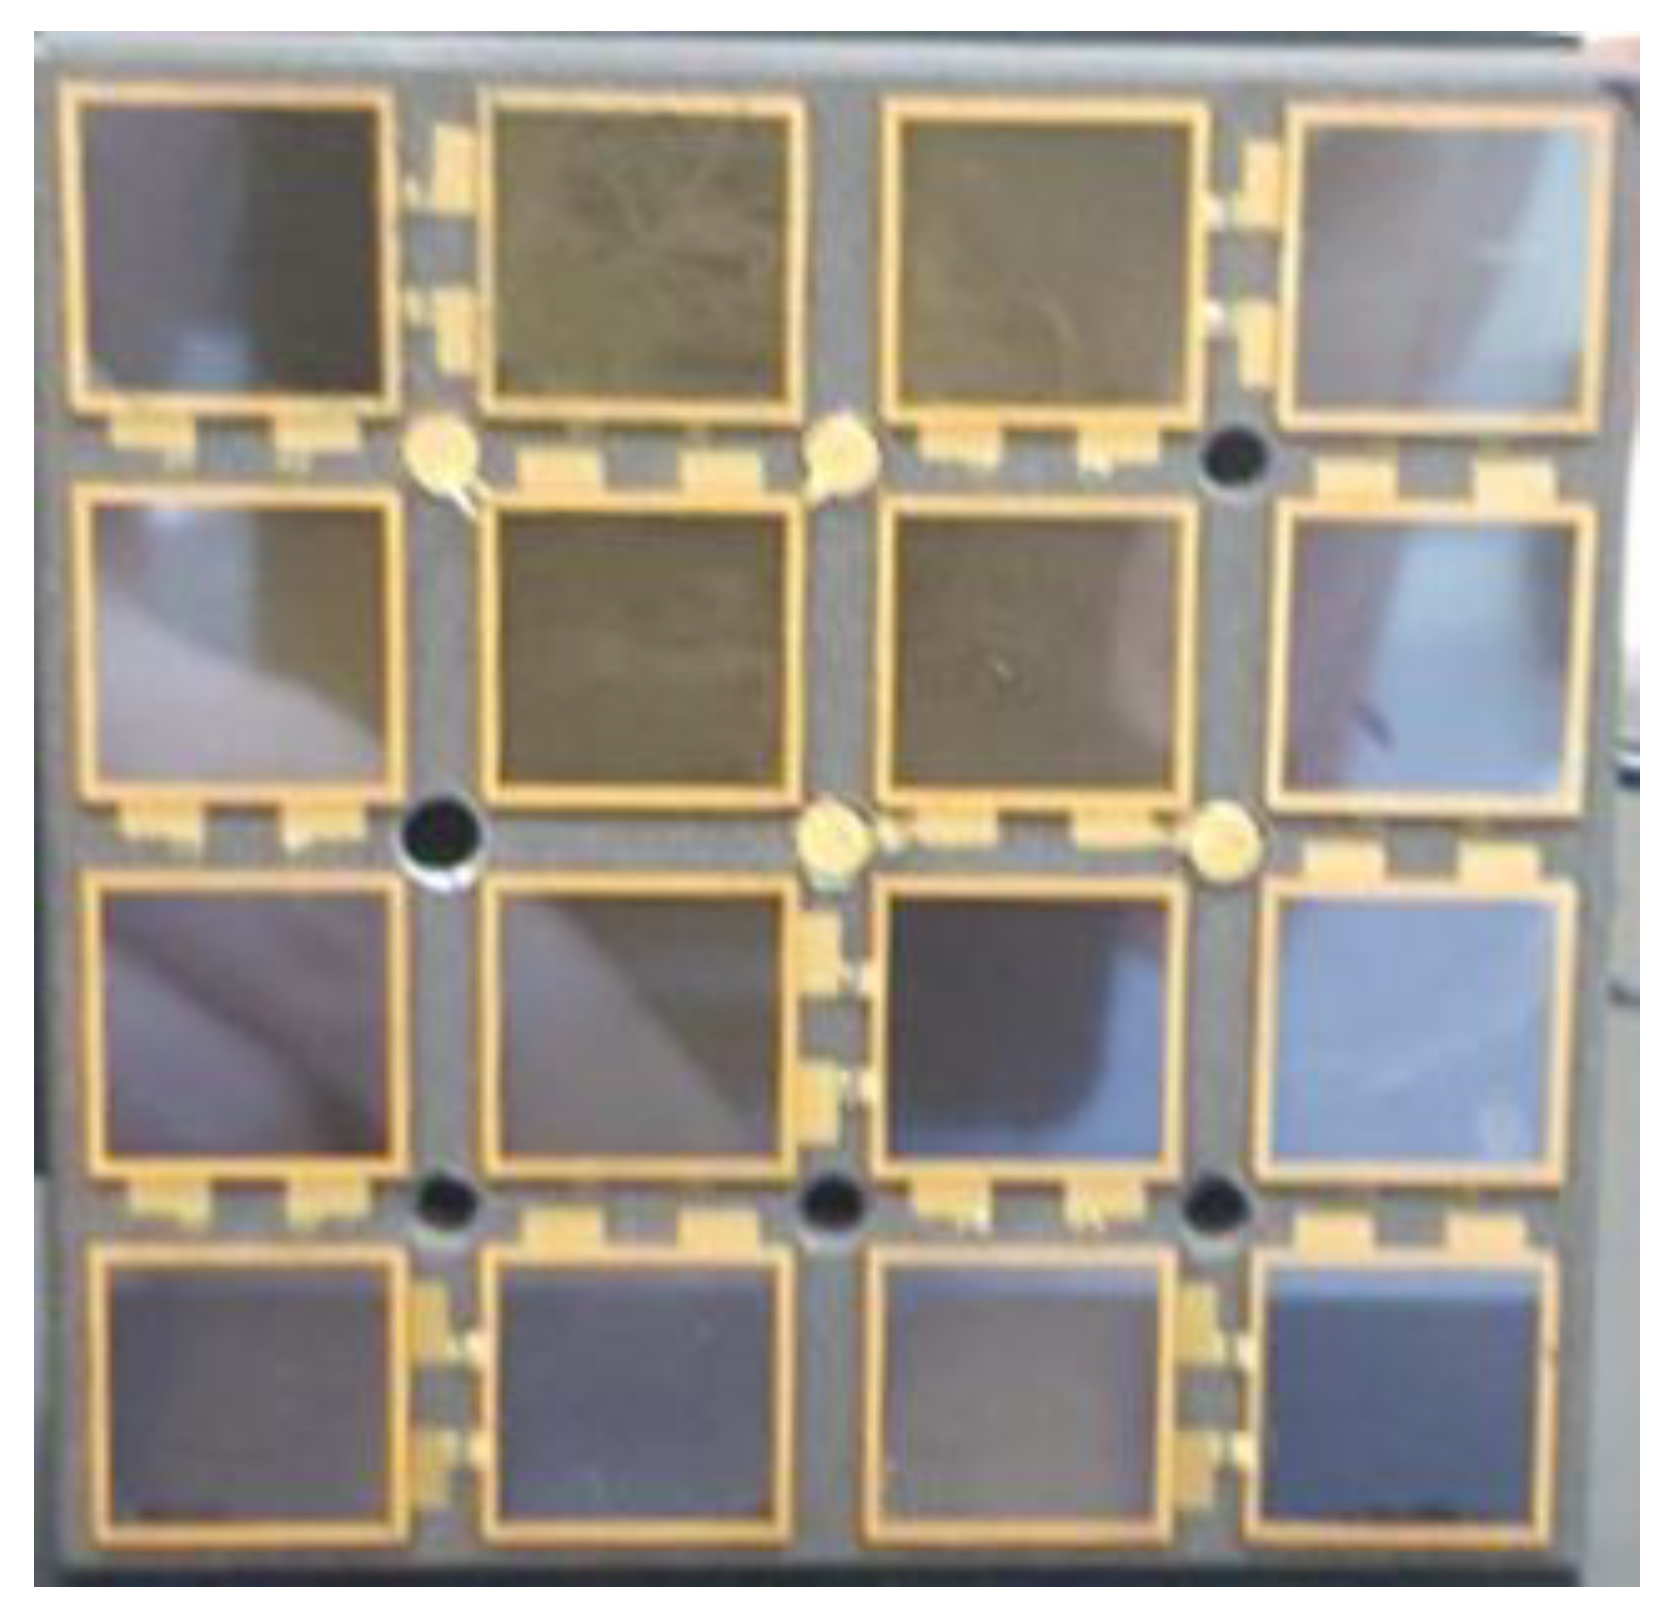
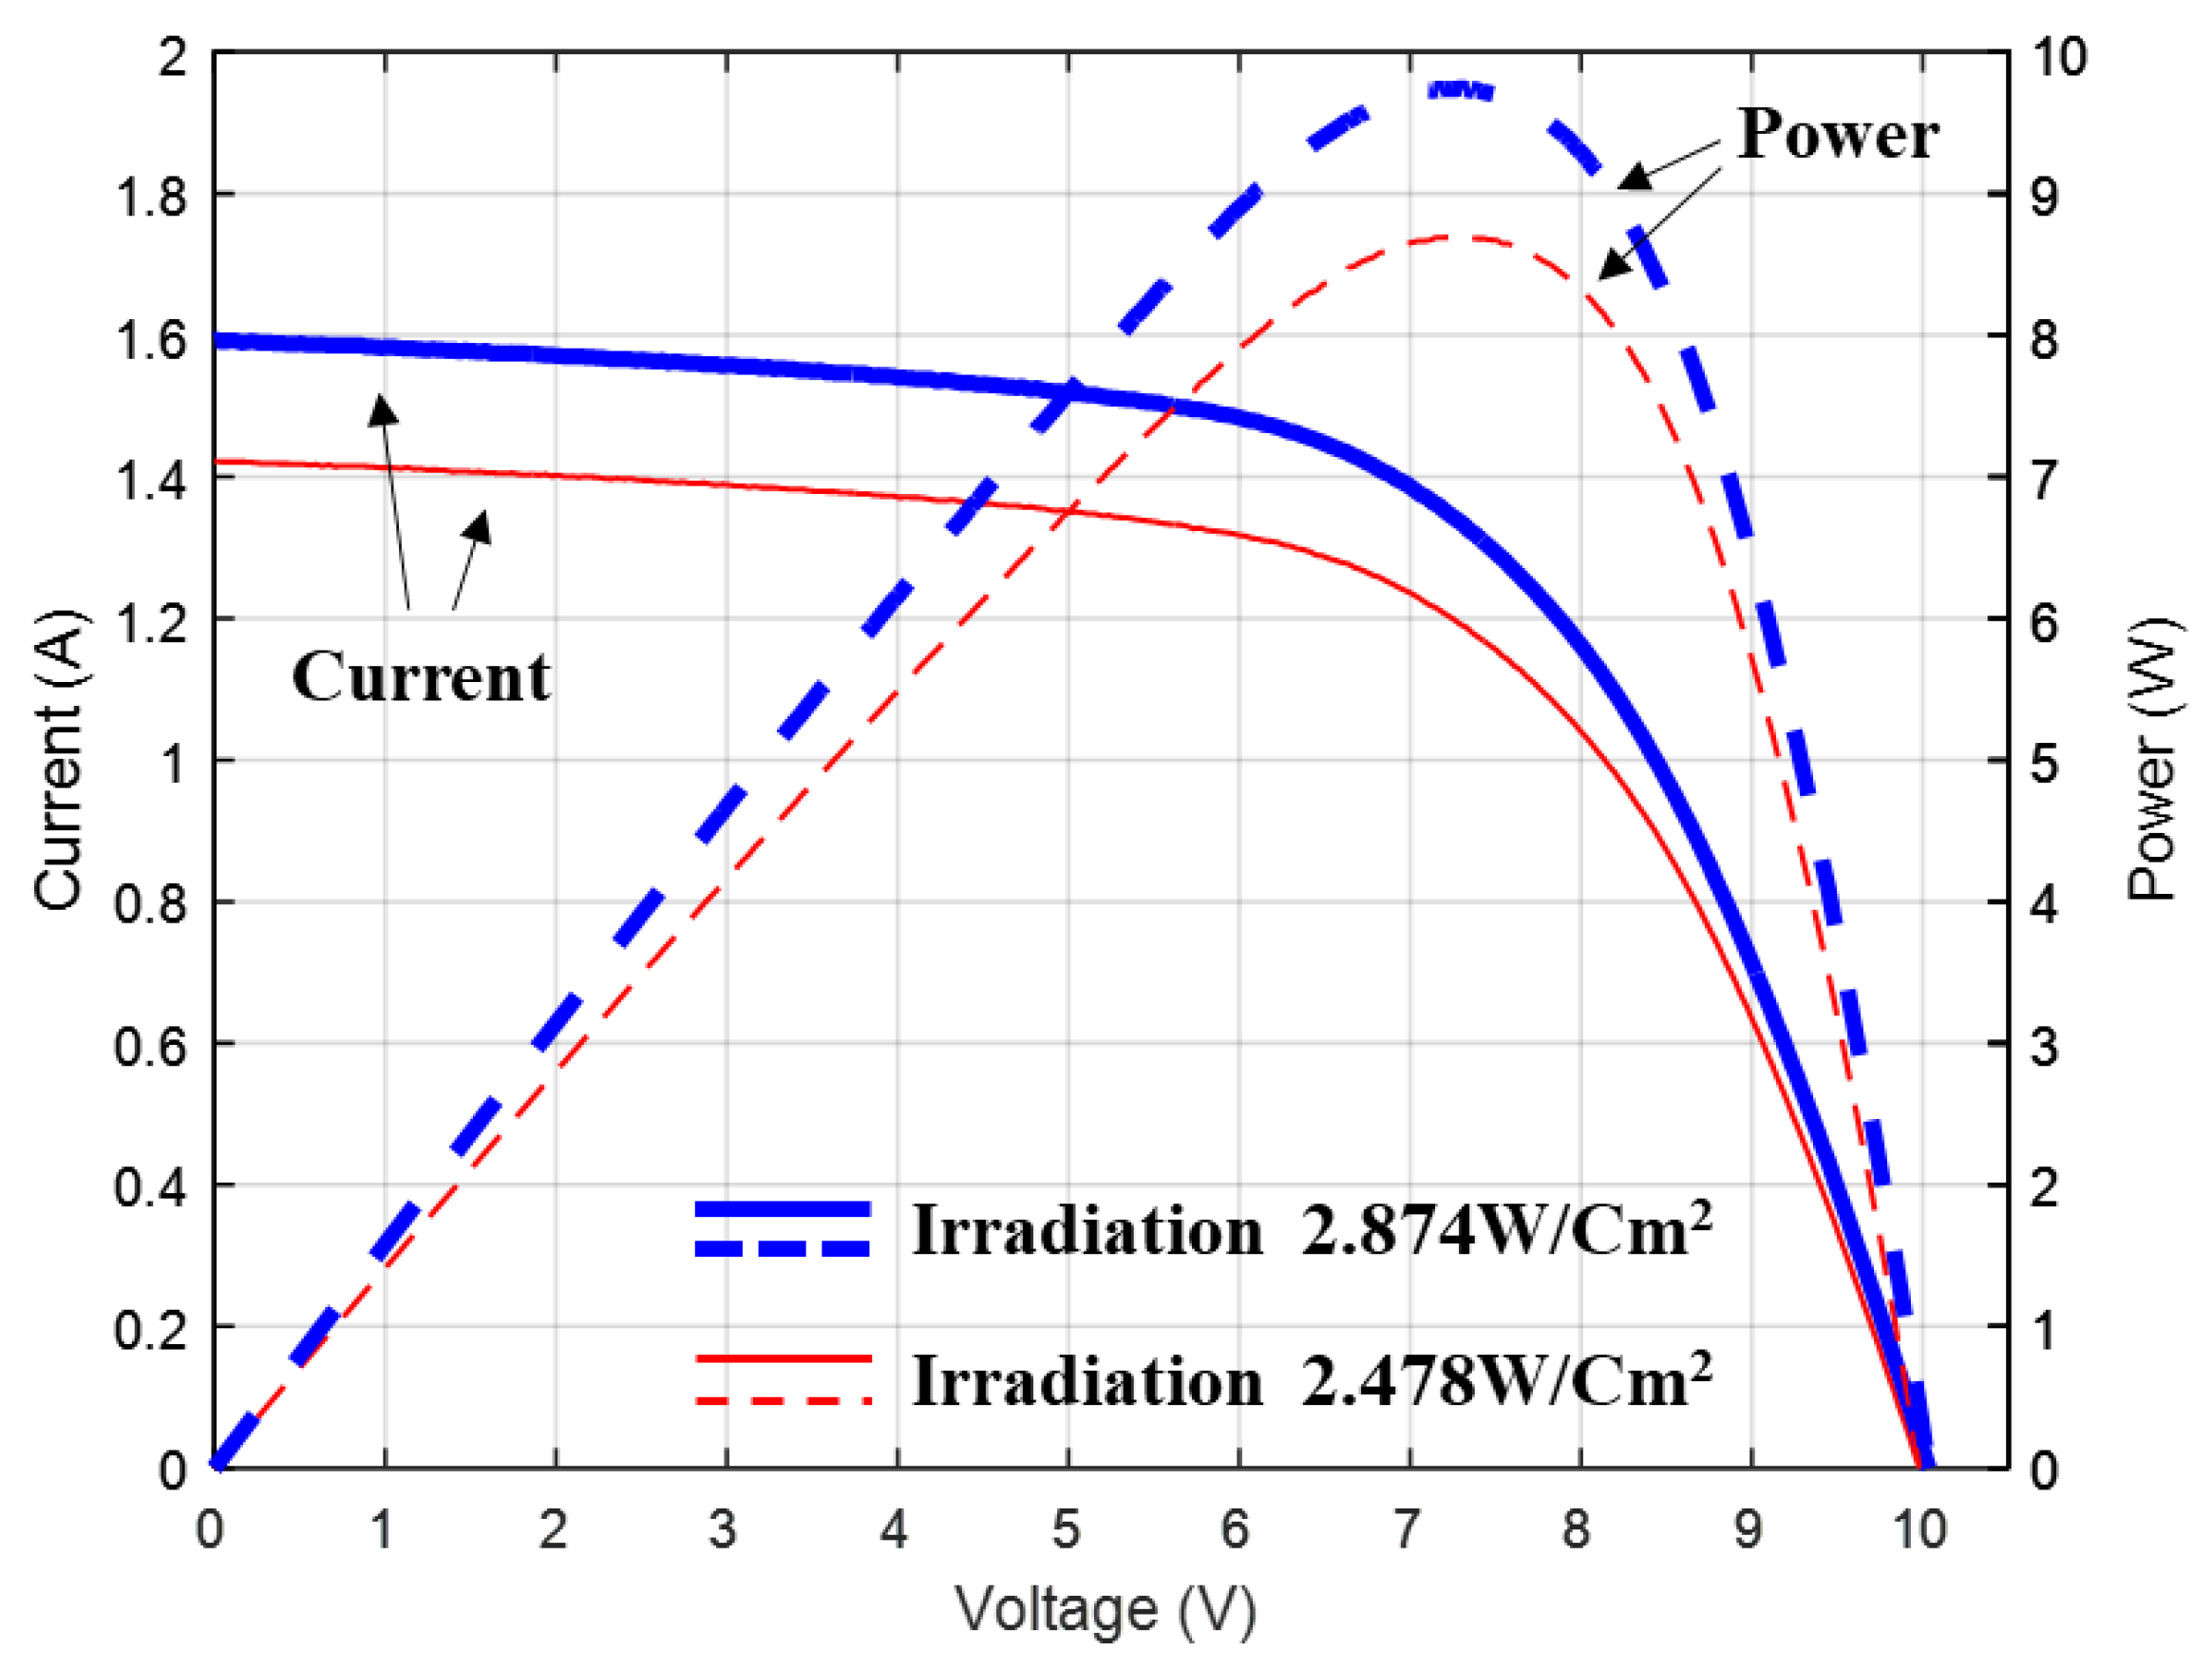
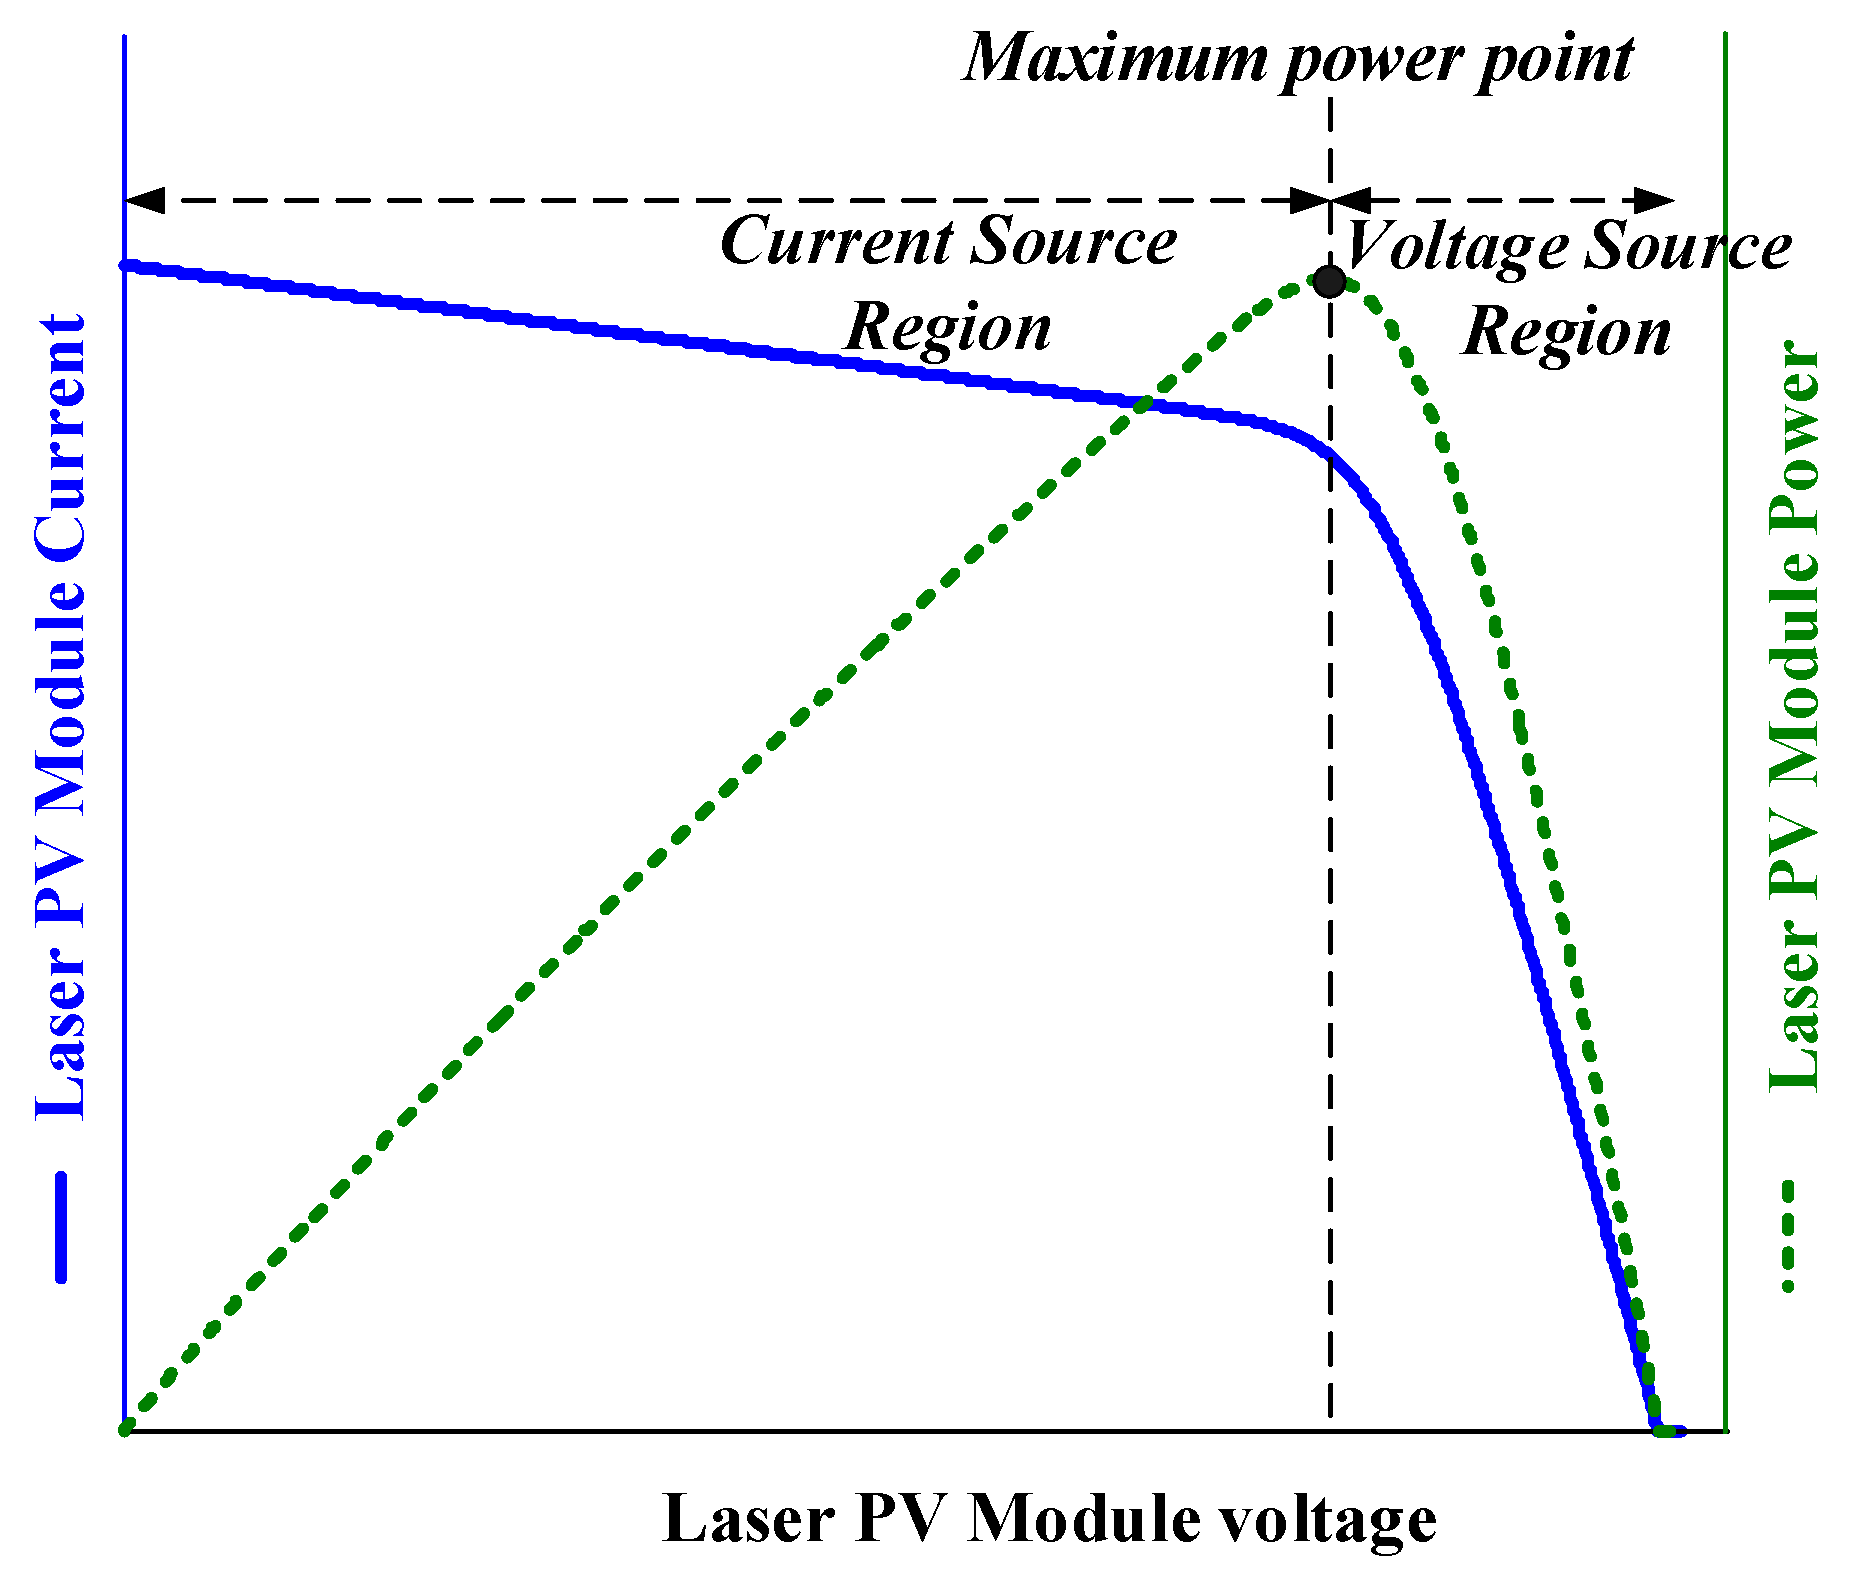
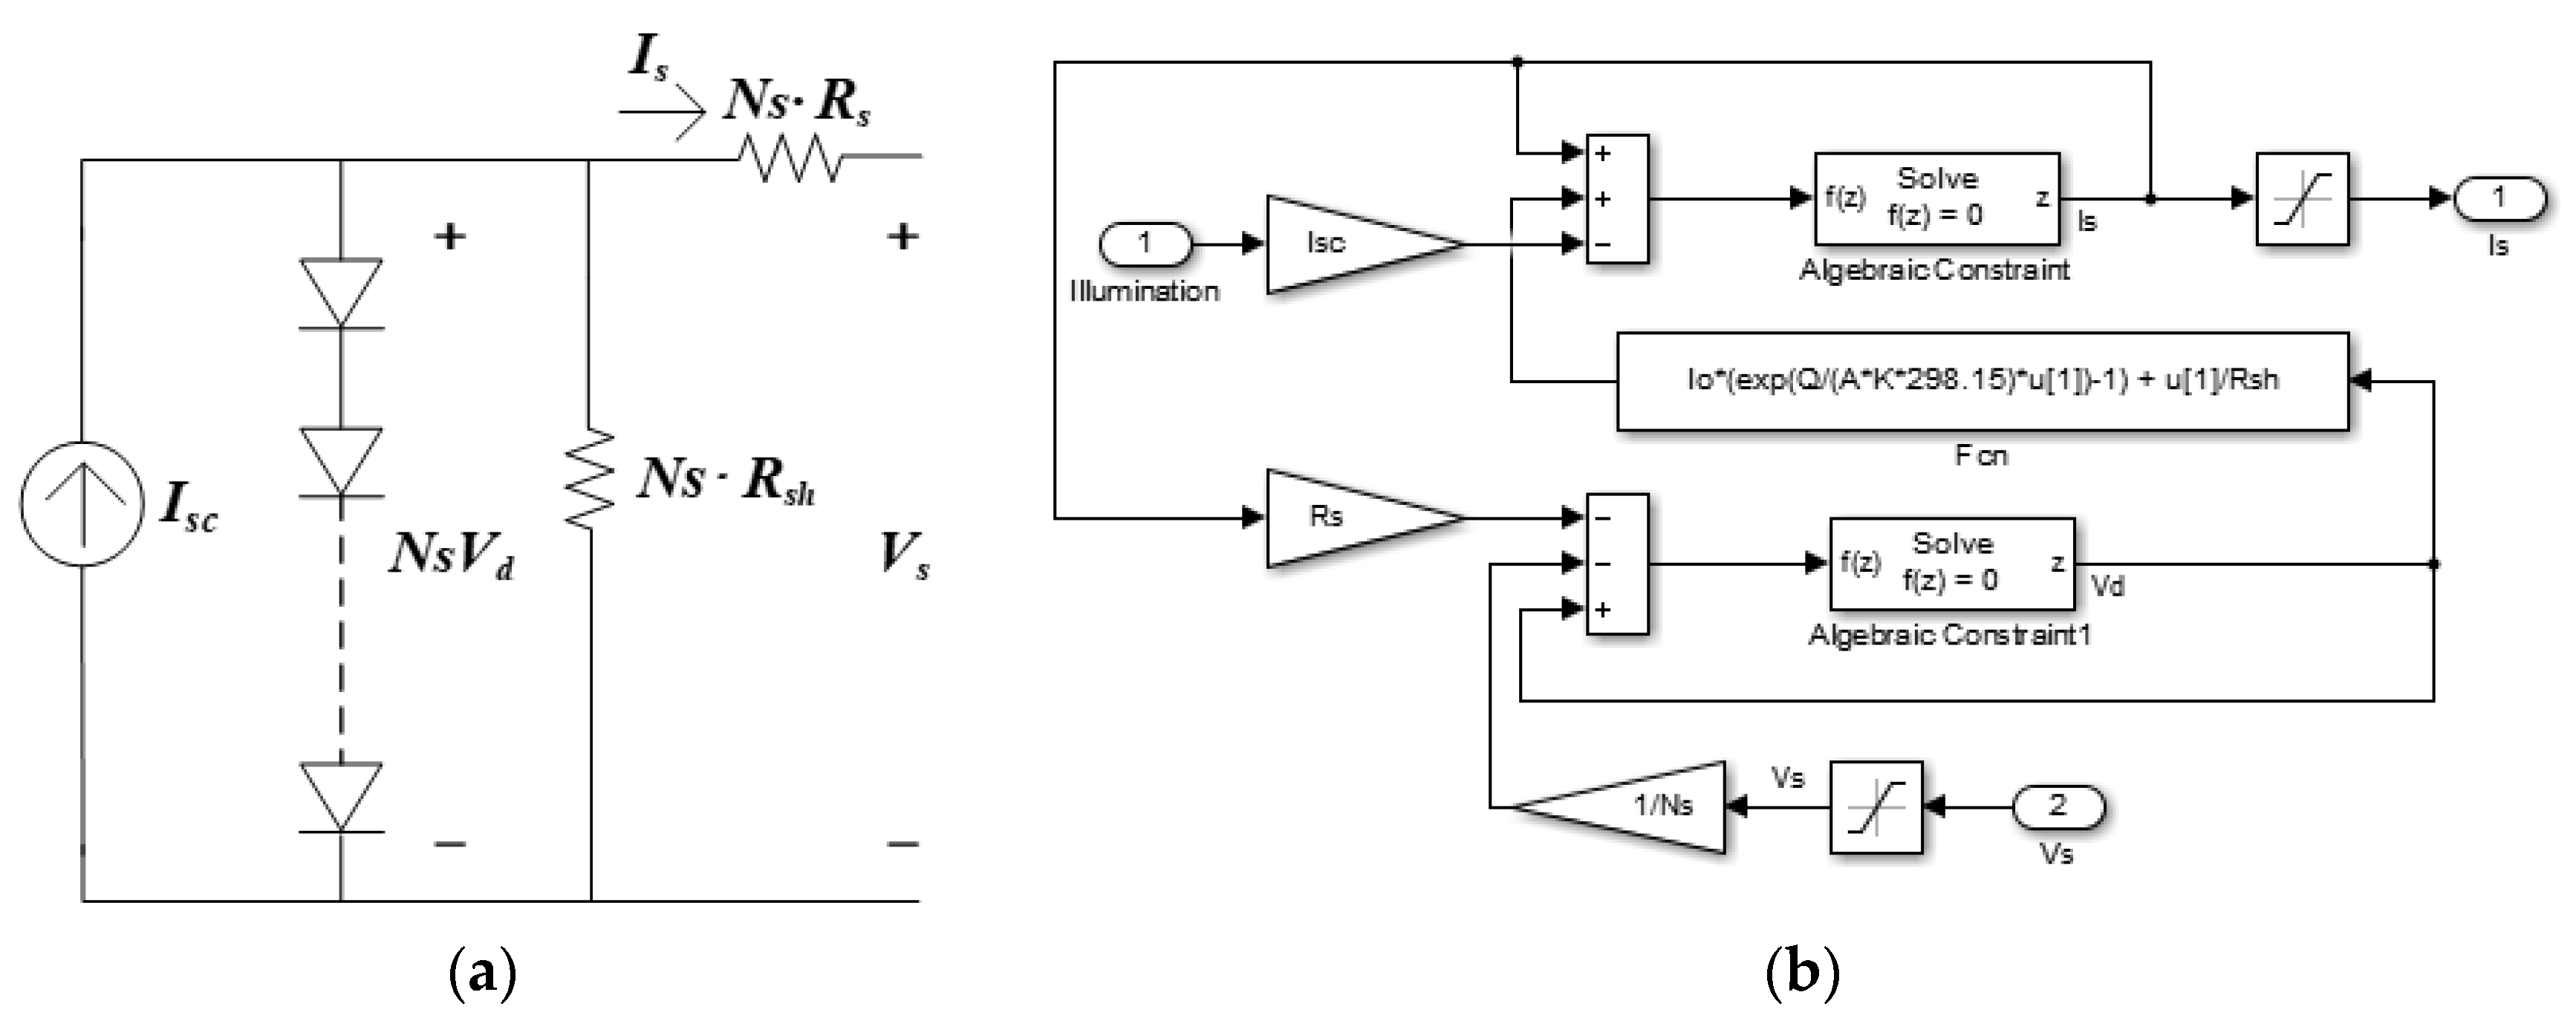
2.1. Laser PV Module Characteristics
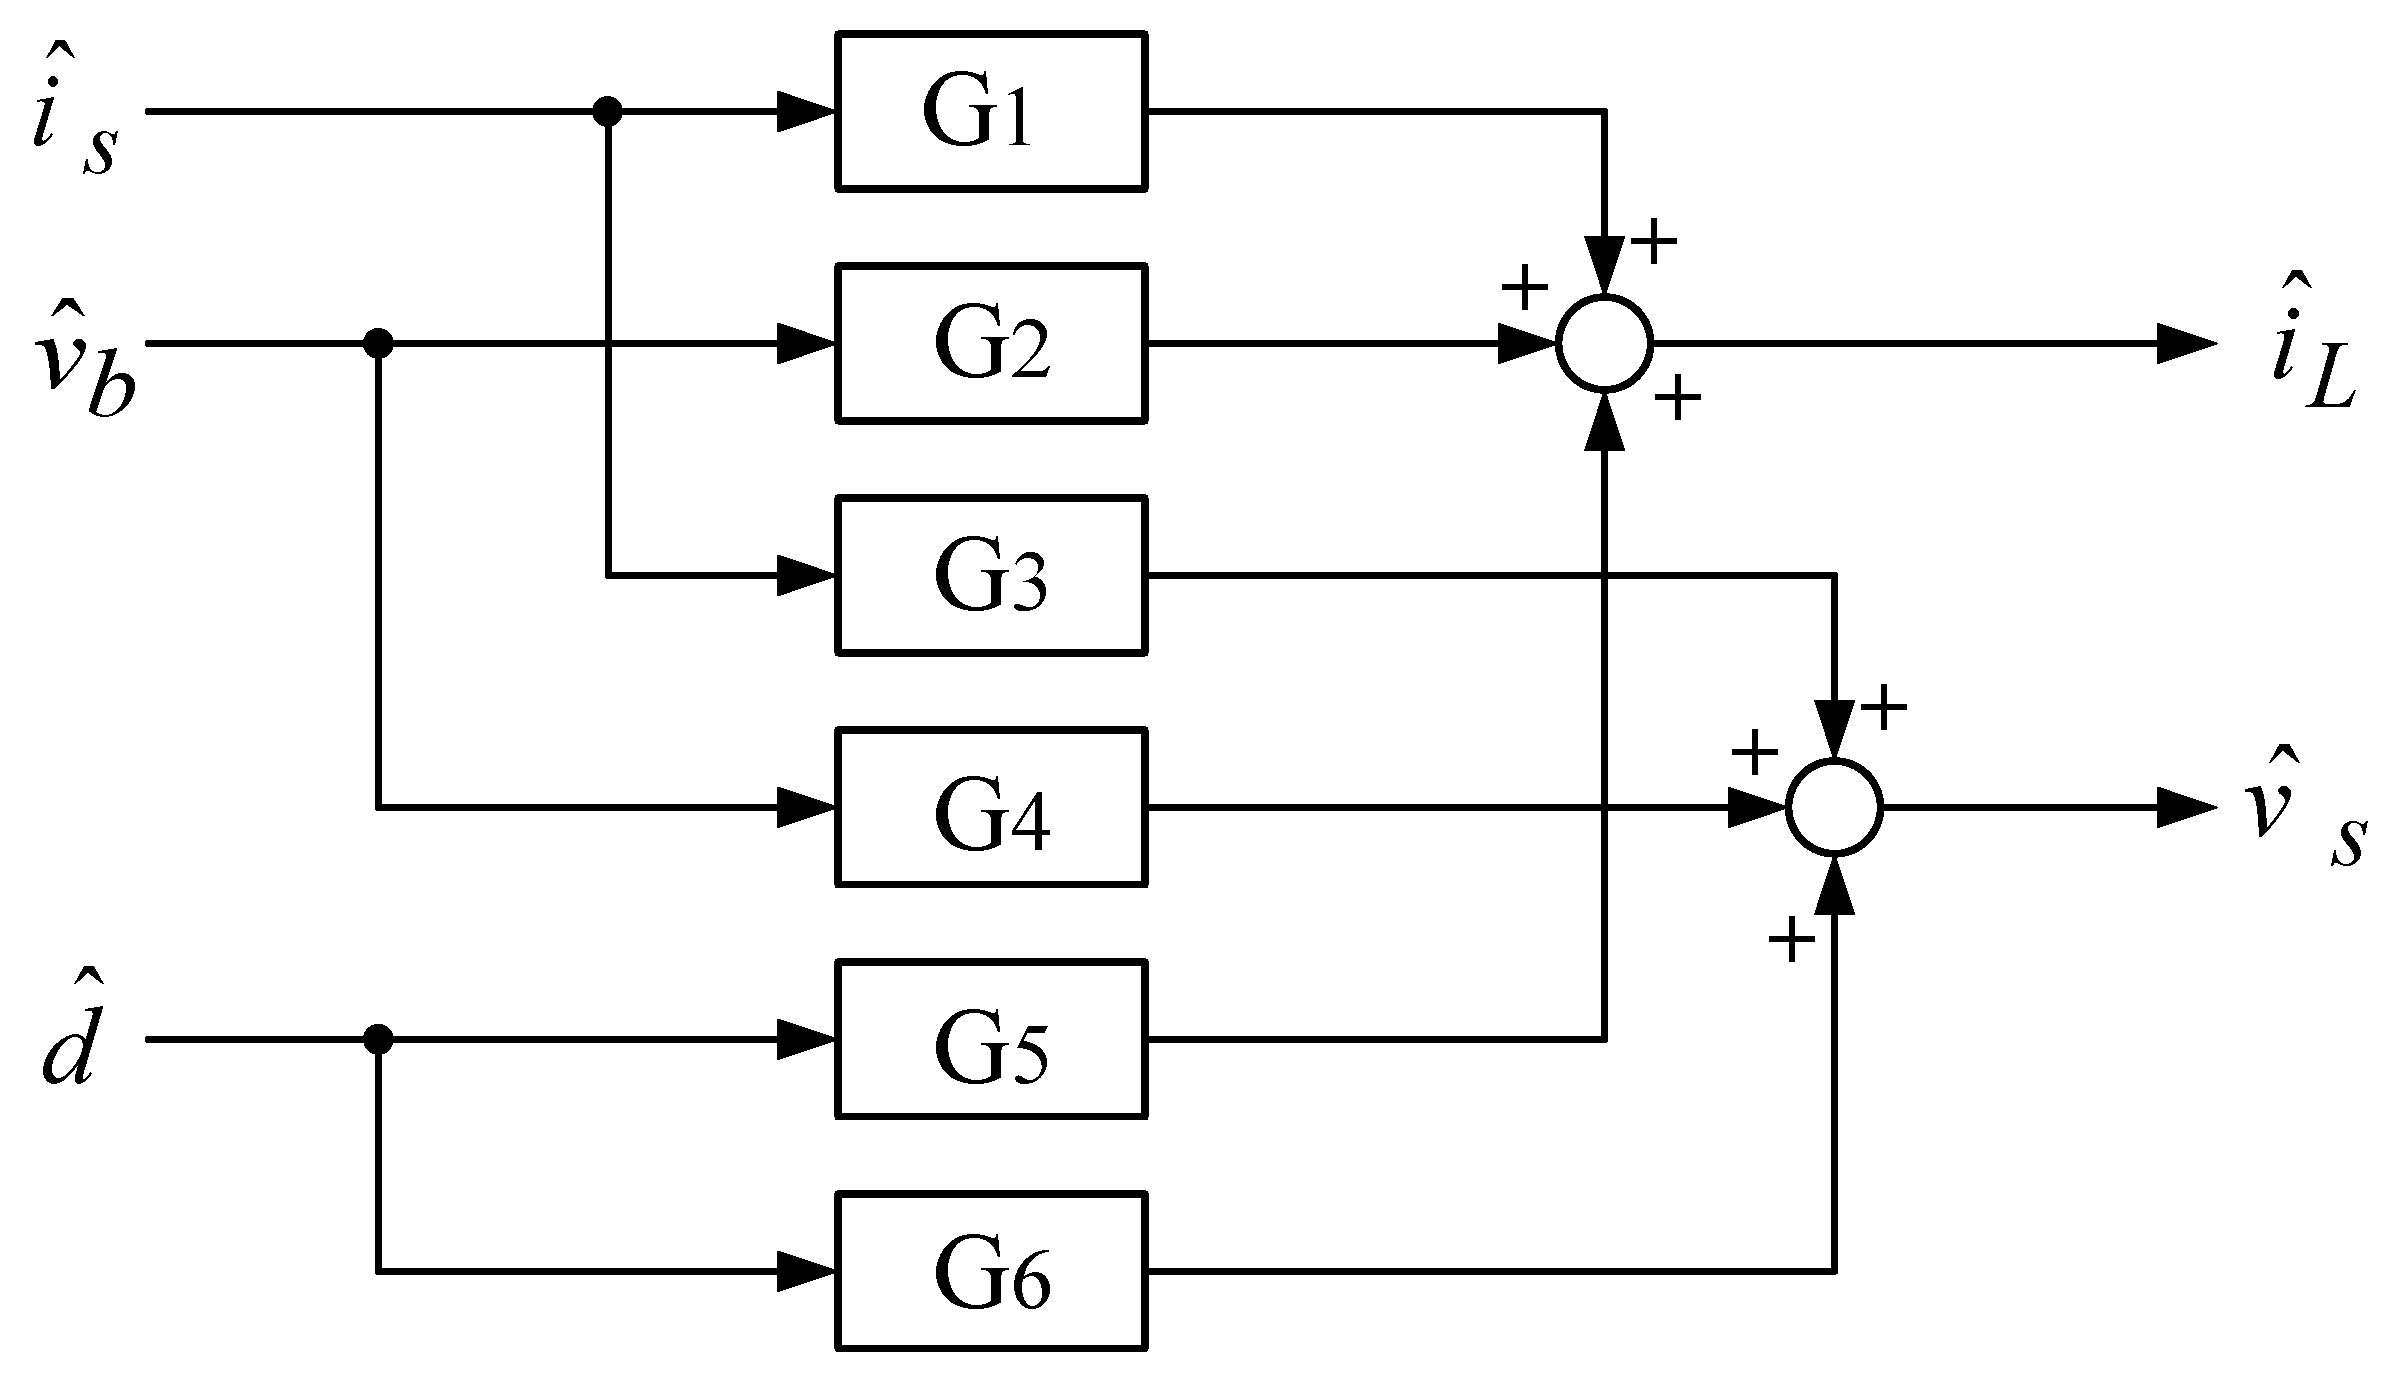
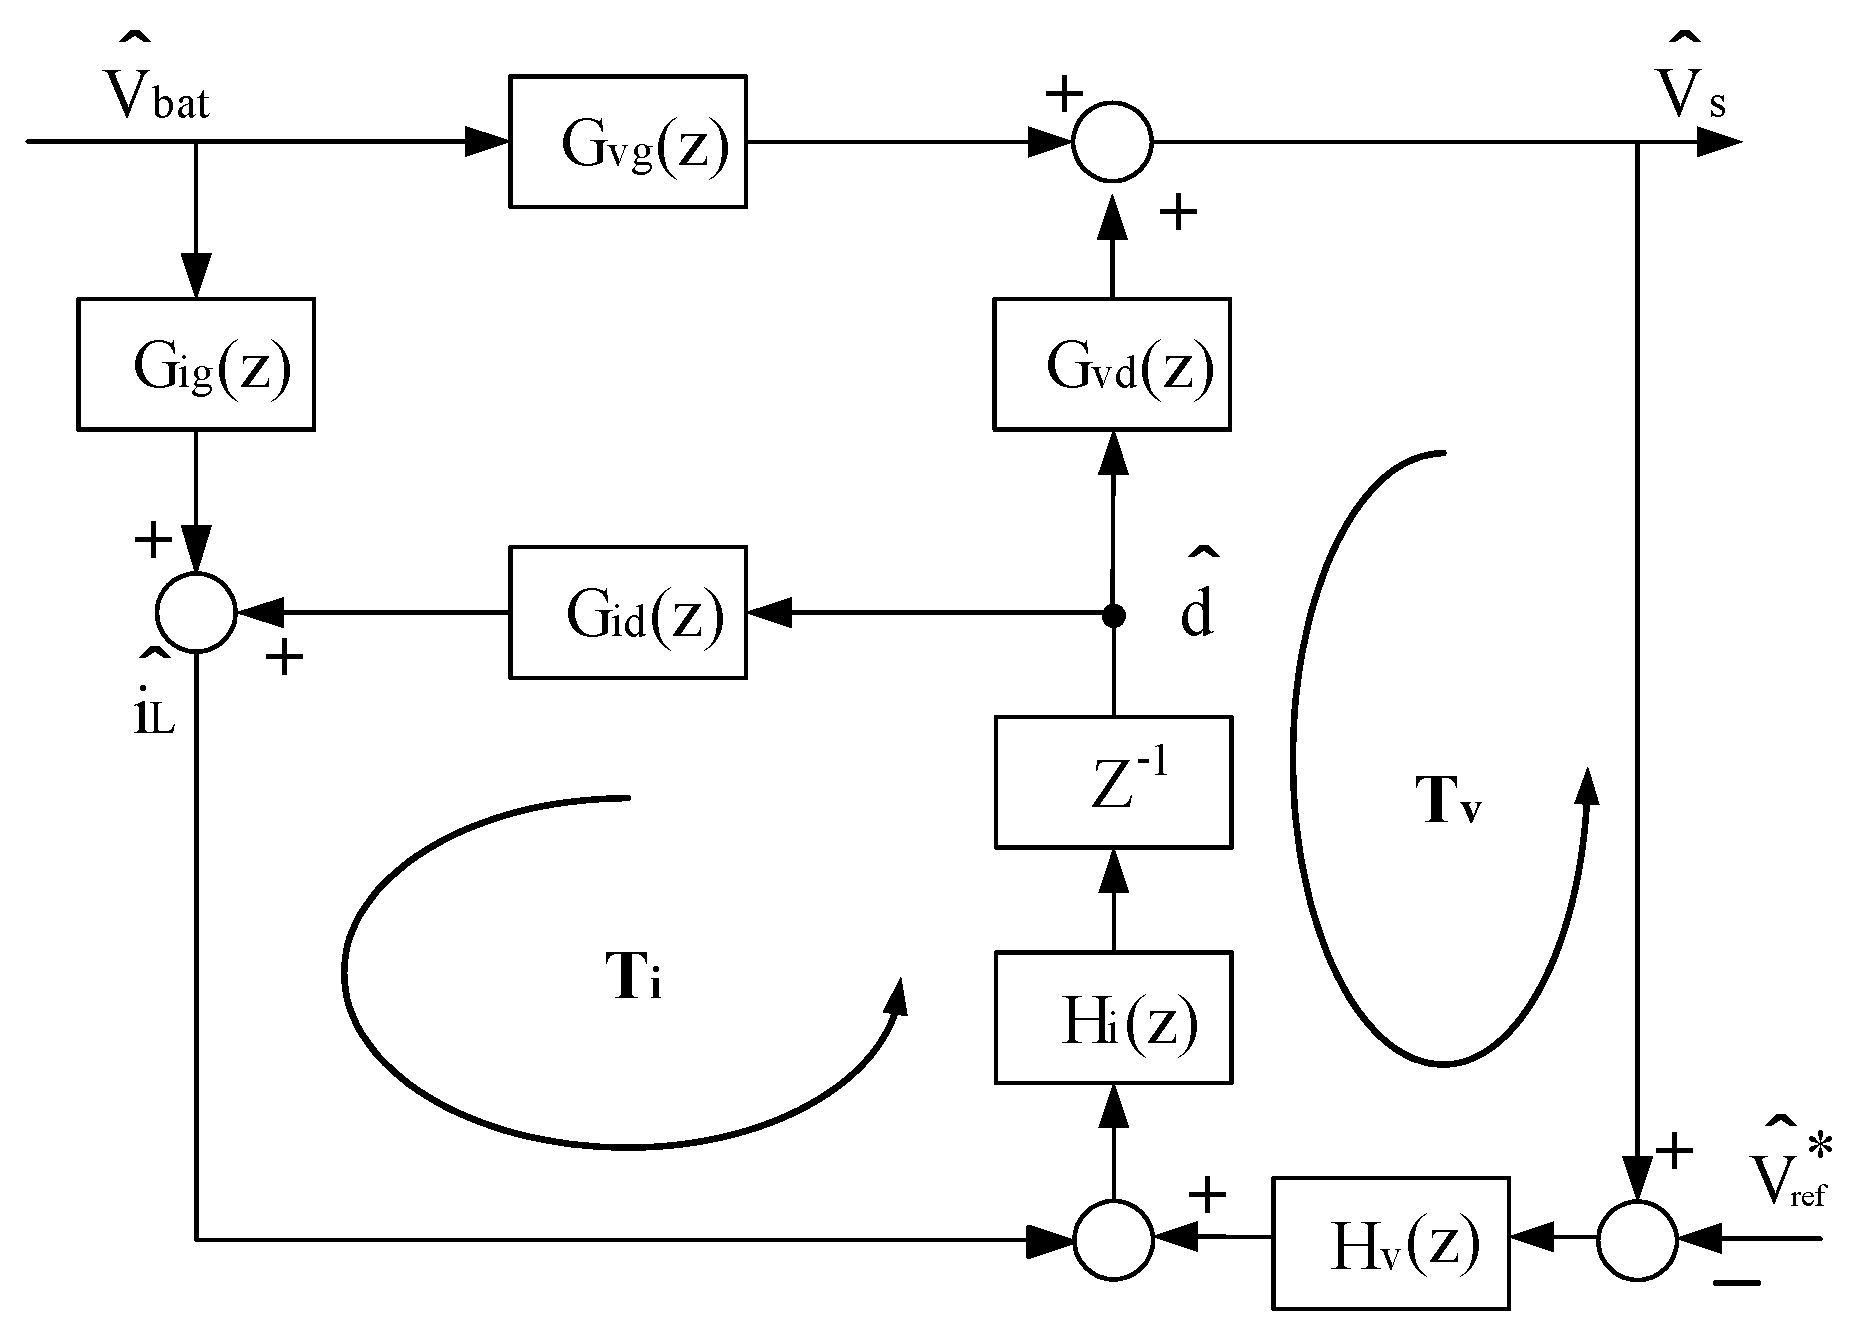
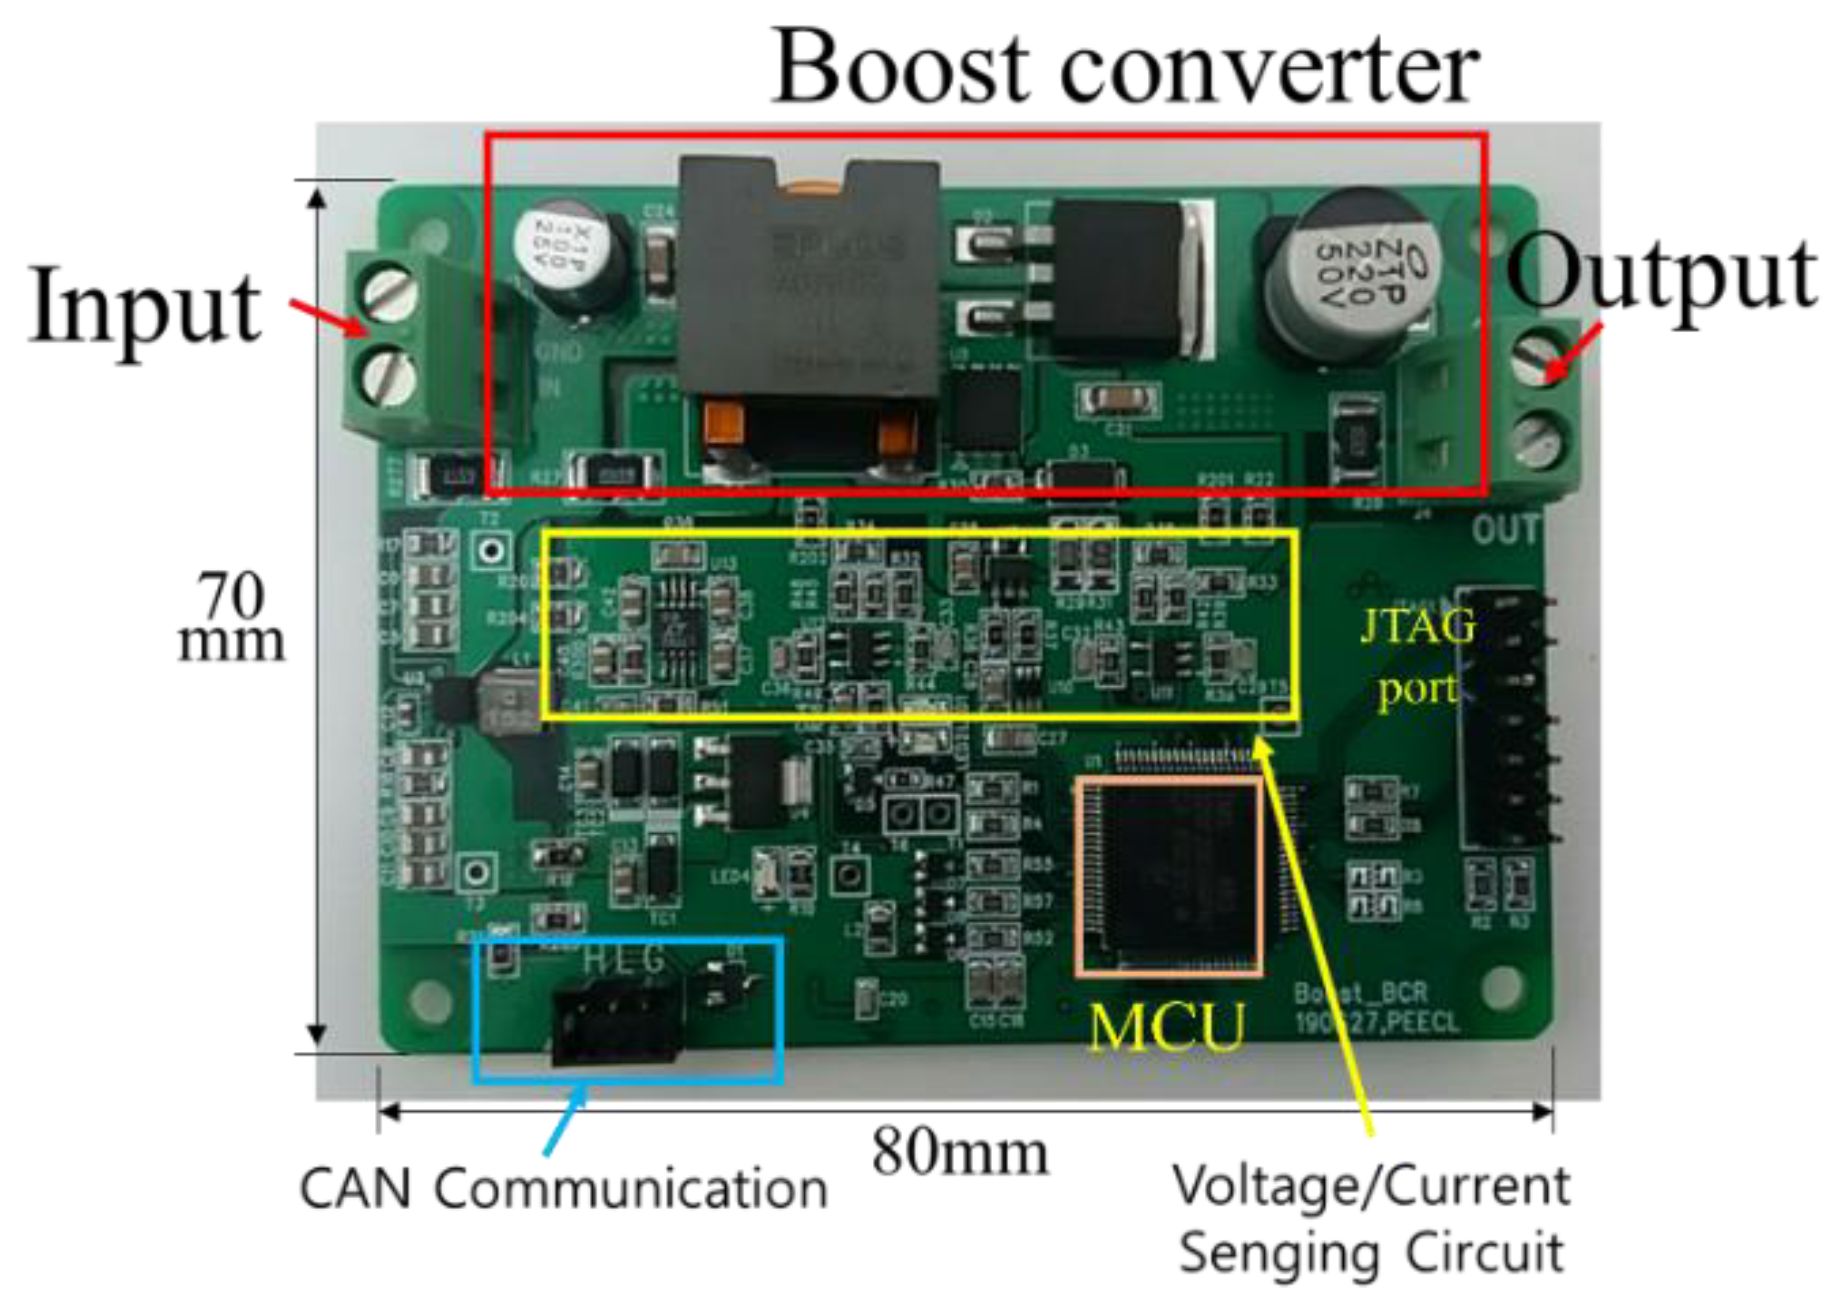
2.2. Modeling and Controller Design of Boost Converter
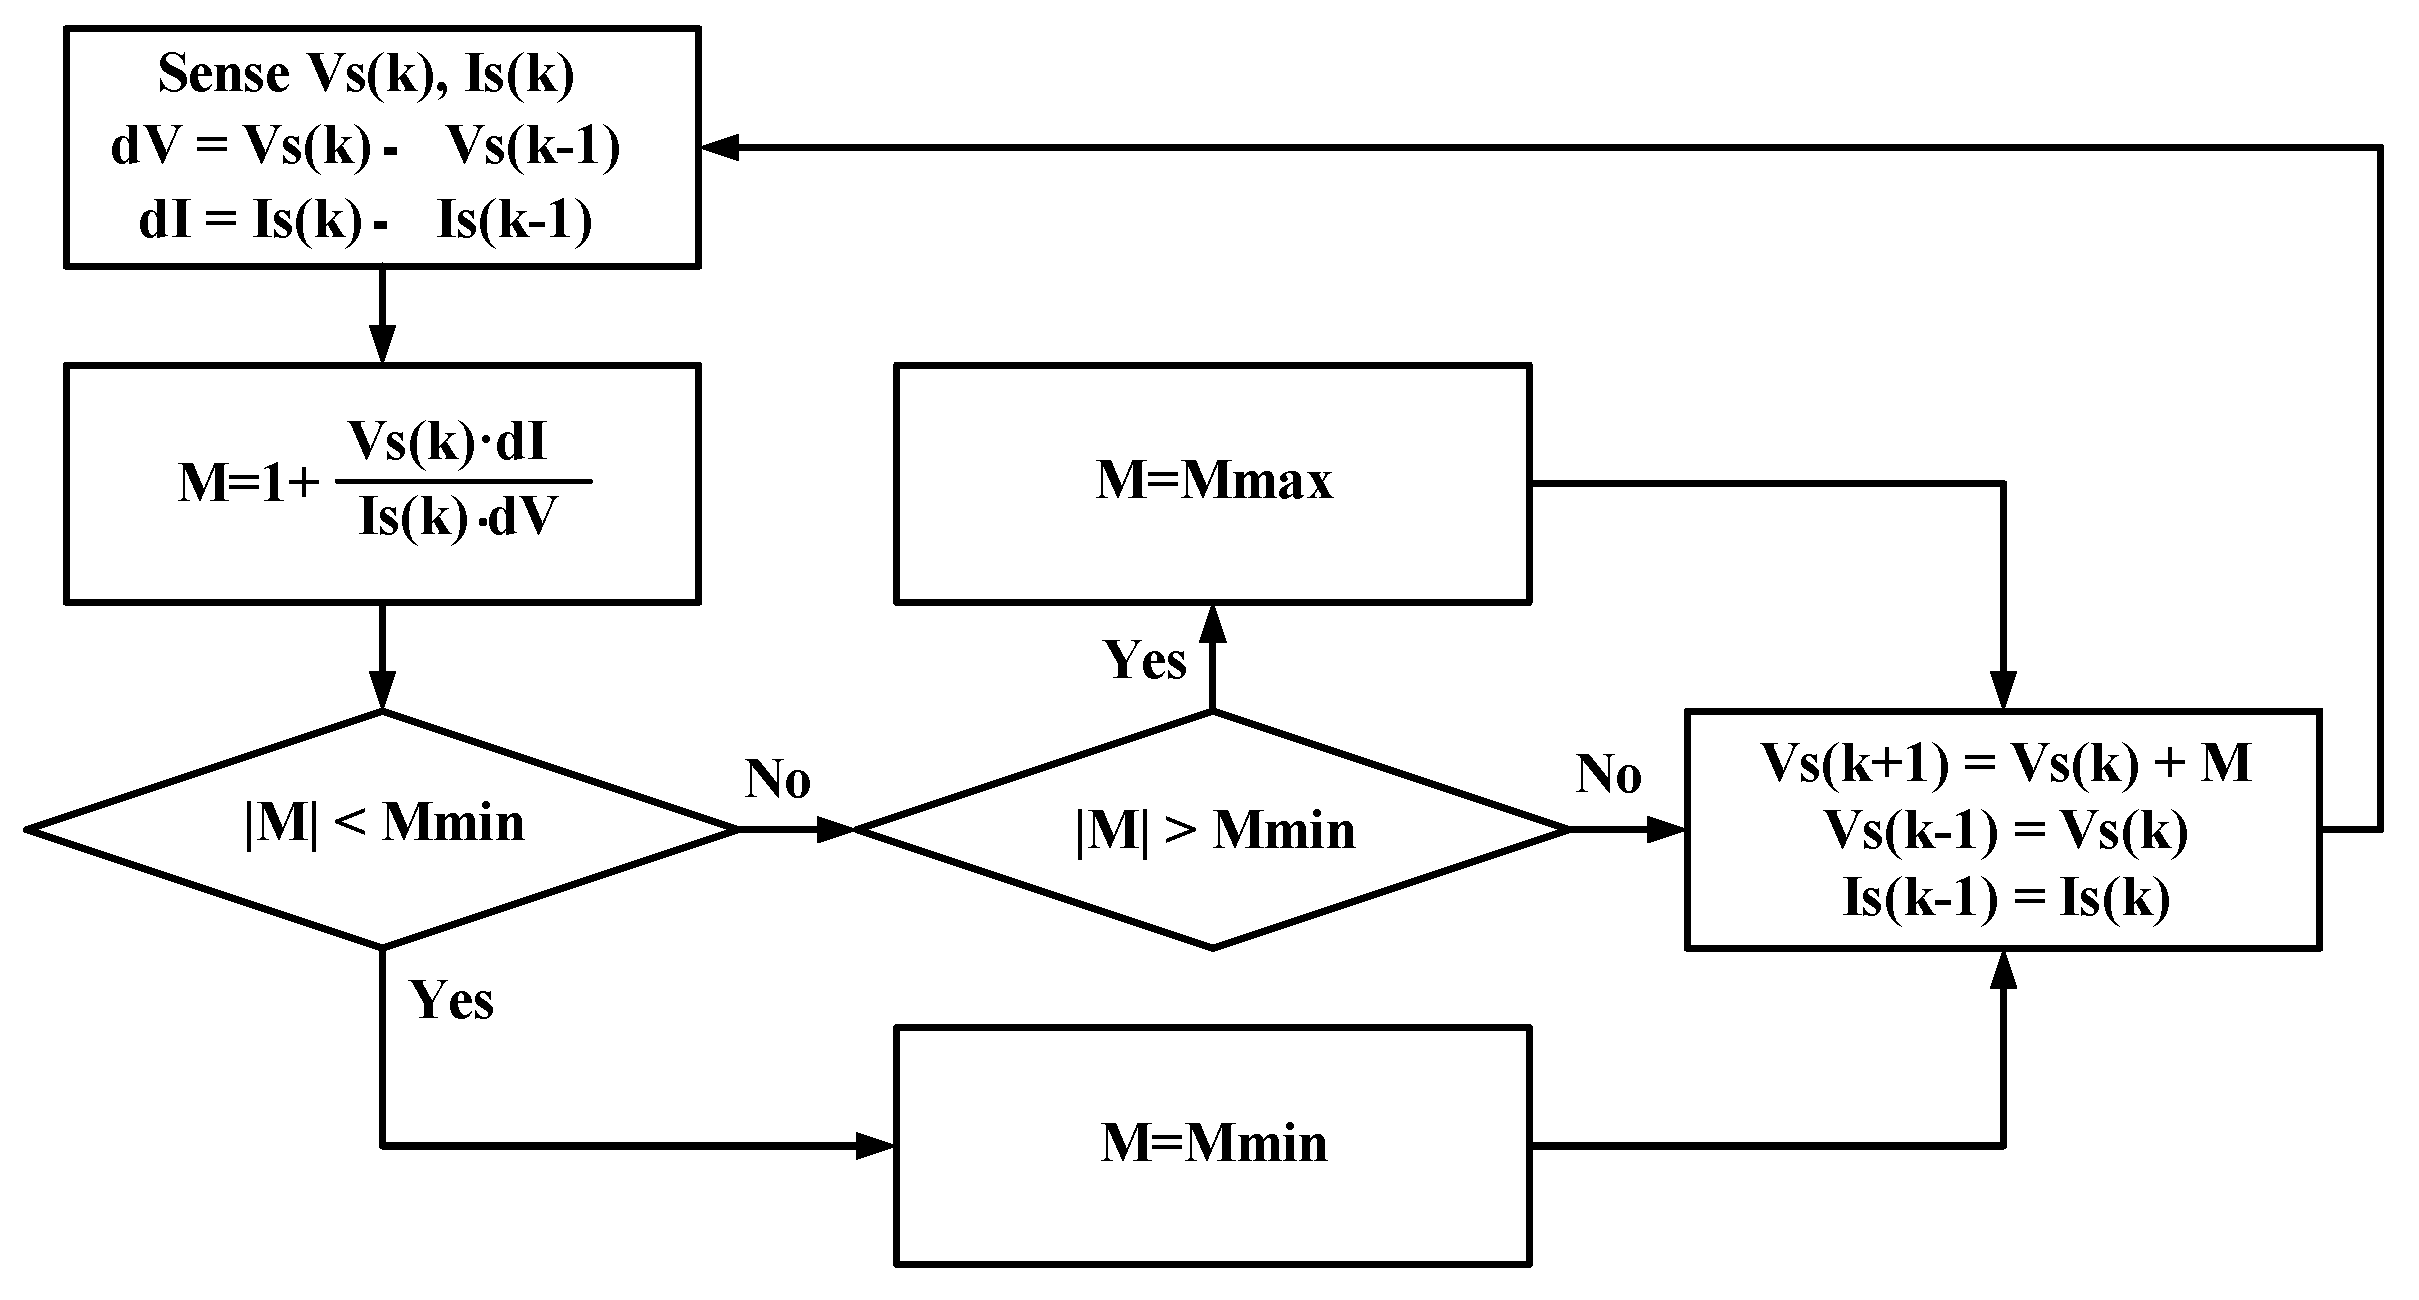
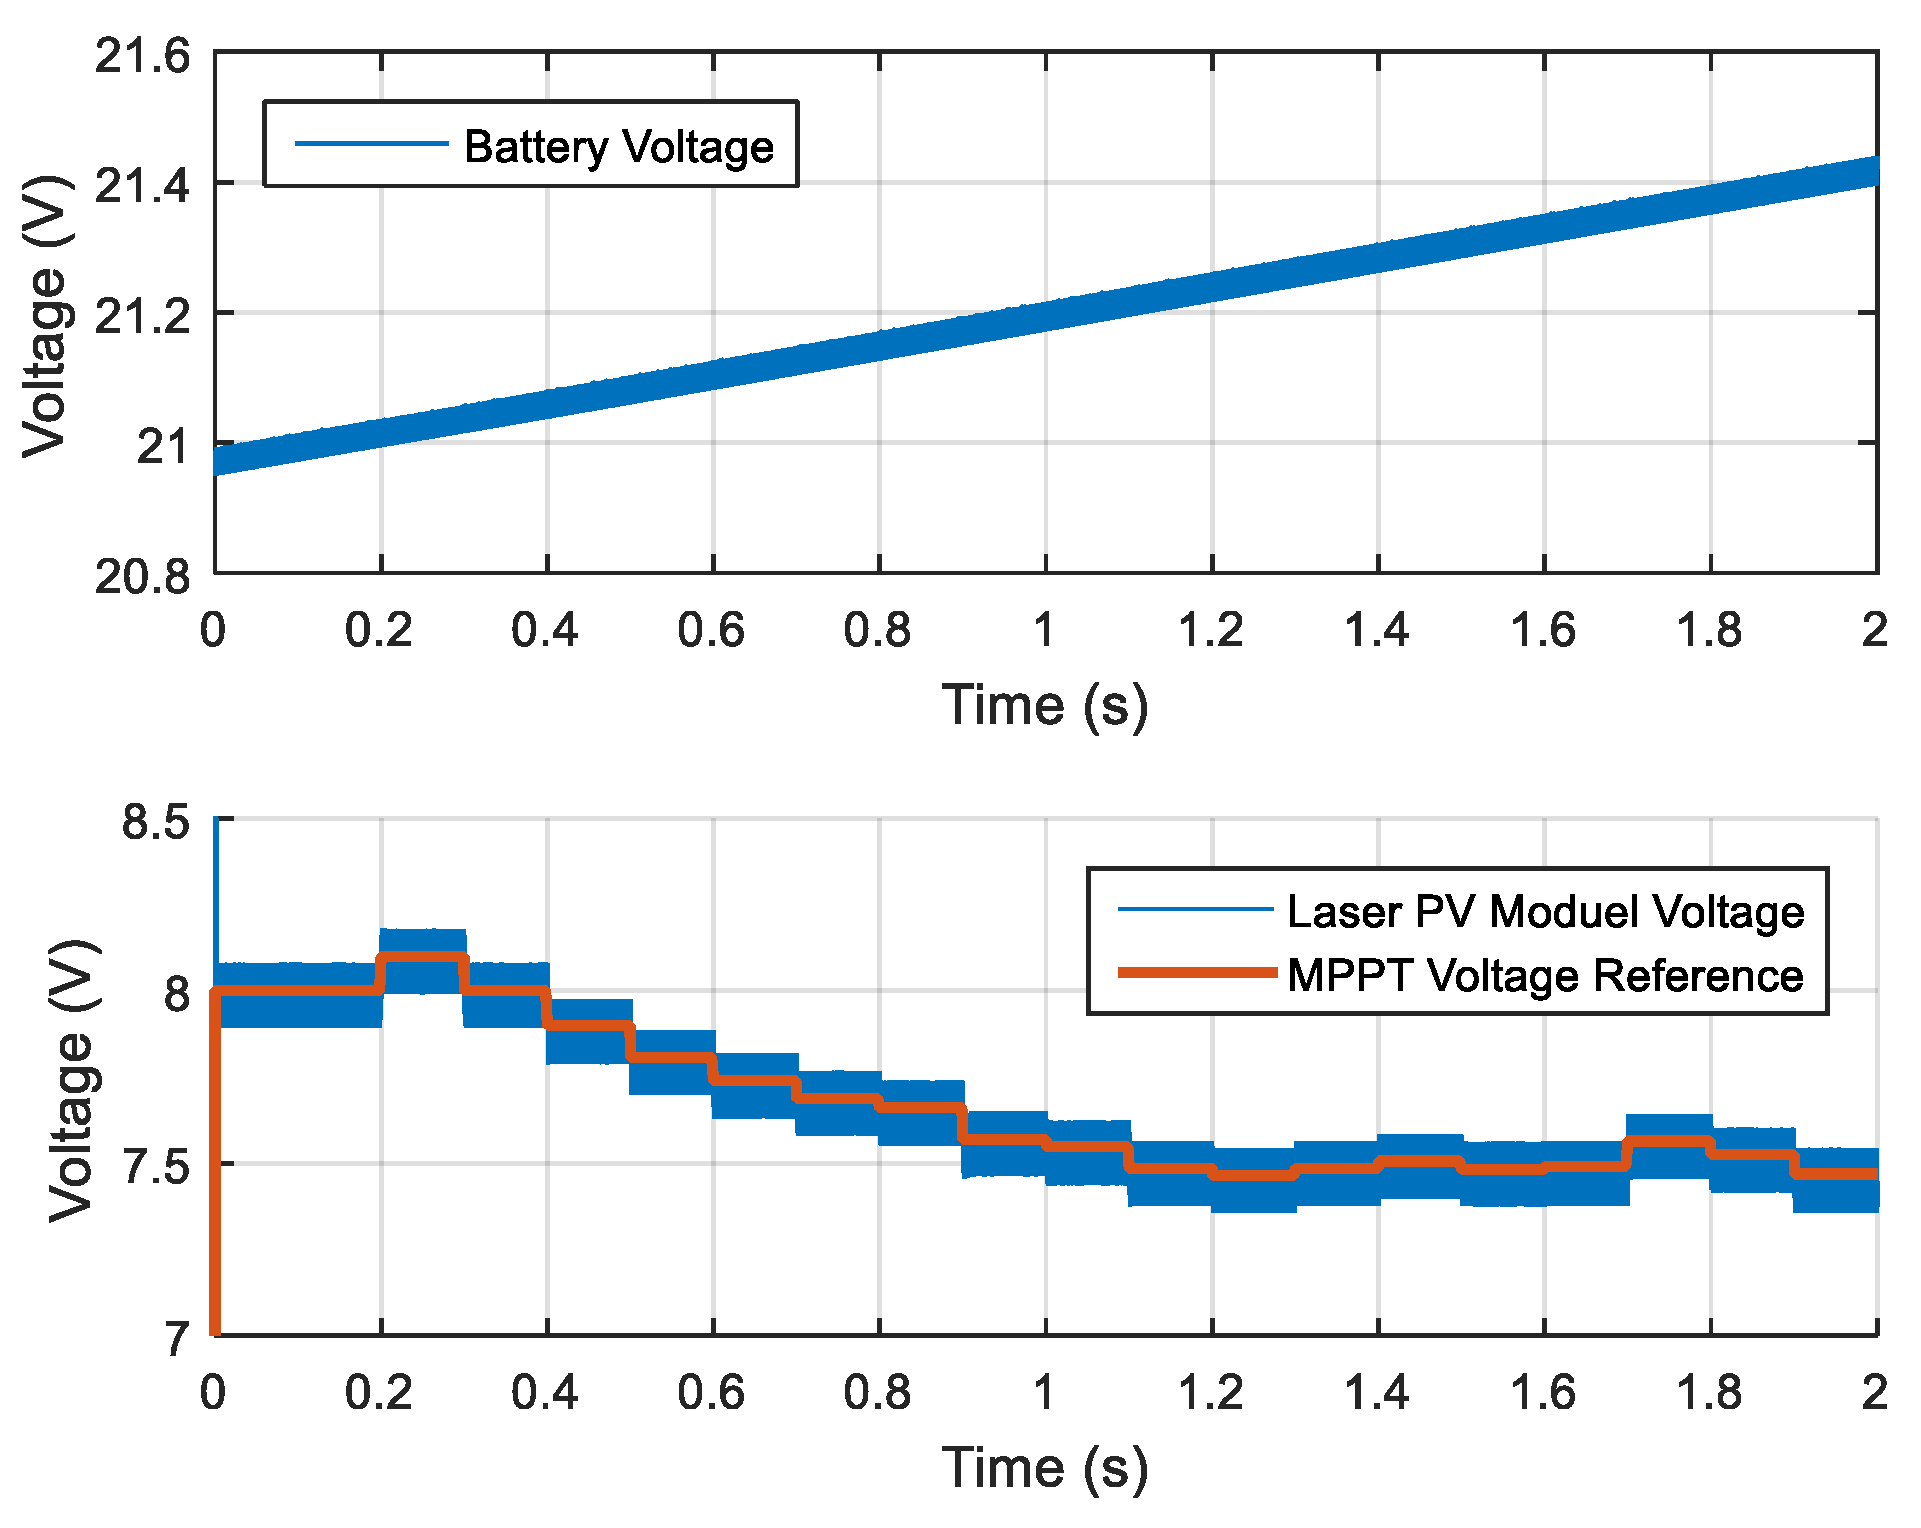
2.3. MPPT Algorithm Design
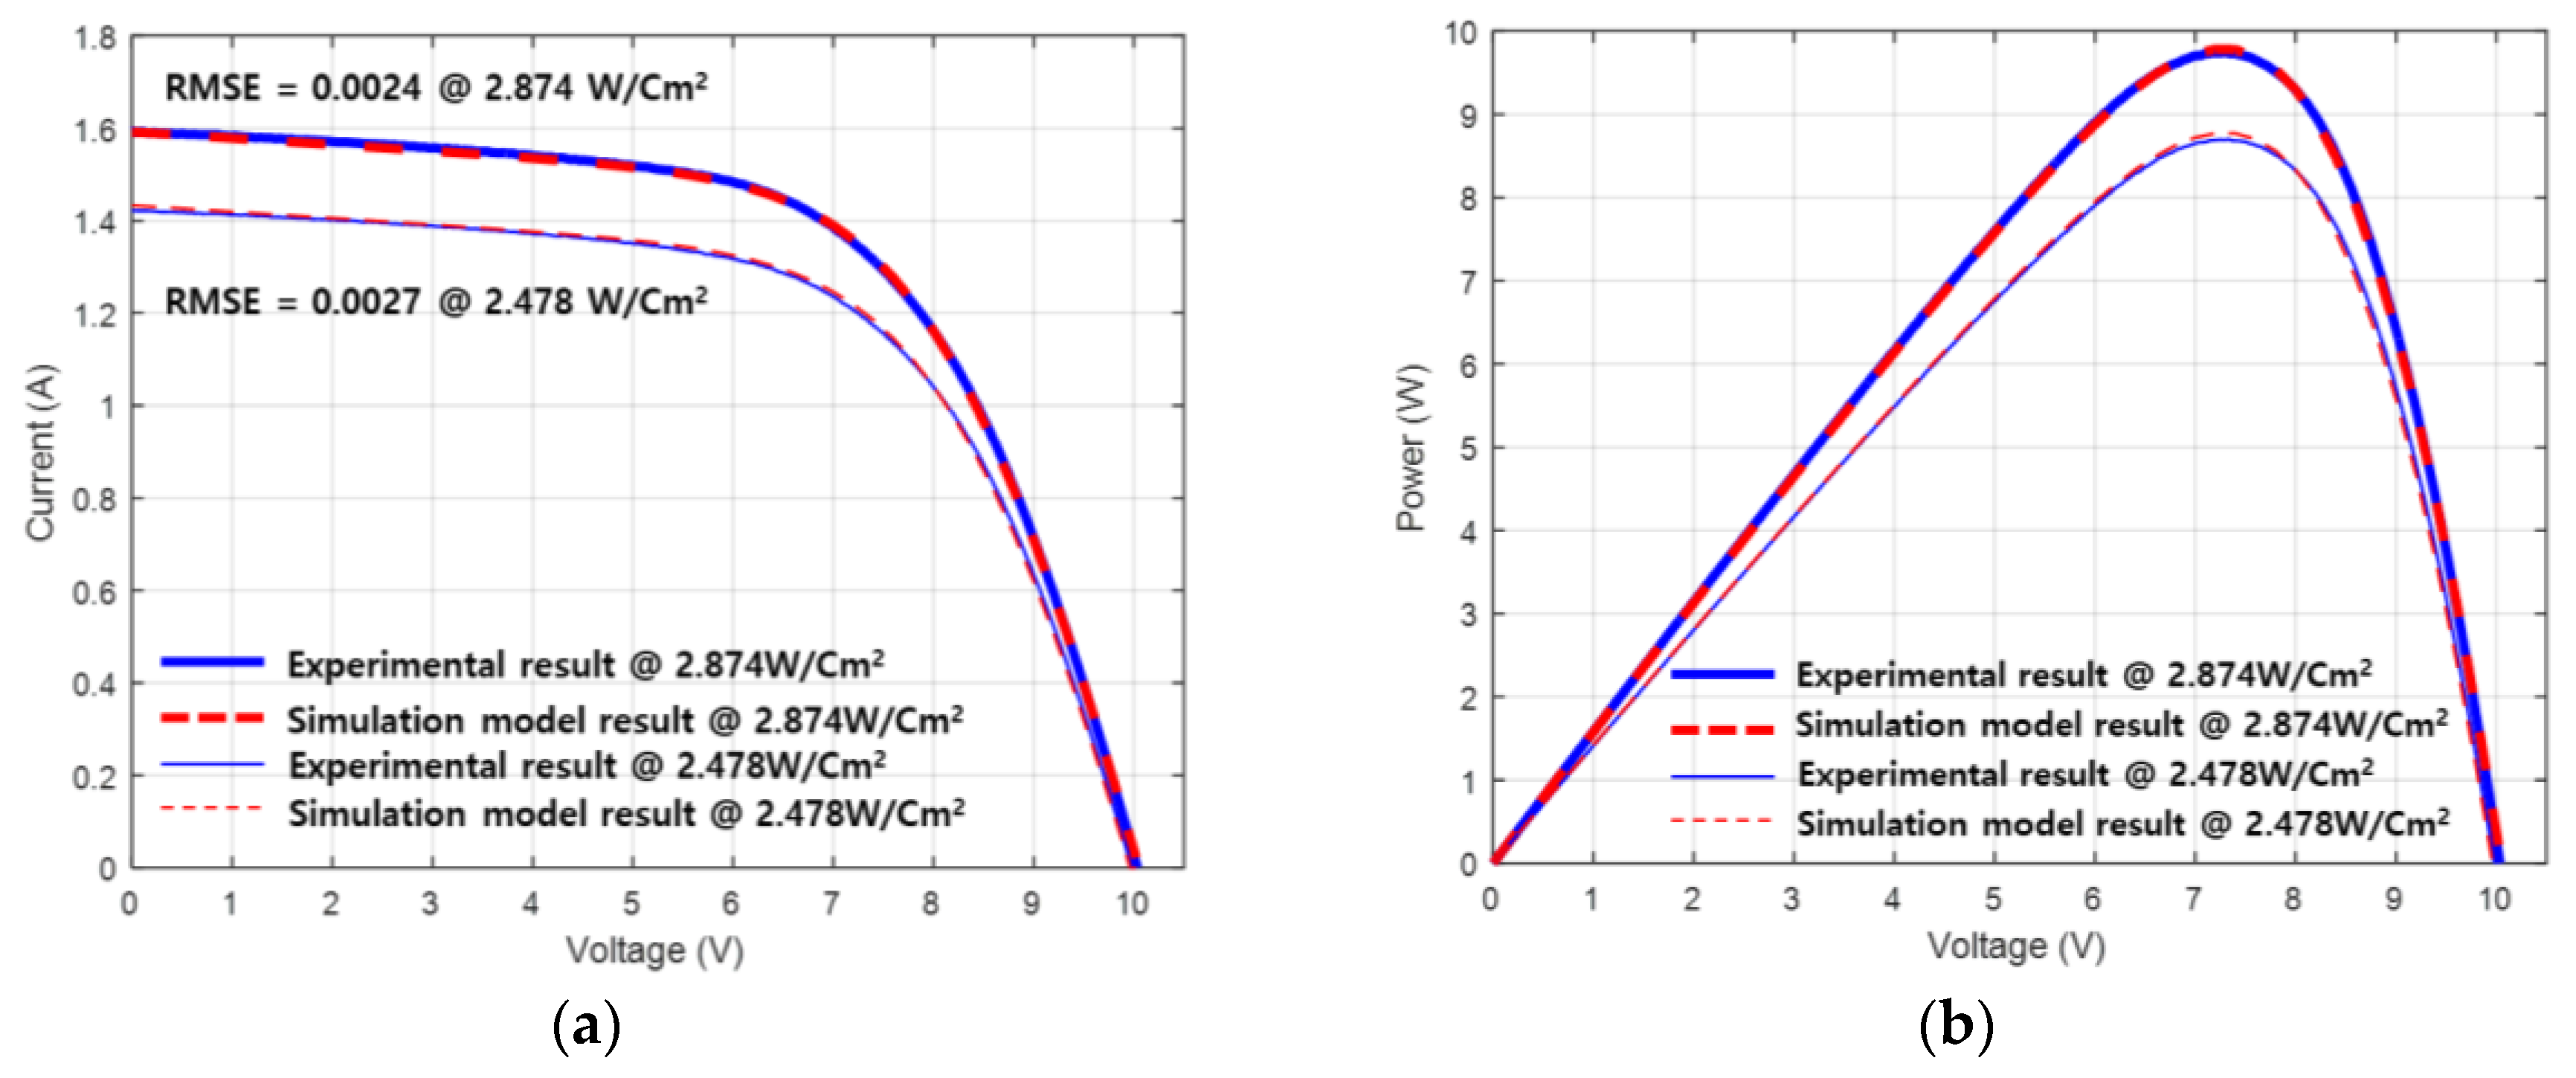
3. Simulation and Experimental Results
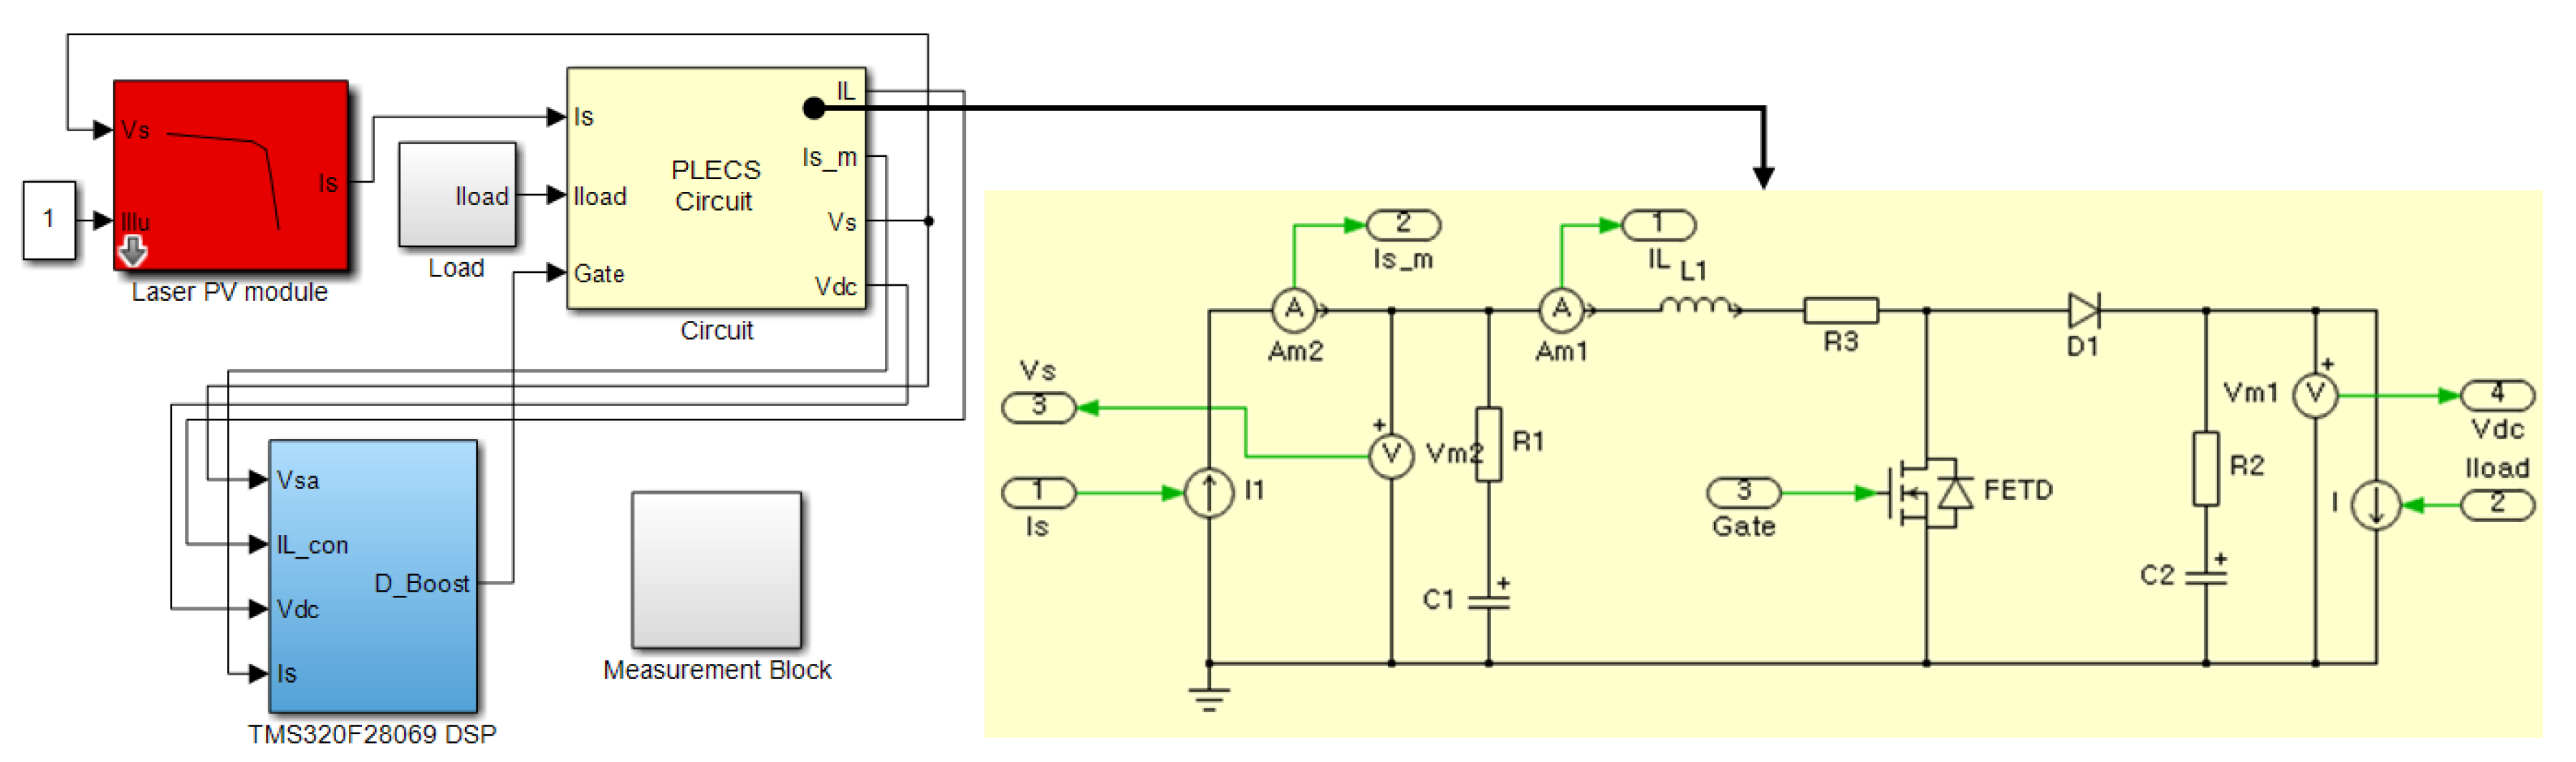
3.1. Simulation Result
3.2. Experimental Results
4. Conclusions
Author Contributions
Funding
Conflicts of Interest
References
- Jin, K.; Zhou, W. Wireless Laser Power Transmission: A Review of Recent Progress. IEEE Trans. Power Electron. 2019, 34, 3842–3859. [Google Scholar] [CrossRef]
- El Rayes, M.M.; Fayoum University; Nagib, G.; Abdelaal, W.G.A. A Review on Wireless Power Transfer. Int. J. Eng. Trends Technol. 2016, 40, 272–280. [Google Scholar] [CrossRef]
- Rhee, D.-H.; Kim, S.-M. Study on a Laser Wireless Power Charge Technology. J. Korea Inst. Electron. Commun. Sci. 2016, 11, 1219–1224. [Google Scholar] [CrossRef] [Green Version]
- Nayagam, V.S.; Premalatha, L. Optimization of power losses in electric vehicle battery by wireless charging method with consideration of the laser optic effect. Meas. Control. 2020, 53, 441–453. [Google Scholar]
- Kim, Y.; Shin, H.-B.; Lee, W.-H.; Jung, S.H.; Kim, C.Z.; Kim, H.; Lee, Y.T.; Kang, H.K. 1080 nm InGaAs laser power converters grown by MOCVD using InAlGaAs metamorphic buffer layers. Sol. Energy Mater. Sol. Cells 2019, 200, 109984. [Google Scholar] [CrossRef]
- Helmers, H.; Bett, A.W. Photovoltaic Laser Power Converters for Wireless Optical Power Supply of Sensor Systems. In Proceedings of the 2016 IEEE International Conference on Wireless for Space and Extreme Environments (WiSEE), Aachen, Germany, 26–28 September 2016; pp. 152–154. [Google Scholar]
- Zhang, Q.; Fang, W.; Liu, Q.; Wu, J.; Xia, P.; Yang, L. Distributed Laser Charging: A Wireless Power Transfer Approach. IEEE Internet Things J. 2018, 5, 3853–3864. [Google Scholar] [CrossRef] [Green Version]
- Zhang, Y.; Chaminda, P.D.; Zhao, K.; Cheng, L.; Jiang, Y.; Peng, K. MPPT Algorithm Development for Laser Powered Surveillance Camera Power Supply Unit. In Proceedings of the IOP Conference Series: Materials Science and Engineering, Shanghai, China, 28–29 December 2017; Volume 322, pp. 1–6. [Google Scholar]
- MFSC-200 Datasheet. Available online: http://en.maxphotonics.com/ (accessed on 20 September 2020).
- Bae, H.; Lee, J.; Park, S.; Cho, B. Large-signal stability analysis of solar array power system. IEEE Trans. Aerosp. Electron. Syst. 2008, 44, 538–547. [Google Scholar]
- Cho, B.H.; Lee, J.R.; Lee, F.C.Y. Large-signal stability analysis of spacecraft power processing systems. IEEE Trans. Power Electron. 1990, 5, 110–116. [Google Scholar] [CrossRef]
- Lee, J.H.; Bae, H.S.; Cho, B.H. Resistive Control for a Photovoltaic Battery Charging System Using a Microcontroller. IEEE Trans. Ind. Electron. 2008, 55, 2767–2775. [Google Scholar] [CrossRef]
- Polivka, W.M.; Chetty, P.R.K.; Middlebrook, R.D. State-space average modeling of converters with parasitic and storage-time modulation. In Proceedings of the IEEE Power Electronics Specialist Conference, Atlanta, GA, USA, 16–20 June 1980; pp. 119–143. [Google Scholar]
- Kazimierczuk, M.K. Pulse-Width Modulated DC-DC Power Converters; Wiley: Hoboken, NJ, USA, 2008. [Google Scholar]
- Lee, J.H.; Bae, H.; Cho, B.H. Advanced Incremental Conductance MPPT Algorithm with a Variable Step Size. In Proceedings of the 2006 12th International Power Electronics and Motion Control Conference, Portoroz, Slovenia, 30 August–1 September 2006; pp. 603–607. [Google Scholar]
- Rathod, Y.; Hughes, L. Simulating the charging of electric vehicles by laser. Procedia Comput. Sci. 2019, 155, 527–534. [Google Scholar] [CrossRef]
- Sheng, H.; Li, C.; Wang, H.; Yan, Z.; Xiong, Y.; Cao, Z.; Kuang, Q. Parameters Extraction of Photovoltaic Models Using an Improved Moth-Flame Optimization. Energies 2019, 12, 3527. [Google Scholar] [CrossRef] [Green Version]
- Anani, N.; Ibrahim, H. Performance Evaluation of Analytical Methods for Parameters Extraction of Photovoltaic Generators. Energies 2020, 13, 4825. [Google Scholar] [CrossRef]
- PLECS Software. Available online: https://www.plexim.com/ (accessed on 20 September 2020).


| Parameters | Values | Parameters | Values |
|---|---|---|---|
| Isc | 1.61 A @ 2.478 W/cm2 | q | |
| Voc | 0.628 V/cell | K | |
| Rs | 50 mΩ/cell | T | 298.15 K |
| Rsh | 4.5 Ω | n | 1.8 |
| Ns | 16 |
| Name of Device/Manufacturer | Rating/Values | |
|---|---|---|
| Laser Source | Max MFSC 200 W-300 L Air Cooling Fiber | Power range 0–140 W Central wavelength 1080 nm |
| Laser Receiving Panel | Custom-made PV module | Voc: 10 V, Isc: 1.6 A @ 2.478 W/cm2 |
| Electronic Load | ITECH LT8511 | 120 V/30 A |
| Battery | Skyholic Li-polymer battery | Nominal 22.2 V, 4.5 Ah |
| Battery Charging Boost Converter | Input/Output Range | Input: 3–15 V/~3.5 A Output: 16.2–25.2 V/1 A |
| Inductor | 30 µH | |
| Input/Output Capacitor | 100 µF/220 µF | |
| Switching Frequency | 90 kHz |
Publisher’s Note: MDPI stays neutral with regard to jurisdictional claims in published maps and institutional affiliations. |
© 2020 by the authors. Licensee MDPI, Basel, Switzerland. This article is an open access article distributed under the terms and conditions of the Creative Commons Attribution (CC BY) license (http://creativecommons.org/licenses/by/4.0/).
Share and Cite
Lee, S.; Lim, N.; Choi, W.; Lee, Y.; Baek, J.; Park, J. Study on Battery Charging Converter for MPPT Control of Laser Wireless Power Transmission System. Electronics 2020, 9, 1745. https://doi.org/10.3390/electronics9101745
Lee S, Lim N, Choi W, Lee Y, Baek J, Park J. Study on Battery Charging Converter for MPPT Control of Laser Wireless Power Transmission System. Electronics. 2020; 9(10):1745. https://doi.org/10.3390/electronics9101745
Chicago/Turabian StyleLee, Seongjun, Namgyu Lim, Wonseon Choi, Yongtak Lee, Jongbok Baek, and Jungsoo Park. 2020. "Study on Battery Charging Converter for MPPT Control of Laser Wireless Power Transmission System" Electronics 9, no. 10: 1745. https://doi.org/10.3390/electronics9101745