Article

Energy Management of Solar-Powered Aircraft-Based High Altitude Platform for Wireless Communications

by
Steve Chukwuebuka Arum
1,*,
David Grace
1,
Paul Daniel Mitchell
1,
Muhammad Danial Zakaria
2 and
Nils Morozs
1
1
Deparment of Electronic Engineering, University of York, York YO10 5DD, UK
2
Faculty of Informatics and Computing, Universiti Sultan Zainal Abidin, Tembila Campus Terengganu, Terengganu 21300, Malaysia
*
Author to whom correspondence should be addressed.
Electronics 2020, 9(1), 179; https://doi.org/10.3390/electronics9010179
Submission received: 17 December 2019 / Revised: 14 January 2020 / Accepted: 15 January 2020 / Published: 18 January 2020
(This article belongs to the Section Microwave and Wireless Communications)

Abstract

:
With the increasing interest in wireless communications from solar-powered aircraft-based high altitude platforms (HAPs), it is imperative to assess the feasibility of their deployment in different locations with the constraints on energy consumption and payload weight under consideration. This paper considers the energy management of solar-powered aircraft-based HAPs for wireless communications service provisioning in equatorial regions and regions further up the northern hemisphere. The total solar energy harvested and consumed on the shortest day of the year is analyzed, and it is explained how this determines the feasibility of long endurance, semi-permanent missions. This takes into account the different aircraft-based HAPs and the energy storage systems currently available, and how these can be deployed for wireless communications. We show that the solar-powered HAPs are energy and weight limited, and this depends largely on the platform’s wingspan available for the deployment of solar collectors. Our analysis show that services can be provided for a duration of 15–24 h/day using current platforms, with wingspans ranging between 25–35 m, depending on the configuration and coverage radius. Furthermore, we show that doubling an aircraft’s wingspan can increase its payload capacity by a factor of 6, which in turn enhances its feasibility for wireless communications.

1. Introduction

There is a significantly increasing interest in the use of solar-powered high altitude platforms HAPs for a range of applications including wireless communications, earth observation, environmental monitoring and atmospheric studies [1,2,3,4,5], especially since the first solar-powered aircraft-based HAP was successfully deployed [5]. Energy management is a fundamental task of such systems that needs careful consideration to make them operational. Specifically, the paper focuses on energy management of HAPs deployed as base stations for wireless communication between ground-based users, as opposed to air-to-air or air-to-ground communication. For continuous operation throughout the desired mission duration, the energy requirements of the wireless communication subsystem govern how much solar energy is needed to maintain flight and support the payload during the day, and how much solar energy needs to be harvested and stored for night usage. The paper explores the current state-of-the-art in energy storage systems and solar cells needed and investigates whether this is sufficient for future operations. This requires adequate solar energy harvesting and consumption modelling for both platform and payload. Solar-powered HAPs use energy harvested by solar cells during the day to maintain flight, while any excess is stored in an energy storage system for night-time operation [6,7,8]. The harvested energy is dependent on the incident angle of the sun’s rays on the solar cells, the duration of daylight, air mass [5] and latitude of the cells. Therefore, different capabilities and configurations of HAPs are needed for operations in different locations considering the latitude dependent solar irradiance.

1.1. Related Literature

While numerous studies [9,10,11,12] discuss the design and performance of solar-powered aircraft, most focus on aeronautics. A few studies [13,14] consider solar cell energy harvesting in relation to solar-powered aircraft. However, while the emphasis of [13] is on aerodynamic structural design of solar powered HAP, the authors in [14] focus on the solar energy performance of smaller aircraft of 1 m wingspan. Understanding energy harvesting requires a realistic energy model for HAPs. Early studies [8,15] on electrical systems and components at high altitude, considering the most significant energy consuming subsystems, suggest that solar cells at high altitude can potentially harvest enough energy to support an aircraft. Using a tethered aerostatic high-altitude platform, a solar energy harvesting model is proposed in [16]. The harvested energy is transmitted to the ground using a power cable attached to the platform tether. The proposed model is based on tropospheric altitudes and expresses instantaneous solar intensity as a function of the atmospheric extinction parameter. This model cannot be straightforwardly used for HAPs operating in stratospheric altitudes due to the dissimilarity in the platform and altitude characteristics. Conversely, an energy model for stratospheric altitudes is developed in [17]. The model originally assumes that the aircraft is at ground level and then the resulting model is adjusted for stratospheric altitude, requiring parameters like refractive index and optical depth. The extrapolation of these parameter values can potentially introduce inaccuracies in the results. Thus, a reasonably accurate, realistic and less complex energy collection model based on extra-terrestrial radiation suitable for stratospheric applications is required.
With an appropriate energy harvesting model, this work requires a comparison between harvested energy and energy consumed by both the platform and payload. For viability, the average rate at which energy is consumed must be less than the average rate at which energy is harvested. In [1], the expression for power per wing area required for cruising is given. Energy consumption of a solar-powered aircraft during the climb phase of flight is discussed in [18]. Here, the analysis assumes that the aircraft is in a steady level flight. On the other hand, estimating the energy consumption of the HAP wireless communication payload also requires a realistic model. Unfortunately, there is no consumption model for HAP wireless communication payloads in the public domain, although a few models have been proposed for terrestrial base stations (BS). One of the most popular energy consumption models for a terrestrial BS was proposed by the Energy Aware Radio and neTwork tecHnologies (EARTH) project as a framework to evaluate the energy efficiency of a BS. The energy efficiency evaluation framework (E3F) computes LTE terrestrial BS power consumption as the summation of the individual power consumption of the baseband unit (BBU), radio frequency (RF) chains, power amplifiers (PA) and overhead [10,19]. The model is a function of bandwidth, the number of antennas, modulation scheme, traffic load factor, etc. Unfortunately, the model is not designed for a HAP communication system using phased array antenna systems. In [20], a consumption model for microcell and macrocell BSs is proposed, which is validated by real measurements considering different day and night loadings.

1.2. Contribution

Evaluating the viability of solar-powered HAPs for wireless communications requires the development of specific energy collection and consumption models. This work aims to facilitate the understanding of how the design and operation of solar-powered aircraft might affect the feasibility of providing wireless communications over varying areas with respect to power and weight limitations of the aircraft. This involves showing the necessary calculations required to highlight the methodology of using solar-powered HAPs, the lack of which in a wider sense has led to the failure of some HAP projects in the past. While significant work on the design of HAPs for wireless communications is ongoing in industry, there is a lack of details of the specific engineering involved in open literature. This paper aims to provide the much-needed information. In this regard, the contributions of this paper are as follows:
  • Development of an energy harvesting model for a solar-powered aircraft-based HAP suitable for wireless communication missions.
  • Development of an energy consumption model for a HAP BS payload using phased array antenna system for wireless communication.
  • Bringing together the necessary calculations for the first time in the public domain to show the methodology and feasibility of aircraft-based HAPs in different geographical locations.
  • Using the developed models to analyse the feasibility of the current state-of-the-art HAPs for wireless communications service delivery over an extended coverage area.
The remainder of this paper is structured as follows. Section 2 discusses the major components of the energy ecosystem for solar-powered HAPs deployed for wireless communications. In Section 3, an energy collection model is developed, which depends on the number of hours of daylight at a given latitude. Section 4 proposes energy consumption models for an aircraft considering the power required to maintain both steady horizontal flight and banked flight around a circle of a given radius. Additionally, an energy consumption model for HAP communication systems using phased array antennas is proposed. The feasibility of solar-powered HAPs for wireless communication service provisioning considering the system energy collection and consumption is highlighted in Section 5. In Section 6, the proposed models are analysed with respect to different HAP platforms and coverage configurations. Lastly, the paper is concluded in Section 7.

2. Solar-Powered HAP Energy Ecosystem

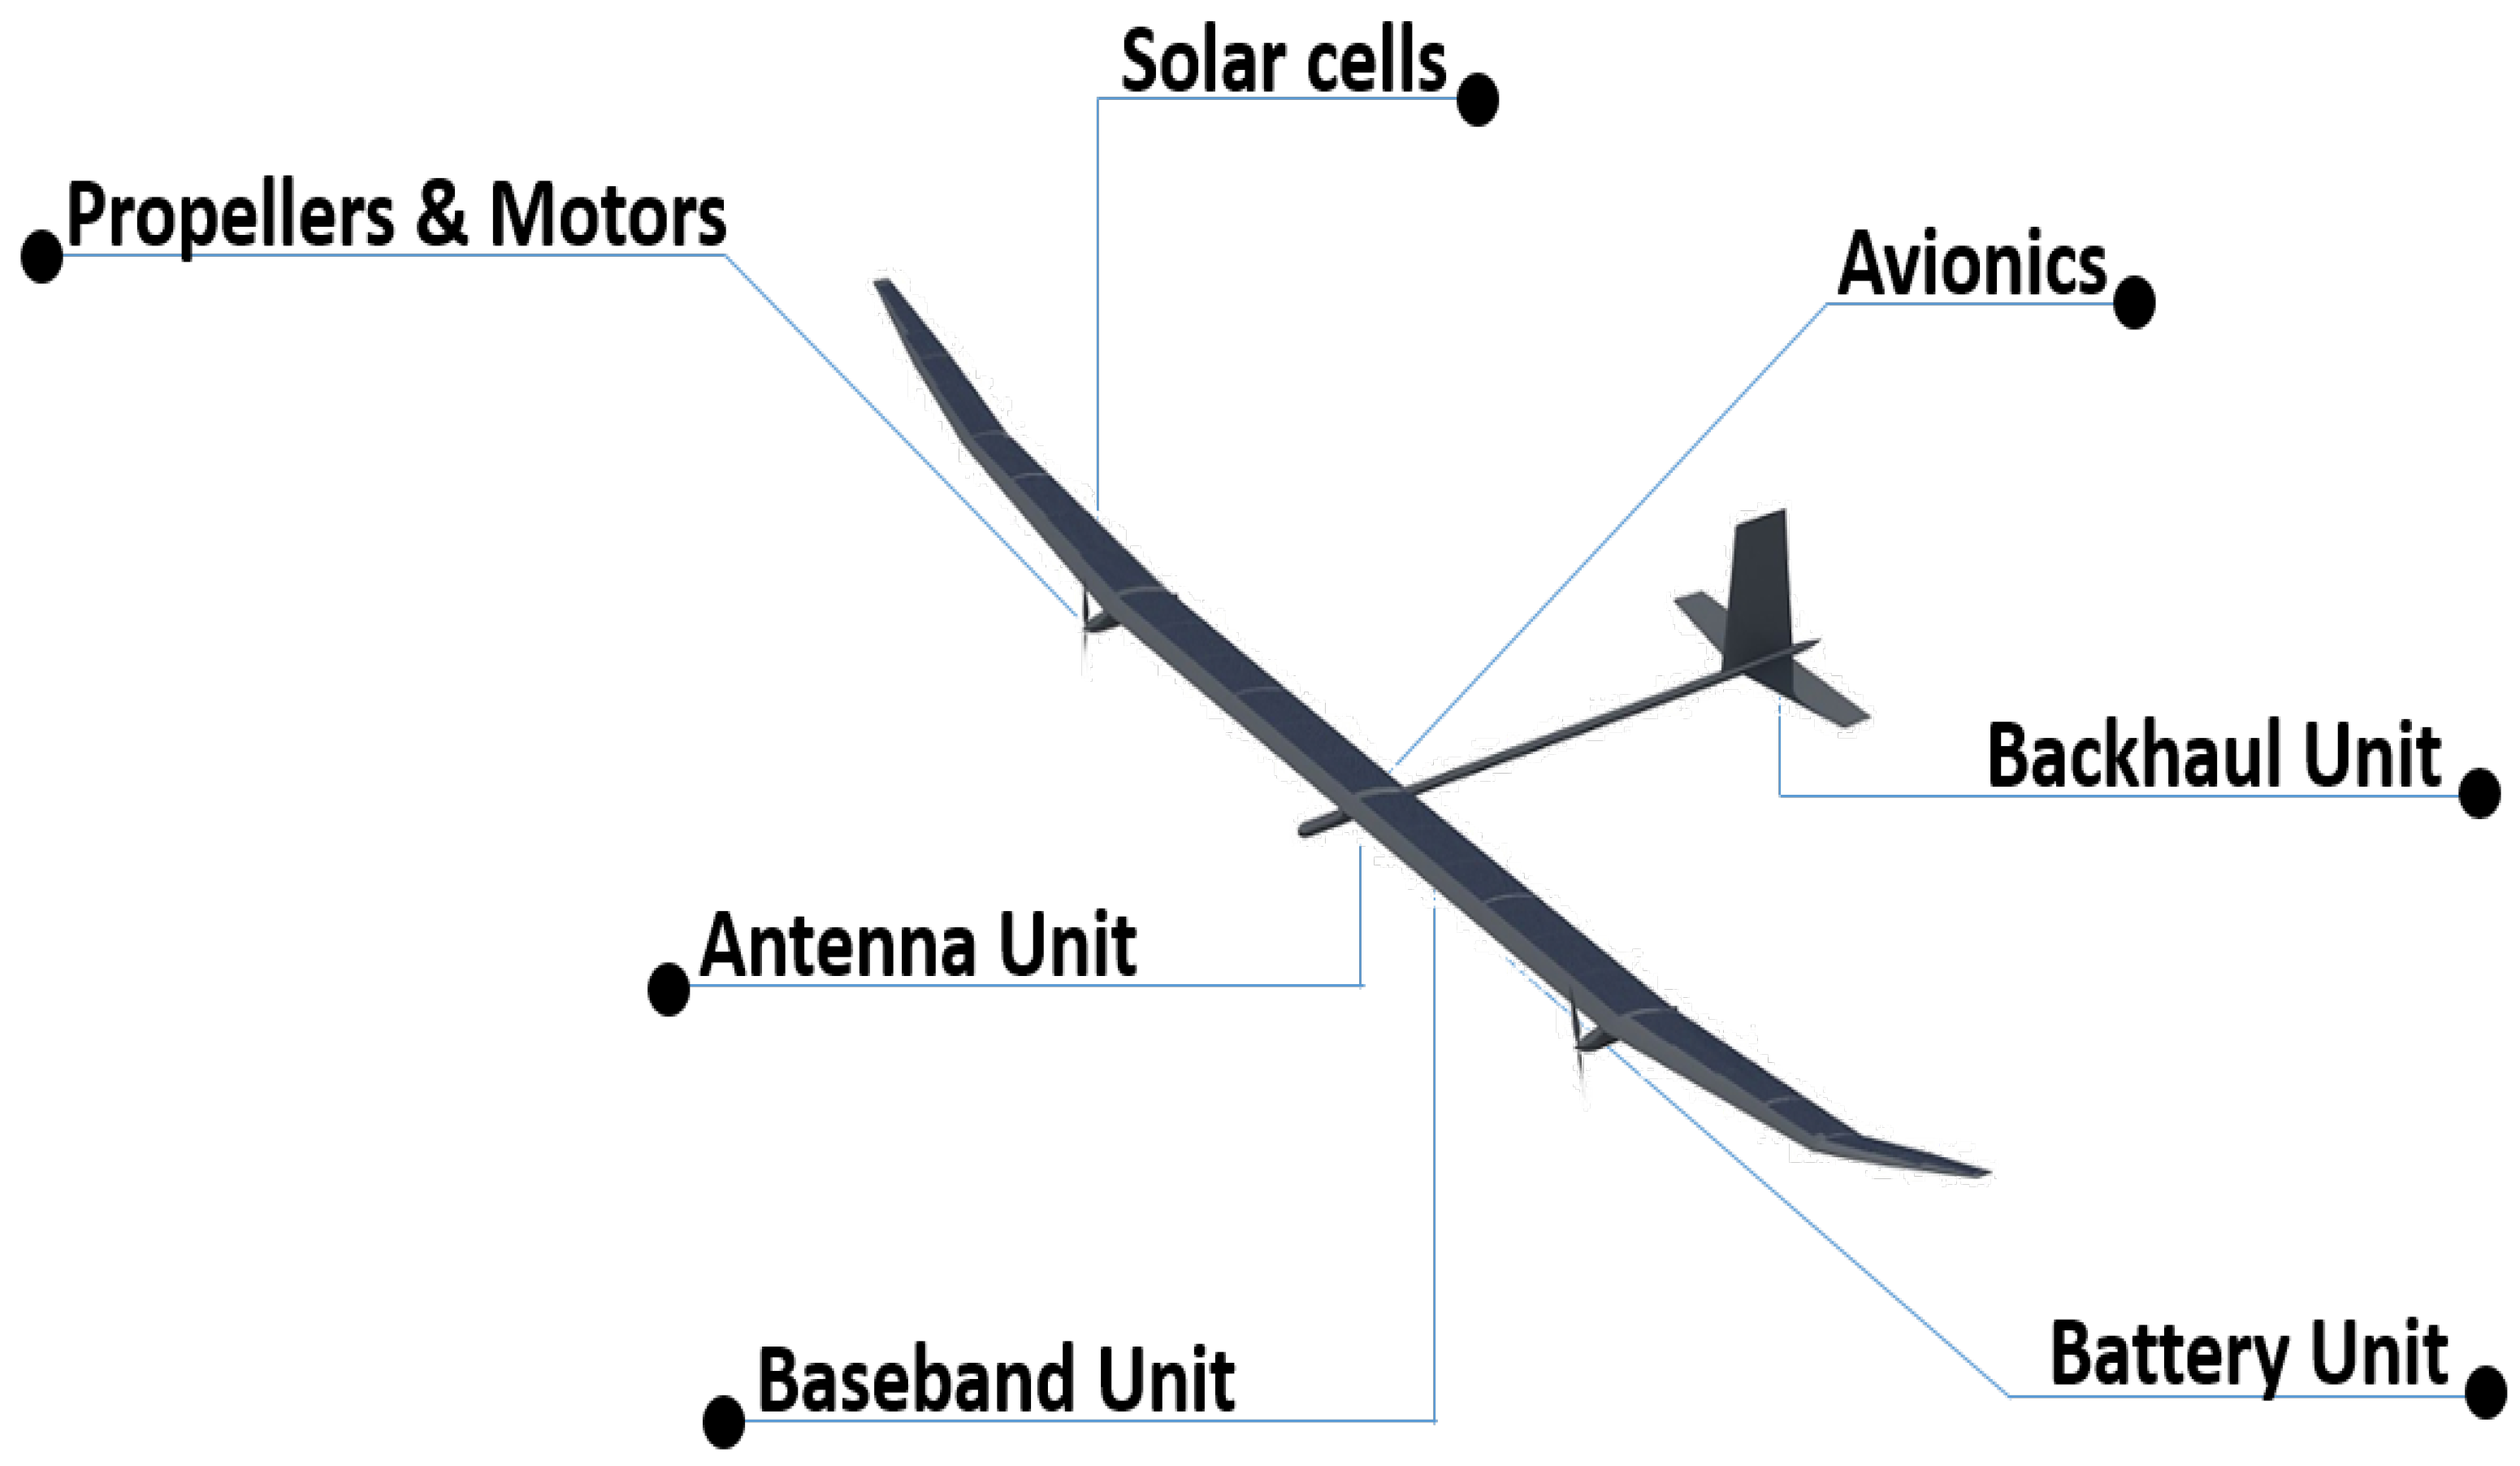
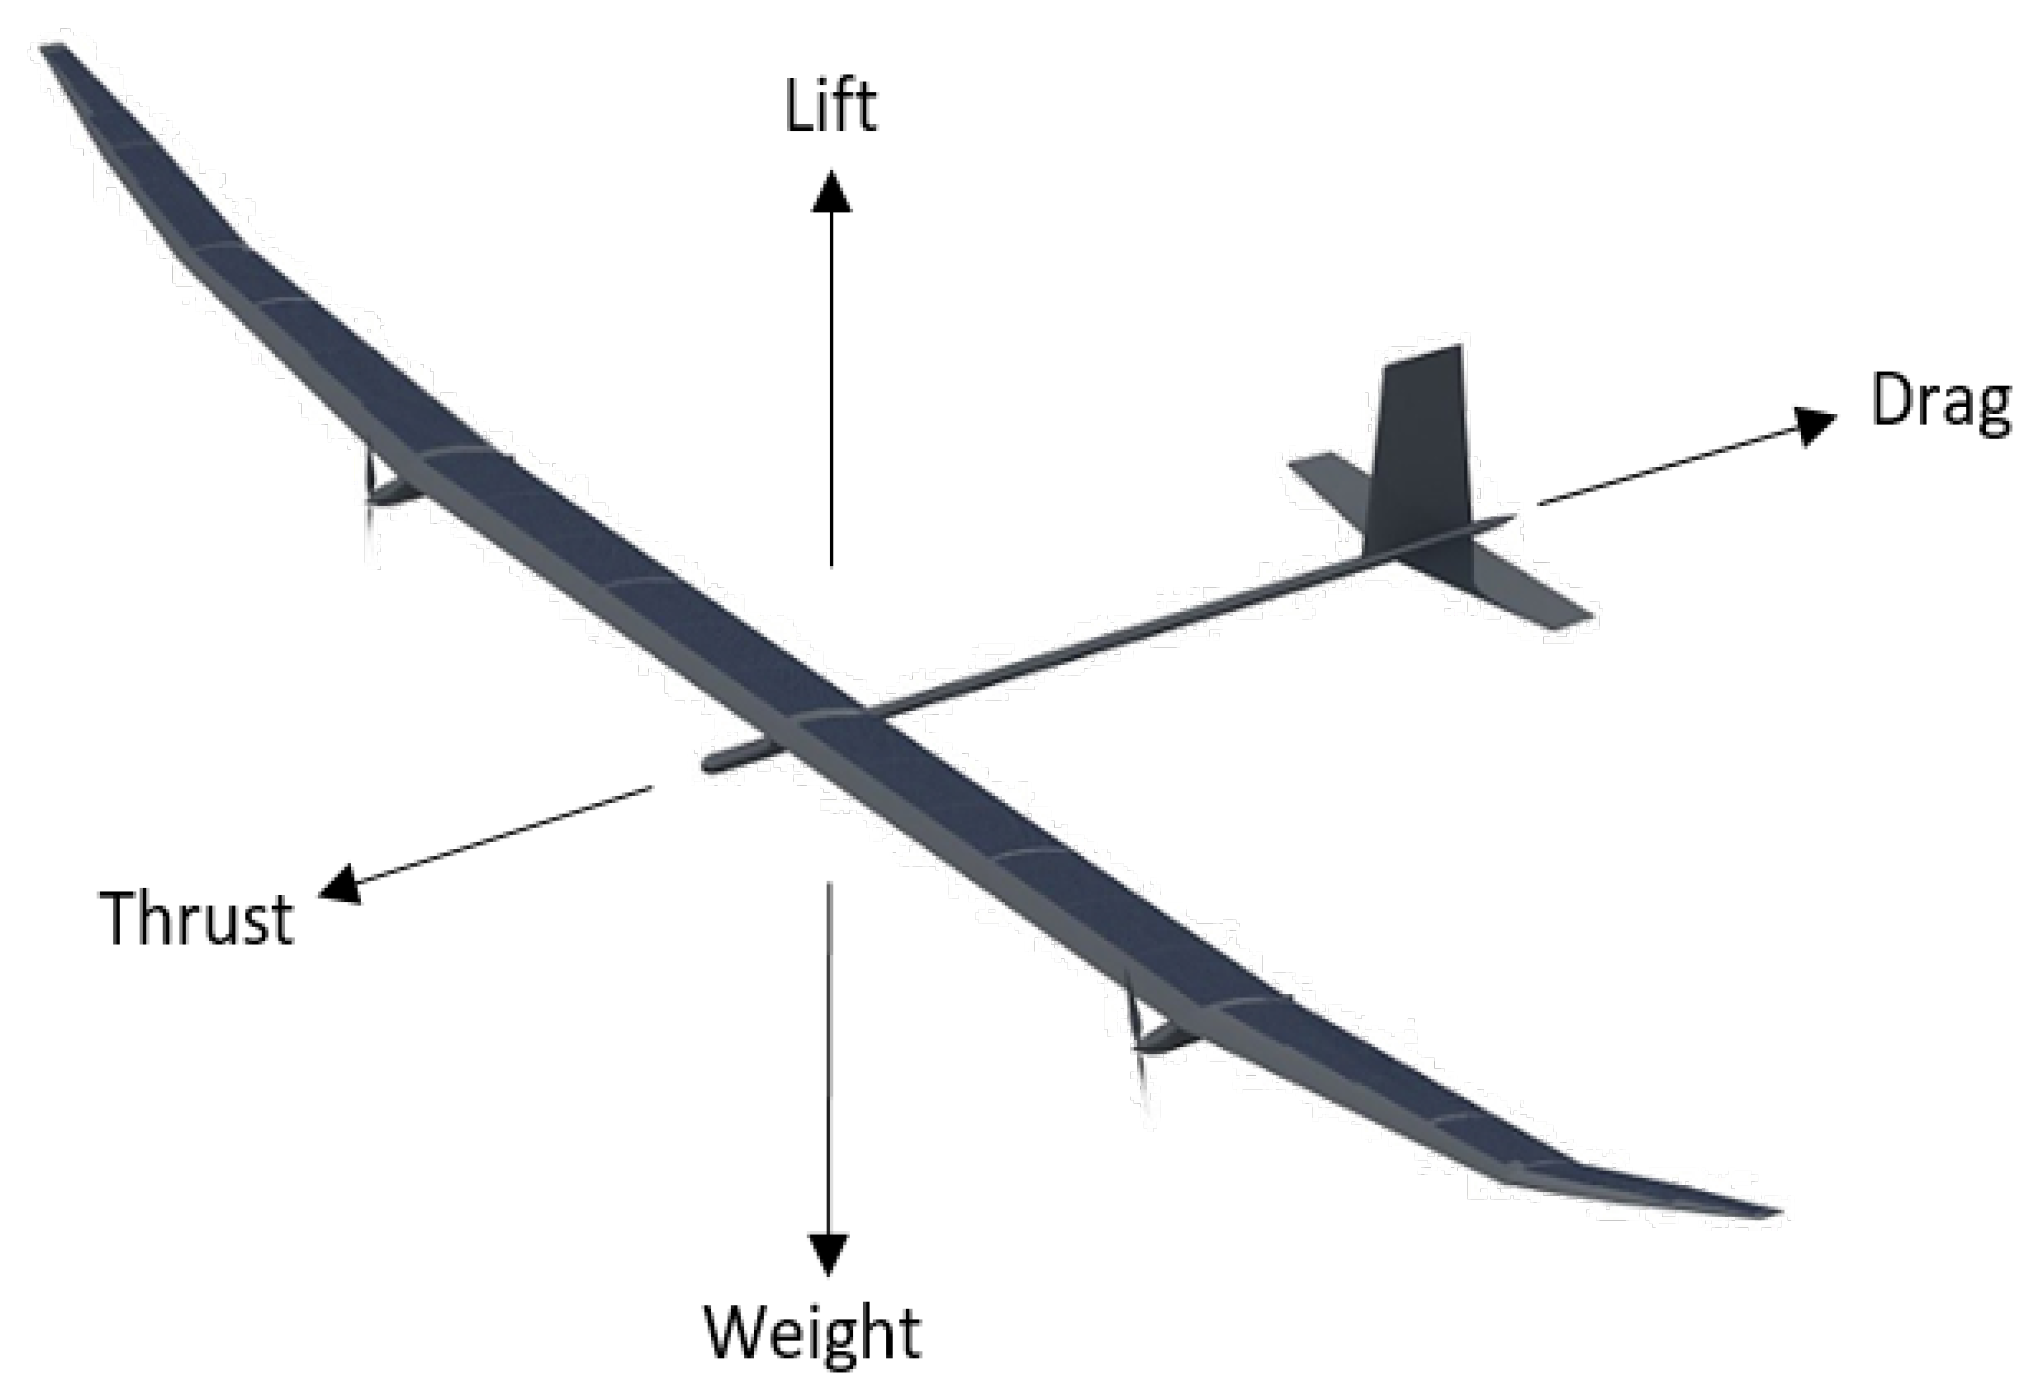
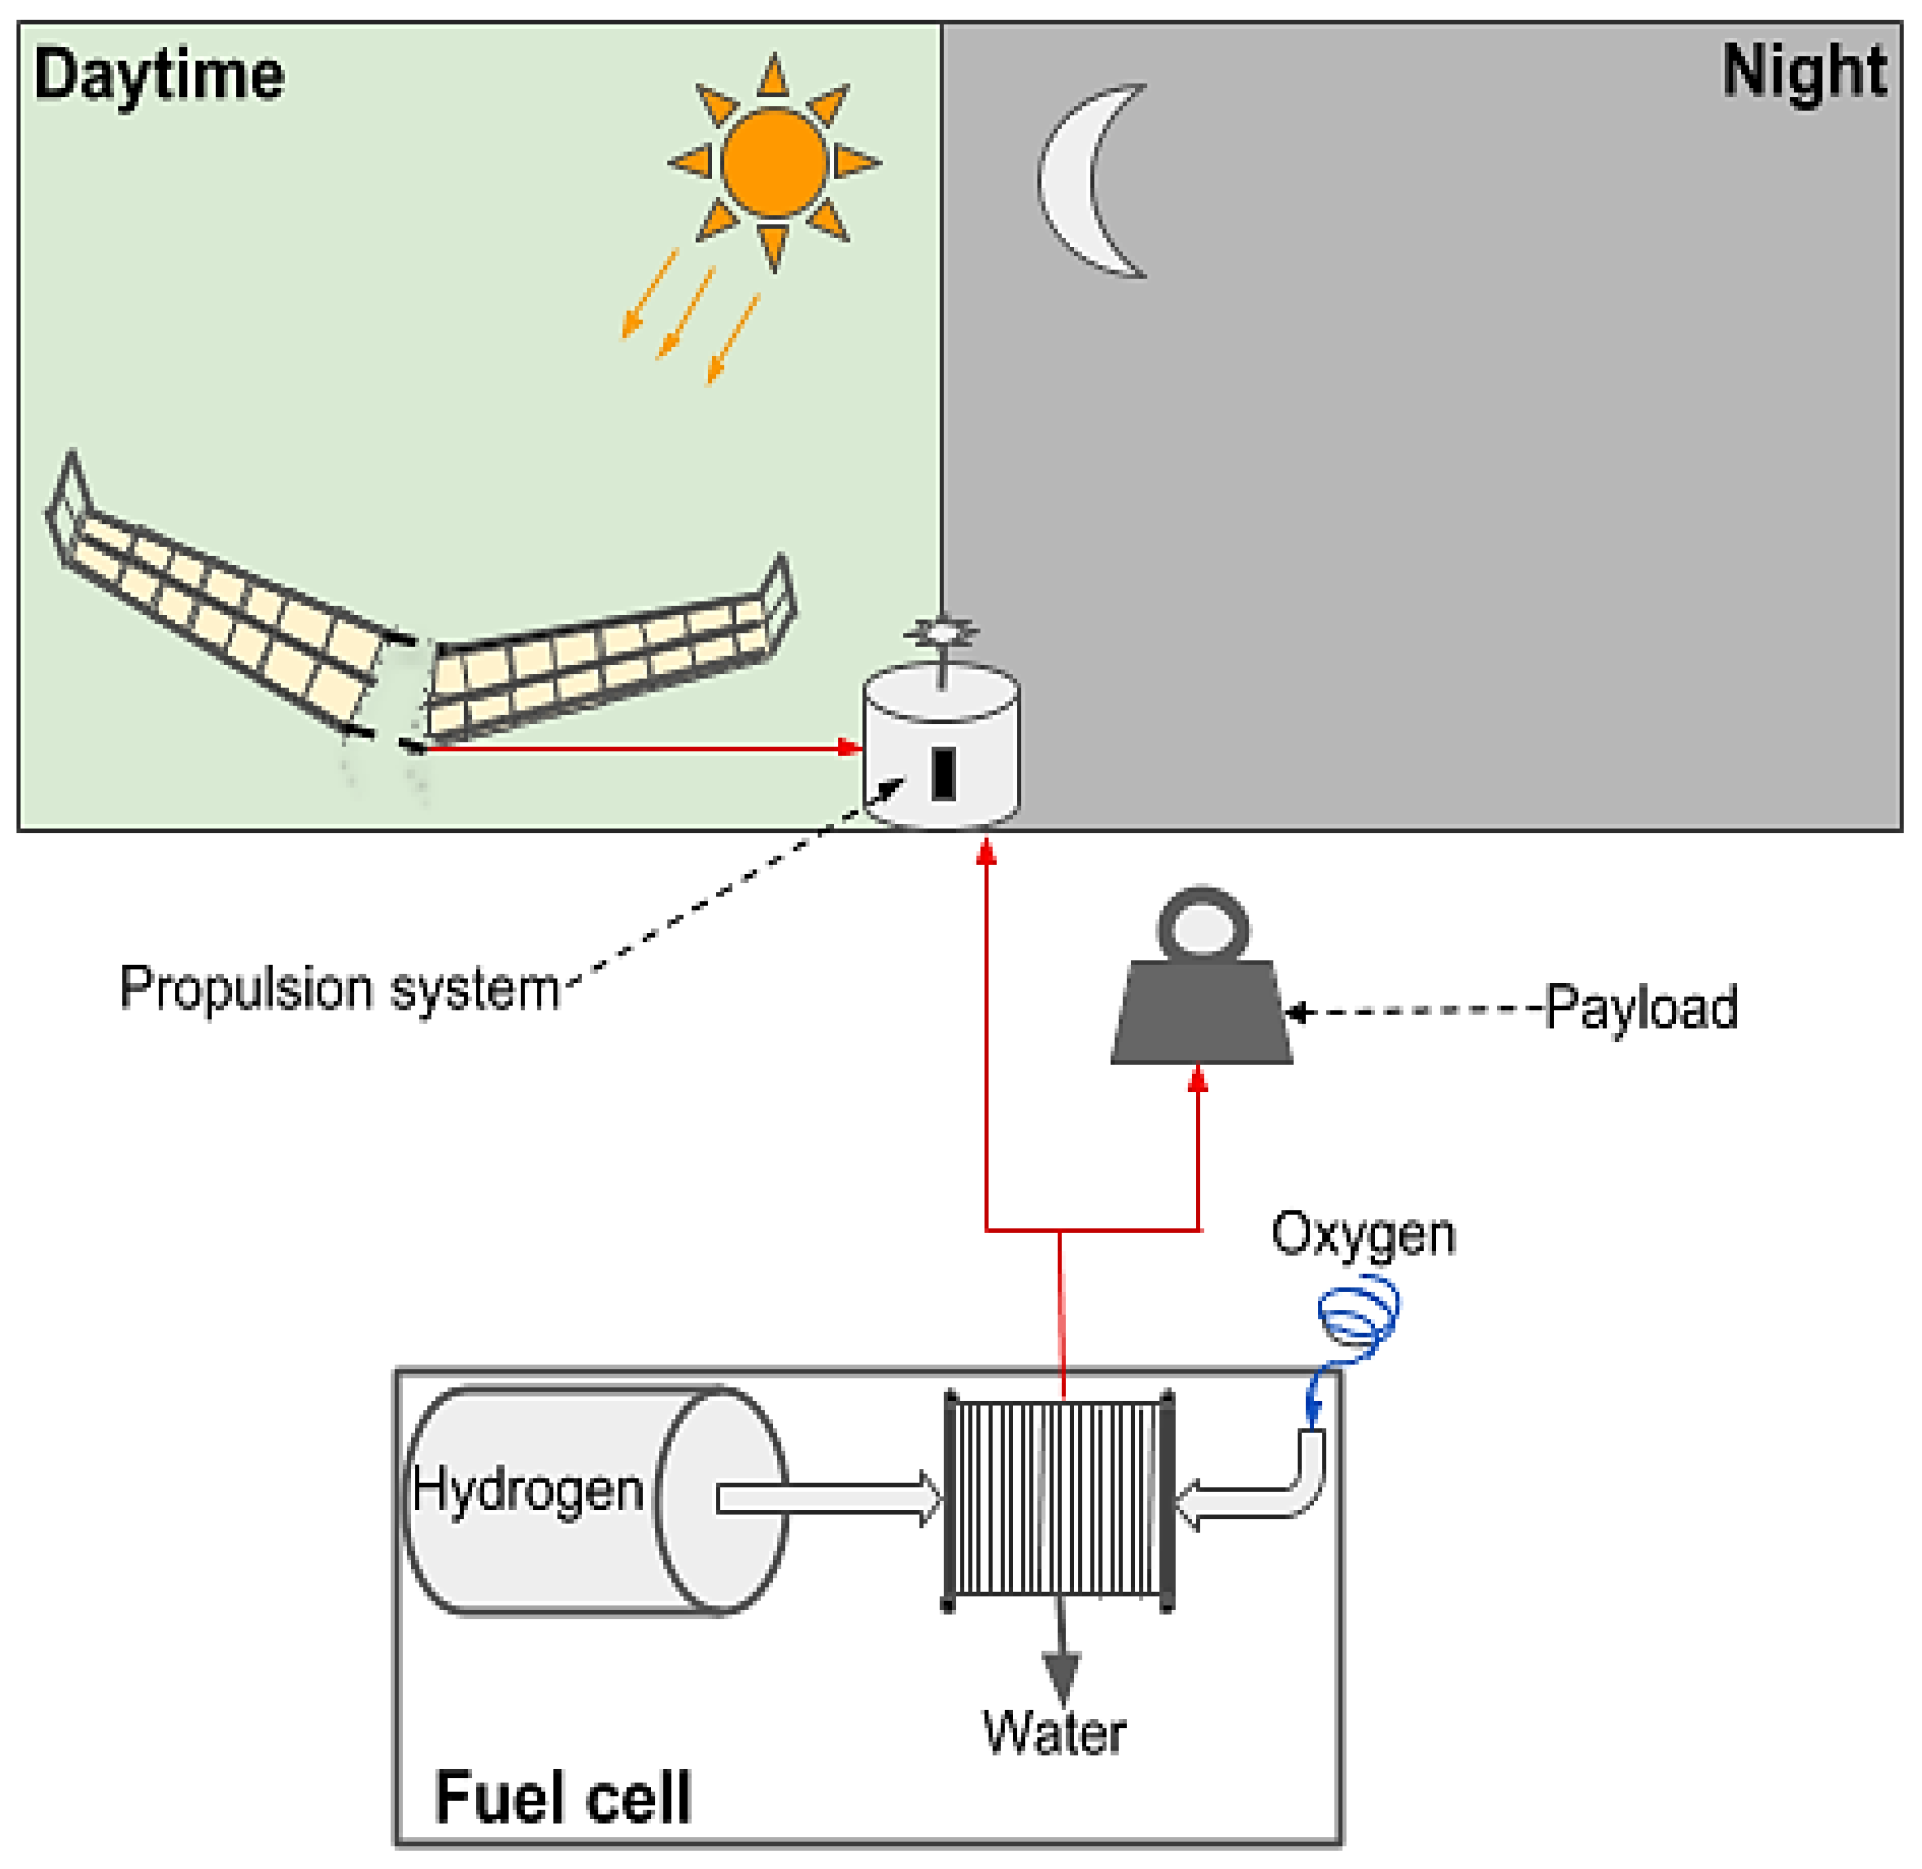
The major components of a HAP energy ecosystem are shown in Figure 1. The total energy that can be harvested is limited by the aircraft wing area which limits the solar cell area in order not to undermine the aeronautical design integrity of the aircraft [8]. The energy consumption on the other hand involves the platform propulsion system, avionics and payload. Consumption by the propulsion system is affected by factors including payload and platform weight. The baseband, RF, antenna, energy storage and backhaul units all contribute to the payload weight, while the platform frame and the avionics system contribute to the platform weight. The feasibility of the aircraft is not significantly affected by the weight of the solar cells [8] especially as high efficiency ultra-thin solar cells are already commercially available.
For the backhaul network, free space optical (FSO) and mmWave technologies can potentially be used. The choice depends on the compromise between the weight and the required data rate. The antenna unit comprises of antenna arrays operating at V-band frequencies (e.g., 47/48 GHz allocated for HAPs by the ITU-R [21]), which are expectedly small in size compared to other components in the ecosystem. A typical implementation of a HAP backhaul network at V-band frequency can therefore integrate the RF, BBU and antenna functionalities in a single unit.
The modularity of the components in the ecosystem is important for multi-mission solutions that require minimal reconfiguration for each mission. In [22], the authors propose an architecture for the electrical power system of a UAV, which separates the power system into solar module, battery module and payload module. This allows for scalability if the modules are properly designed. The Solar and energy storage modules, which are some of the main components of the solar-powered HAP energy ecosystem, are briefly discussed below:
  • Ultra-thin solar cells—Single crystalline based solar cell technology has been used over the years. The cost of silicon Si, which dominates single crystalline based solar cells, catalysed the studies for alternatives. This resulted in two-compound technologies like Gallium Arsenide (GaAs). Thin film solar cells are a good technology for weight limited HAP applications. Different technologies like the ultra-thin crystalline silicon (c-Si) [23] have also been used to produced ultra-thin solar cells. Unfortunately, c-Si suffer from other factors such as poor light absorption.
  • Energy Storage—The most common energy storage systems proposed for HAPs are batteries and fuel cells. Typical examples of these systems usable in solar-powered HAPs are Lithium-Sulphur (Li-S) batteries and hydrogen fuel cells (HFC). The ideal storage system for a given mission depends on location, platform characteristics, weight, specific energy and system deployment scenario, etc. Some commercially available systems such as Zephyr-S use Li-S battery storage. Presently, battery-based storage systems are often the limiting factor for long-endurance wireless communication missions given the current state-of-the-art in battery technology and the weight constraints of HAPs. Alternatively, HFCs with significantly higher specific energy present a more feasible energy storage system. HFCs can provide continuous energy in the presence of hydrogen fuel, and a conventional HFC does not require charging. Adequate power for a given application is delivered by an appropriate stack of HFCs [24]. The technology has been researched over the years and has been used in space missions. In [25], the optimal sizing of a photovoltaic/hydrogen system ideal for HAP applications is proposed using a particle swarm optimizer (PSO).
The energy storage system is an essential component in solar-powered aircraft-based HAP and must be critically considered for any application. Since continuous operation of the wireless communication system is required, an adequate amount of energy is required for night-time operation especially. This can potentially increase the required energy storage weight which means a larger wingspan is needed. Therefore, appropriate sizing of the storage system can allow for the use of a smaller aircraft and an increase in mission endurance. It is shown in [26] that the maximum achievable mission endurance can be increased by methodically sizing the battery system. In [25], studies show that optimal sizing of a photovoltaic HFC increases the efficiency of the energy system. Lee et al. [27] apply an active power management method, which determines the power output for aerial vehicles powered by solar cells, fuel cells and batteries. The proposed method facilitates adequate power supply during the continuously changing flight conditions, keeping power sources within their proper operational bounds. In general, effective energy management strategies can ensure better energy system performance of a solar-powered aircraft-based HAP. This can involve path planning by allowing the aircraft to climb to a maximum altitude during sunrise, storing energy and gliding after sunset as studies [6,8,25] show. However, this will undoubtedly increase the complexity of the communication system, as adequate compensation for the increased propagation loss at the maximum height needs to be taken into consideration. However, the total collected energy can be increased significantly by ensuring that the sun’s rays are perpendicular to the cell surface. The efficiency of some of the components of the energy management system, which includes MPPT, power converter, battery management, etc., is beyond the scope of this work. However, they have to be considered in practical systems. A number of mathematical symbols, which are defined in Table A1 in the Appendix A, are used in the analysis in this paper.

3. Energy Collection Model

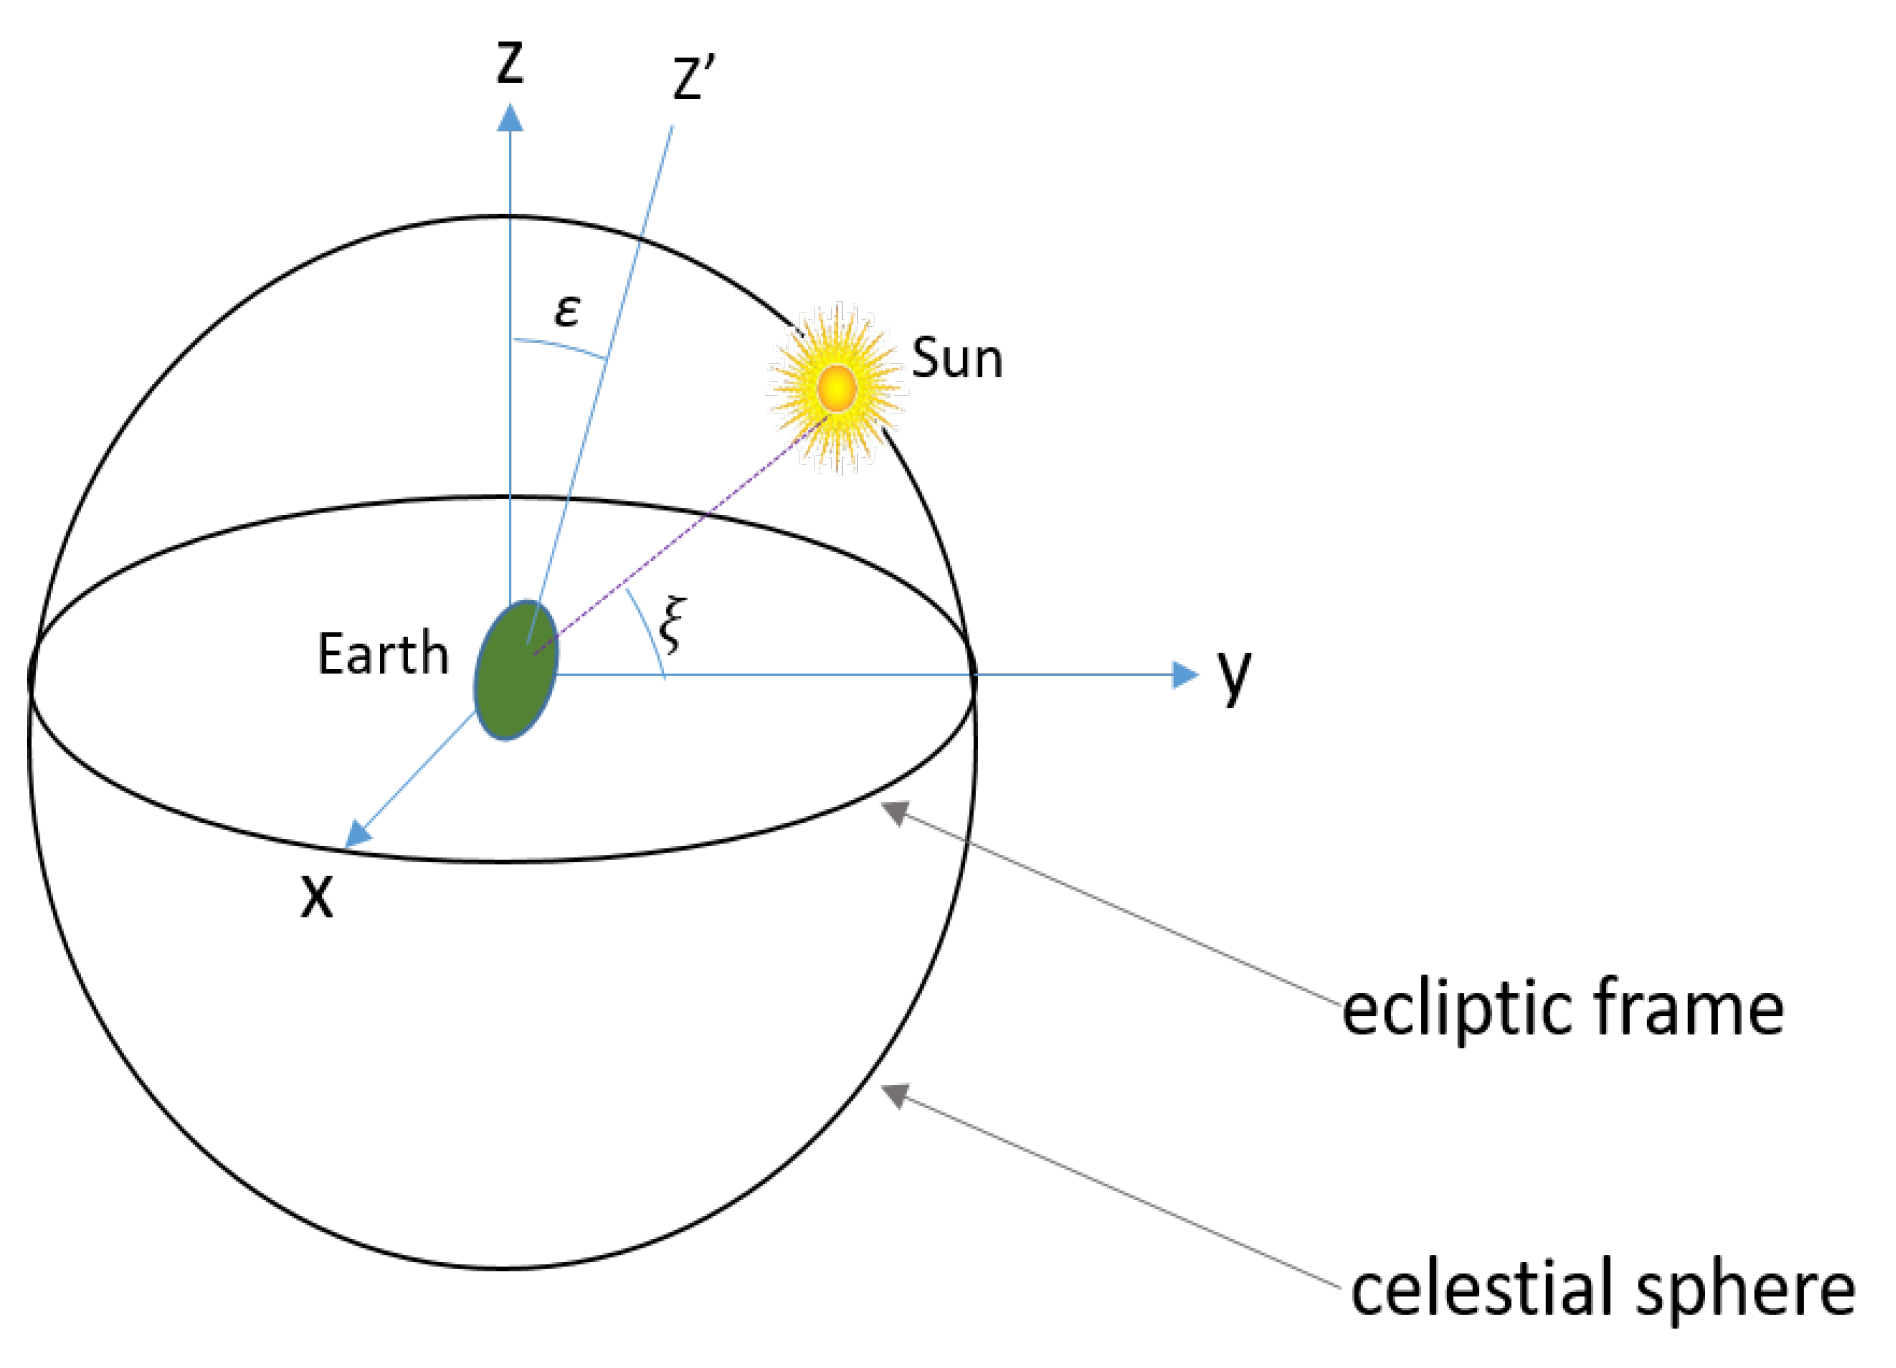
The intensity of solar radiation impinging on a horizontal surface is dependent on latitude and the position of the sun in the sky. While observing the sun from the earth, it appears to move along a great circle on the celestial sphere concentric to earth called the ecliptic as shown in Figure 2. The celestial sphere is an imaginary sphere of an arbitrarily large radius. Realistically, the earth is rotating around an axis z’, tilted by and angle of obliquity ε = 23.44° = 0.4093 with respect to the ecliptic frame [28]. On the ecliptic frame, the sun’s latitude is 0 .
The solar radiation detected above the atmosphere is referred to as extra-terrestrial solar radiation. This is higher than that detected at the surface of the earth because of gaseous and water vapour absorption of radiation at some wavelengths in the atmosphere. Fortunately, in stratosphere, the amount of water vapour is less than 0.05 % of the amount on the Earth’s surface [17]. The expression for the instantaneous extra-terrestrial solar intensity, G i is given as follows [25]:
G i = G s c 1 + 0.033 cos 360 d 365 × sin ( L ) sin ( δ ) + cos ( L ) cos ( δ ) cos ( h ) ,
where G s c = 1366.1 W/m 2 is a standard solar constant at zero air mass defined by American Society Testing and Materials ASTM E490, δ is the solar declination angle, which is a function of day d of the year, L is the latitude and h is the solar hour angle.
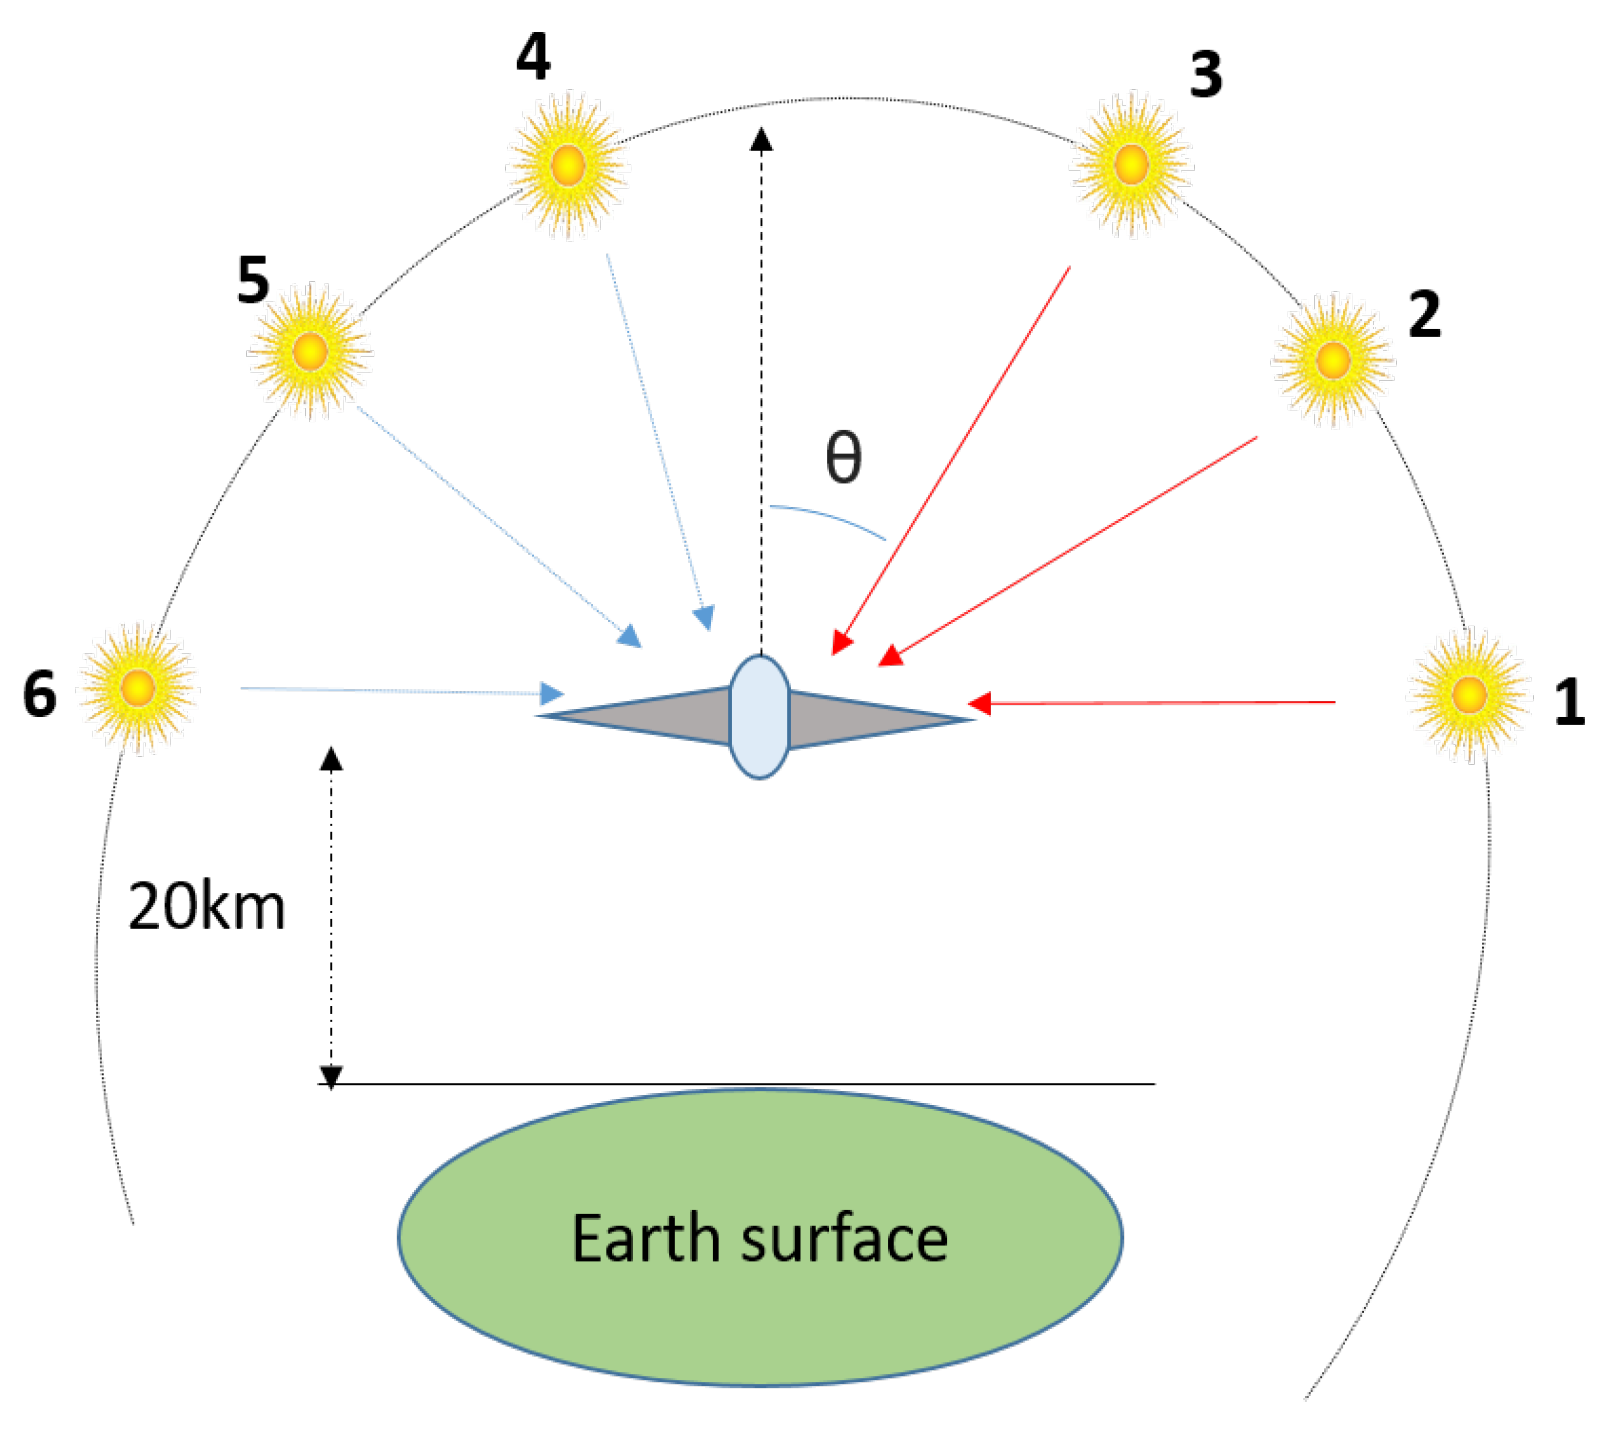
Assuming that the HAP is maintained horizontally throughout its mission duration, the solar irradiance on a plane horizontal to the surface of the earth is the sum of the direct, diffuse and reflected components of the solar radiation intensity. In the stratosphere, with very low levels of aerosols and water vapour resulting in a negligible probability of scattering, the Rayleigh distributed diffuse components can be neglected. It is assumed that the solar cells are deployed on the parts of the platform facing the sky, hence the reflected component is also neglected. Therefore, only the direct component is considered. Additionally, we assume that the HAP is horizontal and parallel to the surface of the earth. We also assume that the sun ‘rises’ from one side of the horizontal plane with respect to the HAP and ‘sets’ on the other side of the plane as depicted in Figure 3, the sun is seen to be rising at position 1, its trajectory is depicted in between its setting position at 6. Note that the motion of the sun is continuous, and the numbering is just for clarity. The angle θ is the solar zenith angle, which is a function of the position of the sun. It is important to note that the sun never really gets to an elevation angle of 90 ( 90 θ , zenith angle of 0 ) in most cases. This only occurs occasionally at the equator.
The radiation intensity given in Equation (1), which is a function of the solar hour angle requires computation of the intensity at any particular time, and the solar hour angle must be known. This increases the necessary computations. To simplify, it is assumed that the maximum radiation intensity G m i that can be experienced at any latitude is detected at the equator at solar noon (i.e., hour angle, h = 0 ) and given as
G m i = G s c 1 + 0.033 cos 360 d 365 × sin ( L ) sin ( δ ) + cos ( L ) cos ( δ ) ,
where the solar declination angle δ expressed as a function of day of the year [26] is given in radians as
δ = 0.4093 sin 2 π d 79.75 365 .
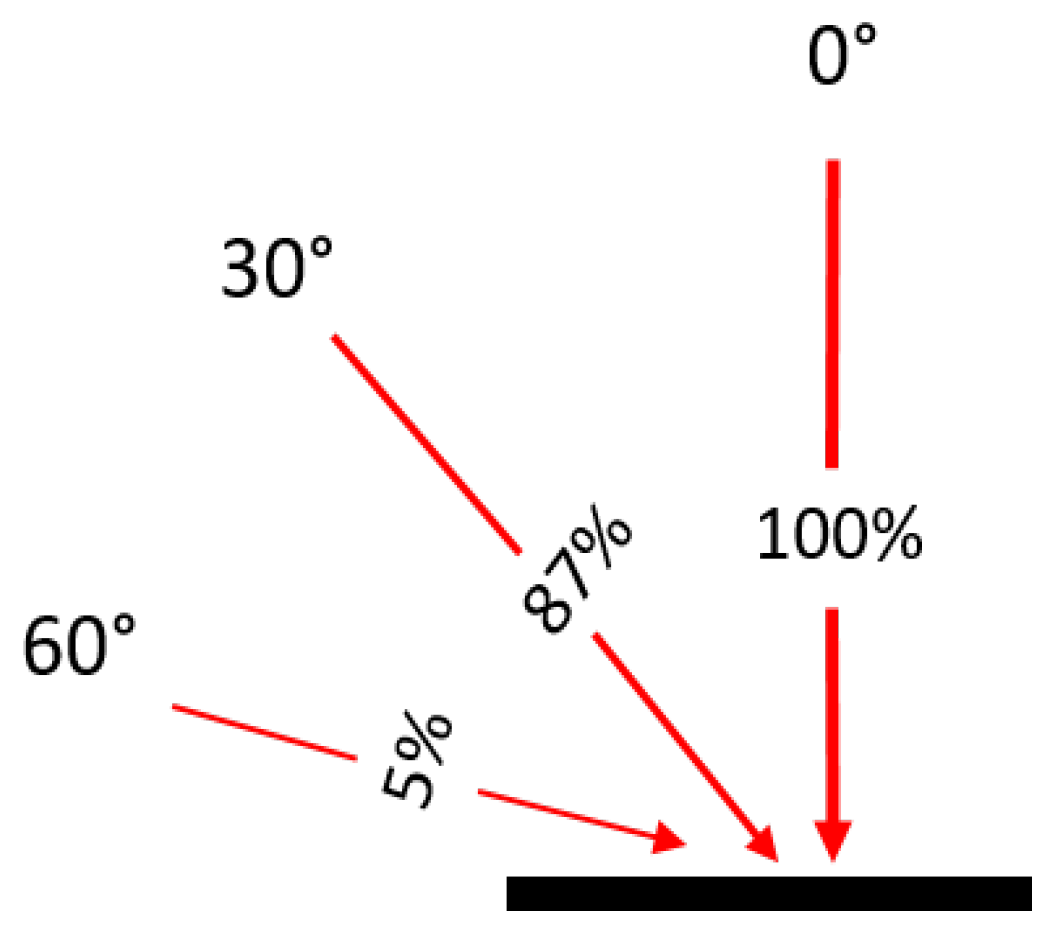
Introducing Lambert’s cosine law (which states that the irradiance measured on a plane will vary with respect to the cosine of the angle between the optical axis of the source and normal to the detector (see Figure 4)), combining (1) and (2), the following is obtained:
G i = G m i cos π 2 ξ ,
where ξ is the elevation angle of the sun.
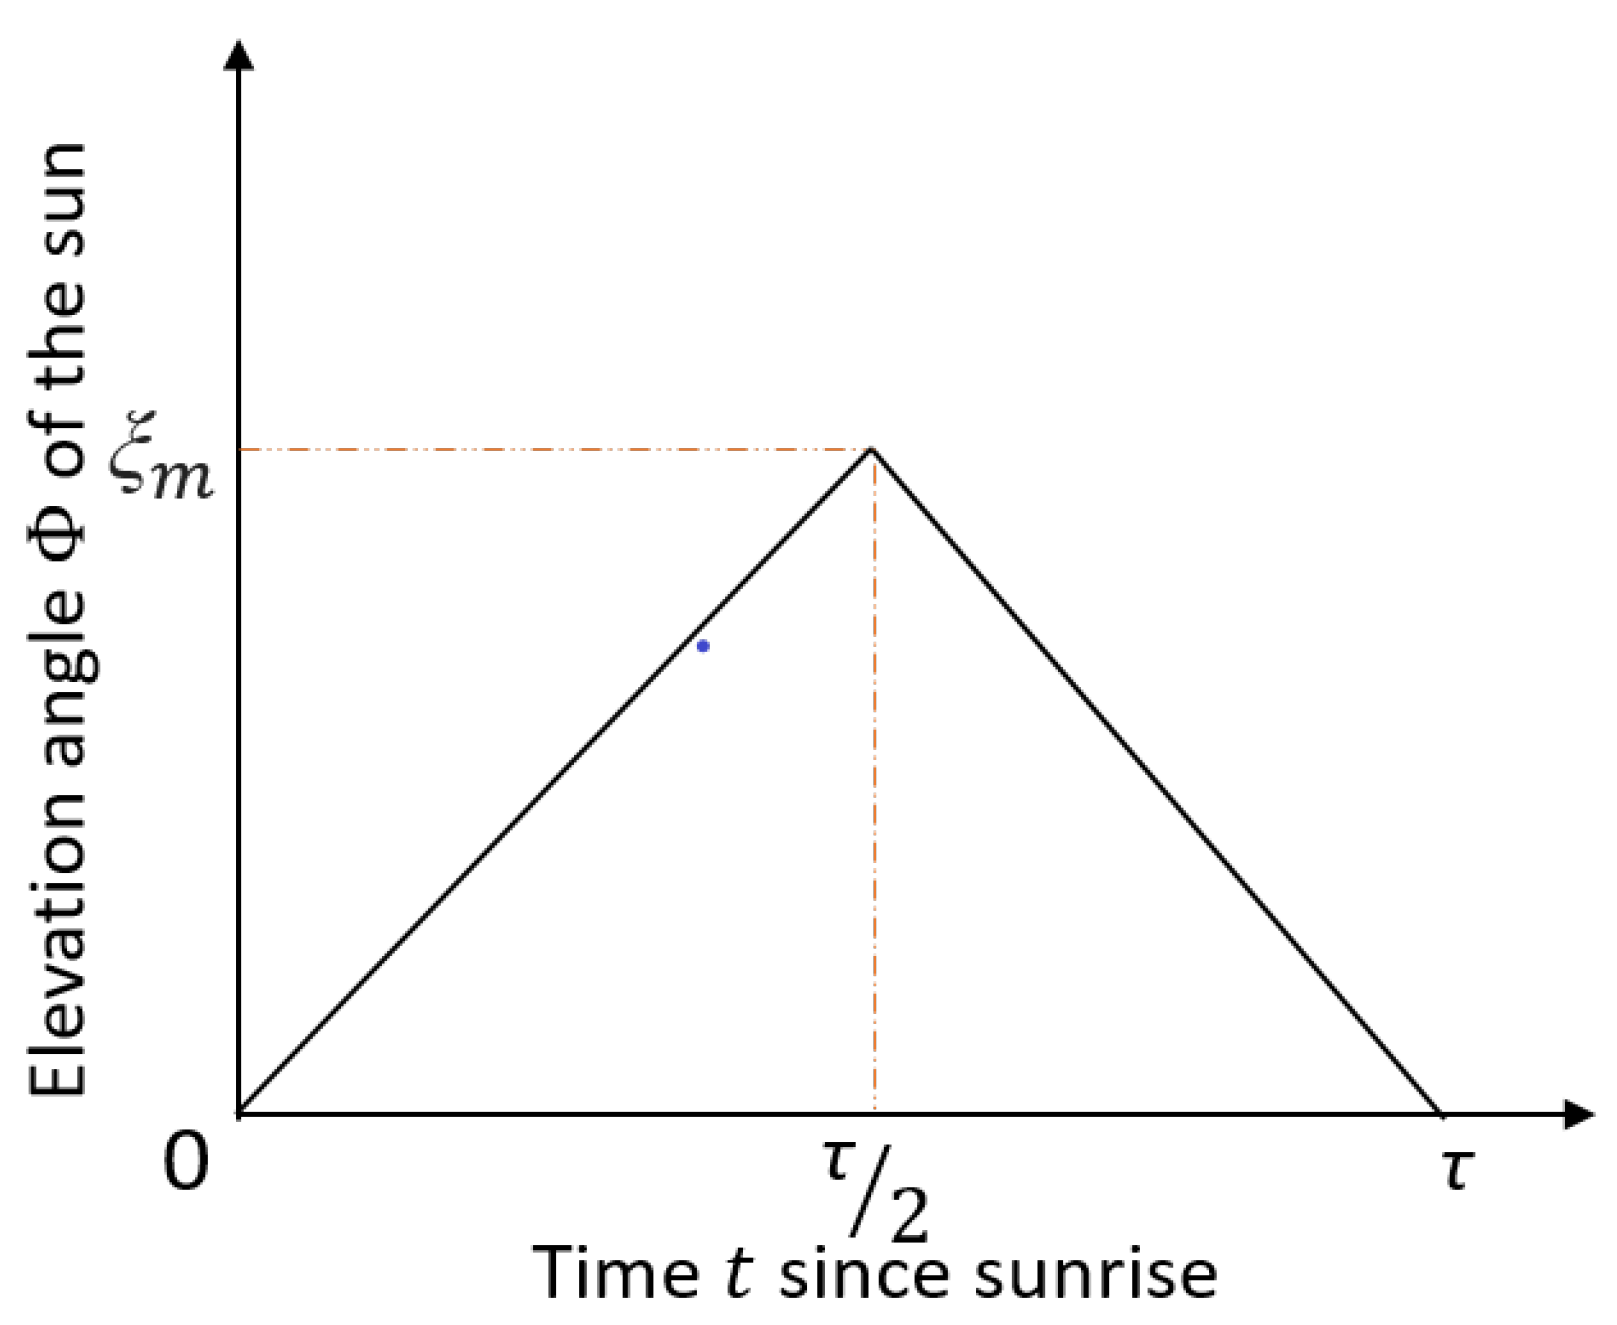
The radiation intensity of the sun varies with the incidence angle on the plane of the platform, while the total energy collected on a given day of the year is also dependent on the number of daylight hours. The total irradiance per m 2 on a given day is collected between sunrise and sunset. Since the elevation angle, as observed at the HAP, varies with time resulting in a varying solar radiation intensity, the sun’s elevation angle as a function of time duration since sunrise on a typical day, which can be referred to as elevation angle time series function, is defined. An approximate elevation angle time series is derived to facilitate the formulation of an expression to calculate the total solar irradiance per m 2 on a given day. In deriving the elevation angle time series function for a typical day, we assume that at sunrise the elevation angle as observed from the HAP is zero (i.e., the sun is in line with the HAP) and that the sun’s elevation angle is consistently increasing afterwards. There is a direct proportionality between time duration since sunrise t and the elevation angle at that particular duration ξ ( t ) . For instance, if sunrise is 6.00 a.m., then t = 0 at this time, while 8.00 a.m. t = 2 h. The elevation angle continues increasing slowly with t until noon at which point the maximum elevation angle for the day has been attained. The elevation angle then starts decreasing at a similar rate until sunset when it equals zero. This results in a triangular elevation angle time series function given in (5) and 
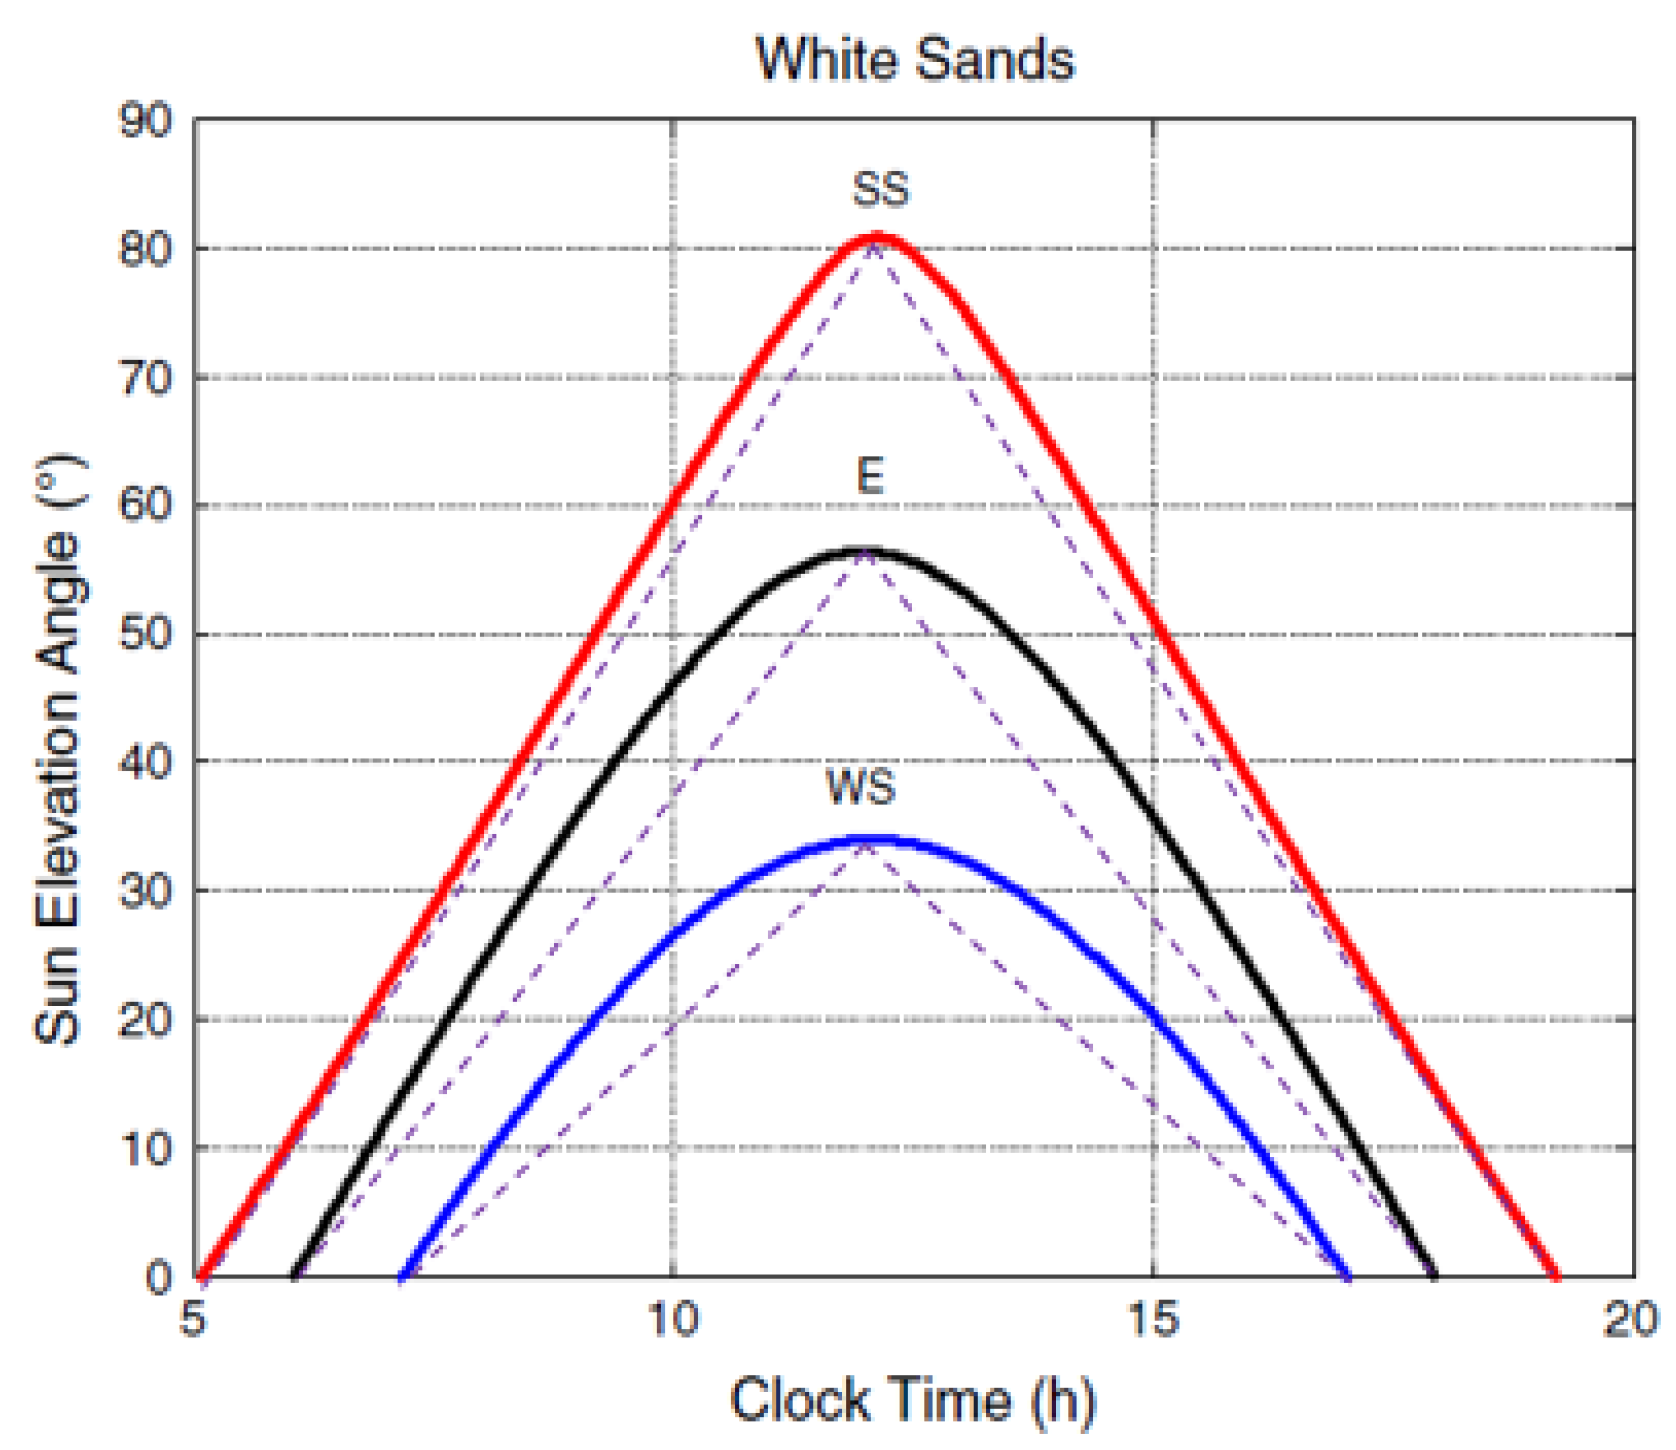
Figure 5. Actually, Matricciani in [29] show that the elevation angle time series heuristically determined for some select days in a year is not exactly represented by a triangular function. Matricciani shows that elevation angle time series function is almost parabolic in shape. However, (5) is a pessimistic approximation of the elevation angle time series. The accuracy of the function increases with increasing maximum elevation angles as depicted in Figure 6. This is particularly significant as HAPs are expected to operate mainly in regions with high maximum elevation angle. It is important to note that the triangular function potentially leads to a point of singularity at noon. However, this does not affect total solar irradiance calculation, which is analogous to evaluating the area under the triangle. This can be achieved straightforwardly irrespective of the singularity.
The elevation angle time series function is expressed mathematically as
ξ ( t ) = 2 ξ m τ t , t < τ 2 2 ξ m 2 ξ m τ t , t τ 2 .
Substituting (5) into (4) yields
G i = G m i cos π 2 2 ξ m τ t , t < τ 2 , cos π 2 2 ξ m 2 ξ m τ t , t τ 2 .
The total extra-terrestrial solar irradiance G T i per m 2 on the surface of a high altitude platform at stratospheric altitude on a given day of the year at a particular latitude is therefore computed by integrating (6) over the duration between sunrise and sunset as shown below:
G T i = 0 τ 2 G m i cos π 2 2 ξ m τ t δ t + τ 2 τ G m i cos π 2 2 ξ m 2 ξ m τ t δ t .
Integrating the triangular function over the entire range 0 – τ is equivalent to integrating only half, e.g., 0 – τ 2 , and multiplying the result by 2. Therefore, (7) can be simplified as follows:
G T i = 2 G m i 0 τ 2 cos π 2 2 ξ m τ t δ t .
Evaluating the integral in (8) yields the expression for G T i , which is given in the following equation:
G T i = G m i τ ξ m 1 cos ( ξ m ) .
Using (9) requires the knowledge of the time duration τ from sunrise to sunset at a particular latitude, and the maximum elevation of the sun on a given day of the year. In [28], closed form expressions of the daylight time duration, τ ( L , d ) as a function of the azimuthal angle, φ ( d ) of the sun and mean anomaly M ( d ) (the angular distance of the sun) are given as follows:
M ( d ) = 0.041 + 0.017202 d ,
φ ( d ) = 1.3411 + M ( d ) + 0.0334 sin ( M ( d ) ) + 0.0003 sin ( 2 M ( d ) ) .
The following equation expresses the daylight time duration.
τ ( L , d ) = 24 1 1 π cos 1 ( tan ( L ) ) × sin ( ε ) sin ( φ ( d ) ) 1 sin 2 ( ε ) sin 2 ( φ ( d ) ) .
The maximum elevation of the sun ξ m on a given day of the year is a function of latitude and declination angle [28], which varies with day of the year. It can be estimated in radians using the following equation [30]:
ξ m ( L r , δ ) = π 2 + L r δ ,
where L r is the latitude in radians, which can be positive or negative, depending on whether it is referencing the northern or southern hemisphere, respectively.

Energy Collection Model Application

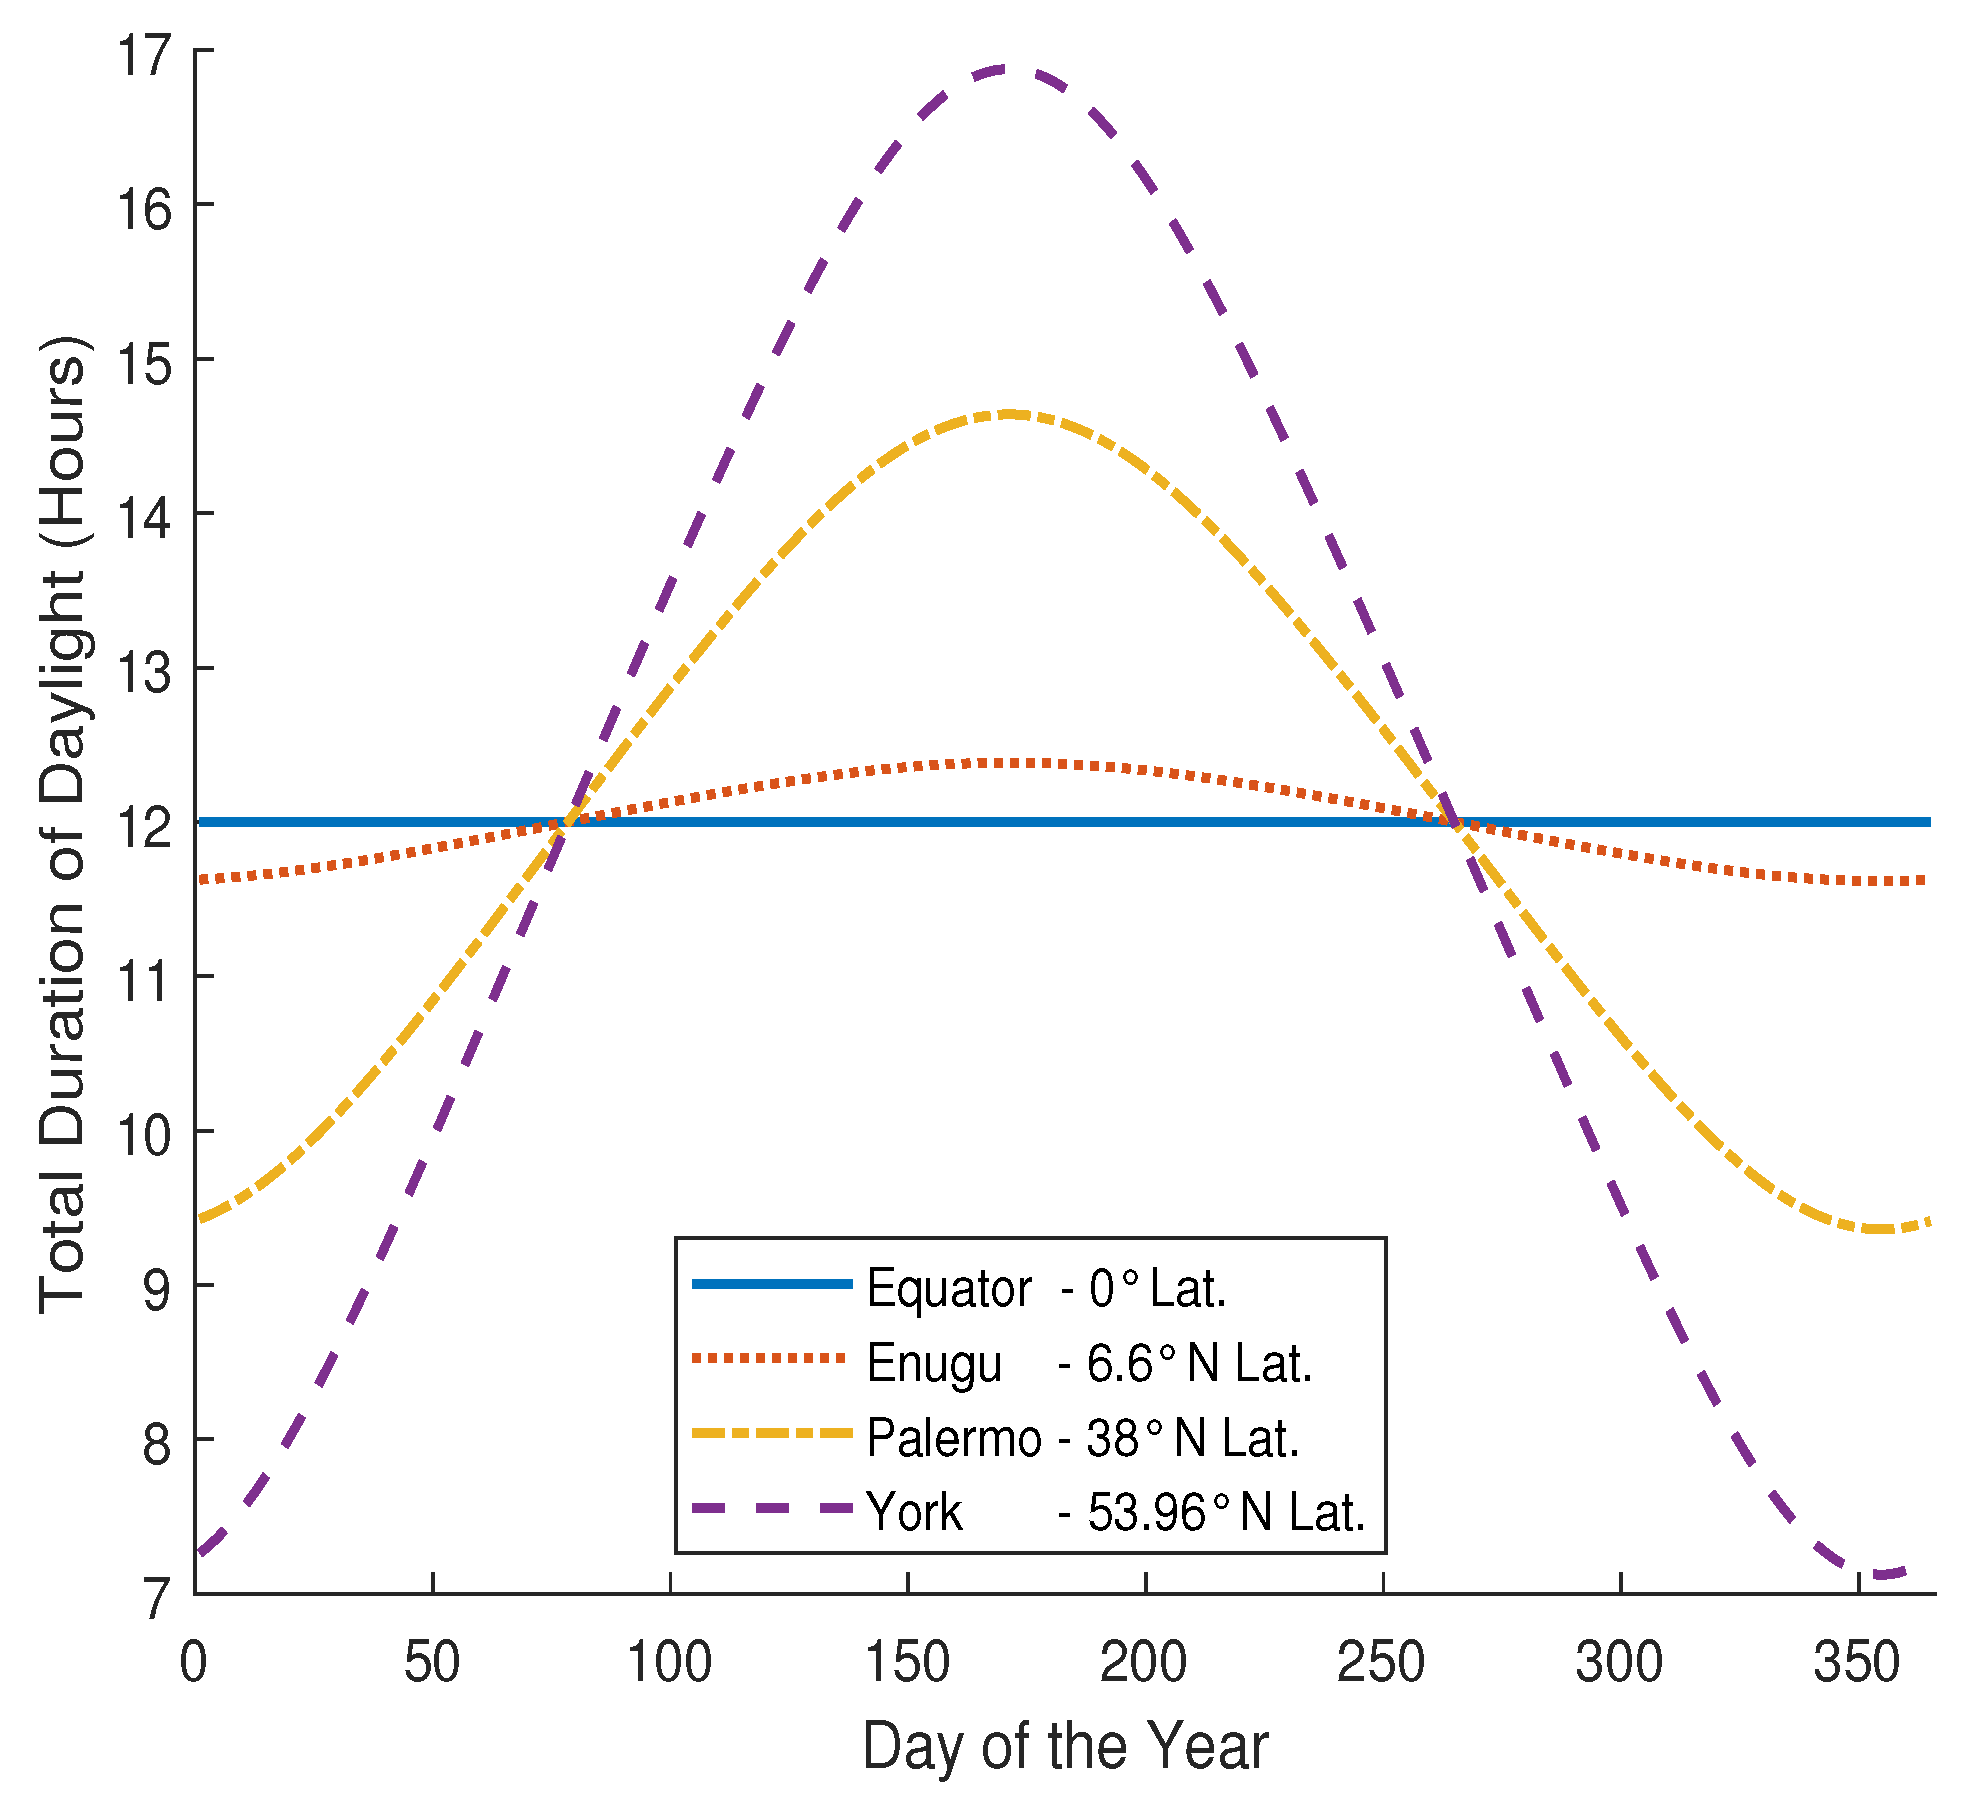
Using (10)–(13), the daylight time duration at different locations with varying latitudes over the duration of 1 year are computed and plotted as shown in Figure 7. The locations near the equator have an approximately constant time duration of daylight from sunrise to sunset. Moving north of the equator, the longest duration of daylight is witnessed on the day of the mid-year solstice which occurs on 21st June (i.e., d = 172 ). This can be as long as 17 h of daylight in York, United Kingdom (Lat: 53.96°N) for instance. Conversely, the shortest day witnessed at all locations north of the equator occurs on the year-end solstice (i.e., 21st December, d = 355 
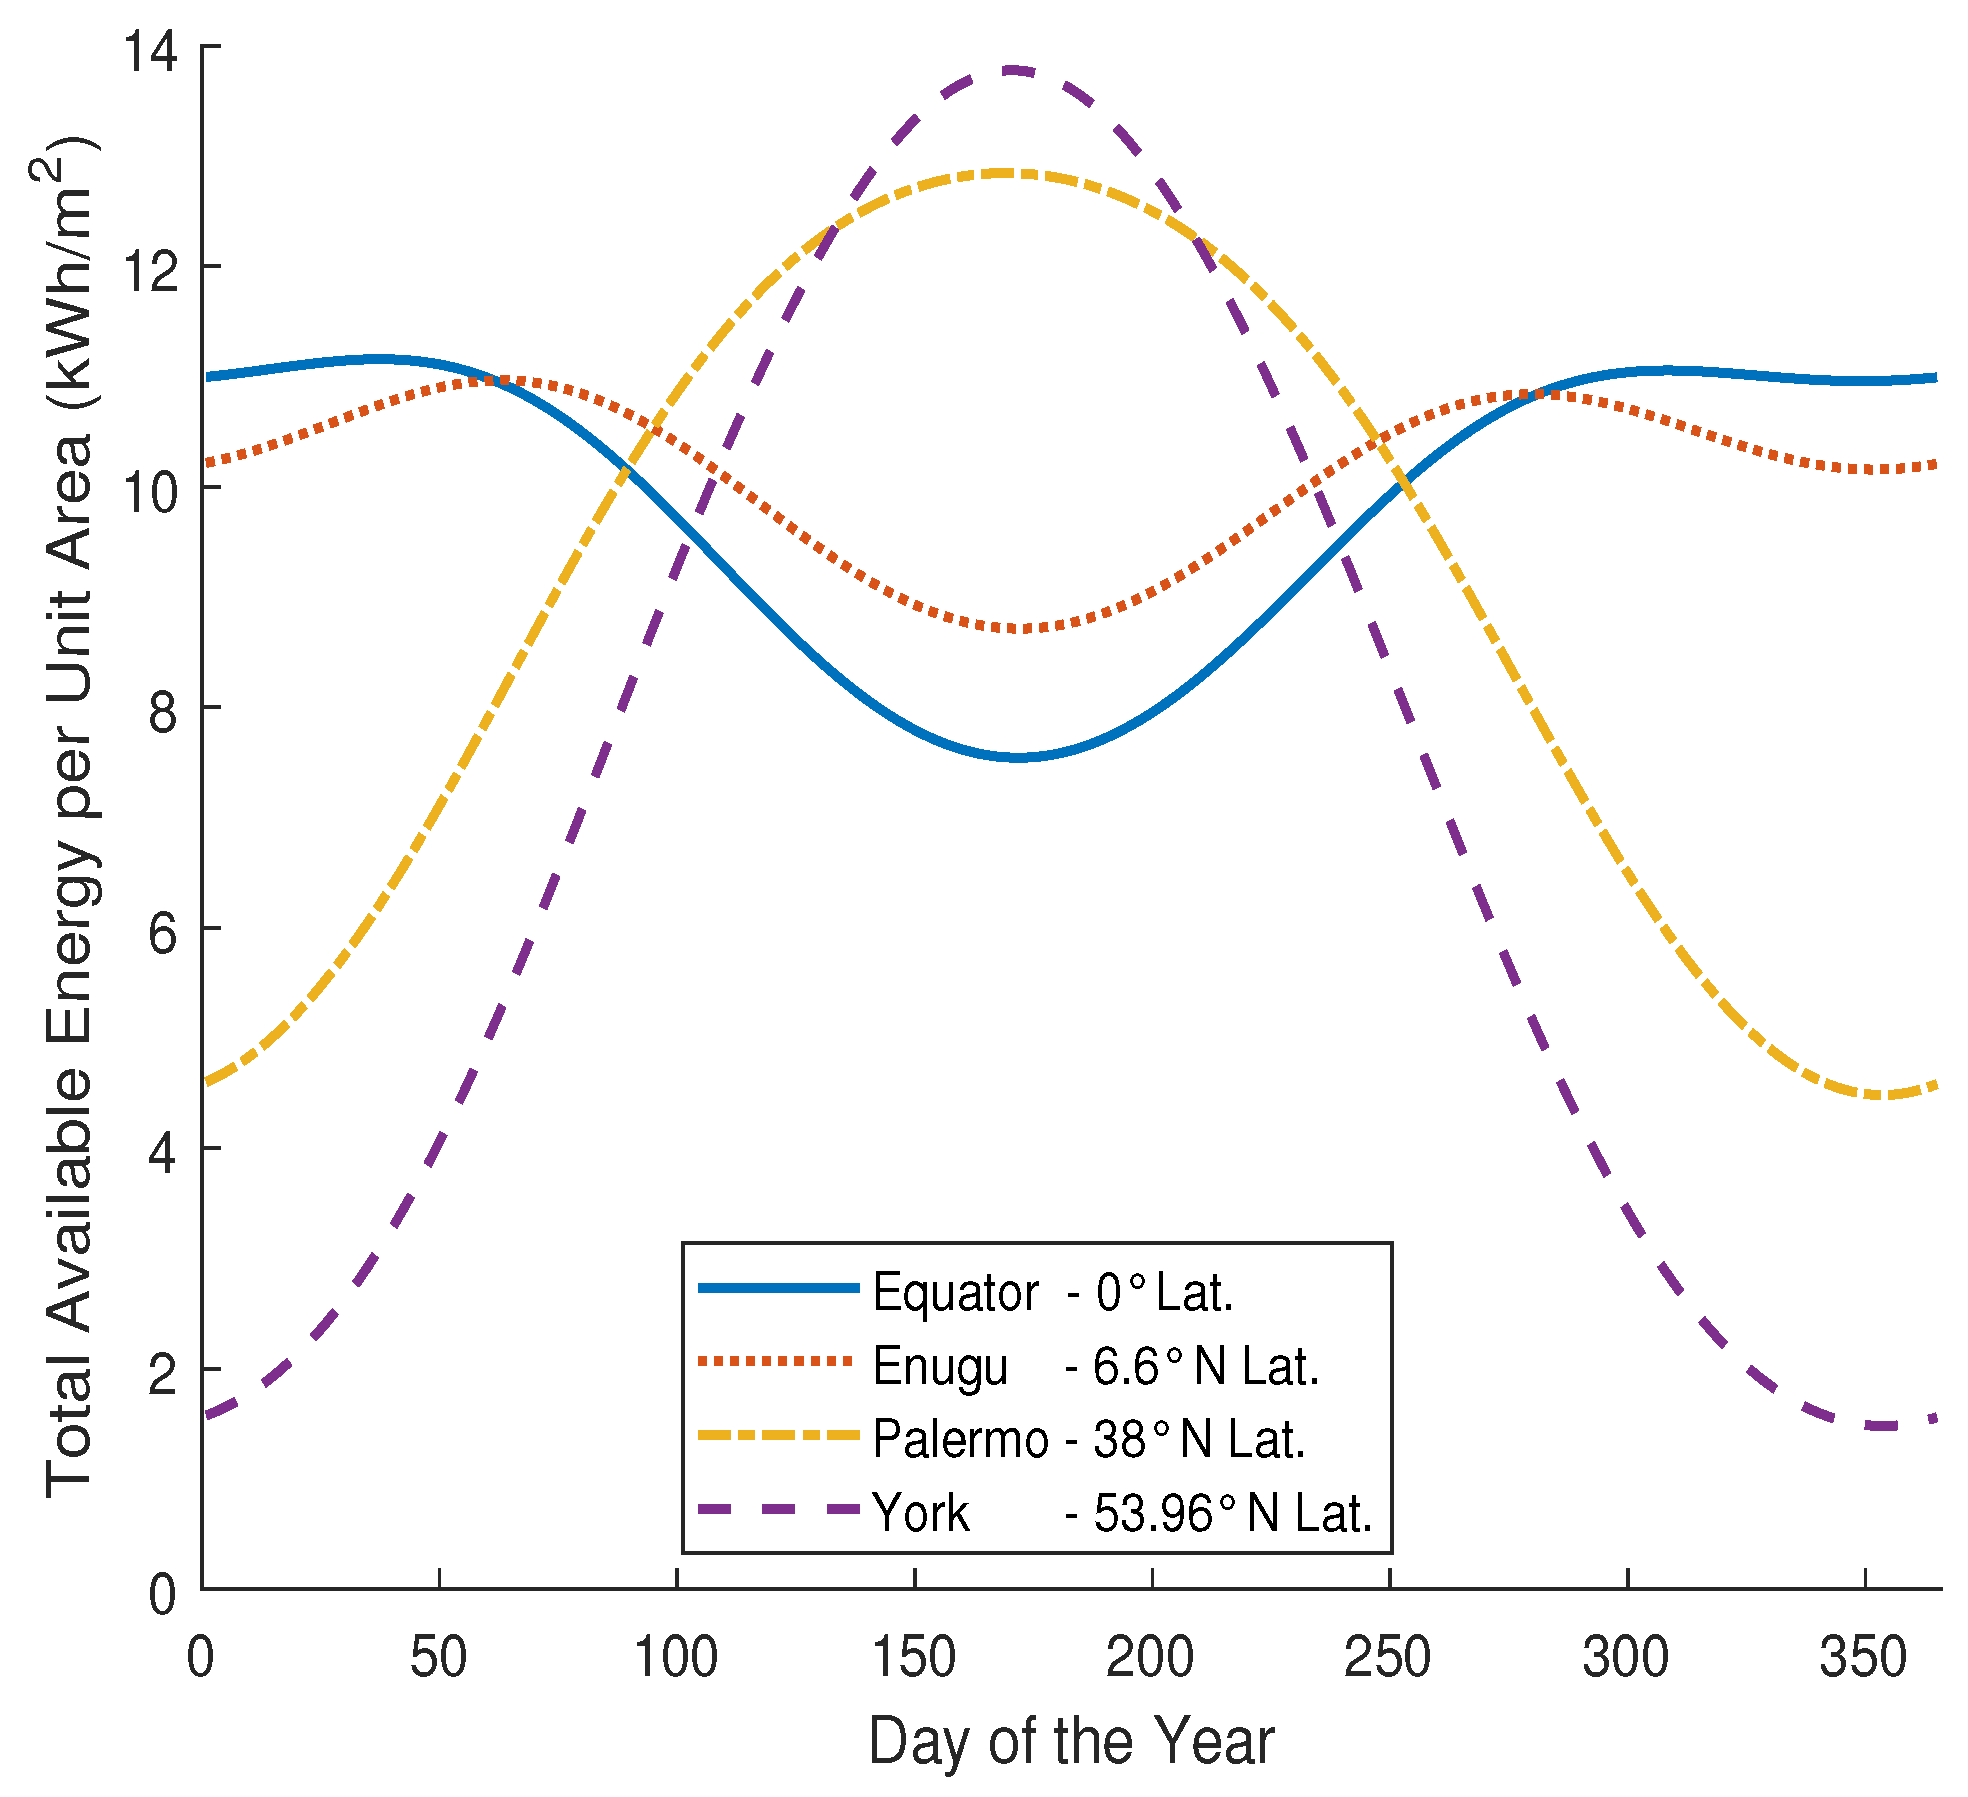
). In addition, in York for instance, this could be as short as just 7 h. The total solar irradiance per m 2 , G T i at locations as in 
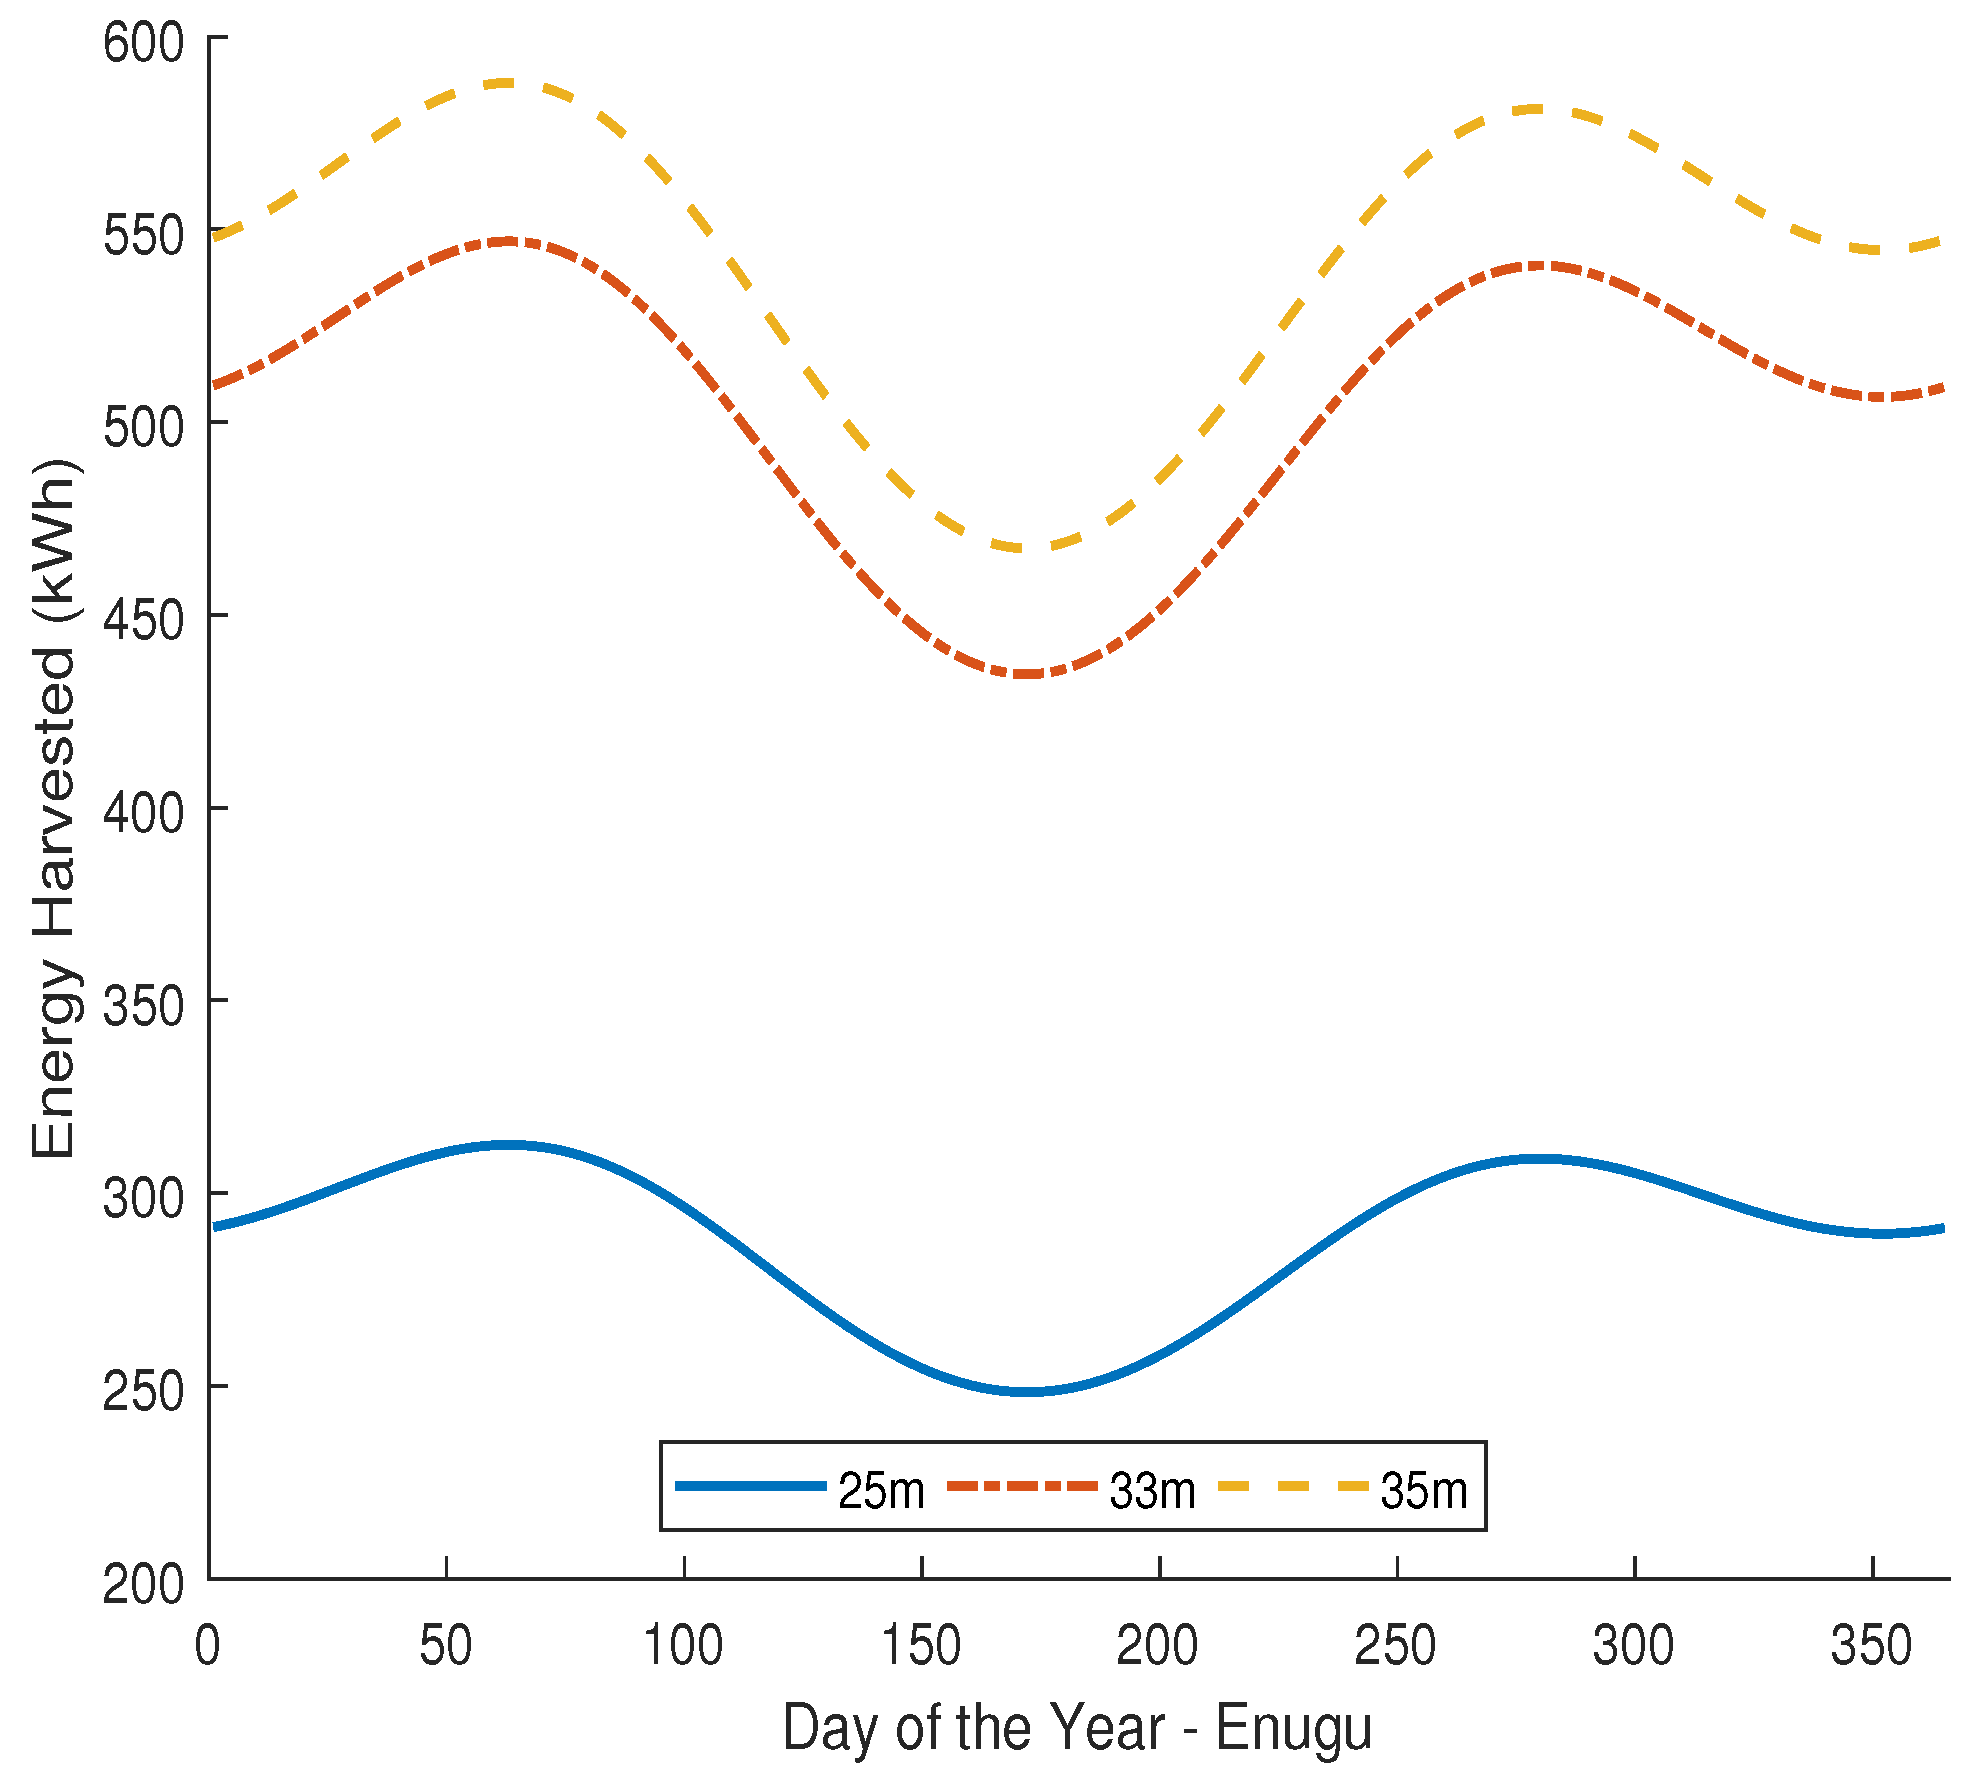
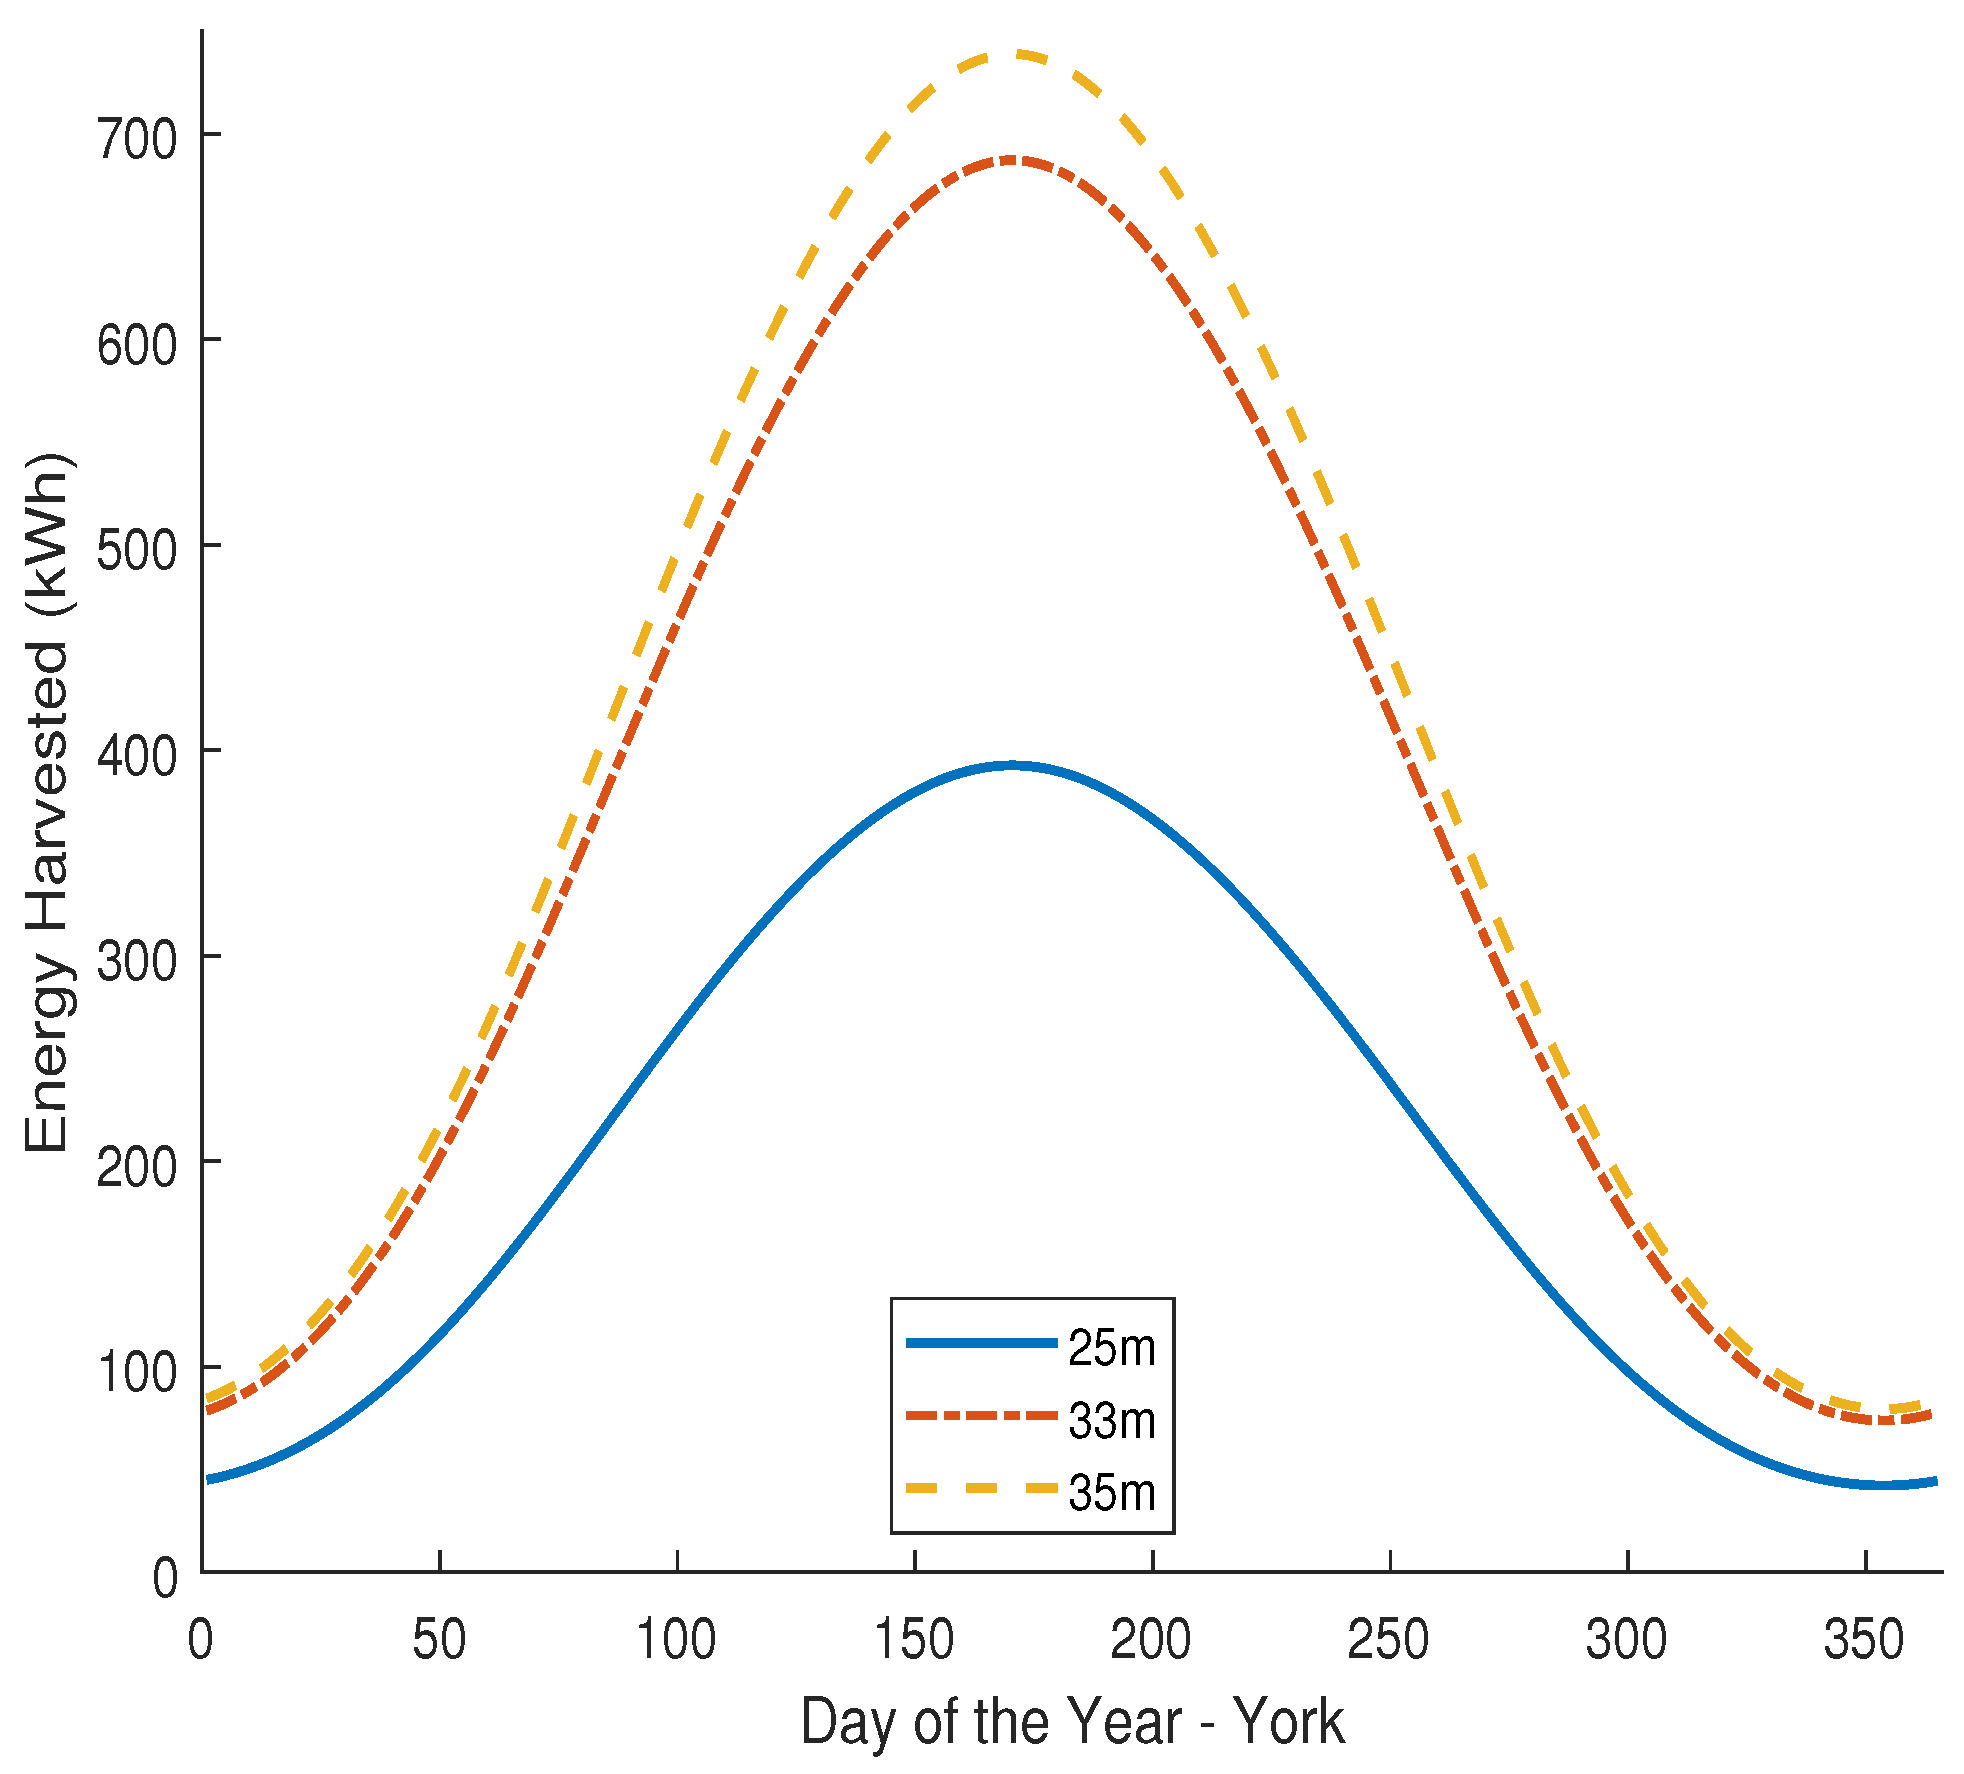
Figure 7 is computed using (9) and plotted for different days of the year.
Figure 8 shows that G T i in equatorial regions ranges between 7–8 kWh/m 2 /day around June/July when the sun is furthest from the equator. This value increases to approximately 11 kWh/m 2 /day towards the beginning and the end of the year when the sun is closest to the equator. On the contrary, G T i attains its maximum value of approximately 14 kWh/m 2 /day in regions further up the northern hemisphere during the middle of the year. The main reason being the significantly longer duration of daylight experienced during this time of the year [31]. Unfortunately, the G T i drops to its minimum value of approximately 1.5 kWh/m 2 /day on December the 21st in the northern hemisphere, due to the small duration of daylight.
Therefore, continuous year-round operations of a solar-powered HAP in the northern hemisphere (especially towards the North Pole) are constrained by the duration of daylight on the year-end solstice. To ensure feasible operations, the total energy, E n T collected by the platforms on the year-end solstice is evaluated with the total energy consumption by the platform and payload to ensure adequate availability of energy. This is based on an assumption that energy can only be stored for 24 h. Considering the total area of solar cells deployed on the platform and the efficiency of the solar cells, and E n T is expressed as follows:
E n T = η p v A p v G T i ,
where η p v and A p v are efficiency and area of the photovoltaic system.

4. Energy Consumption Model

The energy consumed by a HAP can further be separated into into the energy consumed by the following subsystems:
A
Propulsion system,
B
Avionics (platform control system),
C
Payload.
The total energy consumption of the aircraft is therefore modelled as the sum of the energy consumptions by the propulsion, the avionics and the payload. The rest of this section describes the contribution of each of the subsystems to the total consumption.

4.1. Propulsion System Energy Consumption

The propulsion system’s energy consumption is modelled based on the orientation of the HAP. Two models are developed that consider the following distinct flight patterns:
  • Steady Horizontal flight: Here, the platform maintains a steady horizontal flight in the stratosphere moving in the direction of thrust.
  • Steady Circular Flight: In steady circular flight, the platform operates within a position circle of a given radius and at a fixed banking angle.

4.1.1. Horizontal Flight

Firstly, in order to evaluate the energy consumption by the propulsion system of a HAP, we assume that the aircraft is maintaining a steady horizontal flight. The principal forces acting on the platform in flight are depicted in Figure 9.
In steady horizontal flight, the platform lift force, F l and weight, F w are equal. In addition, the forward thrust, F t equals its drag F d . The Lift force, F l is generally expressed as
F l = F w = 1 2 ρ V 2 A w C L ,
where ρ is the air density, V is the velocity of the aircraft, A w is the platform’s wing surface area and C L is the coefficient of lift. Rearranging (15),
F w C L = 1 2 ρ V 2 A w .
Similarly, thrust, T t and drag, D g force can be expressed as a function of the drag coefficient C D in the following equation:
F t = F d = 1 2 ρ V 2 A w C D .
Thus, substituting (16) into (17) gives
F t = F w C D C L .
The power required, P r e q , defined in the following equation, is a function of thrust T t , velocity V, and propeller efficiency η p r o p of the HAP:
P r e q = T t V η p r o p .
Solving for V in (15) and substituting both (18) and the solution for V into (19), P r e q in Watts, which is used in Section 5.2 to estimate the required power for some example platforms, can be expressed as
P r e q = C D η p r o p C L 3 2 2 W T 3 ρ A w ,
where W T is the weight of the platform.
In the rest of the paper, the propeller efficiency η p r o p used for calculations is 80%. This is based on the comprehensive study of UAV propeller performance in [32].

4.1.2. Steady Circular Flight with Banking

Assuming the HAP follows a circular trajectory within a circle of radius R (different values for R are defined by ITU-R and the Helinet project [33]), at a bank angle α as shown in Figure 10.
For the HAP in Figure 10 to maintain steady circular flight at the same altitude, the vertical component of the lift force, F l v must be equal to the total weight F w . In addition, the centripetal force F C is assumed equal to the drag force. Therefore,
F l v = F l cos ( α ) = F w = m T g ,
F C = F l sin ( α ) = m T V 2 R ,
where m T and g are total mass (including payload) and acceleration due to gravity. Combining (21) and (22), the banking angle α is obtained as follows:
α = tan 1 V 2 g R .
The turn radius can be defined based on Equation (23) as R = V 2 g tan ( α ) . Since the directions of the centripetal force and acceleration are directed towards the centre of the circle, the tangential acceleration is equal to zero. In this case, the significant forces acting on the HAP are the centripetal force, the total weight of the platform and the lift force. Following similar assumptions as in the case of the steady level flight above,
F w = F l cos ( α ) ,
F l F w = 1 cos ( α ) = L f ,
where L f is referred to as the aircraft load factor. The power required P r e q _ c b to maintain a steady circular flight at a bank angle α is a product of the square of the load factor at a given bank angle and the power required for a steady level flight [34]. Therefore,
P r e q _ c b = 1 cos ( α ) 2 P r e q .

4.2. Payload Energy Consumption

Here, the HAP payload is the base station apparatus that provides wireless access to the users and a backhaul link from the HAP to the infrastructure on the ground. Detailed studies have been carried out on the energy efficiency of an LTE BS by the EARTH project [19,35]. The project proposed an Energy Efficiency Evaluation Framework (E 3 F), which can be applied in estimating the power consumption of a BS. The framework estimates the power consumption of a BS as the summation of the power consumed by the BS baseband unit, the PA, RF chains and overhead. The model highlights that baseband power is dependent on variables such as the system bandwidth B W , modulation scheme M, coding rate R, number of antennas A n t , time-domain duty-cycle D t and frequency-domain duty cycle D f . Time-domain duty-cycle is the fraction of time during which the baseband circuitry is active, while the frequency-domain duty cycle is the proportion of the frequency resources in use. Each of these parameters are weighted and scaled according to their contribution to the overall baseband consumption. The weighting and scaling are based on similar parameters obtained from a reference BS whose power was obtained by measurements. Studies in [35] give the power consumption of the different sub-component chips of the RF chain under transmitting and receiving scenarios.
Using the EARTH model for terrestrial BS power consumption, we estimate a HAP BS power consumption. The BS is assumed to be operating with a 20 MHz system bandwidth and 1600 antenna elements. Assuming a PA efficiency of 47% with 100% time-domain and frequency-domain duty-cycle, the total estimated HAP BS power consumption obtained is in excess of 60 kW. This is very pessimistic and the significantly high power consumption results from the model’s lack of consideration of massive antenna array scenario. In addition, the model is not optimized for high altitude platform applications. These illustrate the shortcomings of trying to evaluate a HAP based system using models optimised for terrestrial operation. Given that the EARTH model was developed for terrestrial BS, it is inappropriate to apply it for bespoke systems like HAP BS.
Since there is no appropriate model for HAP BS power consumption estimation in the literature, we derive an alternative model. Assuming a HAP BS consists of N antenna elements forming a maximum of C cells on the ground, it can be assumed that each cell has a maximum RF output power P o u t . Considering the PA efficiency, we estimate the input to the PA as follows:
P P A = C P o u t η P A .
In the EARTH model, the PA is estimated to contribute approximately 57% of the total BS power consumption. We can therefore express the total power consumption by a HAP BS as a function of the fraction of the consumption by its PA, as follows:
P H T = C P o u t γ η P A ,
where γ is the fraction of total power consumption by the BS power amplifier. The whole communication system payload power consumption P H T can therefore be expressed as
P H T = C P o u t γ η P A + P b h ,
where P b h is the backhaul sub-system power consumption.
In order to understand the cellular performance within a HAP service area, estimating the number of cells needed to provide contiguous coverage over a service area is important. The geometry of the cells vary from circular at the sub-platform point to elliptical further away. This is based on the radiation pattern of the antenna in the HAP [36]. Its shown in [37] that an estimated 265 cells are required to provide contiguous coverage within a service area of 60km radius. The result is based on a 1600 element planar phased array antenna with transmit power of 2 W, 2.1 GHz carrier frequency and using a free-space path loss with randomly distributed shadowing propagation model. The antenna elements are spaced at half-wavelength apart and the estimated area of the array is approximately 15 m 2 . Assuming a minimum RF output power for each cell of 2 W and a PA efficiency of 47 % , the power consumed by the access network of the communication system is computed using (30). Considering that in [19,35] it is estimated that the PA consumes about 57 % of the total consumption, we conservatively assume the contribution of the PA to be 50%, i.e., γ = 0.5 . The total power consumption of the base station payload estimated using (30) is 2.3 kW. Therefore, the 60 kW value obtained using the EARTH model presents the hard upper limit of power consumption. Realistically, the power consumption for the stated scenario is more likely to be around the 2.3 kW range. However, this is dependent on the contribution of the power amplifier to the total BS power consumption.

5. Case Study

Here, an analysis of the possible energy generation and consumption for different solar-powered HAPs is presented. This is based on year-end solstice (21st December, d a y = 355 ), which is the shortest day in the northern hemisphere. The following analysis is based on a worst-case scenario where the batteries supporting the platform at the start of the year-end solstice have zero charge. Therefore, enough solar energy needs to be harvested to support the platform and payload throughout the day considering two locations—Enugu, Nigeria (Lat: 6.60° N) and York, United Kingdom (Lat: 53.96° N). These represent equatorial African and northern European scenarios. With focus on the current state-of-the-art in solar powered HAPs, the analysis considers aircraft with wingspans ranging between 25–35m. Considering solar-powered aircraft-based HAPs with different wingspans, the parameters of some example platforms are highlighted in Table 1.

5.1. Energy Collection

Consider the Zephyr-6, its wing aspect ratio A R = 9.5 with a wingspan S w = 18.28 m and chord k c d = 2.13 m. Due to the absence of published data, extrapolating linearly from these, we estimate the chords of the 25 m, 33 m and 35 m wingspan aircraft using the following expression:
K c d i = 2.13 S w i 18.28 ,
where S w i 25 , 33 , 35 . Using (32), the chords of the example platforms are estimated at approximately 2.9 m, 3.9 m and 4.1 m for the 23 m, 33 m, and 35 m wingspan platforms, respectively. We approximate the wing surface area as the product of chord and wingspan. Thus, the surface area for the platforms with different wingspans are estimated as given in Table 2.
The wingspan extrapolation of (32) does not take into account the additional surface area in the tail stabilizer of the platform where solar cells are deployable. An allowance of 3 m 2 per tail area is added considering the characteristics of the example platforms to obtain the total area available for solar panel deployment. The current state-of-the-art in solar cell is an ultra-thin GaAs solar cell with power conversion efficiency of 37.5 % and specific power of 3 kW/kg [40]. Using the proposed energy collection model given in (14) and assuming a solar cell efficiency of 37.5 % , we evaluate the total energy collected per wingspan on the 21st of December at Enugu and York in Table 3 following the result plotted in Figure 8. The total solar irradiance per unit area for York and Enugu used in the evaluations are 1.5 kWh/m 2 and 10 kWh/m 2 respectively based on Figure 8.
Notice the significant difference in the solar irradiance between Enugu and York. Typically, this conforms to the expectation of lesser solar irradiance towards the North Pole. Combining (14), (20) and (30), an inequality that must be satisfied in order to overcome the energy constraint and close the energy budget for a platform with a particular wingspan is expressed as follows:
E n T P r e q + P H T + P A v T .
Equation (33) states that the total energy E n T available to the HAP must be greater than or equal to the product of the HAP operation duration T and the sum of the power required to maintain the platform in flight P r e q , power payload P H T and avionics P A v . Rewriting (33), the following expression is obtained:
η p v A p v G T i T C P o u t γ η P A P A v C D η p r o p C L 3 2 2 W T 3 ρ A w .
We assume that the area of solar cell on the platform A p v is equal to the area of the wing A w . Hence, we can express the area of the wing as S w k c d ; therefore, (34) becomes
γ η P A η p v S w k c d G T i T C P o u t γ T η P A P A v γ T η P A C D η p r o p C L 3 2 2 W T 3 ρ S w k c d .
The resulting Equation (35) is complex with numerous inter-related variables. However, ensuring that the energy budget of a platform closes requires a solution to Equation (35). Considering the wingspan, among other variables, the longest wingspan that forms part of the solution of the equation is the most desirable. This is because the longer the wingspan, the bigger the wing area and hence the area available for solar cells. Any method of solving Equation (35) must consider the inter-relationship between the variables of the equation. Considering the left-hand side (l.h.s) and right-hand side (r.h.s) of the inequality as different functions of S w , the l.h.s becomes a linear function of S w while the r.h.s becomes a cubic function of S w . The most desirable wingspan is the highest wingspan at a point of intersection of the two functions for a particular set of variables. A point of intersection is a point where the inequality condition is satisfied. Figure 11 presents an indicative plot of the functions showing one point of intersection and the corresponding wingspan.

5.2. Energy Consumption

The following subsections provide estimates of the energy consumption for propulsion, wireless communication and avionics payload, respectively.

5.2.1. Propulsion

In order to estimate the power required by each of the platforms using the power equation, the lift and drag coefficients are necessary. The lift coefficient is estimated building from (15) as
C L = 2 W T ρ V 2 A w = 2 m t g ρ V 2 A w ,
where m t and g are the mass of the platform and the acceleration due to gravity. Assuming the true airspeed V = 20 m/s, air density ρ = 0.09 kg/m 3 at 20 km altitude and g = 9.8 m/s 2 , C L is 0.54 , 0.60 , and 0.57 for typical aircraft with wingspans of 25 m, 33 m and 35 m, respectively.
Wireless deployment of cells from different aircraft flying at different airspeed over an area may differ as a result of cell displacement due to the airspeed difference. Thus, comparative analysis of the wireless communication system power consumption becomes more complex. Consequently, a constant airspeed approach is used in this paper for simplified analysis and to facilitate a direct comparison between the different aircraft. However, the example platform designs may have different true airspeed in practice, but we try to avoid extrapolating from aircraft that is intended for travel to a HAP that is intended to be quasi-stationary. Drag coefficient values are obtained using a drag polar, which is a tabular or graphical relationship between lift and drag coefficients for different aerofoils. All platforms under study use laminar aerofoils. In [11], the drag polar of two typical laminar aerofoils are shown. Drag coefficients corresponding to the lift coefficients of 25 m, 33 m and 35 m wingspan aircraft evaluated above are estimated from the drag polar to be approximately 0.0070 , 0.0075 and 0.0071 , respectively. The power required by the platforms is estimated using (20). The power required by the platforms with different wingspans considered in this paper is estimated in Table 4.
The power required to maintain a steady horizontal flight and steady flight at a banking angle for the different platforms obtained using (26) is shown in Figure 12. The figure shows that, for steady flights at bank angles less than 30 , the power required is close to that required for a steady level flight. Assuming the Helinet and ITU proposed position cylinders of radius 4 km and 0.61 km [41], the bank angle required to maintain an aircraft within the cylinders are approximately 1 and 4 respectively. At these bank angles, which can be obtained using (23), it is observed in Figure 12 that difference in the required power compared with the power required for steady level flight is negligible. Thus, all calculations and analysis in this paper applies also to HAPs flying in the defined position cylinders. From (26),
lim α 90 1 cos ( α ) 2 P r e q = .

5.2.2. Communication and Avionics

Considering a service area radius of 60 km, we estimate that contiguous coverage can be provided by deploying a minimum of 265 cells as shown by the studies in [37]. If each cell transmits a maximum of 2 W with PA efficiency of 50 % , the power consumption by the communication payload can be estimated using Equation (30) as approximately 2.3 kW. If a smaller service area radius of about 30 km is considered, contiguous coverage can be provided by deploying at least 187 cells based on the simulations described in [37], using similar assumptions for the 60 km radius service area case. Therefore, the power consumption for a 30 km radius service area is estimated to be approximately 1.6 kW.
The consumption by the avionics system can be estimated using parameters in [9] where the avionics mass-to-power ratio is given as 6 W/kg and weight of the avionic sub-system is 22 kg. The total avionics power consumption, P A v , for an estimated 22 kg avionic sub-system is approximately equal to 132 W.

6. Analysis

The total power consumption, P t o t = P r e q + P H T + P A v of the different platforms and payload is evaluated as given in Table 5. The feasibility analysis of the case study platforms in terms of energy harvesting and consumption based on the proposed models are discussed in two categories. The first highlights the feasibility of wireless communication service provisioning in a realistic coverage area of 30 k m radius while the other underscores the feasibility in an extended coverage scenario.

6.1. 30 km Radius Service Area

Most HAP studies [42,43] consider service area of 30 km radius. In order to conform to the majority of the studies, we also consider a service area of 30 km radius. The total energy required for a 24 h continuous operation of the HAP system ( 24 P t o t ) at full capacity is approximately 48 kWh for 25 m wingspan HAP, and 53 kWh for both the 33 m and 35 m wingspan HAP. The total available energy in York, which is evaluated using (14) and presented in Table 3, is approximately 42 kWh, 74 kWh and 80 kWh, respectively. Clearly, the energy harvested by the 25 m platform is below its requirement, while the 33 m and 35 m platforms can potentially harvest sufficient energy to support their operation. Figure 13 and Figure 14 show the estimated total harvested energy by the example platforms of varying wingspans (thus different solar cell area) in Enugu and York, respectively. Considering the minimum 9 kWh, 13.5 kWh and 14.2 kWh (i.e., 24 ( P r e q + P A v ) ) required energy for continuous flight for a day by the respective platforms, the total energy harvested by the platforms is sufficient to keep them in flight. However, 24 h wireless communications from a HAP over a service area of 30 km radius is not feasible with the 25 m platform due to the insufficient energy available to the communication payload. However, considering the 1.6 kW payload power consumption, sufficient energy is available to provide approximately 21 h of wireless communications from the 25 m.
On the other hand, configuring the 25 m platform to operate at full capacity for half of the day and half capacity for the second half of the day by gliding for instance can increase the energy available to the communication payload. For instance, energy can be saved by allowing the HAP to increase its altitude slowly during the day while harvesting energy, and gliding at night to minimize energy consumption [6]. Consequently, the total energy required for continuous flight of the 25 m HAP can be reduced to 6.4 kWh. This configuration allows for an increase in the duration of wireless communication delivery from the 25 m wingspan HAP to approximately 22 h. The use of HFC to complement the available solar energy is an alternative to improve the available power to both platform and payload, thereby increasing the duration of operation. A conventional HFC can be used with sufficient hydrogen fuel to last through a required period as shown in Figure 15. Practically, the HFC is needed for only a few days or weeks of the year when the total solar irradiance is at the minimum. Note that we have neglected the power consumption of the backhaul network in our analysis thus far; however, it must be considered in realistic deployments. The HAP operator may decide how best to deploy the HAP system to provide services for a determined duration of time per day. Considering the 33 m and 35 m platforms, continuous 24 h full operation is possible because of the availability of sufficient energy.
It is important to note that, apart from energy availability, the feasibility of a platform for wireless communication is further limited by the maximum payload weight it can support. This is important when considering the weight of the energy storage and other subsystems for the HAP mission. As highlighted earlier, the hard constraint here is the available payload weight allowance on the HAP. A typical specific energy of hydrogen storage tank varies between 1–2 kWh/kg [44,45,46] with the current state-of-the-art. The estimated payload energy consumption in 24 h is approximately 38 kWh. Using a fuel cell of 2 kWh/kg considering the current state-of-the-art, the weights for the energy storage and payload needed for 24 h continuous full-capacity HAP operation is 19 kg. Hence, perpetual delivery of wireless communications is not possible using a single HAP. However, the possibility of a high power fuel cell with specific energy of >3.3 kWh/kg is shown by Eickhoff and Klein in their patent application [47]. Futuristically, assuming the proposed HFC by Eickhoff and Klein with specific energy of 3.3 kWh/kg can be commercialised by overcoming its oxygen accumulation problem, the energy storage system weight becomes approximately 11.5 kg. Considering the weight of other necessary payloads, in both cases, the total payload weight limit of the 25 m wingspan platform, as given in Table 1, is exceeded. Therefore, the 25 m wingspan platform is not suitable for wireless communications. However, if the proposed HFC by Eickhoff and Klein is used, the 33 m and 35 m wingspan platforms can certainly support the 11.5 kg energy storage system with 8.5 kg and 3.5 kg available for other payload respectively based on Table 1. The 33 m and 35 m wingspan platforms with less payload constraints are certainly feasible in both Enugu and York considering their significantly higher available solar energy.

6.2. 60 km Radius Service Area

Due to the increased energy consumption resulting from extending the service area, the 25 m wingspan HAP can harvest enough energy to maintain operation for approximately 15 h. This is based on the 42 kWh generated energy and 2.7 kWh total energy consumption as highlighted in Table 3 and Table 4. However, we show in the previous subsection that the 25 m wingspan platform is not ideal for wireless communication from HAP mostly due to its weight limitations. Therefore, our analysis in this subsection largely focuses on the 33 m and 35 m wingspan platforms for an extended wireless coverage significantly beyond an area of 30 k radius. Based on the studies in [37] on HAP cell deployments, wireless service provisioning using the 33 m and 35 m wingspan platforms in an area of 60 km radius for a whole day requires approximately 70 kWh of energy (i.e., 24 P t o t ). In both Enugu and York, sufficient energy is available to the platforms for 24 h continuous wireless communications service delivery as highlighted in Table 3. This confirms the feasibility of the 33 m and 35 m platforms subject to overcoming the weight constraint.
Assuming half the energy is expended for daytime operation, the energy storage needed for night-time operation must have the capacity of storing approximately 35 kWh of energy for both platforms. With the HFC developed by Eickhoff and Klein, HAP extended coverage in equatorial regions is potentially feasible in the near future subject to the weight of other necessary subsystems. The feasibility of the 25 m wingspan platform is power and weight limited in the UK and other places further up northern hemisphere while it is mostly only weight constrained in equatorial regions. Conversely, the 33 m and 35 m wingspan platforms are potentially feasible in terms of energy storage weight especially if storage systems with high specific energy are used. However, the weight of other payloads like the access and backhaul subsystems may affect the feasibility of both platforms. Realistically, it is difficult to overcome the limitations of both energy and weight requirements for continuous whole-day operations on the 21st of December with the currently available platforms.
Nevertheless, with improvements in HAP design such as wingspan, these limitations can be overcome in the future. Certainly, airships with higher payload and power allowance present a viable alternative for all scenarios discussed. Significant development in aeronautics will expectedly allow for the development of platforms with higher form factor. Thus, the capability of lifting heavier payloads may be realised promptly with continuous development in aeronautic technology. For instance, the Boeing 737 (B-737) aircraft has a wingspan of 35.79 m and can lift a maximum of 186 passengers. The Boeing 747 (B-747) with higher form factor has a wingspan of 60 m, lifting a maximum of 660 passengers. The ratio of the wingspan of B-747 to B-737 is approximately 1.68 . Similarly, the ratio of B-747 payload to B-737 is approximately 3.55 . Hence, the payload increase factor is approximately 1.68 × 3.55 (=5.96). Therefore, doubling the wingspan for instance can allow for up to six times the amount of payload an aircraft can support. See (16) for the relationship between wingspan and lift force for any given aircraft. Doubling the wingspan of Phasa-35 to get 70 m for instance could probably enable the new aircraft to lift 90 kg worth of payload. It is worth noting that increasing wingspan of an aircraft is complicated as a result of the size, weight and power (SWAP) phenomenon. However, longer wingspan is aerodynamically achievable as demonstrated by NASA Pathfinder and Centurion aircraft. NASA Pathfinder, a solar-powered aircraft with a wingspan of 29.5 m supports a payload of 45 kg. On the other hand, Centurion with double the wingspan at 61.8 m supports a payload of up to 270 kg, which is exactly six times that of Pathfinder. Unfortunately, even though Pathfinder only flew for a few hours at high altitude [48] and Centurion only achieved low altitude validation flights [49], the fact remains that longer wingspan results in higher payload support. This is achievable as demonstrated by these platforms and their limitations can be overcome with more advanced engineering, which is beyond what was obtainable 15 years ago. Another interesting platform, specially designed for wireless communications, is the 78 m wingspan solar-powered aircraft from HAPSMobile called ‘Hawk 30’ [50]. With its large wingspans, the platform will overcome both the power and weight constraints, and if the platform’s flight tests scheduled for the second half of 2019 is successful, the feasibility of HAPs for wireless communication will increase with faster than anticipated deployment of HAPs. Apart from increasing form factor of aircraft, network splitting can be used to minimize energy consumption and payload weight by having different hardware located either on the aircraft or on the ground by using Cloud-based Random Access (C-RAN) functional splitting. C-RAN systems adapt network functional splitting by separating the functionality of the BBU or RH [51].

7. Conclusions

In this paper, the energy management of solar-powered aircraft-based HAP for wireless communications is studied. Models for estimating energy collection and consumption in a HAP have been proposed. It has been shown that, with the current platforms, with wingspans ranging between 25–35 m, wireless communications can be provided from a HAP for a duration of 15–24 h per day depending on the platform, latitude of operation, operation configuration, and radius of coverage. However, for continuous operation for a whole day with current platforms with smaller wingspan, during the days of the year with limited daylight, the use of hydrogen fuel cell systems is proposed to supplement the energy captured. Although the feasibility of current platforms is both energy and power limited, it is suggested that doubling the wingspan of aircraft will provide sufficient gains in payload carrying capacity, thereby enhancing feasibility. Furthermore, using C-RAN functional splitting proposed for next generation wireless systems can increase the feasibility of solar-powered aircraft-based HAPs for wireless communications.

Author Contributions

Conceptualization, S.C.A., D.G. and P.D.M.; methodology, S.C.A., D.G. and P.D.M.; software, S.C.A.; validation, S.C.A., D.G., and P.D.M.; formal analysis, S.C.A., D.G., P.D.M. and M.D.Z.; investigation, S.C.A.; resources, S.C.A. and M.D.Z.; writing—original draft preparation, S.C.A. and M.D.Z.; writing—review and editing, S.C.A. and N.M.; visualization, S.C.A.; supervision, D.G. and P.D.M.; project administration, D.G.; and funding acquisition, D.G. All authors have read and agreed to the published version of the manuscript.

Funding

This research was carried out by University of York and has been funded by Orange under research agreement No: H09121. The research remains the property of Orange.

Conflicts of Interest

The authors declare no conflict of interest.

Appendix A

Table A1. A list of mathematical symbols. The unit of all angles is radians.
SymbolMeaning
ε Angle of obliquity
G i Instantaneous extra-terrestrial solar intensity
G S C Standard solar constant at zero air mass
δ Solar declination angle
dNumber of day in a year
LLatitude
hSolar hour angle
θ Solar zenith angle
G m i Maximum radiation intensity
ξ m Maximum elevation angle of the sun at a given latitude on a given day
τ Duration of time in hours from sunrise and sunset
G T i Total extra-terrestrial solar irradiance per m 2
E n T Total energy collected in a day at a given latitude
η p v Efficiency of the photovoltaic system
η p r o p Propeller efficiency
η P A Power amplifier efficiency
A p v Area of the photovoltaic system
P r e q Power required to maintain a steady horizontal flight
P H T Total communication payload power consumption
P A v Aircraft avionic system power consumption
THAP operation duration
A w Aircraft wing surface area
k c d Aircraft chord length
W T Aircraft weight
m T Aircraft mass
S w Aircraft wingspan
gAcceleration due to gravity
RRadius of HAP coverage area
F C Centripetal force
F l Lift force
F t Thrust force
α Banking angle
ρ Air density
VAircraft velocity
C L Coefficient of lift
C D Coefficient of drag
CNumber of cells
P P A Power amplifier input power
P o u t Maximum RF power output of a cell
γ Ratio of power amplifier power consumption to total base station consumption

References

  1. Cestino, E. Design of solar high altitude long endurance aircraft for multi payload & operations. Aerosp. Sci. Technol. 2006, 10, 541–550. [Google Scholar]
  2. Raval, S. Smart Sensing for Mineral Exploration through to Mine Closure. Int. J. Georesources Environ. 2018, 4, 115–119. [Google Scholar] [CrossRef]
  3. Romeo, G.; Frulla, G. HELIPLAT: Design of high altitude very-long endurance solar powered platform for telecommunication and earth observation. In Proceedings of the DASIA 2002, Dublin, Ireland, 13–16 May 2002; pp. 54.1–54.12. [Google Scholar]
  4. Watts, A.C.; Ambrosia, V.G.; Hinkley, E.A. Unmanned Aircraft Systems in Remote Sensing and Scientific Research: Classification and Considerations of Use. Remote Sens. 2012, 4, 1671–1692. [Google Scholar] [CrossRef] [Green Version]
  5. Boucher, R.J. Sunrise, the world’s first solar-powered airplane. J. Aircr. 1985, 22, 840–846. [Google Scholar] [CrossRef]
  6. Gao, X.Z.; Hou, Z.X.; Guo, Z.; Liu, J.X.; Chen, X.Q. Energy management strategy for solar-powered high-altitude long-endurance aircraft. Energy Convers. Manag. 2013, 70, 20–30. [Google Scholar] [CrossRef]
  7. Oettershagen, P.; Melzer, A.; Mantel, T.; Rudin, K.; Stastny, T.; Wawrzacz, B.; Hinzmann, T.; Leutenegger, S.; Alexis, K.; Siegwart, R. Design of small hand-launched solar-powered UAVs: From concept study to a multi-day world endurance record flight. J. Field Robot. 2017, 34, 1352–1377. [Google Scholar] [CrossRef] [Green Version]
  8. Philips, H.W. Some Design Considerations for Solar-Powered Aircraft. In NASA Technical Paper 1675. 1980. Available online: https://ntrs.nasa.gov/archive/nasa/casi.ntrs.nasa.gov/19820024474.pdf (accessed on 10 January 2019).
  9. Alsahlani, A.; Johnston, L.J.; Atcliffe, P.A. Design of a high altitude long endurance flying-wing solar-powered unmanned air vehicle. Prog. Flight Phys. 2017, 9, 3–24. [Google Scholar]
  10. Dantsker, O.; Theile, M.; Caccamo, M.; Mancuso, R. Design, Development, and Initial Testing of a Computationally-Intensive, Long-Endurance Solar-Powered Unmanned Aircraft. In Proceedings of the 2018 Applied Aerodynamics Conference, Atlanta, GA, USA, 25–29 June 2018; pp. 1–18. [Google Scholar]
  11. Mattos, B.; Secco, N.; Salles, E.F. Optimal Design of a High-Altitude Solar-Powered Unmanned Airplane. J. Aerosp. Technol. Manag. 2013, 5, 349–361. [Google Scholar] [CrossRef] [Green Version]
  12. Park, D.; Lee, Y.; Cho, T.; Kim, C. Design and Performance Evaluation of Propeller for Solar-Powered High-Altitude Long-Endurance Unmanned Aerial Vehicle. Int. J. Aerosp. Eng. 2018, 2018, 1–23. [Google Scholar] [CrossRef]
  13. Romeo, G.; Frulla, G.; Cestino, E. Design of a High-Altitude Long-Endurance Solar-Powered Unmanned Air Vehicle for Multi-Payload and Operations. J. Aerosp. Eng. 2007, 221, 199–216. [Google Scholar] [CrossRef] [Green Version]
  14. Kranjec, B.; Sladic, S.; Giernacki, W.; Bulic, N. PV System Design and Flight Efficiency Considerations for Fixed-Wing Radio-Controlled Aircraft—A Case Study. Energies 2018, 11, 2648. [Google Scholar] [CrossRef] [Green Version]
  15. Nelson, J.P. High-Altitude Considerations for Electrical Power Systems and Components. IEEE Trans. Ind. Appl. 1984, IA-20, 407–412. [Google Scholar] [CrossRef]
  16. Aglietti, G.S.; Redi, S.; Tatnall, A.R.; Markvart, T. High altitude electrical power generation. WSEAS Trans. Environ. Dev. 2008, 4, 1067–1077. [Google Scholar]
  17. Brizon, M. Solar Energy Generation Model for High Altitude Long Endurance Platforms. Institute of Flight Systems: Braunschweig, Germany. Available online: https://pdfs.semanticscholar.org/f837/02e7ab679b192c9a237dc0c150b94bdea317.pdf (accessed on 10 October 2018).
  18. Shin, K.; Hwang, H.; Ahn, J. Mission Analysis of Solar UAV for High-Altitude Long-Endurance Flight. J. Aerosp. Eng. 2018. [Google Scholar] [CrossRef]
  19. Auer, G. How much energy is needed to run a wireless network? IEEE Wirel. Commun. 2011, 18, 40–49. [Google Scholar] [CrossRef]
  20. Deruyck, M.; Joseph, W.; Martens, L. Power consumption model for macrocell and microcell base stations. Trans. Emerg. Telecommun. Technol. 2014, 31, 320–333. [Google Scholar] [CrossRef] [Green Version]
  21. Yuniarti, D. Regulatory Challenges of Broadband Communication Services from High Altitude Platforms (HAPs). In Proceedings of the 2018 International Conference on Information and Communications Technology (ICOIACT), Yogyakarta, Indonesia, 6–7 March 2018; pp. 919–922. [Google Scholar]
  22. Lim, T.M.; Cramer, T.M.; Lumpp, J.E.; Rawashdeh, S.A. A Modular Electrical Power System Architecture for Small Spacecraft. IEEE Trans. Aerosp. Electron. Syst. 2018, 54, 1832–1849. [Google Scholar] [CrossRef] [Green Version]
  23. Islam, R.; Saraswat, K. Limitation of Optical Enhancement in Ultra-thin Solar Cells Imposed by Contact Selectivity. Sci. Rep. 2018. [Google Scholar] [CrossRef]
  24. Dincer, I. Hydrogen and fuel cell technologies for sustainable future. Jordan J. Mech. Ind. Eng. 2008, 2, 1–14. [Google Scholar]
  25. Sanchez, V.M.; Barbosa, R.; Cruz, J.C.; Chan, F.; Hernandez, J. Optimal Sizing of a Photovoltaic-Hydrogen Power System for HALE Aircraft by means of Particle Swarm Optimization. Math. Probl. Eng. 2015. [Google Scholar] [CrossRef]
  26. Dwivedi, V.S.; Kumar, P.; Ghosh, A.K.; Kamath, G.M. Selection of Size of Battery for Solar Powered Aircraft. Math. Probl. Eng. 2018, 51, 424–430. [Google Scholar] [CrossRef]
  27. Lee, B.; kWon, S.; Park, P.; Kim, K. Active power management system for an unmanned aerial vehicle powered by solar cells, a fuel cell, and batteries. IEEE Trans. Aerosp. Electron. Syst. 2014, 50, 3167–3177. [Google Scholar] [CrossRef]
  28. Jenkins, A. The Sun’s position in the sky. Eur. J. Phys. 2013, 34, 633–652. [Google Scholar] [CrossRef]
  29. Matricciani, E. Space communications with variable elevation angle faded by rain: Radio links to the Sun–Earth first Lagrangian point L1. Int. J. Satell. Commun. Netw. 2016, 34, 809–831. [Google Scholar] [CrossRef] [Green Version]
  30. Honsberg, C.; Bowden, S. Elevation Angle. Available online: https://www.pveducation.org/pvcdrom/properties-of-sunlight/elevation-angle (accessed on 2 February 2019).
  31. ITACA. Solar Energy Reaching The Earth’s Surface. Available online: https://www.itacanet.org/the-sun-as-a-source-of-energy/part-2-solar-energy-reaching-the-earths-surface/ (accessed on 2 February 2019).
  32. Liu, R.I.; Zhang, Z.J.; Jiao, Y.F.; Yang, C.H.; Zhang, W.J. Study on Flight Performance of Propeller-Driven UAV. Int. J. Aersp. Eng. 2019. [Google Scholar] [CrossRef]
  33. Katzis, K.; Grace, D. Inter-high-altitude-platform handoff for communications systems with directional antennas. URSI Radio Sci. Bull. 2010, 333, 29–38. [Google Scholar]
  34. Rogers, F.D. Turning Performance-Sustained Level Turns. Available online: http://www.nar-associates.com/technical-flying/turning/turnprpa_wide_screen.pdf (accessed on 13 November 2018).
  35. Desset, C.; Debaillie, B.; Giannini, V.; Fehske, A.; Auer, G.; Holtkamp, H.; Wajda, W.; Sabella, D.; Richter, F.; Gonzalez, M.J.; et al. Flexible power modeling of LTE base stations. In Proceedings of the IEEE WCNC, Shanghai, China, 1–4 April 2012; pp. 2858–2862. [Google Scholar]
  36. Holis, J.; Grace, D.; Pechac, P. Effect of Antenna Power Roll-Off on the Performance of 3G Cellular Systems from High Altitude Platforms. IEEE Trans. Aerosp. Electron. Syst. 2010, 46, 1468–1477. [Google Scholar] [CrossRef]
  37. Arum, S.C.; Grace, D.; Mitchell, P.D. Beam-Pointing Algorithm for Contiguous High-Altitude Platform Cell Formation for Extended Coverage. In Proceedings of the IEEE VTC-Fall, Honolulu, HI, USA, 22–25 September 2019. [Google Scholar]
  38. Airbus Defence and Space. Zerphyr Persistence and Flexibility. Available online: https://lf5422.com/wp-content/uploads/2018/08/0296_18_2_zephyr_datasheet_e_horizontal_a4.pdf (accessed on 2 November 2018).
  39. BAE Systems. PHASA-35. Available online: http://prismaticltd.co.uk/products/phasa-35/ (accessed on 10 October 2018).
  40. MicroLink Devices Inc. MicroLink Devices Achieves Certified 37.75% Solar Cell Power Conversion Efficiency. Available online: http://mldevices.com/index.php/news (accessed on 10 November 2018).
  41. Capstick, M.H.; Grace, D. High altitude platform mm-wave aperture antenna steering solutions. Wirel. Pers. Commun. 2005, 32, 215–236. [Google Scholar] [CrossRef]
  42. Thornton, J.; Grace, D.; Spillard, C.; Konefal, T.; Tozer, T.C. Broadband communications from a high-altitude platform: The European HeliNet programme. J. Electron. Commun. Eng. 2001, 13, 138–144. [Google Scholar] [CrossRef]
  43. Nagpal, L.; Samdani, K. Project Loon: Innovating the connectivity worldwide. In Proceedings of the IEEE RTEICT, Bangalore, India, 19–20 May 2017; pp. 1778–1784. [Google Scholar]
  44. Mendez, A.; Leo, T.J.; Herreros, M.A. Current state of technology of fuel cell power systems for autonomous underwater vehicles. Energies 2014, 7, 4676–4693. [Google Scholar] [CrossRef] [Green Version]
  45. Wishart, J. Fuel Cells vs Batteries In the Automotive Sector. Intertek Technol Report 2014. Available online: https://www.researchgate.net/publication/311210193_Fuel_cells_vs_Batteries_in_the_Automotive_Sector (accessed on 2 February 2019).
  46. Pan, Z.F.; An, L.; Wen, C.Y. Recent advances in fuel cells based propulsion systems for unmanned aerial vehicles. Appl. Energy 2019, 240, 473–485. [Google Scholar] [CrossRef]
  47. Eickhoff, S.J.; Klein, J.M. High Power Fuel Cell System. US Patent US20180277860A1, 16 July 2019. [Google Scholar]
  48. Flittie, K.; Curtin, B. Pathfinder solar-powered aircraft flight performance. AIAA 1998, 98, 618–632. [Google Scholar]
  49. DelFrate, J.H. Helios Prototype Vehicle Mishap: Technical Findings, Recommendations, and Lessons Learned. NASA Techn. Report 2008. Available online: https://ntrs.nasa.gov/archive/nasa/casi.ntrs.nasa.gov/20070022260.pdf (accessed on 17 January 2020).
  50. SoftBank Corp.; HAPSMobile Inc.; SoftBank Corp. Develops Aircraft That Delivers Telecommunications Connectivity from the Stratosphere. Available online: https://www.hapsmobile.com/en/news/press/2019/20190425_01/ (accessed on 10 February 2019).
  51. Checko, A.; Christiansen, H.L.; Yan, Y.; Scolari, L.; Kardaras, G.; Berger, M.S.; Dittmann, L. Cloud RAN for Mobile Networks—A Technology Overview. IEEE Commun. Surv. Tut. 2015, 17, 405–426. [Google Scholar] [CrossRef] [Green Version]
Figure 1. Components of solar-powered HAP energy ecosystem contributing to the total energy consumption of a solar-powered HAPs for wireless communication.
Electronics 09 00179 g001
Figure 2. The earth and the sun on the celestial sphere. ξ is the slowly changing elevation angle of the sun as observed from earth while ε is the angle of obliquity. x , y , z are coordinate axes at an observation point.
Electronics 09 00179 g002
Figure 3. The movement of the sun from sunrise to sunset around the platform. Both the elevation and zenith angles of the sun are slowly changing at the same rate from sunrise to sunset.
Electronics 09 00179 g003
Figure 4. The depiction of Lambert’s law. Intensity at the plane is maximum when the source is perpendicular. Intensity decreases with increasing angle of the source from the perpendicular axis.
Electronics 09 00179 g004
Figure 5. The sun’s elevation angle time series function for a typical day. ξ m is the maximum altitude of the sun in radians. τ is the time (in hours) from sunrise to sunset at the given latitude. The rising part of the triangle indicates sunrise while the falling part indicates sunset.
Electronics 09 00179 g005
Figure 6. Heuristically determined elevation angle time series for spring equinox (E), winter and summer solstice (WS & SS) from [29] annotated with the proposed triangular time series function. The dashed line shows the proposed triangular function with increasing accuracy with respect to the increasing maximum elevation angle.
Electronics 09 00179 g006
Figure 7. Duration of daylight for given days of the year. This varies as the distance of sun from earth varies throughout the year.
Electronics 09 00179 g007
Figure 8. Total solar irradiance per m 2 at various locations for a given day of the year highlighting the longer days in northern hemisphere.
Electronics 09 00179 g008
Figure 9. Forces acting on a HAP in flight.
Electronics 09 00179 g009
Figure 10. Steady circular motion of a HAP flying at a banking angle α .
Electronics 09 00179 g010
Figure 11. Indicative plot of the functions of HAP wingspan. The desirable wingspan that satisfies the energy requirements of the HAP is determined at the equal point of the functions.
Electronics 09 00179 g011
Figure 12. Power required for steady banked flights at different banking angles the for different example wingspans.
Electronics 09 00179 g012
Figure 13. Estimated Total Harvested Energy for different platform wingspans—Enugu (Lat: 6.6° N).
Electronics 09 00179 g013
Figure 14. Estimated Total Harvested Energy for different platform wingspans—York (Lat: 53.96° N).
Electronics 09 00179 g014
Figure 15. Proposed energy subsystem using hydrogen fuel cells.
Electronics 09 00179 g015
Table 1. Case study examples of solar-powered high altitude platforms [38,39].
Wingspan (m)Platform Mass (kg)Payload Mass (kg)Example Platforms
25755Zephyr-S
3314020Zephyr-T
3515015Phasa-35
Table 2. Example platform wing areas.
Wingspan (m)Wing Area (m 2 )Allowance (m 2 )Solar Area (m 2 )
2573376
331276133
351430143
Table 3. Solar energy collected by platforms with different wingspans on the year-end solstice.
Wingspan (m)Solar Area (m 2 )Enugu (kWh)York (kWh)
257629042
3313350774
3514354580
Table 4. Estimated parameters of platforms with different wingspans.
Wingspan (m)Wing Area (m 2 )Power Required (W)Lift Coefficient, C L Drag Coefficient, C D
2573243 0.54 0.0070
33127429 0.60 0.0075
35143459 0.57 0.0071
Table 5. Estimated power consumption of the case study platforms.
Wingspan (m) P tot [30 km] (kW) P tot [60 km] (kW)
25 2.0 2.7
33 2.2 2.9
35 2.2 2.9

