Article

Passive Wireless Measurement System Based on Wireless Power Transfer Technology

1
School of Electrical Engineering and Automation, Wuhan University, Wuhan 430072, China
2
State Grid Chongqing Jiangbei Power Supply Company, Chongqing 400020, China
3
Sichuan Surveying and Mapping Product Quality Test & Control Center, Chengdu 610041, China
*
Authors to whom correspondence should be addressed.
Electronics 2019, 8(9), 1048; https://doi.org/10.3390/electronics8091048
Submission received: 1 August 2019 / Revised: 1 September 2019 / Accepted: 11 September 2019 / Published: 18 September 2019
(This article belongs to the Section Microwave and Wireless Communications)

Abstract

:
This paper presents a passive wireless measurement system based on wireless power transfer (WPT) technology. It does not require separate information and power transmission circuits. The data receiver only needs to send a short signal to the data collector through WPT, and then the information of the measured environment can be obtained by analyzing the feedback signal from the data collector. Three concepts are included in this system, namely (1) the constant oscillation period of oscillation attenuation waveforms; (2) the characteristics of inductive coupling WPT; and (3) the relationship between sensitive resistances and environmental parameters. It is very suitable for measuring the parameters in an internal or closed space. The data collector is small in size and simple in structure, and no power is needed. It has stable performance after implantation and can be used permanently. Results obtained from simulations and experiments are included. They verify the measurement process and measurement results meet the requirements of passive wireless measurement, and the measurement error is less than 1.5%.

1. Introduction

In the era of rapid development of the Internet of Things (IoT), data acquisition systems have been widely applied in all walks of life [1,2,3], including biomedicine, engineering construction, and industrial manufacturing [4,5,6]. In the process of data acquisition, both information and power need to be transmitted through wires. Wires are the necessary medium for connecting the data receiver and collector. When the data acquisition system is installed, the reasonable arrangement of wires must be taken into consideration. Not only the flexibility of data acquisition systems is influenced by wires, but also the environmental beauty. In some special places, power being provided by wires is not applicable, such as confined environments. The key to relieve the restriction of wires is to realize the wireless transmission of data and power between receivers and collectors [7,8,9,10,11].
In order to achieve wireless data transmission, the common methods are 4G network, Bluetooth, RFID, and so on [3,12,13]. These ways can realize wireless information transmission in different areas, but they also bring other problems with them. The complexity of the system will increase. The data collector and receiver need to add wireless information transmitting and receiving circuits. The system needs more power for data transmission, especially the data collector. Moreover, the accuracy of information transmission is lower than that of wired transmission [3].
There are also some ways of removing the constraints of data acquisition systems requiring wires to supply power. They all have some inherent defects.
(1)
The power of data collectors is supplied by batteries [3,10]. Batteries can provide stable power for the system. But there are some unavoidable problems in this way, including the increase of the volume and weight of data collectors, the need to check and replace batteries regularly, and the failures of batteries.
(2)
Self-powered technology used for data collectors [9,13,14,15]. The mechanical vibration of environments can be converted into power by self-power technology. However, very little power can be collected. It is difficult to meet the power consumption of the data collector and the information transmission circuit.
(3)
The data collector is powered by wireless power transfer (WPT) [7,16,17]. Sufficient power can be offered by WPT, but receiving coils and adjustment circuits need to be added to the data collector. It will increase the complexity of data collectors.
No matter which way is adopted to realize the wireless transmission of data and power between data collectors and receivers, some circuits and other structures need to be added. In some special places, the added circuits will limit the use of data acquisition systems. For example, in high voltage or strong magnetic field environments, the withstand voltage and anti-interference of circuits struggle to meet the requirements.
In this paper, a passive wireless measurement system based on WPT technology is proposed. The data collector does not require separate power and information transmission circuits. It only needs the data receiver to send a short high-frequency signal to the data collector through WPT. Then the data information of the measured environment can be obtained by analyzing the feedback signal from the data collector. Several concepts are used for this system, including:
(1)
the constant oscillation period of oscillation attenuation signals [18],
(2)
the characteristics of inductive coupling WPT [19,20],
(3)
the relationship between sensitive resistances and environmental parameters [21].
In the passive wireless measurement system based on WPT technology, the data receiver and collector can transmit the excitation and feedback signals with a non-contact way. The data collector does not need power and has stable performances. It is very suitable for measuring internal information of objects or parameters inside closed spaces. This method also provides a new way for passive wireless measurement.

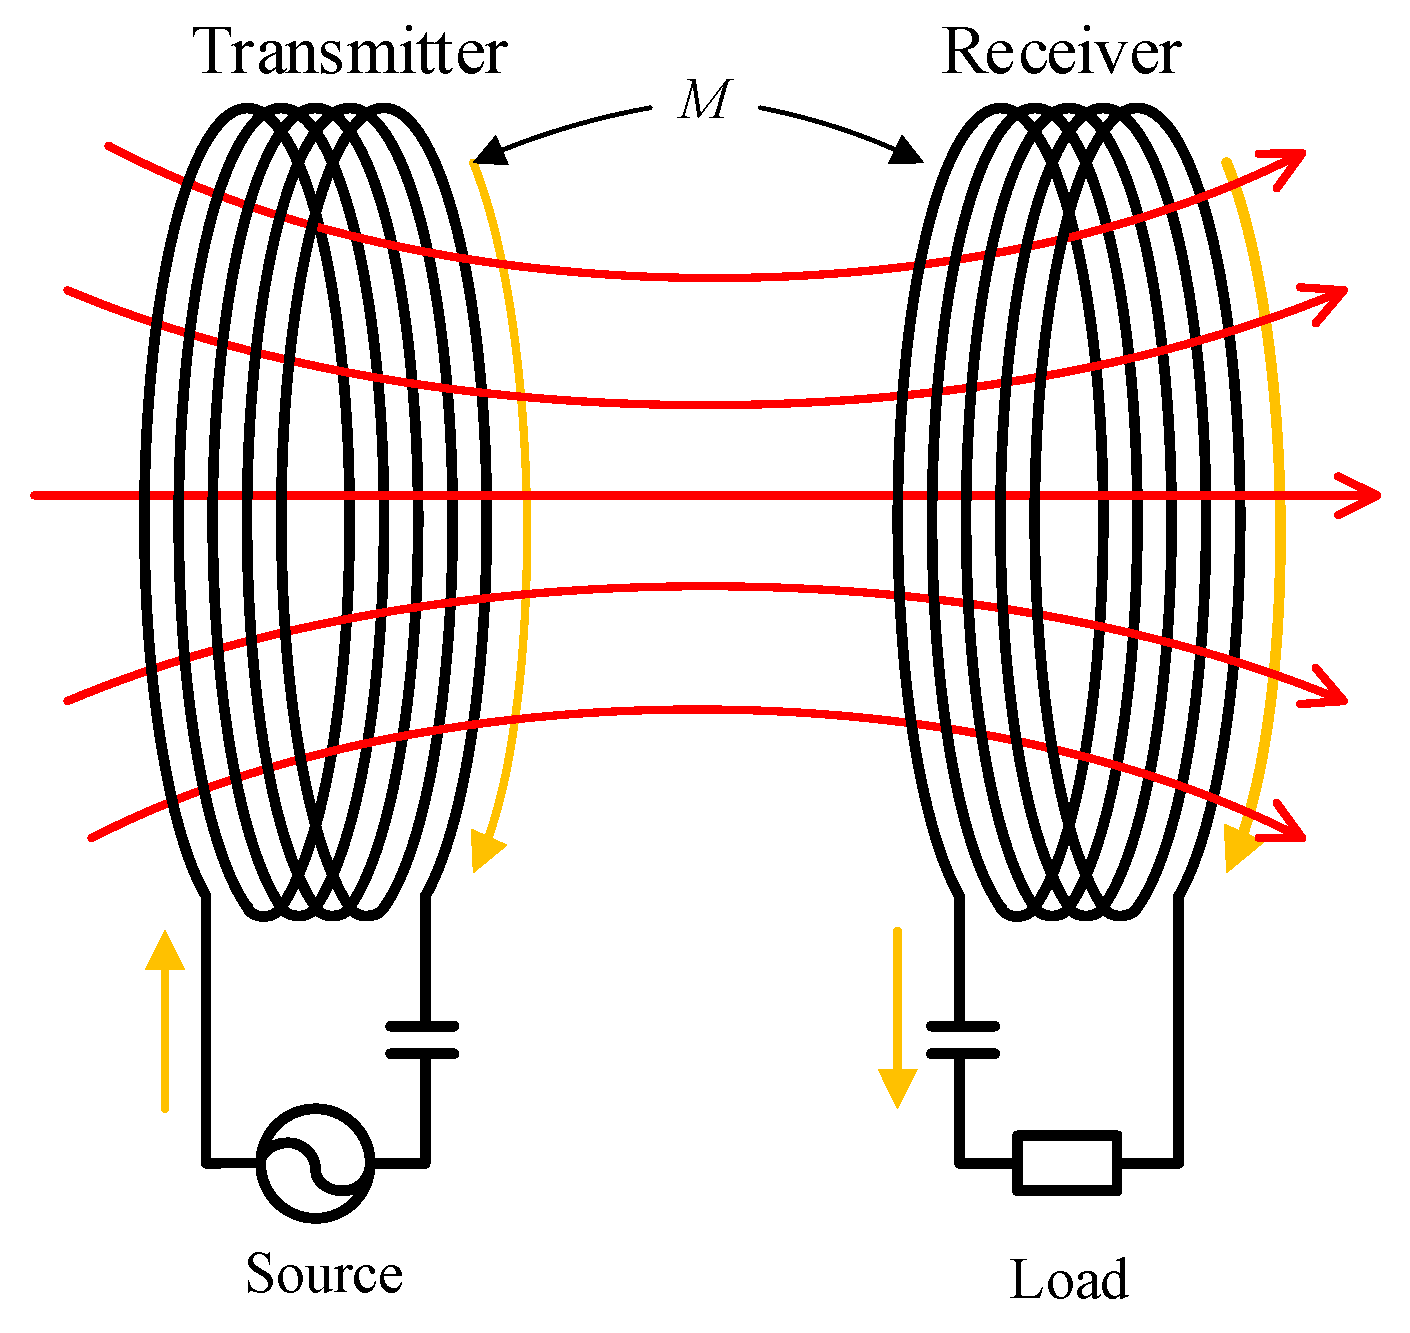
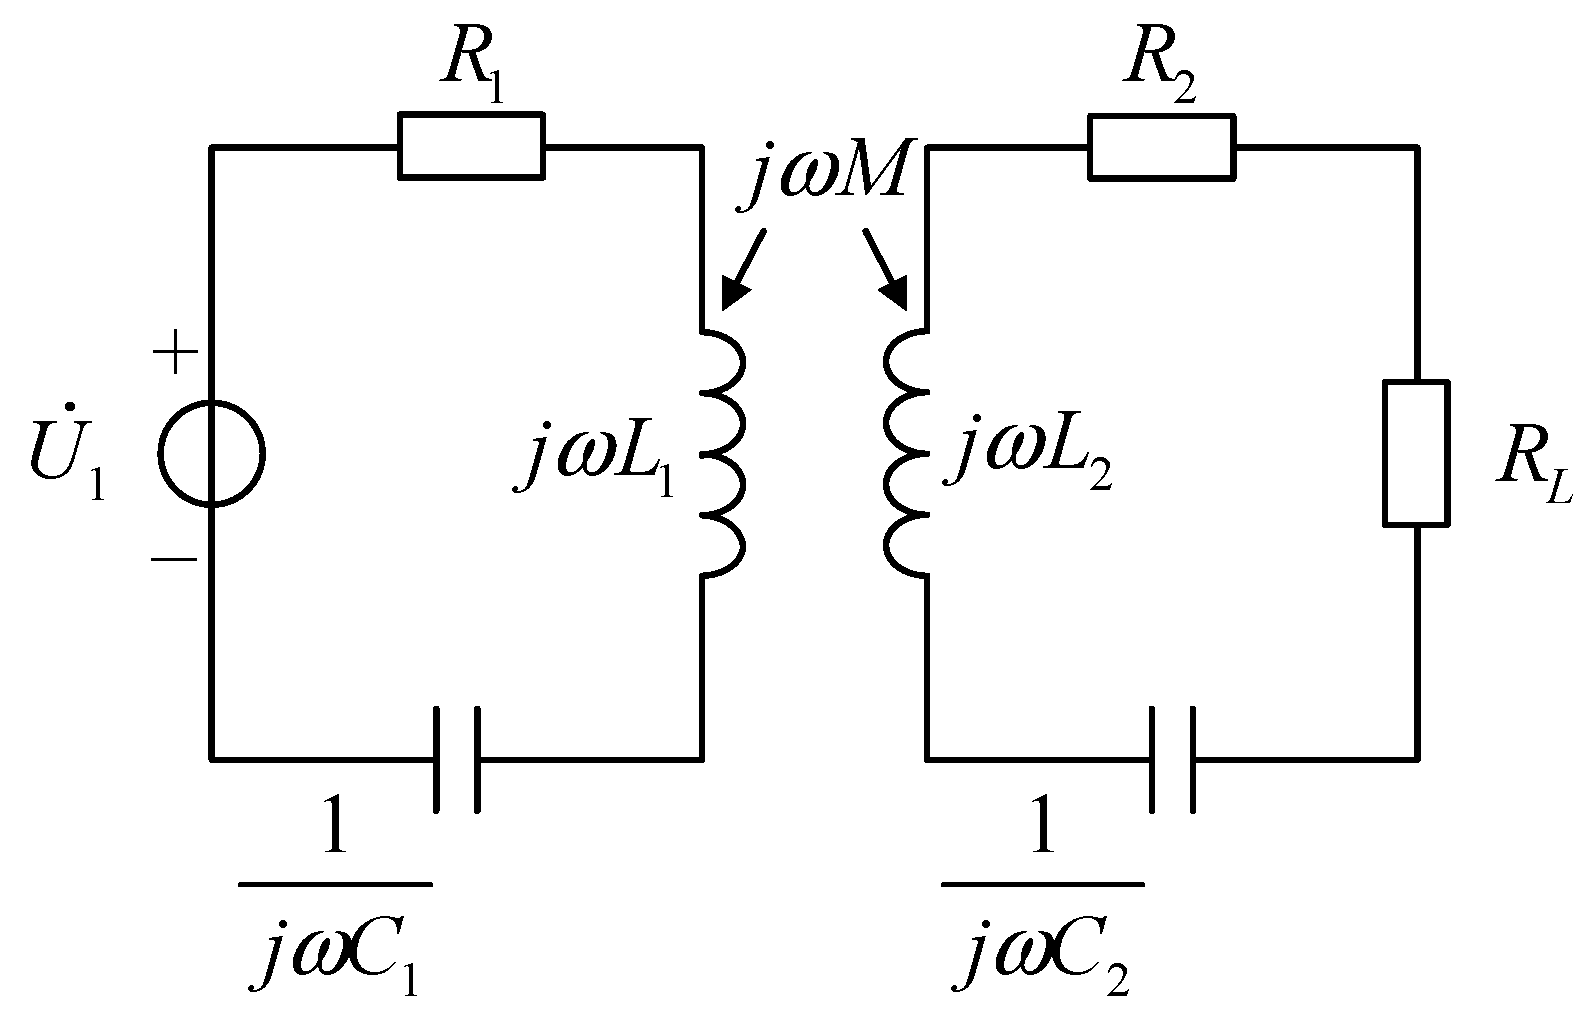
2. Existing Concepts Relevant to the Proposed Method

Before introducing the system in detail, it is necessary to explain some related concepts. As shown in Figure 1, the basic principle of WPT is to achieve the non-contact transmission of power through the mutual inductance between two coils. The transmission characteristics are affected not only by the transmitter parameters but also by the receiver structures [22,23,24]. In order to simplify the analysis process, the circuit equivalent of WPT is shown in Figure 2.
Based on Kirchhoff’s voltage law, we can get Equation (1),
{ ( R 1 + j × ω × L 1 + 1 j × ω × C 1 ) × I ˙ 1 + j × ω × M × I ˙ 2 = U ˙ 1 j × ω × M × I ˙ 1 + ( R 2 + R L + j × ω × L 2 + 1 j × ω × C 2 ) × I ˙ 2 = 0
From Equation (1), by further simplifying, we can get Equation (2),
( Z 1 + ω 2 × M 2 Z 2 ) × I ˙ 1 = U ˙ 1
where, Z 1 = R 1 + j × ω × L 1 + 1 j × ω × C 1 , Z 2 = R 2 + R L + j × ω × L 2 + 1 j × ω × C 2 .
From Equation (2), it can be seen that the secondary parameters of the inductive coupling circuit can be equivalently converted to the primary side. That is to say, the impedance characteristics of the whole circuit can be analyzed by only measuring the primary parameters. After the system is designed, the resistance values R 1 , R 2 , inductances L 1 , L 2 , and matching capacitances C 1 , C 2 all have been determined. If the positions of coils are relatively fixed, the mutual inductance M between the coils can also be measured. The characteristics of the voltage and current in the primary side are only related to the load R L . Hence, the load R L can be solved only by measuring the primary voltage and current.
When the load R L is a sensitive resistance, its resistance value will change with a variable in the environment. Therefore, based on this relationship, the variations of environment parameters can be solved according to the resistance values of sensitive resistances. For example, when R L is a thermistor or humidity sensitive resistance, the temperature or humidity can be obtained.
Another related concept is the oscillation attenuation characteristic of power. As shown in Figure 3a, the most basic R L C oscillation attenuation circuit consists of an inductance L , a capacitance C , and a resistance R in series. If the inductance L , the capacitance C , and the resistance R of the circuit satisfy R < 2 L C , the circuit will be an oscillatory attenuation circuit. Before the oscillation attenuation occurs, the capacitance stores a certain amount of power. After switch S is closed at t = 0, some of the power stored in capacitance C is transferred to inductance L , and a portion is consumed by the resistance R . Until the capacitance voltage U L drops to 0, all power stored in capacitance C is transferred and consumed, while inductance L stores the maximum power. Then the inductance L transfers the stored power to capacitance C for storage and resistance R for consumption. Next, capacitance C performs a power transfer to inductance L and resistance R once again. The power stored in the circuit is transferred back and forth between inductance L and capacitance C until it is completely consumed by the resistance R . In the process of power transfer, the waveforms of the voltages U L and U C of inductance L and capacitance C are sine functions whose amplitude is exponentially decayed, as shown in Figure 3b. However, the attenuation oscillation frequency is constant, that is, the attenuation period is a fixed value and does not change with the attenuation of power. If the inductance L and capacitance C of oscillation attenuation circuits are known, the value of resistance R can be calculated by measuring the attenuation period of inductance voltage U L or capacitance voltage U C .

3. The Proposed Passive Wireless Measurement System

3.1. The Structure of the Passive Wireless Measurement System

In order to achieve the function of passive wireless measurement, the circuit structure of WPT should be improved. In the passive wireless measurement system, the primary circuit is responsible for transmitting power to the secondary and measuring the oscillation attenuation period of the feedback power. The secondary circuit is a circuit embedded in an object to receive the power. It cannot affect the original characteristics of the environment. The secondary is best to have characteristics of small volume, high reliability, and low failure rate. To achieve this goal, the secondary circuit only includes the secondary coil and the sensitive resistance. The compensation capacitance that is prone to failure is removed from the secondary.
Figure 4c shows a typical second-order circuit. If it satisfies R < 2 L C , the voltages of inductance L and capacitance C will attenuate periodically as shown in Figure 3. In the attenuation process, the angular frequency is
ω = 1 L × C ( R 2 × L ) 2
The oscillation attenuation angle frequency in Equation (3) can be obtained by measuring the oscillation attenuation voltage waveform of the primary inductance or capacitance. The coil inductances L 1 , L 2 and resistances R 1 , R 2 have been determined after the coils are manufactured, but the mutual inductance between the coils will change in each measurement due to many factors such as the angles and distances. In the measurement process, the sensitive resistance R L and the mutual inductance M all are unknown. If the sensitive resistance can be calculated by Equations (3) and (4), at least two sets of values are required. The circuit shown in Figure 4a can only provide a set of values in one measurement. Hence, the system architecture should be further improved, and the structure of the passive wireless measurement system is proposed, as shown in Figure 5.
According to Equation (4), the oscillation attenuation angle frequency is related to inductance L , capacitance C , and resistance R . As long as one of them is changed, a set of different values can be obtained, and the sensitive resistance can be solved. From Equation (3), their composition can be known. Primary inductance L 1 is inductance L . Capacitance C is composed of primary compensation capacitance C 1 and the equivalent secondary part. Resistance R includes primary resistance R 1 and the equivalent secondary part. For these compositions, only the primary compensation capacitance C 1 is an added compensation element. The rest has been determined after the coils are manufactured. The compensation capacitance C 1 is the most suitable as a variable to provide a set of different values for the calculation.
According to Equations (1) and (2), it is easy to convert the inductive coupling circuit from Figure 4a to Figure 4b and finally to the circuit shown in Figure 4c. This gives Equation (4),
{ R = R 1 + ( R 2 + R L ) ( ω × M ) 2 ( R 2 + R L ) 2 + ( ω × L 2 ) 2 L = L 1 C = [ ( R 2 + R L ) 2 + ( ω × L 2 ) 2 ] C 1 ( R 2 + R L ) 2 + ( ω × L 2 ) 2 + ω 4 × M 2 × L 2 × C 1
where R 1 ,   R 2 , and R L are the primary AC resistance, the secondary AC resistance, and the sensitive resistance, respectively. L 1 ,   L 2 , and M are the primary inductance, the secondary inductance, and the mutual inductance, respectively. C 1 is the primary compensation capacitor.

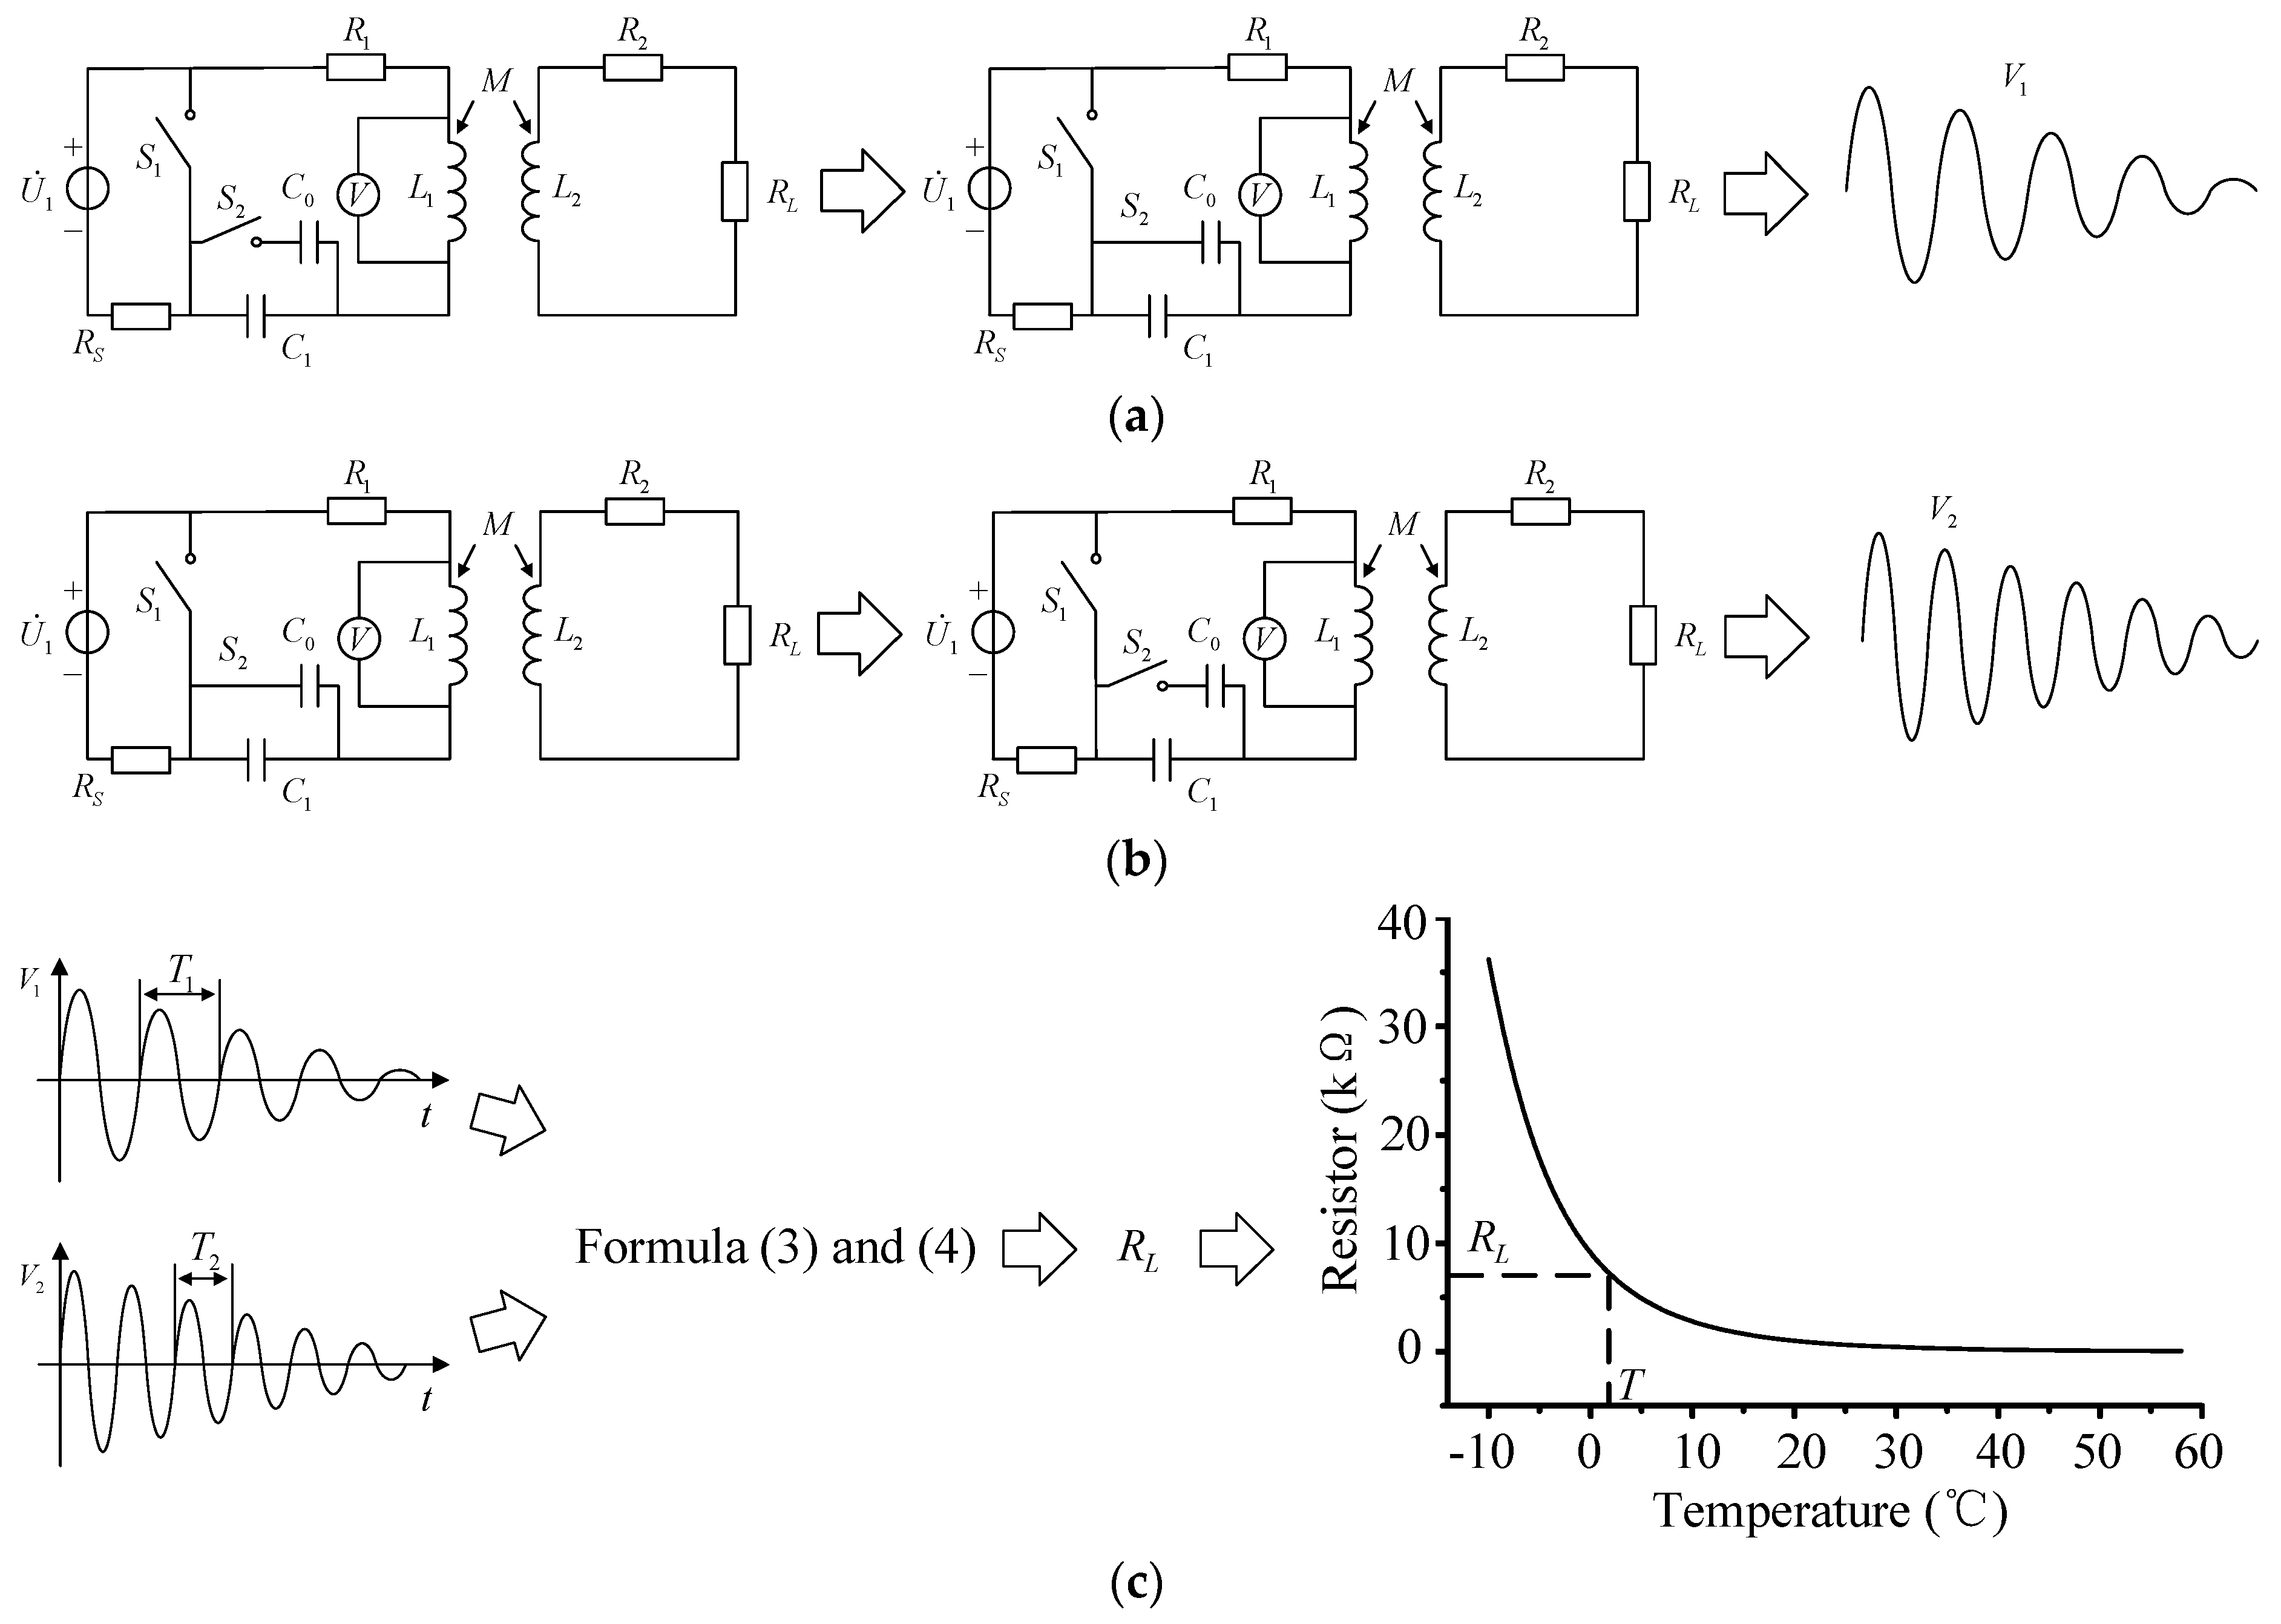
3.2. The Measuring Process of the Passive Wireless Measurement System

The whole process of the passive wireless measurement system can be divided into three parts, including the first measurement, the second measurement, and the calculation and comparison, as shown in Figure 6. Figure 6a shows the first measuring process. The switch S 2 is closed, and the compensation capacitance of the primary is adjusted to C 1 + C 0 . After the switch S 1 is turned off, the compensation capacitance C 1 + C 0 is charged by power U 1 . When the power storage in compensation capacitance C 1 + C 0 is full, the switch S 1 is switched from non-connection to connection. The power U 1 is removed from the inductive coupling circuit. The compensation capacitance C 1 + C 0 releases power, and the waveform V 1 of primary compensation capacitance C 1 + C 0 or the inductance L 1 of the transmitting coil is measured. The state of switches S 1 and S 2 is kept for about 2 min until the stored power of compensation capacitance C 1 + C 0 is completely consumed by the sensitive resistance R L and the primary and secondary coil resistances R 1 and R 2 .
The second measurement, as shown in Figure 6b, is the same as the first measurement. Just before the measurement, the switch S 2 is turned from on to off, and the compensation capacitance is changed from C 1 + C 0 to C 1 . The oscillation attenuation voltage waveform is V 2 . Figure 6c shows the third part of the measuring procedure. The oscillation attenuation voltage waveforms V 1 and V 2 are compared and analyzed to calculate the oscillation attenuation period T 1 and T 2 (or the oscillation attenuation angle frequency ω 1 and ω 2 ). Then the oscillation attenuation period T 1 and T 2 are taken into the Equations (3) and (4) to calculate the resistance value of sensitive resistance R L . After the resistance value is solved, the parameter of the measured environment can be known by the relationship curve between the sensitive resistance and the variable in environment. For example, when R L is a thermistor, the temperature T at the point where the thermistor is located can be measured by the resistance of the thermistor R L .

4. Simulations and Experiments

The invention was verified with field-circuit combined simulations and practical experiments. The passive wireless measurement system with two identical coils is shown in Figure 7, and the structure of the simulation coils is shown in Figure 8. For Equation (4), when the resistance R is much smaller than 2 L R , the inductance L is opposite the square of the oscillation attenuation angle frequency; that is, the greater the inductance of coils, the longer the periodic time of voltage oscillation attenuation waves. When the periodic time becomes longer, the difficulty of the measurement will be reduced, and the relative accuracy of the measurement also will be improved. But when the inductance of coils rises, the resistance of the coil wills also increases. It will enhance the error of measurement results. Based on the experience of previous experiments and simulations, the best range of the inductance is 1–10 mH. Hence, the number of turns of the coil was designed to be 200 turns, divided into 10 layers with 20 turns per layer.
Due to the fact that the devices used in the experiment platform had some errors, the parameters of the simulation circuit were adjusted to ensure the same environment as far as possible. A 12 V DC power was used to provide power for the compensation capacitance. The compensation capacitances C 0 and C 1 were 1.49   μ F and 0.51   μ F , respectively. The current limiting resistance R S was 20.26   Ω . The coils used in the simulation were equivalent models, which were different from the actual coils; hence, the simulation results of the coils resistance were different from the measured results. The simulated values of the inner resistance of coils R 1 and R 2 were 9.82   Ω , and the actual measured values were 6.41   Ω and 6.37   Ω . There were five groups of load resistances R L , which were used to verify the passive wireless measurement system. The resistance values were 10.00   Ω , 100.00   Ω , 200.00   Ω , 300.00   Ω , and 400.00   Ω . The detailed parameters are shown in Table 1.
Simulations and experiments were carried out according to the process shown in Figure 6. For the first set of simulations and experiments, the load R L was 10.00   Ω . The simulation and experiment waveforms are shown in Figure 9 when the compensation capacitances are C 0 + C 1 and C 1 . The oscillation attenuation periods of simulations were T 1 = 755.36   μ s and T 1 = 380.03   μ s , and that of experiments were T 2 = 759.15   μ s , and T 2 = 382.68   μ s .
Then the value of load resistance R L was changed, and the same measuring procedure was performed. The cycle times of oscillation attenuation waveforms measured in simulations and experiments are shown in Figure 10. From the figure, it can be seen that with the increase of load resistance R L , the time variation of oscillation attenuation period became smaller and smaller. When the load resistance R L changed from 300   Ω to 400   Ω , and the compensation capacitance was 2   μ F , the changes of oscillation periods in simulations and experiments were about 0.1   μ s , and they were about 0.15   μ s when the compensation capacitance was 0.51   μ F . This reduction in the change of cycle times meant that a higher measurement accuracy was required.
Based on Equations (3) and (4), the load resistances in simulations and experiments were calculated by the cycle times of oscillation attenuation waveforms, as shown in Figure 11. It can be seen that although the periods of oscillation attenuation waveforms in simulations and experiments were different, the resistances obtained by the calculations were almost the same. This is because the simulation parameters were as close to the experiment parameters as possible, but there were still some differences, especially in the mutual inductance between the two coils. In the process of solving the load resistance R L , the mutual inductances were also calculated together. The mutual inductance measured in simulations was about 1.19   mH , but it was about 1.11   mH in experiments. This also verifies that the system was not affected by the mutual inductance.
The relationship between thermistor resistance and temperature (as shown in Figure 6c) can be expressed as Equation (5):
R = R 0 × e B 0 × ( 1 T 1 T 0 )
where, R 0 is the nominal resistance of thermistors at the temperature T 0 , B 0 is an important parameter of thermistors, defined as the ratio of the difference between the natural logarithm of zero power resistance at two temperatures to the difference between the reciprocal of the two temperatures. For R 0 , T 0 , and B 0 , different types of thermistors have different values, but all of them are constant. In this paper, the thermistor NTC-MF52-10K was selected as an example. When T 0 = 298.15   K , R 0 = 1000   Ω , and B 0 = 3950 .
The error in measuring the temperature can be derived from the resistance value, as in Equation (6).
Δ T = | T T | T = | ln R ln R | ln R ln R 0 + B 0 T 0
where, T and R are the measured values, and T and R are the exact values.
Figure 12 shows the error for measured temperature according to Equation (6). Although the error of resistance values in simulations and experiments was large, as shown in Figure 10, the error was less than 1.5%.
From the calculation process and results of simulations and experiments, the method proposed in this paper can realize passive wireless measurement. It is a new measurement method, which is especially suitable for measuring internal parameters of objects. The measurement process is simple. Data collectors do not need power, and its structure is simple. Its performance is stable, and the measurement accuracy is very high.

5. Conclusions

A passive wireless measurement system based on WPT technology is proposed in this paper. The characteristics of WPT technology are that the primary and secondary circuits can perform bidirectional power transmission and that the circuit characteristics will be reflected in the power variations that are used. Combined with the invariability of the oscillation attenuation waveform’s cycle times of the second-order circuit and the relationship between sensitive resistances and environmental parameters, the secondary information can be obtained only by measuring the variation of the primary power. A complete set of the measurement process is also designed, and the proposed scheme and measuring steps are verified by simulations and experiments. The experimental and simulation results show that the error of measurement is less than 1.5%. The secondary side of the system has a simple structure and a small volume. It is pre-implanted into the object to be tested or the environment, which has little influence on the measured object and environment. The primary side is used as the data receiver and designed as a general structure, which is economical and portable. This parameter measurement scheme provides a new way for the passive wireless measurement system.

Author Contributions

Conceptualization, Y.Z. and Z.D.; methodology, Z.D., and L.Y.; software, Y.Z. and H.Q.; validation, Y.Z. and L.Y.; formal analysis, Y.Z. and Z.D.; investigation, Z.D., C.P., C.Y. and H.Z.; resources, Z.H., C.P., C.Y. and L.Y.; data curation, Y.Z., Z.D., C.P., C.Y., H.Z. and H.Q.; writing—original draft preparation, Y.Z. and Z.D.; writing—review and editing, Y.Z.; visualization, Y.Z., Z.H., Z.D., J.W., H.Z., H.Q. and L.Y.; supervision, Z.H. and L.Y.; project administration, Z.H. and L.Y.; funding acquisition, Z.H.

Funding

This research was funded by the National Key Research and Development Program of China under Project of 2017YFB1201002, in part by the National Natural Science Foundation of China under Project of 51707138 and 51507114.

Acknowledgments

The authors would like to acknowledge all the participants for their significant contributions to this research study.

Conflicts of Interest

The authors declare no conflict of interest.

References

  1. Cui, Y.; Ma, Y.; Zhao, Z.; Li, Y.; Liu, W.; Shu, W. Research on data fusion algorithm and anti-collision algorithm based on internet of things. Future Gener. Comput. Syst. 2018, 85, 107–115. [Google Scholar] [CrossRef]
  2. Qiu, T.; Zheng, K.; Han, M.; Chen, C.L.P.; Xu, M. A Data-Emergency-Aware Scheduling Scheme for Internet of Things in Smart Cities. IEEE Trans. Ind. Inform. 2018, 14, 2042–2051. [Google Scholar] [CrossRef]
  3. Mansour, M.M.; Kanaya, H. Novel L-Slot Matching Circuit Integrated with Circularly Polarized Rectenna for Wireless Energy Harvesting. Electronic 2019, 8, 651. [Google Scholar] [CrossRef]
  4. Liu, T.; Baktash, E.; Zheng, L. A Cooperative SWIPT Scheme for Wirelessly Powered Sensor Networks. IEEE Trans. Commun. 2017, 65, 2740–2752. [Google Scholar] [CrossRef]
  5. Mai, V.V.; Shin, W.-Y.; Ishibashi, K. Wireless Power Transfer for Distributed Estimation in Sensor Networks. IEEE J. Sel. Top. Signal Process. 2017, 11, 549–562. [Google Scholar] [CrossRef] [Green Version]
  6. Lim, J.; Rezvanitabar, A.; Degertekin, F.L.; Ghovanloo, M. An Impulse Radio PWM-Based Wireless Data Acquisition Sensor Interface. IEEE Sens. J. 2019, 19, 603–614. [Google Scholar] [CrossRef]
  7. Dai, Z.; Wang, J.; Li, Y.; He, Y.; Fang, Z.; Hou, H. Optimal Design of Magnetic Coupling Wireless Power Supply System for Monitoring Equipment. IEEE Access 2018, 6, 58600–58608. [Google Scholar] [CrossRef]
  8. Parajuli, A.; Barzegaran, M.R.; Mohammed, O.A. Wide area condition monitoring of power electric drives in wind power generation system using radiated electromagnetic fields. IET Power Electron. 2018, 11, 876–883. [Google Scholar] [CrossRef]
  9. Llano, D.X.; Abdi, S.; Tatlow, M.; Abdi, E.; McMahon, R.A. Energy harvesting and wireless data transmission system for rotor instrumentation in electrical machines. IET Power Electron. 2017, 10, 1259–1267. [Google Scholar] [CrossRef] [Green Version]
  10. Dai, Z.; Fang, Z.; Huang, H.; He, Y.; Wang, J. Selective Omnidirectional Magnetic Resonant Coupling Wireless Power Transfer with Multiple-Receiver System. IEEE Access 2018, 6, 19287–19294. [Google Scholar] [CrossRef]
  11. Kumar, A.; Singh, A.; Kumar, A.; Singh, M.K.; Mahanta, P.; Gaur, A.; Kapoor, K.; Mukhopadhyay, S.C. Sensing Technologies for Monitoring Intelligent Buildings: A Review. IEEE Sens. J. 2018, 18, 4847–4860. [Google Scholar] [CrossRef]
  12. Spirjakin, D.; Baranov, A.; Akbari, S. Wearable Wireless Sensor System with RF Remote Activation for Gas Monitoring Applications. IEEE Sens. J. 2018, 18, 2976–2982. [Google Scholar] [CrossRef]
  13. Guravaiah, K.; Velusamy, R.L. Energy Efficient Clustering Algorithm Using RFD Based Multi-hop Communication in Wireless Sensor Networks. Wirel. Pers. Commun. 2017, 95, 3557–3584. [Google Scholar] [CrossRef]
  14. Wang, X.; Zhang, Y.; Zhang, X.; Huo, Z.; Li, X.; Que, M.; Peng, Z.; Wang, H.; Pan, C. A Highly Stretchable Transparent Self-Powered Triboelectric Tactile Sensor with Metallized Nanofibers for Wearable Electronics. Adv. Mater. 2018, 30, e1706738. [Google Scholar] [CrossRef] [PubMed]
  15. He, J.; Wen, T.; Qian, S.; Zhang, Z.; Tian, Z.; Zhu, J.; Mu, J.; Hou, X.; Geng, W.; Cho, J.; et al. Triboelectric-piezoelectric-electromagnetic hybrid nanogenerator for high-efficient vibration energy harvesting and self-powered wireless monitoring system. Nano Energy 2018, 43, 326–339. [Google Scholar] [CrossRef]
  16. Zhao, L.; Zheng, K.; Chatzimisios, P. Hybrid information and energy transfer in ultra-dense HetNets. Comput. Netw. 2017, 129, 502–509. [Google Scholar] [CrossRef]
  17. Bhuiyan, R.H.; Islam, M.R.; Caicedo, J.M.; Ali, M. A Study of 13.5-MHz Coupled-Loop Wireless Power Transfer Under Concrete and Near Metal. IEEE Sens. J. 2018, 18, 9848–9856. [Google Scholar] [CrossRef]
  18. Grebene, A.B. Bipolar and MOS Analog Integrated Circuit Design; Wiley-Interscience: Hoboken, NJ, USA, 2002. [Google Scholar]
  19. Abatti, P.J.; De Miranda, C.M.; Da Silva, M.A.; Pichorim, S.F. Analysis and optimisation of three-coil wireless power transfer systems. IET Power Electron. 2018, 11, 68–72. [Google Scholar] [CrossRef]
  20. Liu, X.; Wang, T.; Yang, X.; Tang, H. Analysis of efficiency improvement in wireless power transfer system. IET Power Electron. 2018, 11, 302–309. [Google Scholar] [CrossRef]
  21. Fresne, E.R.D.; Fresne, E.R.D. Pressure-Sensitive Resistor Material. US Patent 4,163,204, 31 July 1979. [Google Scholar]
  22. Basar, M.R.; Ahmad, M.Y.; Cho, J.; Ibrahim, F. Stable and High-Efficiency Wireless Power Transfer System for Robotic Capsule Using a Modified Helmholtz Coil. IEEE Trans. Ind. Electron. 2017, 64, 1113–1122. [Google Scholar] [CrossRef]
  23. Jayathurathnage, P.K.S.; Alphones, A.; Vilathgamuwa, D.M. Optimization of a Wireless Power Transfer System with a Repeater Against Load Variations. IEEE Trans. Ind. Electron. 2017, 64, 7800–7809. [Google Scholar] [CrossRef]
  24. Wang, S.; Chen, J.; Hu, Z.; Rong, C.; Liu, M. Optimization Design for Series-Series Dynamic WPT System Maintaining Stable Transfer Power. IET Power Electron. 2017, 10, 987–995. [Google Scholar] [CrossRef]
Figure 1. The inductive coupling wireless power transfer (WPT)
Electronics 08 01048 g001
Figure 2. The equivalent circuit of WPT.
Electronics 08 01048 g002
Figure 3. The attenuation characteristics of power. (a) The zero-input second-order circuit, (b) the second-order oscillation attenuation waveform.
Electronics 08 01048 g003
Figure 4. Equivalent conversion of the circuit of WPT. (a) The basic circuit of WPT, (b) The equivalent Circuit, (c) The simplified circuit.
Electronics 08 01048 g004
Figure 5. A passive wireless measurement system.
Electronics 08 01048 g005
Figure 6. The measuring process of the passive wireless measurement system. (a) The first measurement, (b) the second measurement, (c) the calculation and comparison.
Electronics 08 01048 g006
Figure 7. The passive wireless measurement system.
Electronics 08 01048 g007
Figure 8. The structure of the simulation coils.
Electronics 08 01048 g008
Figure 9. The simulation and experiment waveforms. (a) the simulation waveform with C 0 + C 1 = 2   μ F , (b) the simulation waveform with C 1 = 0.51   μ F , (c) the experiment waveform with C 0 + C 1 = 2   μ F , (d) the experiment waveform with C 1 = 0.51   μ F .
Electronics 08 01048 g009
Figure 10. The cycle times of oscillation attenuation waveforms measured in simulations and experiments. (a) C 0 + C 1 = 2   μ F , (b) C 1 = 0.51   μ F .
Electronics 08 01048 g010
Figure 11. The resistances in the simulations and experiments.
Electronics 08 01048 g011
Figure 12. The temperature error in the simulations and experiments.
Electronics 08 01048 g012
Table 1. The parameters of the passive wireless temperature measurement system.
ParameterExperimentSimulation
Inner diameter100 mm100 mm
Wire radius0.25 mm0.25 mm
Number of layers1010
Number of turns per layer2020
L 1 7.43 mH7.35 mH
L 2 7.41 mH7.35 mH
C 0 1.49 µF1.49 µF
C 1 0.51 µF0.51 µF
R 1 6.41 Ω9.82 Ω
R 2 6.37 Ω9.82 Ω
R S 20.26 Ω20.26 Ω
R L 9.96 Ω/100.07 Ω/199.88 Ω/
299.93 Ω/401.05 Ω
10.00 Ω/100.00 Ω/200.00 Ω/
300.00 Ω/400.00 Ω

