Article

Ultrasonic Health Monitoring of Lithium-Ion Batteries

1
College of Automation Engineering, Nanjing University of Aeronautics and Astronautics, Nanjing 211106, China
2
Center for Advanced Life Cycle Engineering (CALCE), University of Maryland, College Park, MD 20742, USA
3
Department of Industrial and System Engineering, The Hong Kong Polytechnic University, Hong Kong 999077, China
*
Author to whom correspondence should be addressed.
Electronics 2019, 8(7), 751; https://doi.org/10.3390/electronics8070751
Submission received: 10 April 2019 / Revised: 26 June 2019 / Accepted: 1 July 2019 / Published: 3 July 2019

Abstract

:
Because of the complex physiochemical nature of the lithium-ion battery, it is difficult to identify the internal changes that lead to battery degradation and failure. This study develops an ultrasonic sensing technique for monitoring the commercial lithium-ion pouch cells and demonstrates this technique through experimental studies. Data fusion analysis is implemented using the ultrasonic sensing data to construct a new battery health indicator, thus extending the capabilities of traditional battery management systems. The combination of the ultrasonic sensing and data fusion approach is validated and shown to be effective for degradation assessment as well as early failure indication.

1. Introduction

Lithium-ion batteries are widely used as the power supply for products ranging from portable consumer products to transportation power sources. However, they are prone to experience gradual degradation (capacity fade and resistance increase) or catastrophic failures during usage. The gradual degradation is driven by complex electrochemical side reactions (e.g., active material dissolution, electrode particle cracking, and deterioration of electrode adhesion) over the long period of normal cycling [1]. The catastrophic failures of a battery include a sudden drop in battery capacity, a sudden increase in battery temperature, swelling due to gas generation, and even fire/explosion [2]. A battery can fail catastrophically due to manufacturing defects, mechanical abuse (e.g., shock, or puncture), electrical abuse (e.g., overcharge, or over-discharge), or thermal abuse (e.g., external heating) [3].
Battery degradation and failures result in poor operational availability and, in some cases, safety issues [4,5,6,7]. Monitoring battery performance and health is a means to improve the safety and reliability of battery-powered devices. Conventional battery management systems (BMSs) evaluate the health state of a battery by tracking the state of health (SOH, typically defined as the ratio of the maximum deliverable capacity to the initial capacity) using complex state estimation algorithms [8]. However, early detection of battery failure is somewhat difficult based on these SOH estimation techniques because the SOH changes over long periods of time, which makes estimation conservative and slow to react to sudden failures. Furthermore, the conventional BMSs are limited to monitoring the extrinsic parameters (e.g., current, voltage, and temperature) and do not provide insight into the changes inside the battery [9,10,11,12,13].
Due to the complex physiochemical nature of batteries, it is difficult to employ sensors that directly probe the internal chemical properties of the battery (e.g., lithium concentration and electrode properties). Nevertheless, several state-of-the-art sensors have been developed to monitor the internal physical states of batteries. Fiber optic sensors have been used for internal temperature [14] and strain [15,16] detection. An integrated microsensor has been developed using a micro-electro-mechanical system, which can in situ monitor internal temperature in a coin cell [17]. Although these cutting-edge techniques are promising, they are too costly to be implemented and the effect of these built-in sensors on battery reliability and safety has not been assessed.
Ultrasonic inspection is one of the most widely used approaches in the context of structural health monitoring [18] and nondestructive evaluation [19]. Ultrasonic waves are propagated through the test object, allowing the material properties, internal damage, and structural integrity to be accurately monitored in real time. Hence, ultrasonic inspection can potentially be used to probe the underlying material properties changes inside batteries, and thus provide an early indication of failures.
Studies on ultrasonic sensing of batteries, including those by the Ultran Group [20], Sood et al. [21], and Li et al. [22] have reported detection of gas voids, electrolyte nonuniformity, and cracks within the electrode layer of batteries. Ladpli et al. [23,24,25] and Hsieh et al. [26] studied ultrasonic trends associated with the change of the state of charge (SOC, the charge remaining in the battery with respect to the capacity) and the SOH over charge/discharge cycles. Gold et al. [27] developed a linear model between the ultrasonic transmission signal and the SOC for the SOC determination over one cycle. Similarly, Davies et al. [28] developed a support vector regression (SVR) model to predict the battery SOC and SOH using a combination of ultrasonic and voltage data. These studies focused on battery performance evaluation and did not consider the sudden failure scenario during operation. However, early prediction of battery sudden failures is crucial for improving battery safety because sudden failures often induce catastrophic events, such as fire or explosion.
This study enhances the state of the art by expanding the use of ultrasonic sensing for early indication of battery sudden failure. Two types of battery tests were conducted to investigate the evolution of the ultrasonic waves—a cycling test and an abusive test (overcharge test). During the cycling test, batteries were cycled under different conditions, and correlations between the ultrasonic features and the health state of the battery were identified using the Spearman correlation. During the abusive test, the ultrasonic signal was continuously monitored, and the evolution of the ultrasonic features within the overcharge process was analyzed. Then, a data fusion approach and a health indicator (HI) were developed to quantify the battery health state and indicate catastrophic failure induced by overcharge. Section 2 describes the theoretical background for battery ultrasonic sensing, Section 3 presents the battery cycling and abusive tests, and Section 4 discusses the ultrasonic test results. Section 5 describes the developed battery health monitoring method with one case study. Conclusions are presented in Section 6.

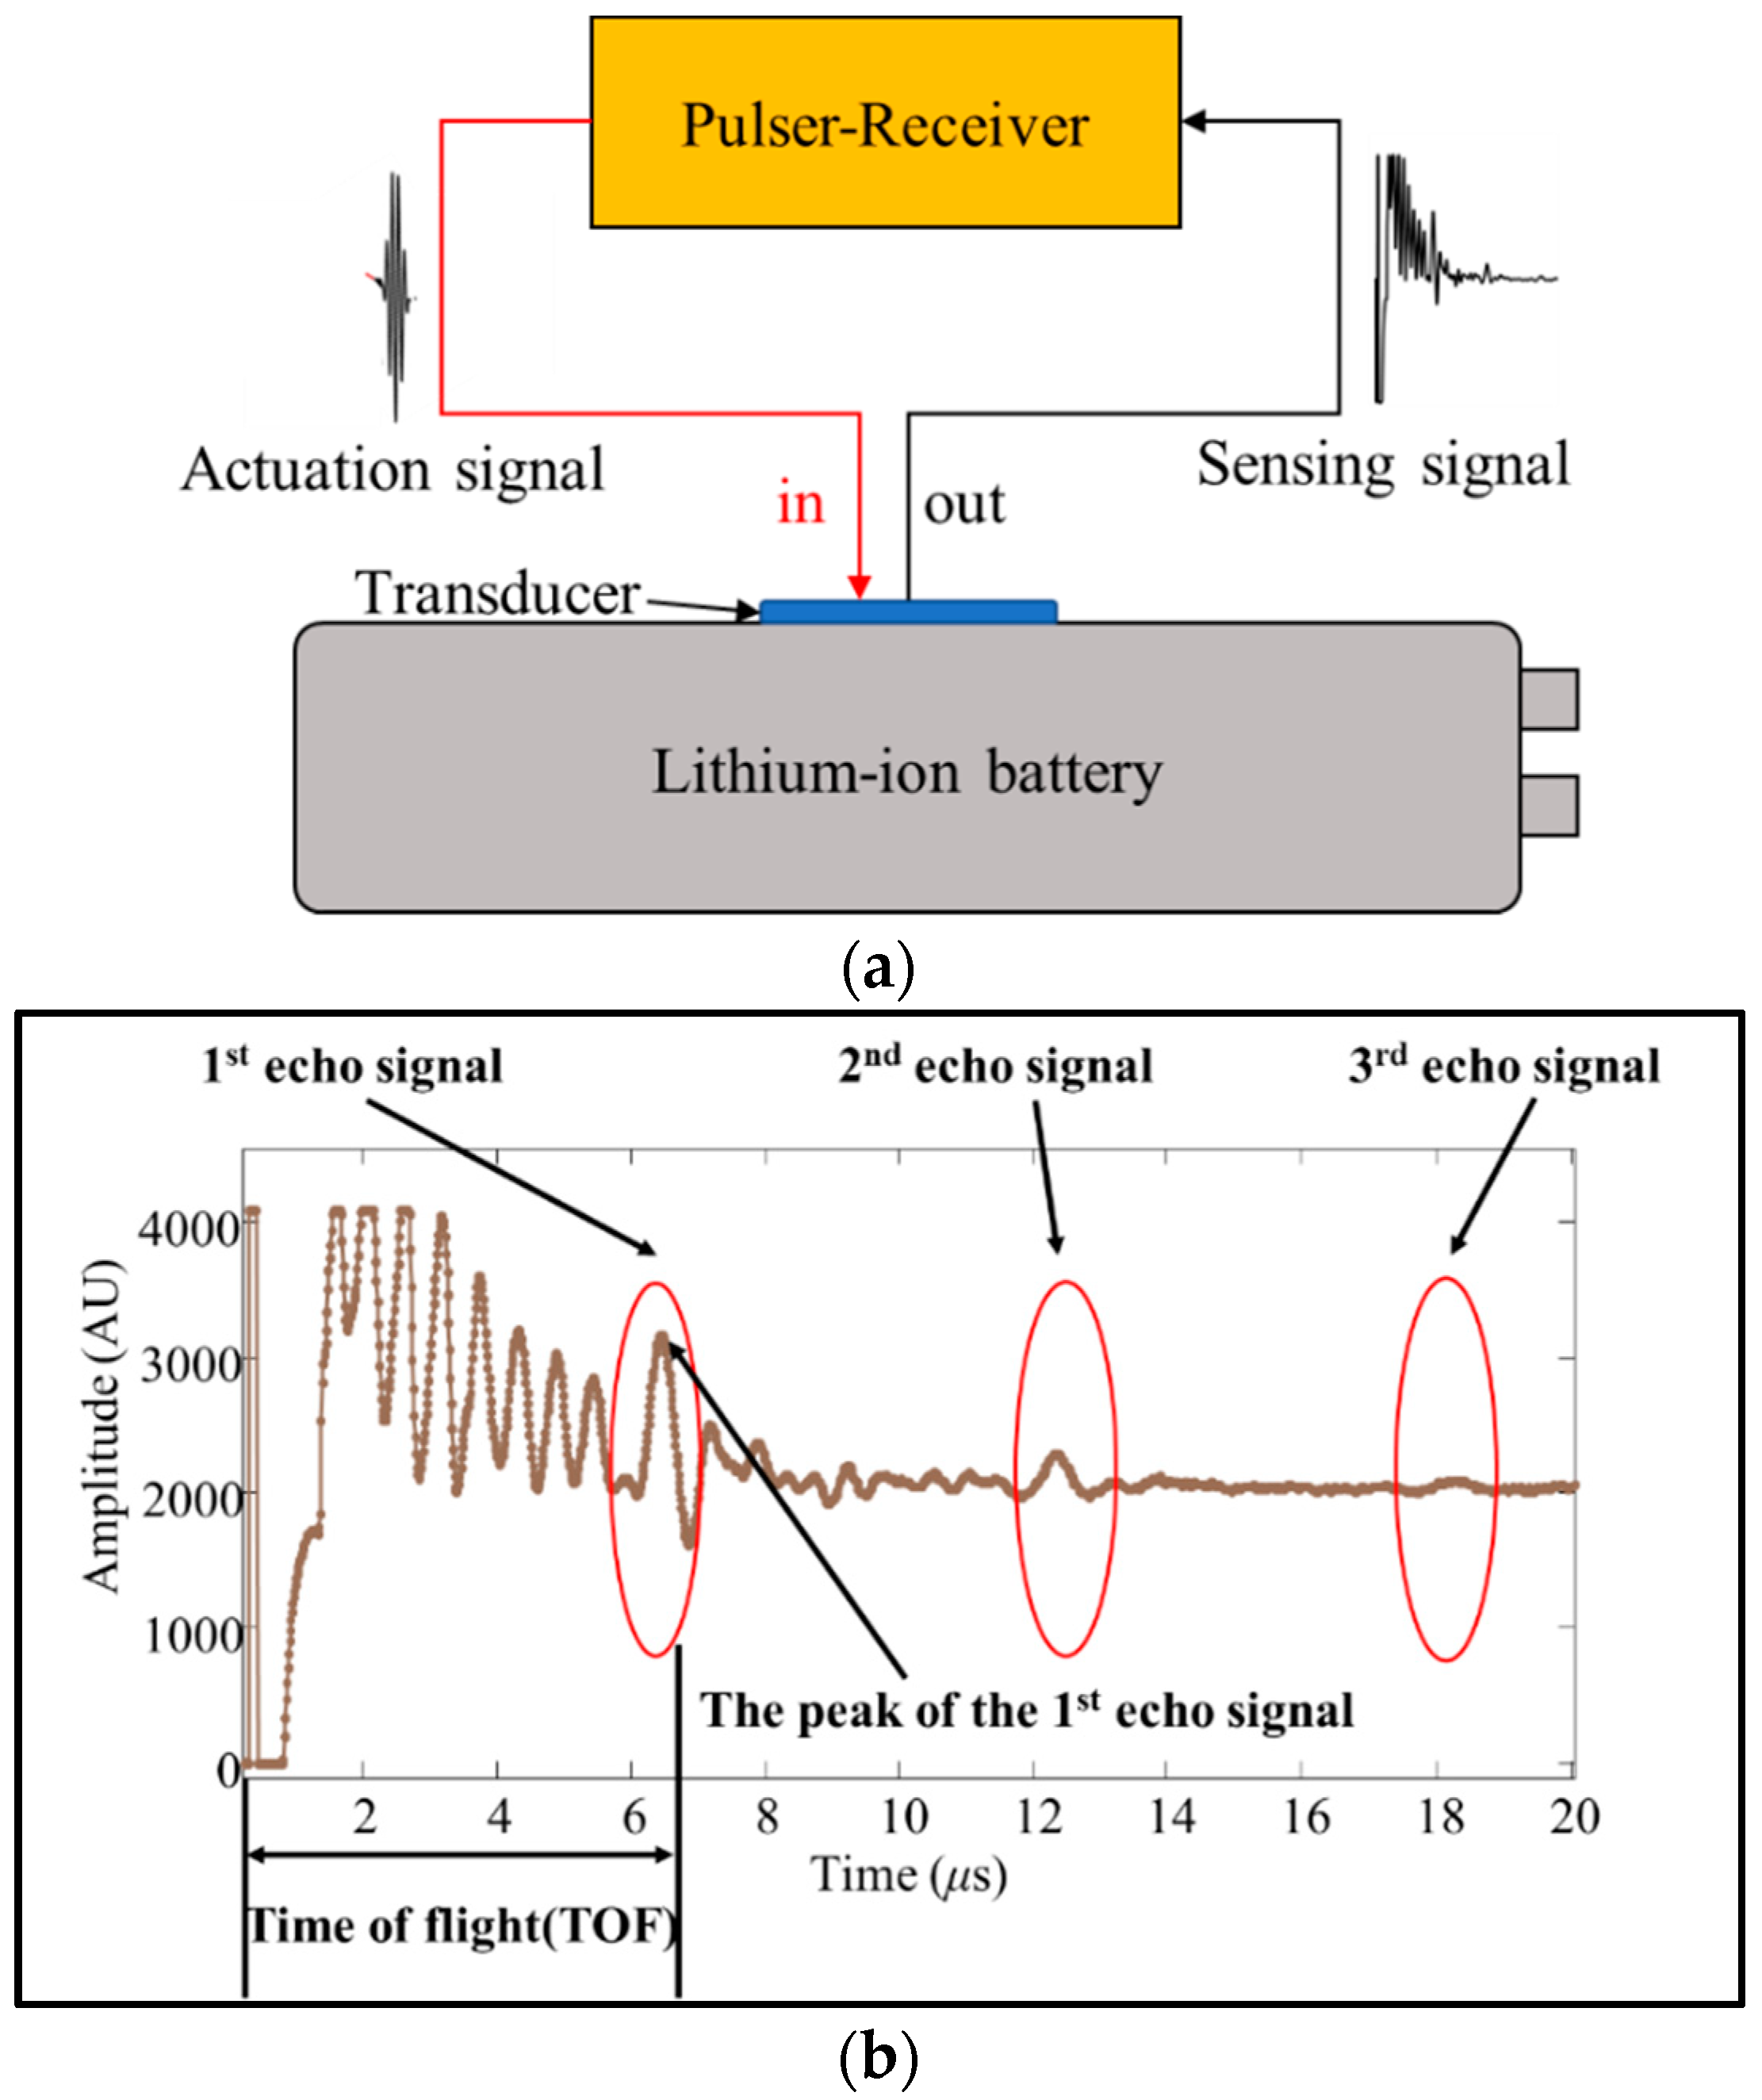
2. Ultrasonic Sensing for Lithium-Ion Batteries

There are two modes for the ultrasonic inspection. The first is the pulse-echo mode, where the ultrasonic signal is sent and received by the same transducer, and the second is the through-transmission mode, where the ultrasonic signal transmits through the object and is received by the second transducer [21]. The through-transmission mode needs two transducers that are placed on opposite sides of the battery, which requires more access to the battery than the pulse-echo mode and increases the cost. Thus, the ultrasonic testing of the batteries in this study was conducted in the pulse-echo mode as shown in Figure 1a.
To conduct the ultrasonic test, the transducer sends a compressional pulse through the battery. The signal propagates through the battery, which consists of many layers stacked together, e.g., positive electrode/separator/negative electrode/separator [29]. The ultrasonic velocity in each layer depends on the material properties. For an isotropic elastic material, the ultrasonic velocity is:
V = 4 3 G + K ρ
where G is the material shear modulus, K is the bulk modulus, and ρ is the material density.
At the interface between two different layers, part of the ultrasonic signal is transmitted through the interface, while the rest is reflected. The greater the ultrasonic impedance (Z) mismatch between two layers, the greater the percentage of energy reflected at the interface. The ultrasonic impedance (Z) of a material is defined as the product of its density (ρ) and ultrasonic velocity (V).
Z = ρ × V
Figure 1b shows a typical ultrasonic response signal for a commercial lithium-ion battery. The ultrasonic signal travels through the battery. Part of the signal reflects different interfaces inside the battery, which forms the oscillation in the first 6 μs, while the other part of the signal reaches the bottom of the battery and then reflects back to the top, which is highlighted as the first echo signal. Note that the reflected signal causes a secondary reflection when reaching the top, and thus forms repeated echoes, as labeled in Figure 1b. These echoes have similar shapes and time intervals. The amplitude of the echo peak decreases as the travel time increases because the ultrasonic signal attenuates when it propagates through the layers inside the battery due to reflections and viscoelastic losses.
Two features of interest, i.e., the maximum amplitude of the first echo (defined as PA) and the time-of-flight (TOF), are extracted from the ultrasonic response signal and used to analyze the performance of the battery. The essence of battery degradation is the change of battery material properties (density and modulus), which leads to the change of both ultrasonic impedance and ultrasonic velocity. To indicate the change of ultrasonic impedance, the amplitude of the reflected ultrasonic signal is used because they are closely related. Specifically, we chose the maximum amplitude of the first echo (PA) to represent the ultrasonic amplitude due to its uniqueness and representativeness. Regarding the change of ultrasonic velocity, we chose the TOF as the ultrasonic velocity indicator. The TOF (time between the actuation signal and the PA) reflects the travel time of the ultrasonic signal inside the battery, and thus represents the change of ultrasonic velocity and/or thickness.

3. Experimental Setup

Experiments were performed on two types of commercial LiCoO2/graphite pouch batteries to study the evolution of ultrasonic signals. The first battery type (type A) had a rated capacity of 1.8 Ah, and the second type (type B) had a rated capacity of 0.7 Ah. The voltage range for both types was the same, from 2.75 V to 4.2 V. Two samples were tested for each type.
In the experiment (see Figure 2), a thermocouple and a piezoelectric transducer (PZT-5A, 1 MHz) were mounted on the surface of the batteries with epoxy, instead of the glycerin. This provided clean signals and reduced signal variability. No extra pressure was applied to the batteries. The charge/discharge test was conducted using an Arbin BT2000 battery tester, and the current and voltage of the batteries were recorded. The battery surface temperature was recorded with an Agilent 34970A (Santa Clara, CA, USA) data logger. A Lecoeur ultrasonic device (pulser-receiver) was used to send and receive the ultrasonic signal. The piezoelectric transducer was actuated with a 50 ns pulse. The amplitude of the actuation signal was 100 V. The sampling frequency for the received signal was 80 MHz.
To investigate the feasibility of ultrasonic sensing, several cycling tests and an overcharge test were designed and conducted at 45 °C in a temperature chamber to induce the accelerated aging and failure of the batteries. A test temperature of 45 °C was chosen because it is higher than room temperature but does not cause catastrophic failure during normal cycling conditions based on our previous experience. The purpose of these tests was to find the relationship between the battery degradation and ultrasonic signal in a short testing time. The test procedures are summarized in Table 1.
For the cycling test, all the batteries were discharged using 1C (C/x is a current rate at which the battery will be fully charged in x hours) to 2.75 V, whereas, different charge profiles were applied to different types of batteries. Type A batteries (A1/A2) were charged using normal charge profiles, i.e., they were charged using 0.5C constant current (CC) to 4.2 V and kept at 4.2 V constant voltage (CV) until the current dropped to 0.05C. Type B batteries (B1/B2) were charged using overcharge profiles, i.e., they were charged using 0.5C to 4.5 V and kept at 4.5 V until the current dropped to 0.05C. The ultrasonic signal was measured at 0% SOC after every cycle.
After a period of cycling test, a forced overcharge test was conducted on battery A1 to understand the change in the ultrasonic signal when it came across a sudden abuse. Battery A1 was charged using 0.5C to 5 V, then maintained at 5 V until the battery swelled. The ultrasonic measurement was taken every 30 s during testing. In addition, the X-ray images for battery A1 before and after overcharge were measured to provide visualizations for the structural changes inside the battery.

4. Ultrasonic Results for Lithium-Ion Batteries

The ultrasonic results for both the cycling tests and abusive test are presented in this section.

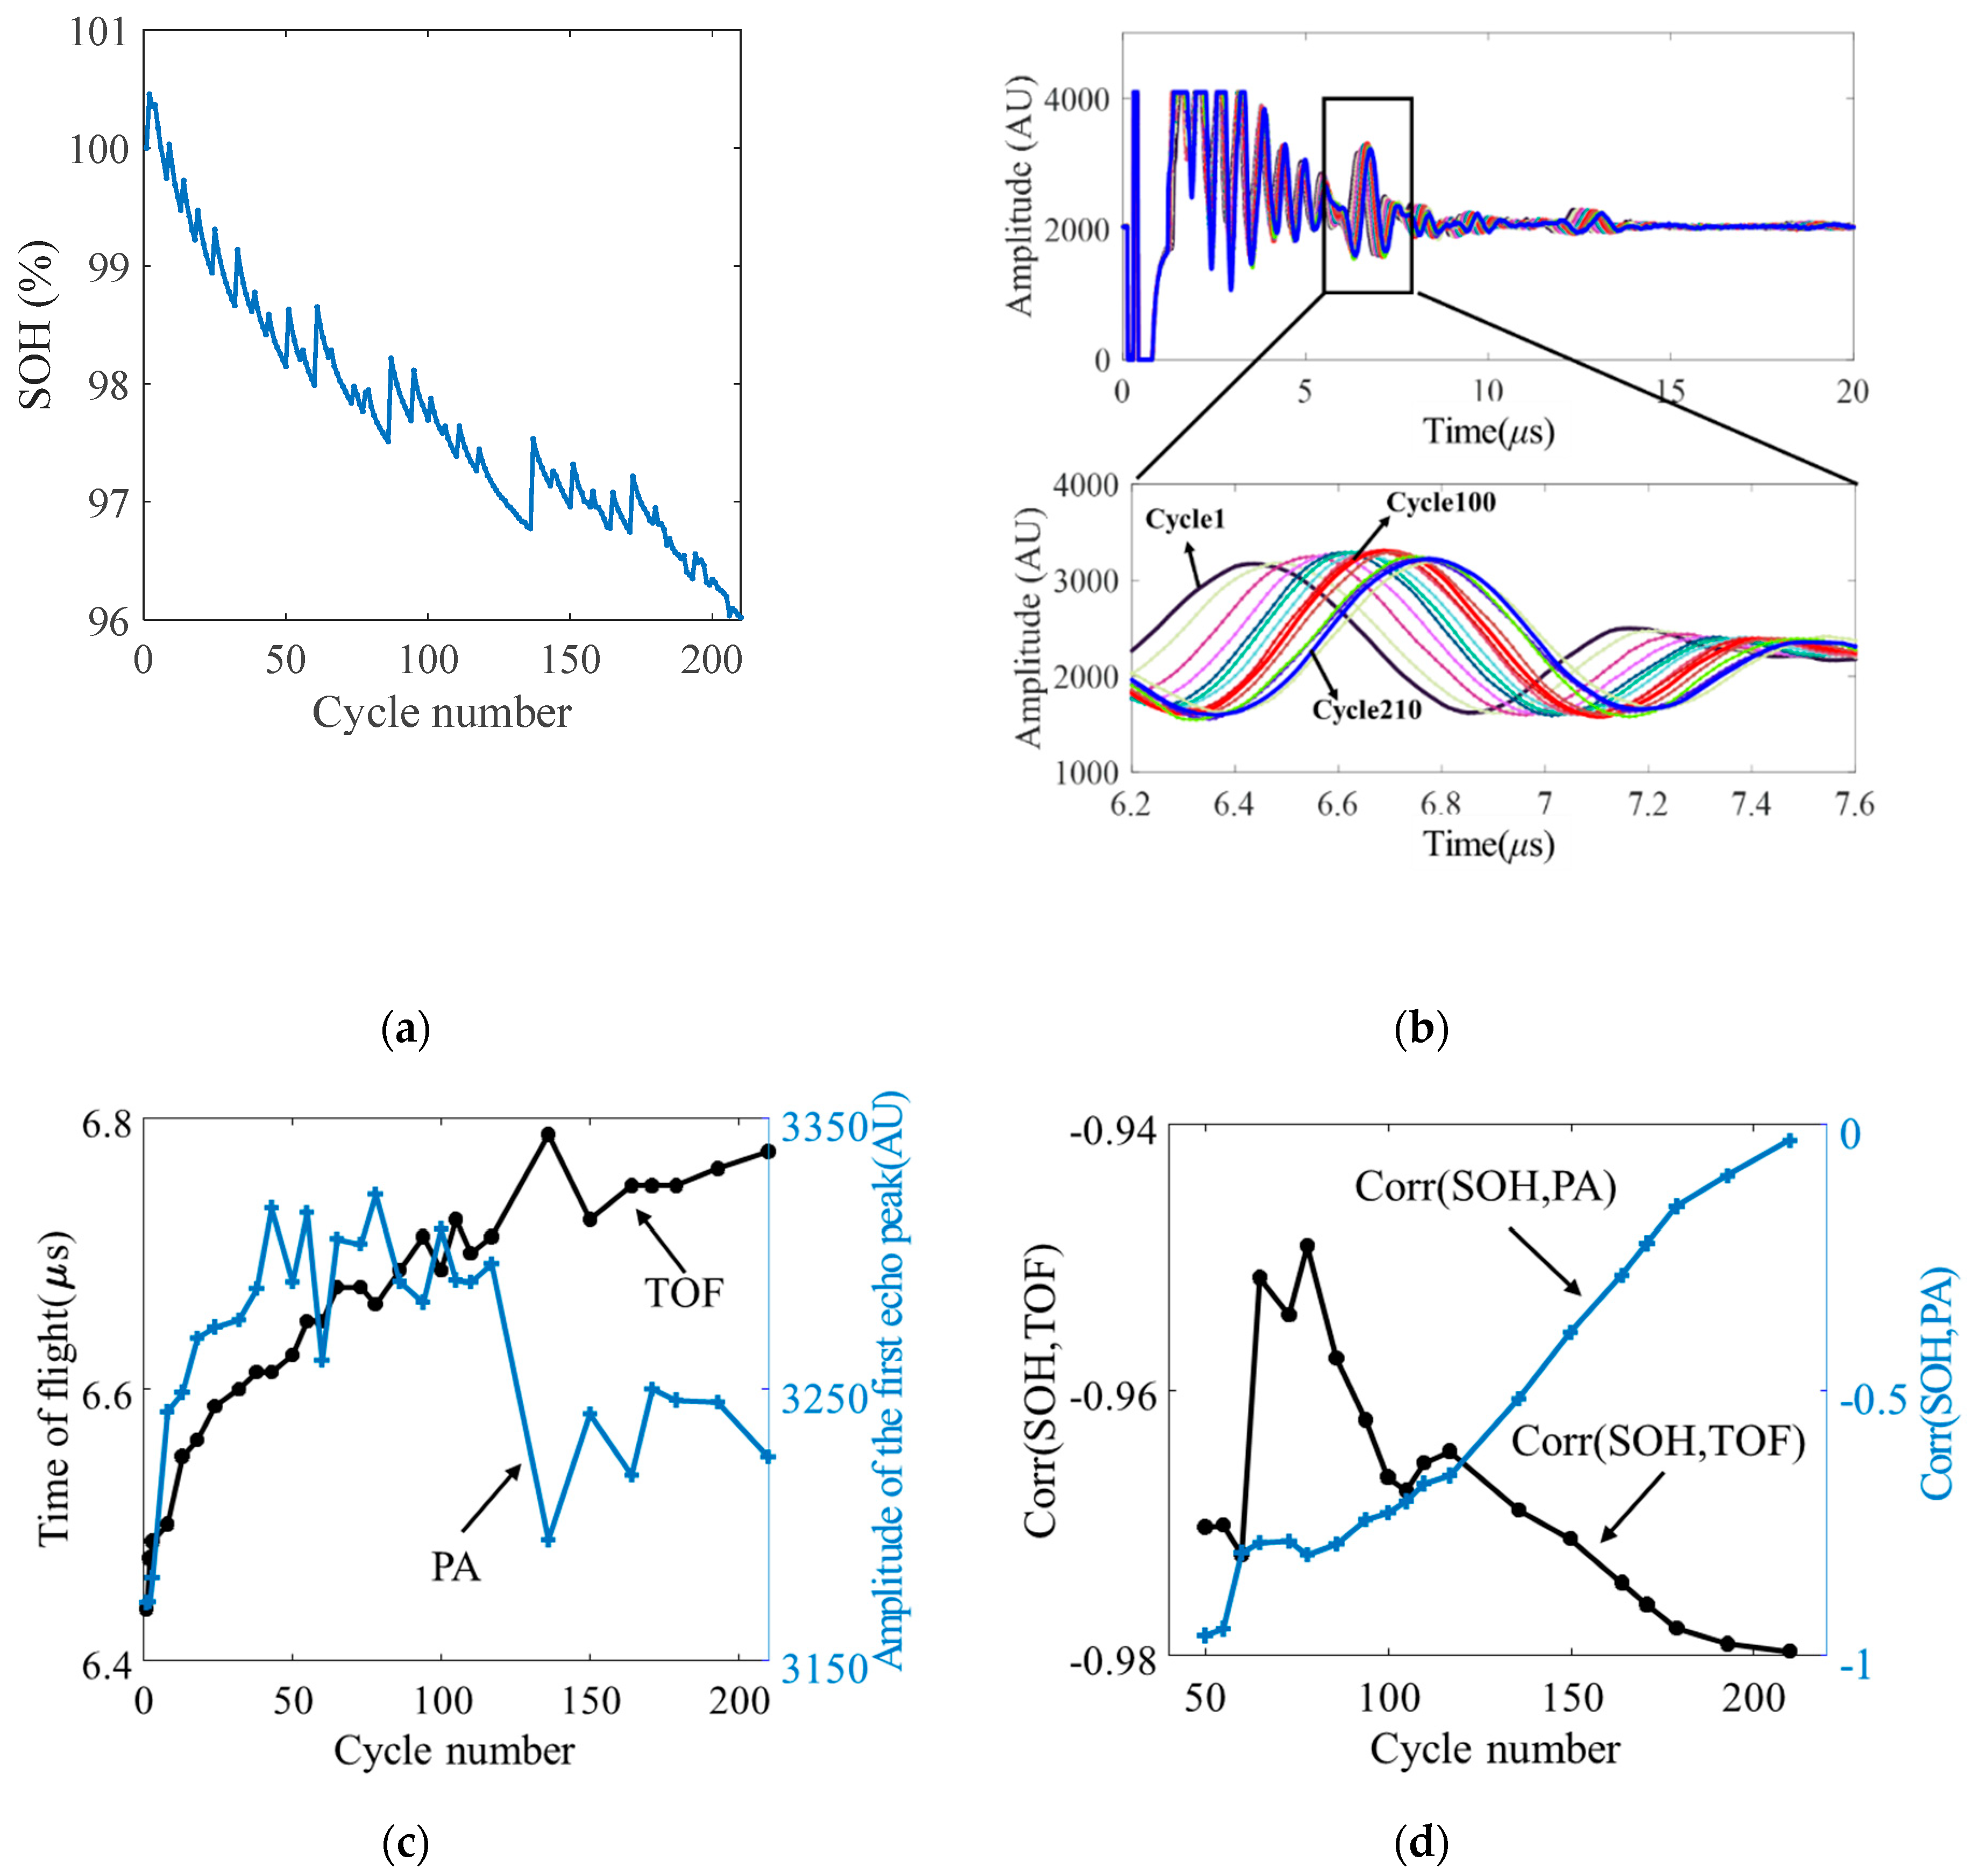
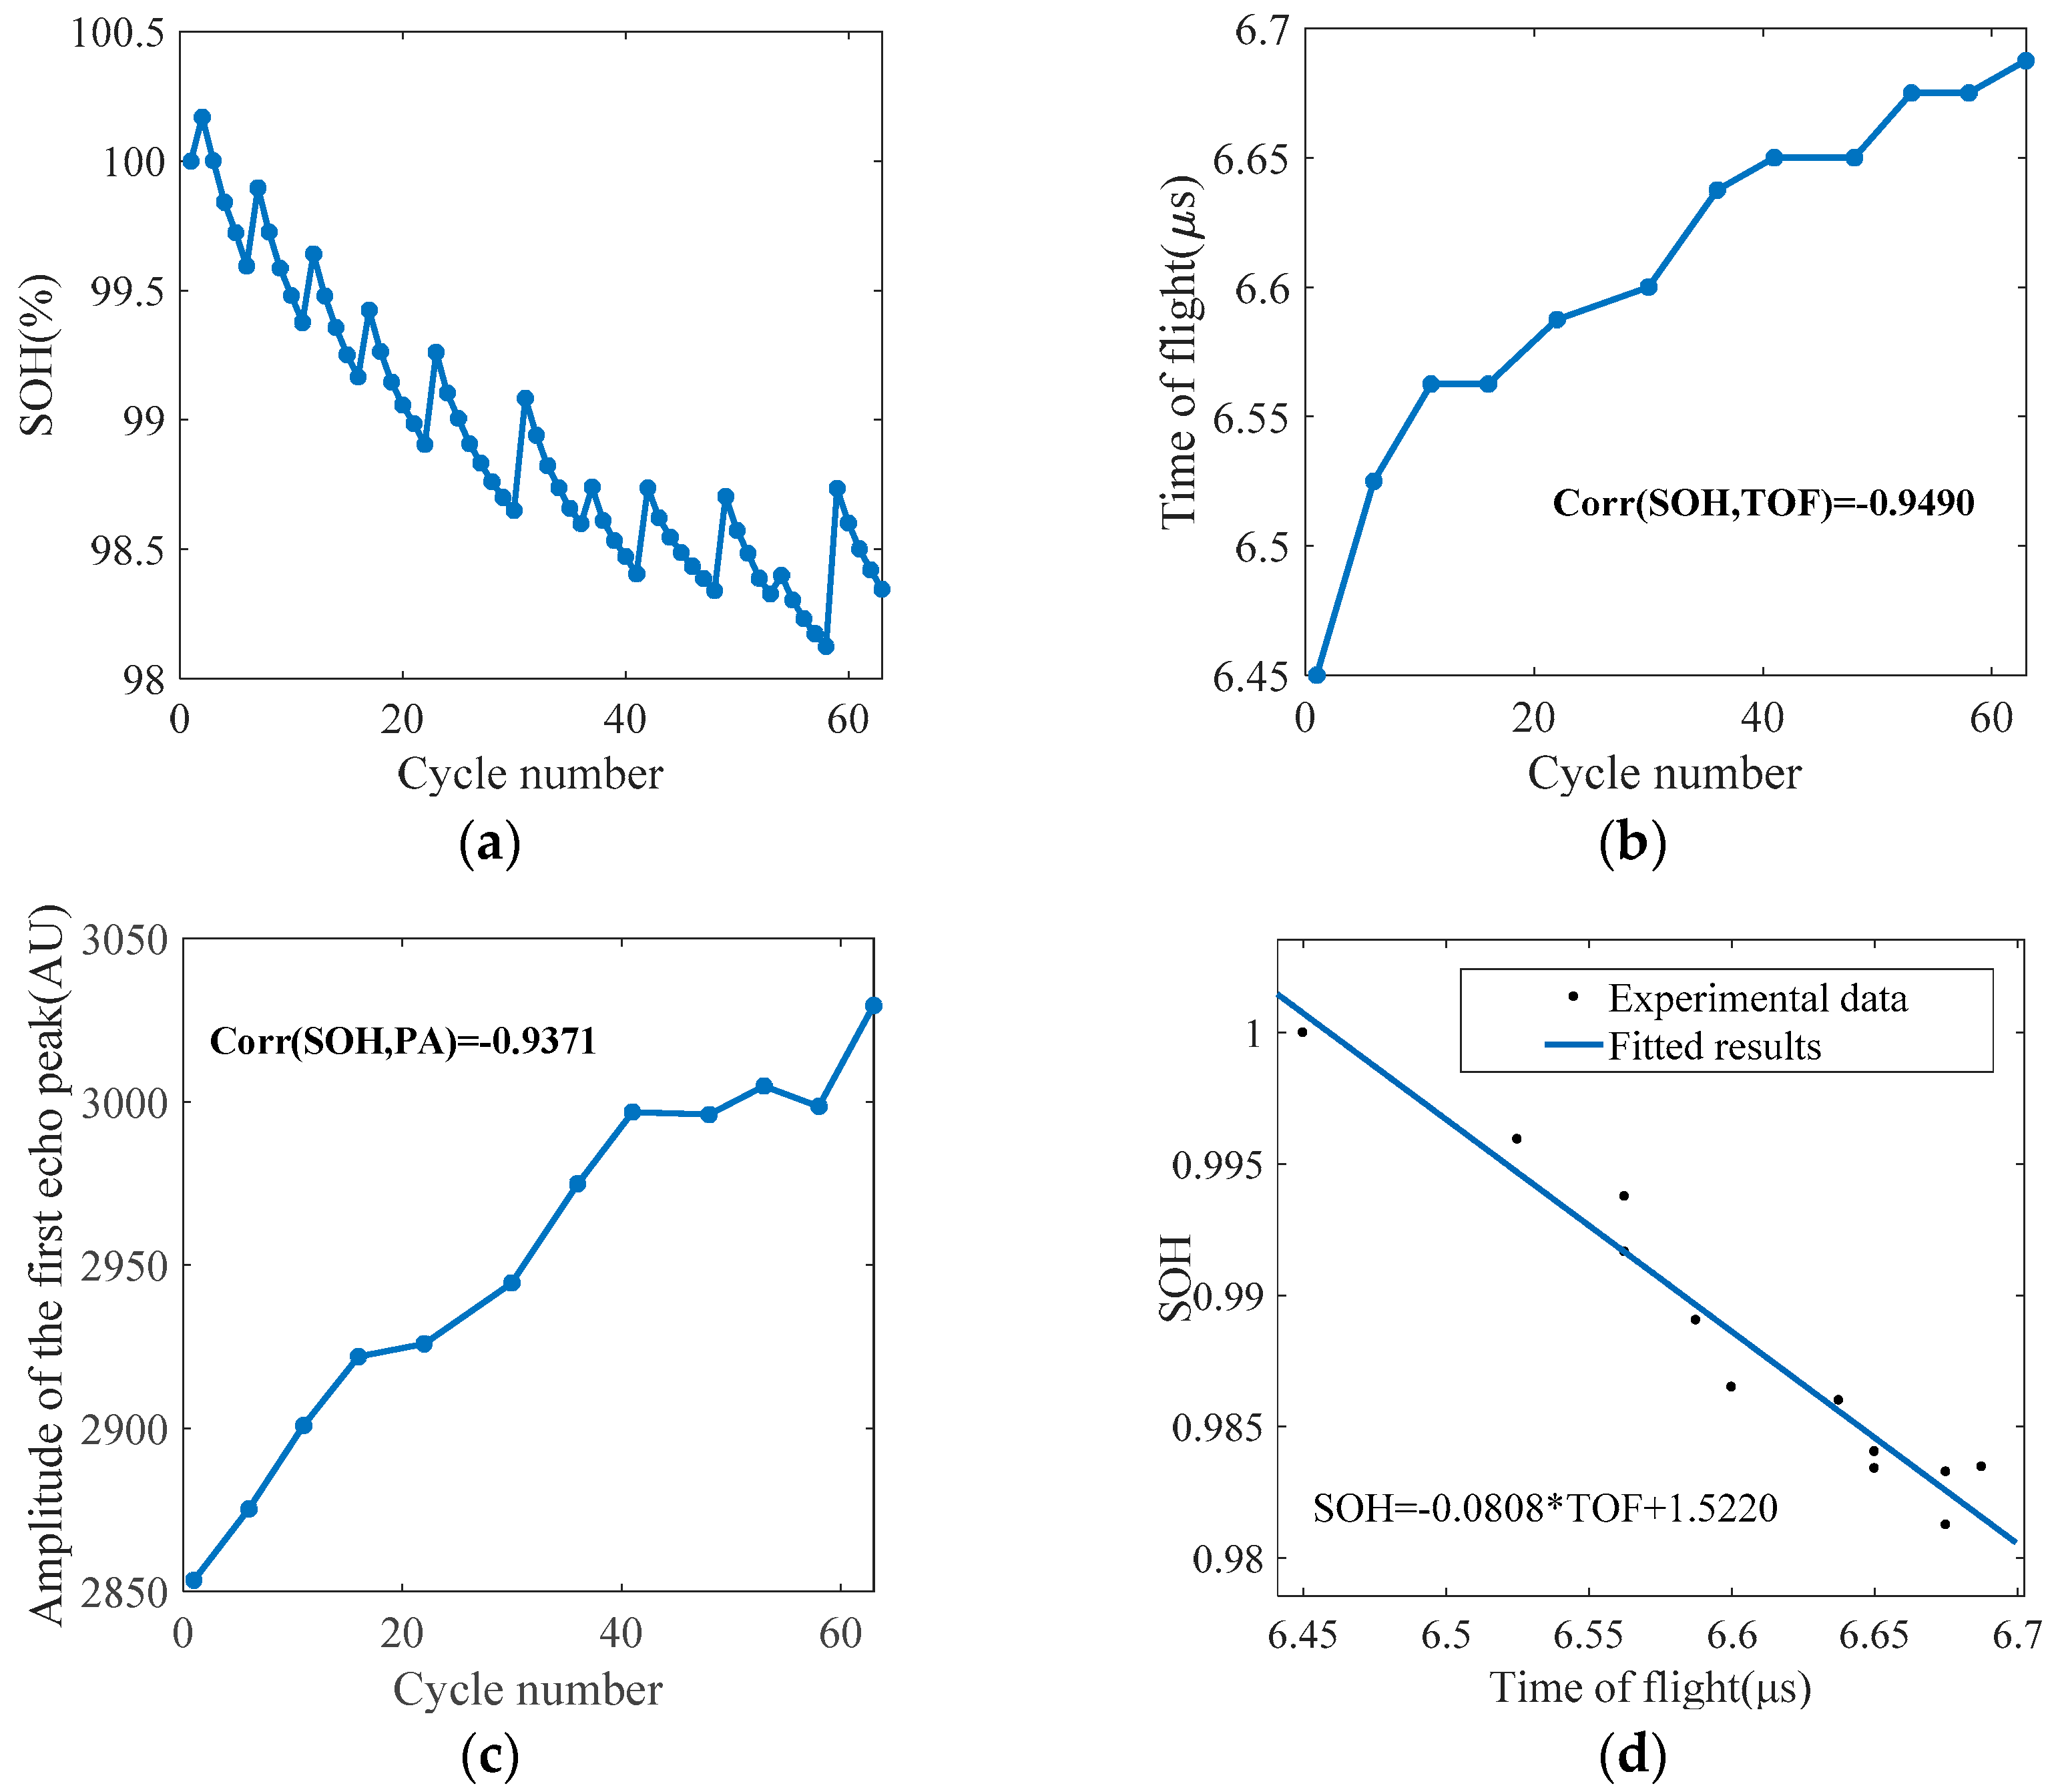
4.1. Ultrasonic Results for the Cycling Tests

Since the SOH is widely used as a way to represent the degree of degradation, the relationships between the SOH and the ultrasonic features were investigated for the cycling tests. Battery A1 was cycled under normal charge/discharge conditions. Figure 3a shows the SOH of battery A1 over the cycle number. The initial capacity of battery A1 was 1.88 Ah. The average capacity fading rate was about 0.02% per cycle. After 100 cycles and 210 cycles, the remaining capacity was 97.69% and 96.02% of the initial capacity, respectively. Because of the regeneration phenomena of lithium-ion batteries during the rest time [30], battery A1 recovered some capacity when the ultrasonic measurement was conducted. The evolution of the ultrasonic signal over the cycle number, in Figure 3b, shows that the waveform of the signal shifts over cycles. The ultrasonic signal at cycle 100 deviates from the signal at cycle 1, which was considered as the baseline signal. The deviation at cycle 210 is more prominent as compared with that at cycle 100.
To further analyze the ultrasonic features (i.e., TOF and PA), they are extracted from each cycle, respectively. Figure 3c shows that the TOF basically increases as the battery degrades. Increasing of TOF indicates decreasing of the ultrasound velocity, which is a result of the changes in the electrode densities and modulus (i.e., the lithium content changes in each electrode) as a battery degrades [28,31]. Note that an increase of TOF could also indicate an increase in the thickness. However, changes of thickness are ignored in this case as they are not the main contributor to TOF changes according to [28]. In addition, the signal amplitude, in Figure 3c, generally increases before cycle 50, followed by a fluctuation after cycle 50. A sharp decrease of signal amplitude occurs at cycle 136, which indicates possible gas generation inside the battery [21].
To determine the capability of the signal to indicate the battery SOH, the Spearman correlation coefficient was employed to calculate the correlation between the ultrasonic features (TOF and PA) and the battery SOH [32]. The Spearman correlation coefficient, rs, is computed as follows:
r s = cov ( x i , y i ) σ x i , σ y i
where cov(xi, yi) is the covariance of the rank variables xi and yi for the original data xi and yi, and σxi, σyi are the standard deviations of the rank variables. The rs ranges from −1 to +1 and rs = −1 (+1) indicates that one of the variables is monotonically decreasing (increasing) with the other.
Figure 3d shows the Spearman correlation coefficients between the ultrasonic features and the SOH from the initial cycle to different cycles. The negative correlation coefficient values between the SOH and the TOF show that the TOF increases with the decreasing SOH. In addition, the absolute values of the correlation coefficients are always larger than 0.94, which indicates that the TOF is highly correlated with the SOH over cycles. However, as shown in Figure 3d, a strong correlation (<−0.75) between the PA and the SOH is only seen before cycle 100 but not after that.
Figure 3e shows the SOH versus the TOF for battery A1. A linear model is established by fitting the experimental data. A “closer-to-1” adjusted R-square (R2) and a “closer-to-0” root mean square error (RMSE) show a better goodness-of-fit of the model. In this case, the R2 of 0.949 and the RMSE of 0.002677 indicate that there is a linear relationship between the SOH and the TOF for battery A1.
Battery A2 underwent the same cycling test as A1. Figure 4a shows the cycling performance for battery A2. The capacity at cycle 63 is 98.35% of the initial capacity. Figure 4b,c shows the evolution of the TOF and PA, respectively, and their corresponding correlations with the battery SOH were also calculated. Both of these features show high correlations with the SOH. Figure 4d exhibits the relationship between the TOF and SOH of this battery. We observe that the TOF-SOH curve can also be well fitted using a linear model as battery A1.
Batteries B1 and B2 were cycled under overcharge conditions to accelerate battery degradation with more severe physical changes shown than batteries A1 and A2. Figure 5a shows the average capacity fading rates for batteries B1 and B2 were 0.48% and 0.52%, respectively, which are higher as compared with batteries A1 and A2 under normal cycling conditions. Similar to the analysis of batteries A1 and A2, Figure 5b shows the evolution of the TOF for batteries B1 and B2 and the correlation between the TOF and the SOH for each battery is calculated. Figure 5c plots the change in the PA with the cycle number for both these batteries and shows that both these features are highly correlated with the SOH. However, the TOF shows a negative correlation with the SOH, while the PA shows a positive correlation.
According to the ultrasonic analysis from the cycling tests, the evolution of the PA does not appear to be a reliable indicator to characterize the battery SOH because it does not indicate the SOH properly for battery A1 after 100 cycles. In addition, the PA shows a negative correlation with SOH for batteries A1 and A2 and a positive correlation for batteries B1 and B2. Such inconsistent behavior of the PA under different cycling conditions is likely caused by the complex interplay of multiple layers inside the battery because each interface offers the possibility for the ultrasonic signal to split [26]. However, the TOF always shows a strong and consistent correlation with the battery SOH in both the normal and overcharge cycling tests. Therefore, the TOF is a more reliable indicator of battery health than the PA.
To further explain the change in the TOF with the battery SOH, Figure 6 shows the evolution of the TOF during a single cycle. As we can see, the TOF decreased during the charging process, while the TOF increased during the discharging process. Referring to [28], as the battery discharges, lithium de-intercalates from the graphite and intercalates into LiCoO2, which decreases the elastic moduli for both graphite and LiCoO2. According to Equation (1), this will decrease the ultrasonic velocity and cause the increase of TOF during the discharging process.
Similarly, active lithium is consumed by side reactions (such as deposition of metallic lithium) when the battery ages. Therefore, at 0% cell SOC, the degree of the cathode lithiation (cathode SOC) may decrease with battery degradation, which may be the possible reason for the increase of TOF with battery degradation.

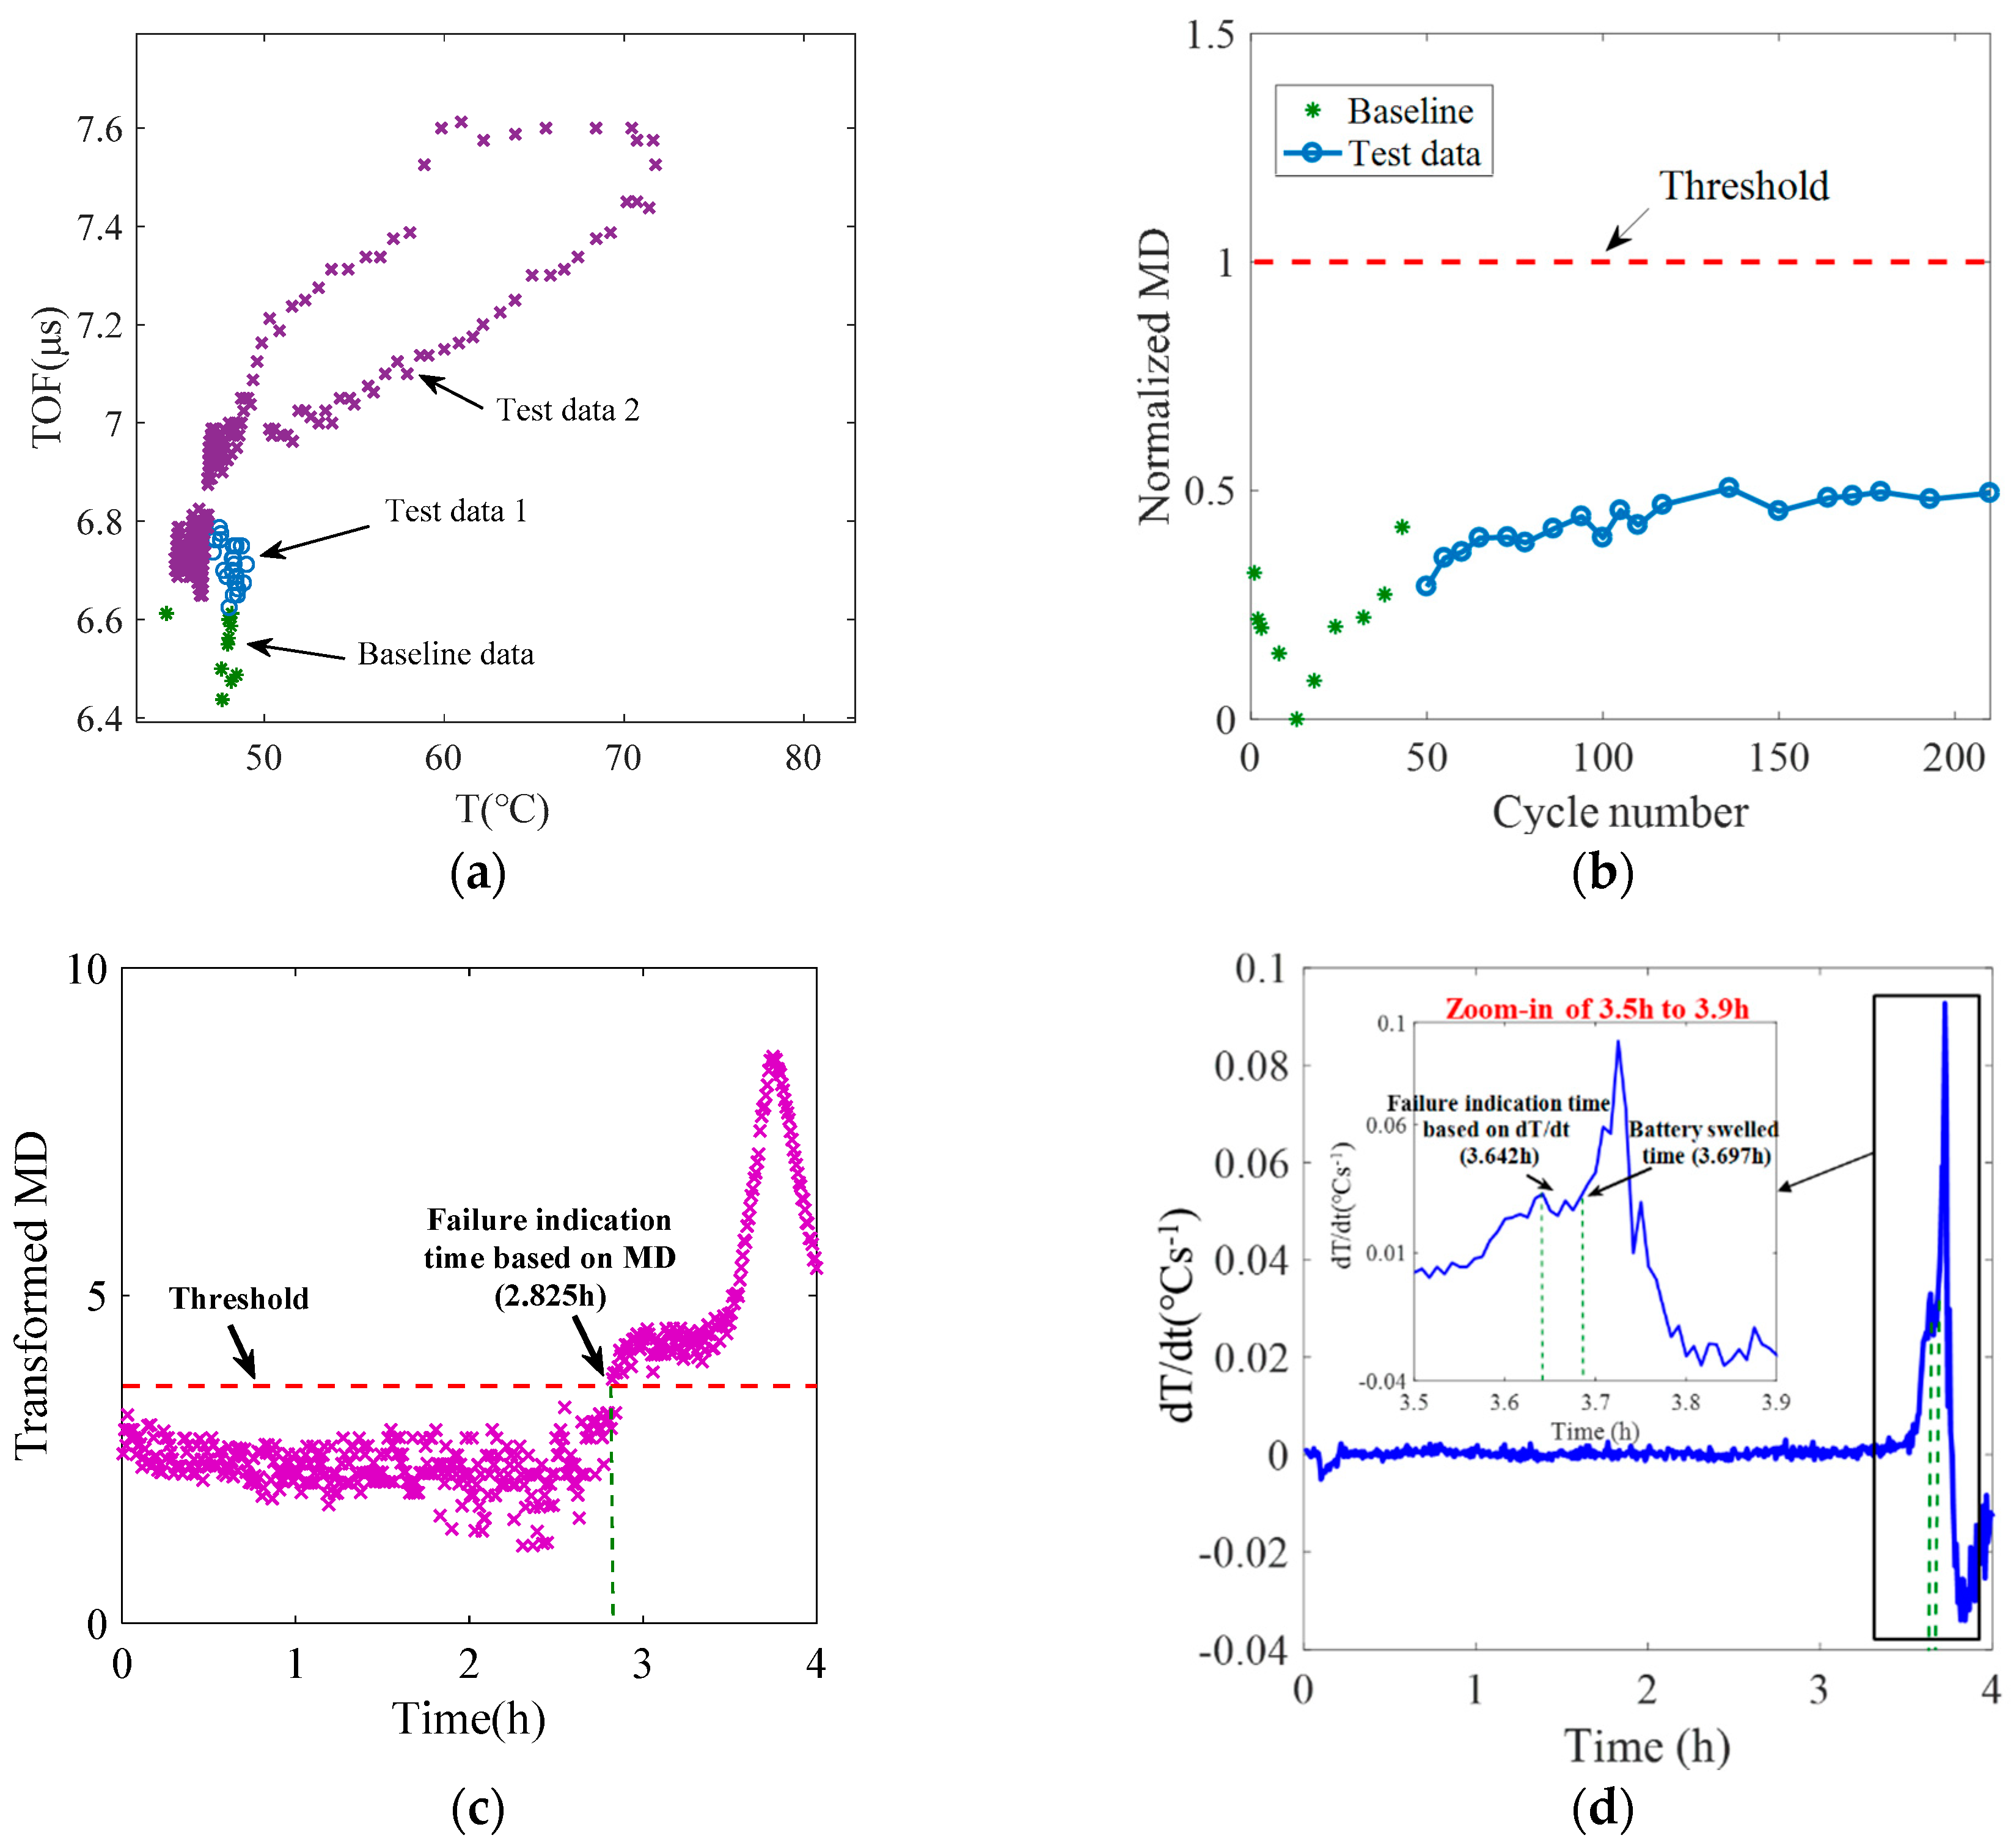
4.2. Ultrasonic Results for the Abusive Test

As mentioned in Section 3, an overcharge test (up to 5 V) was forced onto battery A1 after a period of cycling test (210 cycles) to investigate the feasibility of the ultrasonic signal under a more severe abusive condition than the previous one. The voltage and current for battery A1 during the overcharge process are shown in Figure 7a. Figure 7b shows the battery surface temperature and temperature change rate. Battery A1 was charged using a constant current of 0.5C (0.9 A) to 5 V, then maintained at 5 V. During the constant current charging period, the temperature varied between 45 °C and 50 °C, but started to rise when the voltage exceeded 4.709 V. After that, both the voltage and temperature increased sharply. During the constant voltage charging period (holding at 5 V), the current did not keep decreasing as expected, but increased rapidly at 3.697 h. At the same time, swelling of this battery was visually observed. The temperature at 3.697 h was 62.19 °C. For safety concerns, the test was eventually stopped. At that time, the current of the battery reached 1C (1.8 A).
Figure 7c shows the top view of the battery before and after overcharge. Figure 7d shows the X-ray images (the side view) of the battery. The thickness of the swollen battery increased as compared with the battery before overcharge. In addition, there was electrode ruffling after the battery was overcharged. This result is different from the situation before overcharge which shows the aligned electrode layers. The changes in the thickness and the interlayers are mainly attributed to gas generation under overcharge. Some gases, such as carbon dioxide (CO2) and methane (CH4), have been identified in batteries operating under overcharge conditions [33]. As the result and a product of electrolyte decomposition, the gas species are beyond the scope of this paper.
The ultrasonic features during the overcharge test are shown in Figure 7e,f. Figure 7e shows that the TOF shifts towards the lower value before 2.5 h, which is in agreement with [26] (due to the change of SOC). The TOF begins to increase at about 2.8 h. One possible interpretation of this increase is that the TOF has already indicated a tiny amount of gas generated inside the battery. In addition, an increase of the thickness of battery layers may also increase the value of TOF. Then, the TOF increases sharply in a similar time range as the temperature increases. Subsequently, the TOF shows the same decreasing trend as the temperature when the test is stopped. Figure 7f shows the change in the PA during the overcharge process. Similar to the cycling test results, the PA does not show a stable indication of the overcharge-induced battery failure.

5. Ultrasonic Health Monitoring for Lithium-Ion Batteries

As summarized in the ultrasonic test results, the TOF was found to be highly related to the underlying degradation and failure process for the batteries, and therefore can be used for battery health monitoring. However, evaluation of battery degradation and failure will be arbitrary if a unique sensor is used because one sensor can have large uncertainties. Other than the ultrasonic signal, temperature is indicative of the health status of a battery, especially for some catastrophic failures such as thermal runaway. Therefore, to enhance the reliability of battery health monitoring, a data fusion method was developed that fuses the temperature with the ultrasonic signal.

5.1. Methodology

Mahalanobis distance (MD) is a distance measure with multivariate data that determine the similarity between an unknown sample and a collection of known samples [34]. It is sensitive to changes in different parameters because it considers the correlation among parameters, and it eliminates the scale problem by normalizing different parameters [35]. Due to these advantages, the MD approach was used as the data fusion method in this study. The MD values were calculated based on the temperature and ultrasonic features and used as the health indicators (HIs).
Figure 8 shows a flowchart of the MD-based battery health monitoring method. A dataset from the pristine battery (i.e., the healthy battery) was used as the training data to construct the baseline and determine the testing thresholds. Then, the MD value of the data from the test battery was calculated and compared with the thresholds to determine the health of the test battery.
The data collected from the healthy battery are denoted Xij, where i = 1, …, m; j = 1, …, n; m is the dimension of the feature vector; and n denotes the number of the observations. Each observation is normalized using the mean ( X ¯ i ) and the standard deviation ( S i ) of the feature calculated from the healthy data. Thus, a parameter’s normalized value is:
Z i j = ( X i j X ¯ i ) S i
where
X ¯ i = 1 n j = 1 n X i j
S i = j = 1 n ( X i j X ¯ i ) 2 ( n 1 )
Then, the MD value for the healthy data is calculated by the following equation:
M D j = Z j T C 1 Z j
where C is the correlation matrix.
C = 1 ( n 1 ) j = 1 n Z j Z j T
Two types of test data were used to calculate the HIs for the purpose of health monitoring. To assess degradation, the HI was calculated based on the features at a specific state (the same SOC level) in order to eliminate the effect of SOC on the features. For the indication of early failure, the HI was obtained using the features, which were continuously monitored during the operating process, in order to provide an immediate response to a sudden failure. For different types of test data, different thresholds were established. For a battery, a degradation threshold is determined based on its degradation criterion. Generally, it is suggested to replace a battery if the capacity is less than 80% of its initial value [36]. Thus, the MD value, which corresponded to SOH = 80%, was set as the threshold for the battery degradation assessment.
Determination of the early failure threshold is an important step in order to have advanced warning of failure. A fixed threshold is defined based on expert knowledge. However, this approach may not be able to indicate early failure when knowledge of failure is not available. Therefore, it is useful to implement the generalized probabilistic approach to determine the threshold. The MD values are always positive and do not follow a normal distribution. A Box–Cox transformation transforms the data with these kinds of characteristics into a normal distribution. Then the mean (μ) and standard deviation (σ) of the transformed data are obtained. Since the intervals (−∞, μ + 3σ) contain 99.9% of the MD data, the three standard deviation limit (μ + 3σ) was chosen as the threshold for failure indication, which has been demonstrated for various electronic products [35,37,38].
The Box–Cox transformation is defined as follows [39]:
y ( λ ) = { ( y λ 1 ) λ , λ 0 ln ( y ) , λ = 0
where y = y1, y2, …, yn is the original MD value and y(λ) is the transformed MD value. The power λ is obtained by maximizing the log-likelihood function.
f ( y , λ ) = n 2 l n [ i = 1 n ( y i ( λ ) y ¯ ( λ ) ) 2 n ] + ( λ 1 ) i = 1 n ln ( y i )
where
y ¯ ( λ ) = 1 n i = 1 n y i ( λ )
The mean (μ) and standard deviations (σ) of the transformed healthy MD values are used to determine the failure threshold. The upper bound (μ + 3σ) is used as a threshold for failure indication [38].
For a test battery, each observation is normalized using the mean and standard deviation from the healthy data. Then, the MD value for each observation is calculated using Equation (7) and transformed using Equation (9). When the transformed test MD values cross the thresholds, a failure is considered to occur.

5.2. Battery Health Monitoring Results

As shown in Section 4, battery A1 underwent a period of cycling test and an overcharge test, sequentially. It is used as a case study to evaluate the developed health monitoring method. Figure 9a shows a scatter plot of the TOF and temperature for battery A1. First, the baseline data correspond to the first 10 data points from the cycling test. They refer to 100% to 98% SOH and are all measured at 0% SOC. Then, the test data 1 are extracted from the subsequent cycling test. They are also measured at 0% SOC but used for degradation assessment. Finally, the test data 2 correspond to the data measured during the 5 V overcharge process after 210 cycles. They are used for failure indication. Here, since tests were conducted under the well-controlled lab conditions, the data are used without a denoising process. In practice, the measured data may contain noise, these data are denoised before calculating the MD values.
The MD values corresponding to the training (baseline) data and the test data 1 for degradation assessment are shown in Figure 9b. These MD values were transformed into normally distributed variables using Box–Cox. To set the degradation threshold (DT), a linear model between the SOH and TOF was built based on the training data. Then, the estimated TOF value (TOF_DT) corresponding to SOH = 80% was obtained based on the linear model. In addition, the average value of the temperatures (T_DT) from the training data was calculated. The MD value between (TOF_DT and T_DT) and the baseline was calculated and set as the DT. In order to quantify the degree of degradation, the MD values were normalized using the DT value. The range of the normalized MD value is from zero to one. A larger MD value indicates greater degradation, i.e., one means the battery degrades severely and is not able to be used and zero means the battery is healthy. According to Figure 9b, the normalized MD value shows an increasing tendency with the increasing cycle number, which means the battery degrades with the increasing cycle number. The MD value does not reach the degradation threshold until the end of the cycling test. The battery capacity is 96% of the initial capacity at the end of the cycling test, which also indicates the battery does not reach its degradation criterion (80% of its initial capacity). Therefore, the degradation assessment based on the proposed HI is consistent with the capacity test result.
The transformed MD values corresponding to test data 2 for failure indication are shown in Figure 9c. The failure threshold (FT) is plotted as the dashed line in Figure 9c. The temperature change rate (dT/dt) is plotted in Figure 9d. These two figures compare the indication time of failure by using the MD values and the temperature change rate, respectively. As shown in Figure 9c, when the MD value exceeded the failure threshold, the failure was indicated at 2.825 h. This time corresponds to the battery voltage at 4.564 V and the surface temperature at 46.86 °C. However, if the failure time is determined only in terms of the first peak of dT/dt, the battery failure was only identified at 3.642 h, which corresponds to close to 5 V voltage and a temperature of 55.65 °C. After that point, the temperature increased sharply, which means there was little time to prevent the battery from swelling. Therefore, the MD-based HI provides earlier failure indication time and a longer time margin for countermeasures to prevent further catastrophic failure as compared with monitoring only the temperature.

6. Conclusions

This paper developed an ultrasonic health monitoring method for lithium-ion batteries. To begin with, the feasibility of using ultrasonic sensing to probe the health status of a lithium-ion battery was demonstrated through battery cycling tests and an overcharge abusive test (up to 5 V). The ultrasonic results from the cycling test showed a strong dependence between the ultrasonic TOF and battery degradation. The overcharge test results showed that the ultrasonic TOF is sensitive to the battery swelling, which offers the potential for battery failure indication.
More importantly, an effective method for battery health monitoring was developed, which offers a significant improvement over the state-of-the-art ultrasonic techniques in terms of providing an early indication of sudden failure. A new data fusion MD-based health indicator was constructed by integrating the data from the temperature sensor and the ultrasonic transducer. The effectiveness of the health indicator was verified by the case study of battery A1, which underwent a cycling test followed by an overcharge test. The cycling test showed that the MD value increases with the battery aging. This means it can be used to determine battery degradation straightforwardly without the information on the battery’s discharge capacity. The overcharge test (up to 5 V) showed that the health indicator can indicate battery failure 0.872 h ahead of battery swelling and 0.817 h earlier than the temperature-based method. In comparison to the temperature-based method, the developed method provides earlier warning of catastrophic failure and a longer time margin for failure prevention.
The developed ultrasonic health monitoring method can assess battery degradation as well as indicate battery sudden failure without needing the battery to be fully charged/discharged. This health monitoring method can be applied to batteries during their operation by integrating simple and small equipment (a pulser-receiver module and a piezoelectric transducer) into the existing battery management system. Similar techniques can be extended and applied to batteries with different chemistries, scales, and form factors. In future research, we will investigate the feasibility of using an ultrasonic inspection method to identify different aging mechanisms of the lithium-ion batteries.

Author Contributions

Investigation, M.P.; methodology, Y.W. (Yi Wu); writing—original draft, Y.W. (Yi Wu); writing—review and editing, Y.W. (Youren Wang) and M.P.; supervision, M.P.; funding acquisition, W.K.C.Y.

Funding

This work was supported by the National Natural Science Foundation of China (grant number 61473242); funding for Outstanding Doctoral Dissertation in NUAA (grant number BCXJ14-04); and the Fundamental Research Funds for the Central Universities and Funding of Jiangsu Innovation Program for Graduate Education (grant number KYLX_0251).

Acknowledgments

The authors would like to thank the more than 150 companies and organizations that support research activities at the Center for Advanced Life Cycle Engineering (CALCE) at the University of Maryland.

Conflicts of Interest

The authors declare no conflict of interest.

References

  1. Arora, P. Capacity fade mechanisms and side reactions in lithium-ion batteries. J. Electrochem. Soc. 1998, 145, 3647. [Google Scholar] [CrossRef]
  2. Kim, G.H.; Smith, K.; Ireland, J.; Pesaran, A. Fail-safe design for large capacity lithium-ion battery systems. J. Power Sources 2012, 210, 243–253. [Google Scholar] [CrossRef]
  3. Wu, Y.; Saxena, S.; Xing, Y.; Wang, Y.; Li, C.; Yung, W.K.C.; Pecht, M. Analysis of manufacturing-induced defects and structural deformations in lithium-ion batteries using computed tomography. Energies 2018, 11, 925. [Google Scholar] [CrossRef]
  4. Williard, N.; He, W.; Hendricks, C.; Pecht, M. Lessons learned from the 787 Dreamliner issue on lithium-ion battery reliability. Energies 2013, 6, 4682–4695. [Google Scholar] [CrossRef]
  5. Hendricks, C.; Williard, N.; Mathew, S.; Pecht, M. A failure modes, mechanisms, and effects analysis (FMMEA) of lithium-ion batteries. J. Power Sources 2015, 297, 113–120. [Google Scholar] [CrossRef] [Green Version]
  6. Abada, S.; Marlair, G.; Lecocq, A.; Petit, M.; Sauvant-Moynot, V.; Huet, F. Safety focused modeling of lithium-ion batteries: A review. J. Power Sources 2016, 306, 178–192. [Google Scholar] [CrossRef]
  7. El Mejdoubi, A.; Oukaour, A.; Chaoui, H.; Gualous, H.; Sabor, J.; Slamani, Y. State-of-charge and state-of-health lithium-ion batteries’ diagnosis according to surface temperature variation. IEEE Trans. Ind. Electron. 2016, 63, 2391–2402. [Google Scholar] [CrossRef]
  8. Berecibar, M.; Gandiaga, I.; Villarreal, I.; Omar, N.; Van Mierlo, J.; Van den Bossche, P. Critical review of state of health estimation methods of Li-ion batteries for real applications. Renew. Sustain. Energy Rev. 2016, 56, 572–587. [Google Scholar] [CrossRef]
  9. Lipu, M.S.H.; Hannan, M.A.; Hussain, A.; Hoque, M.M.; Ker, P.J.; Saad, M.H.M.; Ayob, A. A review of state of health and remaining useful life estimation methods for lithium-ion battery in electric vehicles: Challenges and recommendations. J. Clean. Prod. 2018, 205, 115–133. [Google Scholar] [CrossRef]
  10. Ahwiadi, M.; Wang, W. An enhanced mutated particle filter technique for system state estimation and battery life prediction. IEEE Trans. Instrum. Meas. 2019, 68, 923–935. [Google Scholar] [CrossRef]
  11. Liu, Z.; Sun, G.; Bu, S.; Han, J.; Tang, X.; Pecht, M. Particle learning framework for estimating the remaining useful life of lithium-ion batteries. IEEE Trans. Instrum. Meas. 2017, 66, 280–293. [Google Scholar] [CrossRef]
  12. Liu, D.; Song, Y.; Li, L.; Liao, H.; Peng, Y. On-line life cycle health assessment for lithium-ion battery in electric vehicles. J. Clean. Prod. 2018, 199, 1050–1065. [Google Scholar] [CrossRef]
  13. Xing, Y.; Ma, E.W.M.; Tsui, K.; Pecht, M. An ensemble model for predicting the remaining useful performance of lithium-ion batteries. Microelectron. Reliab. 2013, 53, 811–820. [Google Scholar] [CrossRef]
  14. Novais, S.; Nascimento, M.; Grande, L.; Domingues, M.F.; Antunes, P.; Alberto, N.; Leitão, C.; Oliveira, R.; Koch, S.; Kim, G.T.; et al. Internal and external temperature monitoring of a Li-ion battery with fiber Bragg grating sensors. Sensors 2016, 16, 1394. [Google Scholar] [CrossRef] [PubMed]
  15. Raghavan, A.; Kiesel, P.; Sommer, L.W.; Schwartz, J.; Lochbaum, A.; Hegyi, A.; Schuh, A.; Arakaki, K.; Saha, B.; Ganguli, A.; et al. Embedded fiber-optic sensing for accurate internal monitoring of cell state in advanced battery management systems part 1: Cell embedding method and performance. J. Power Sources 2017, 341, 466–473. [Google Scholar] [CrossRef]
  16. Ganguli, A.; Saha, B.; Raghavan, A.; Kiesel, P.; Arakaki, K.; Schuh, A.; Schwartz, J.; Hegyi, A.; Sommer, L.W.; Lochbaum, A.; et al. Embedded fiber-optic sensing for accurate internal monitoring of cell state in advanced battery management systems part 2: Internal cell signals and utility for state estimation. J. Power Sources 2017, 341, 474–482. [Google Scholar] [CrossRef] [Green Version]
  17. Lee, C.-Y.; Lee, S.-J.; Hung, Y.-M.; Hsieh, C.-T.; Chang, Y.-M.; Huang, Y.-T.; Lin, J.-T. Integrated microsensor for real-time microscopic monitoring of local temperature, voltage and current inside lithium ion battery. Sens. Actuators A Phys. 2017, 253, 59–68. [Google Scholar] [CrossRef]
  18. Giurgiutiu, V. Structural Health Monitoring: With Piezoelectric Wafer Active Sensors; Elsevier: Amsterdam, The Netherlands, 2007. [Google Scholar]
  19. Schmerr, L.W. Fundamentals of Ultrasonic Nondestructive Evaluation; Springer: New York, NY, USA, 2016. [Google Scholar]
  20. Inspection of Prismatic Lithium Ion Batteries for Consumer Electronics. Available online: http://ultrangroup.com/applications/inspection-of-prismatic-lithium-ion-batteries-for-consumer-electronics/ (accessed on 12 March 2019).
  21. Sood, B.; Osterman, M.; Pecht, M. Health monitoring of lithium-ion batteries. In Proceedings of the 2013 IEEE Symposium on Product Compliance Engineering (ISPCE), Austin, TX, USA, 7–9 October 2013; pp. 1–6. [Google Scholar]
  22. Li, H.; Zhou, Z.; Li, H.; Zhou, Z. Numerical simulation and experimental study of fluid-solid coupling-based air-coupled ultrasonic detection of stomata defect of lithium-ion battery. Sensors 2019, 19, 2391. [Google Scholar] [CrossRef] [PubMed]
  23. Ladpli, P.; Nardari, R.; Kopsaftopoulos, F.; Wang, Y.; Chang, F.K. Design of multifunctional structural batteries with health monitoring capabilities. In Proceedings of the 8th European Workshop on Structural Health Monitoring, Bilbao, Spain, 5–8 July 2016; pp. 1–13. [Google Scholar]
  24. Ladpli, P.; Kopsaftopoulos, F.; Nardari, R.; Chang, F.K. Battery charge and health state monitoring via ultrasonic guided-wave-based methods using built-in piezoelectric transducers. In Proceedings of the Smart Materials and Nondestructive Evaluation for Energy Systems, Portland, OR, USA, 25–29 March 2017; p. 1017108. [Google Scholar]
  25. Ladpli, P.; Kopsaftopoulos, F.; Chang, F.-K. Estimating state of charge and health of lithium-ion batteries with guided waves using built-in piezoelectric sensors/actuators. J. Power Sources 2018, 384, 342–354. [Google Scholar] [CrossRef]
  26. Hsieh, A.G.; Bhadra, S.; Hertzberg, B.; Gjeltema, P.J.; Goy, A.; Fleischer, J.W.; Steingart, D. Electrochemical-acoustic time of flight: In operando correlation of physical dynamics with battery charge and health. Energy Environ. Sci. 2015, 8, 1569–1577. [Google Scholar] [CrossRef]
  27. Gold, L.; Bach, T.; Virsik, W.; Schmitt, A.; Müller, J.; Staab, T.E.M.; Sextl, G. Probing lithium-ion batteries’ state-of-charge using ultrasonic transmission—Concept and laboratory testing. J. Power Sources 2017, 343, 536–544. [Google Scholar] [CrossRef]
  28. Davies, G.; Knehr, K.W.; Van Tassell, B.; Hodson, T.; Biswas, S.; Hsieh, A.G.; Steingart, D.A. State of charge and state of health estimation using electrochemical acoustic time of flight analysis. J. Electrochem. Soc. 2017, 164, A2746–A2755. [Google Scholar] [CrossRef]
  29. Choi, J.W.; Aurbach, D. Promise and reality of post-lithium-ion batteries with high energy densities. Nat. Rev. Mater. 2016, 1, 16013. [Google Scholar] [CrossRef]
  30. Olivares, B.E.; Cerda Munoz, M.A.; Orchard, M.E.; Silva, J.F. Particle-filtering-based prognosis framework for energy storage devices with a statistical characterization of state-of-health regeneration phenomena. IEEE Trans. Instrum. Meas. 2013, 62, 364–376. [Google Scholar] [CrossRef]
  31. Swallow, J.G.; Woodford, W.H.; McGrogan, F.P.; Ferralis, N.; Chiang, Y.-M.; Van Vliet, K.J. Effect of electrochemical charging on elastoplastic properties and fracture toughness of LiXCoO2. J. Electrochem. Soc. 2014, 161, F3084–F3090. [Google Scholar] [CrossRef]
  32. Jameson, N.J.; Azarian, M.H.; Pecht, M. Impedance-based condition monitoring for insulation systems used in low-voltage electromagnetic coils. IEEE Trans. Ind. Electron. 2017, 64, 3748–3757. [Google Scholar] [CrossRef]
  33. Ohsaki, T.; Kishi, T.; Kuboki, T.; Takami, N.; Shimura, N.; Sato, Y.; Sekino, M.; Satoh, A. Overcharge reaction of lithium-ion batteries. J. Power Sources 2005, 146, 97–100. [Google Scholar] [CrossRef]
  34. Wang, Y.; Miao, Q.; Ma, E.W.M.; Tsui, K.L.; Pecht, M.G. Online anomaly detection for hard disk drives based on Mahalanobis distance. IEEE Trans. Reliab. 2013, 62, 136–145. [Google Scholar] [CrossRef]
  35. Patil, N.; Das, D.; Pecht, M. Anomaly detection for IGBTs using Mahalanobis distance. Microelectron. Reliab. 2015, 55, 1054–1059. [Google Scholar] [CrossRef]
  36. Berecibar, M.; Garmendia, M.; Gandiaga, I.; Crego, J.; Villarreal, I. State of health estimation algorithm of LiFePO4 battery packs based on differential voltage curves for battery management system application. Energy 2016, 103, 784–796. [Google Scholar] [CrossRef]
  37. Kumar, S.; Chow, T.W.S.; Pecht, M. Approach to fault identification for electronic products using Mahalanobis distance. IEEE Trans. Instrum. Meas. 2010, 59, 2055–2064. [Google Scholar] [CrossRef]
  38. Jin, X.; Wang, Y.; Chow, T.W.S.; Sun, Y. MD-based approaches for system health monitoring: A review. IET Sci. Meas. Technol. 2017, 11, 371–379. [Google Scholar] [CrossRef]
  39. Box, G.E.P.; Box, G.E.P.; Cox, D.R. An analysis of transformations. J. R. Stat. Soc. Ser. B 1964, 26, 211–252. [Google Scholar] [CrossRef]
Figure 1. (a) Schematic for battery ultrasonic sensing and (b) representative ultrasonic response signal of a lithium-ion battery.
Electronics 08 00751 g001
Figure 2. Battery test bench.
Electronics 08 00751 g002
Figure 3. Cycling test results for battery A1: (a) cycling performance, (b) ultrasonic signals, (c) ultrasonic features, (d) Spearman correlations between the ultrasonic features and state of health (SOH), and (e) plot of SOH as a function of time-of-flight (TOF).
Electronics 08 00751 g003aElectronics 08 00751 g003b
Figure 4. Cycling test results for battery A2: (a) cycling performance, (b) time-of-flight, (c) amplitude of the first echo peak, and (d) plot of SOH as a function of TOF.
Electronics 08 00751 g004
Figure 5. Cycling test results for batteries B1 and B2: (a) cycling performance, (b) time-of-flight, (c) amplitude of the first echo peak.
Electronics 08 00751 g005
Figure 6. (a) Voltage data during a C/2 charging and discharging cycle, (b) corresponding evolution of TOF taken every 20 s.
Electronics 08 00751 g006
Figure 7. Overcharge test results for battery A1: (a) voltage and current profiles, (b) temperature profile, (c) photos of the battery (top view), (d) X-ray images of the battery (side view), (e) evolution of TOF, and (f) evolution of PA.
Electronics 08 00751 g007
Figure 8. Developed battery health monitoring method.
Electronics 08 00751 g008
Figure 9. Health monitoring for battery A1: (a) scatter plot of the TOF and temperature, (b) degradation assessment result based on Mahalanobis distance (MD) values, (c) failure indication result based on MD values, and (d) failure indication result based on the temperature change rate.
Electronics 08 00751 g009
Table 1. Battery test methods.
Test TypeTest MethodTest Description
Cycling testNormal cyclingCC charge at 0.5C until 4.2 V, then CV charge until current <0.05C
Rest 10 min
Discharge at 1C to 2.75 V
Rest 10 min
Overcharge cyclingCC charge at 0.5C until 4.5 V, then CV charge until current <0.05C
Rest 10 min
Discharge at 1C to 2.75 V
Rest 10 min
Abusive testOverchargeCC charge at 0.5C until 5 V
CV charge until the battery swells

