Article

A Smart Overvoltage Monitoring and Hierarchical Pattern Recognizing System for Power Grid with HTS Cables

1
State Key Laboratory of Power Transmission Equipment & System Security and New Technology, Chongqing University, Chongqing 400044, China
2
Engineering Science, University of Oxford, Oxford OX1 3PJ, UK
*
Authors to whom correspondence should be addressed.
Electronics 2019, 8(10), 1194; https://doi.org/10.3390/electronics8101194
Submission received: 9 September 2019 / Revised: 17 October 2019 / Accepted: 18 October 2019 / Published: 20 October 2019
(This article belongs to the Special Issue Advanced Energy Systems with Superconductivity)

Abstract

:
As one part of the power system, high-temperature superconducting (HTS) cables may be subject to various system faults, such as overvoltage. When overvoltage occurs, HTS cables may quench and the resistance of HTS tapes will increase rapidly, which will result in reduction of transmission capacity, increase of power loss and even electrical insulation breakdown. To protect the operation safety of power system, the level of overvoltage should be investigated in the system. This paper proposes a non-contact variable frequency sampling and hierarchical pattern recognizing system for overvoltage. Lightning and internal overvoltage signals are captured by specially designed non-contact voltage sensors. The sensors are installed at the grounding tap of transformer bushings and the cross arm of transmission towers. A variable sampling technique is employed to solve the conflict between sampling speed and storage capacity. A hierarchical pattern recognizing system is proposed to subdivide each overvoltage into specific types. Seven common overvoltages are discussed and analyzed. Wavelet theory and S-transform singular value decomposition (SVD) theory are adopted to extract the feature parameters of different overvoltages. Particle swarm optimization is employed to maintain a high classification rate and improve the initial set of the support vector machine (SVM) used as recognition algorithm. Field-acquired overvoltage data from an 110 kV substation validate the effectiveness of the proposed recognition system.

1. Introduction

High-temperature superconductor (HTS) power technique has achieved rapid progress in the last decade, and is one of the most promising power techniques [1]. Weiss et al. [2] developed CORC ® cables for helium gas cooled power transmission and fault current limiting applications. Wang et al. [3] studied the magnetization loss of CORC ® cables. Laan et al. [4] studied the Compact GdBa 2 Cu 3 O 7–δ coated conductor cables for electric power transmission and magnet applications. McRae et al. [5] studied the effect of monotonic and cyclic axial tensile stress on the performance of superconducting CORC® wires. Wang et al. [6] studied the quench behavior of high-temperature superconductor (RE) Ba2Cu3O x CORC cable. Through the research of the above experts, HTS cable shows great advantages for high power density, large power capacity, low loss and compact space, which is very suitable for huge power transmission and urban transmission line upgrade. Therefore, HTS cable is a powerful candidate for the future smart grid. However, these advantages only present when the conductors are kept in certain low temperature range (70–77 K). The HTS cable, as well as the conventional transmission line, always suffers from the problems of lightning and internal overvoltage, which are crucial for the security of power grids. When overvoltage occurs, the HTS cable may quench and the resistance of HTS tapes will increase rapidly which will result in the reduction of transmission capacity, increase of power loss or even electrical insulation breakdown. Therefore, it is necessary to investigate the level of overvoltage.
At present, HTS cables usually adopt a hybrid operating mode. HTS cables and conventional transmission lines are in parallel connection. The power flow distribution of conventional transmission lines and HTS cables can be adjusted by means of auxiliary control equipment, in order to meet the test requirements of different operating conditions of HTS cables. However, overvoltage from parallel connected transmission lines will easily affect the HTS cable which will reduce the stability and reliability of the power grid. Hence research and development of an overvoltage online monitoring-recognizing system has great significance to the safe operation of HTS cables.
Nowadays, overvoltage monitoring systems are generally used in distribution grids and are difficult to apply in a system with 110 kV or higher because of insulation reliability and the emergence of heating problems when the divider runs for a long time. Reported overvoltage monitoring systems generally focus on monitoring internal overvoltage; however, lightning overvoltage cannot be detected because of the conflict between sampling speed and storage capacity [7]. Overvoltage recognizing systems usually contain two parts: feature extraction and recognition classifier. Yang et al. [8] used pattern spectrum to identify shielding failure and back flashover. Sima et al. [9] used the polarity of wavelet modulus maximum and waveform similarity to identify three different lightning overvoltage. Although the methods mentioned above have good feature extraction fact, the research is based on simulated signals and the parameters of overvoltage cannot be represented precisely in simulations because of the complex field conditions of a power system. Mokryani et al. [10] used wavelet transform (WT) to identify different ferroresonance overvoltage, WT is a well-known multi-resolution analysis algorithm due to its adaptable scaling properties. It has the ability to analyze the signals in both the frequency and time domains. However, it is easily influenced by the noise and the transformation results lack intuition; sometimes, the analysis results of several scales may be inconsistent; Mokryani et al. [11] used S-transform (ST) to identify different ferroresonance overvoltage. Yao et al. [12] used ST to identify different lightning overvoltage. ST can be regarded as a scalable window STFT or a deformation of a continuous wavelet transform, and has been widely used in analysis and identification of the signals of power system. Therefore, ST shows different performance for different frequency components because of the scalable window. For the high-frequency components of the signal, the window width of ST is narrow, thus time resolution is good. For the low-frequency components, ST has high-frequency resolution, which make it a good over-voltage feature extraction algorithm candidate. Previous research focused mainly on recognizing a specific type of overvoltage and did not consider the hierarchical structure of overvoltages and the internal relations between overvoltages. A single-layer structure is usually used in such overvoltage recognizing system [13]. In a single-layer structure, all characteristic parameters must be calculated regardless of the overvoltage type, and each feature parameter is useful only for some and not all kinds of overvoltage. Meanwhile, the modification of this single-layer system is difficult because the new modified feature parameters are hard to find.
To address such limitations, this paper proposes a smart overvoltage monitoring and hierarchical pattern recognizing system based on non-contact sensors. Overvoltage signals are obtained by non-contact sensors installed at the grounding tap of transformer bushings and the cross arm of transmission towers. A variable sampling technique is employed to solve the conflict between sampling speed and storage capacity. Considering the hierarchical subordination relationship of different overvoltage types, different independent classifiers are used to subdivide the overvoltage types gradually. The energy distribution characteristics of different overvoltage frequency components observed by WT and singular feature parameters observed by S-transform SVD theory are employed as feature parameters in the classifiers. Finally, particle swarm optimization support vector machine (PSO-SVM) is employed to improve the recognition rate. In this hierarchical structure, each classifier can effectively classify overvoltage with high efficiency, and the entire hierarchical recognition algorithm is easy to modify. Field-acquired overvoltage data test is carried out to validate the hierarchical pattern recognizing system.

2. Non-Contact Overvoltage Monitoring System

The system applies distributive monitoring and all the overvoltage waveforms recorded by distributed sensors can be stored and analyzed together in the database. The monitoring system is operated in Chongqing. The wiring diagram of the monitoring system in the substation is shown in Figure 1. This substation contains three different voltage levels. There are six feeders on the 35 kV bus bar, and five feeders on the 10 kV bus bar. T1 and T2 are the main transformers, and the capacity of each is 31.5 MVA. CB1–CB3 are current breakers. The voltages of 110 kV, 35 kV and 10 kV are monitored through nine transformer bushing sensors. The sensors are connected to the monitoring workstation through the signal cable. Non-contact transmission line sensors are used to monitor overvoltage from transmission lines. Six sensors are connected to the monitoring workstation through the wideband code division multiple access(WCDMA) antenna. The software of monitoring system are installed in the same workstation. Once the amplitude of voltage exceeds the threshold, the monitoring system records the waveforms of voltage and stores them in the database in the form of discrete data. Then the overvoltage identification system is triggered to classify and identify this record. The workflow is described in Figure 2.

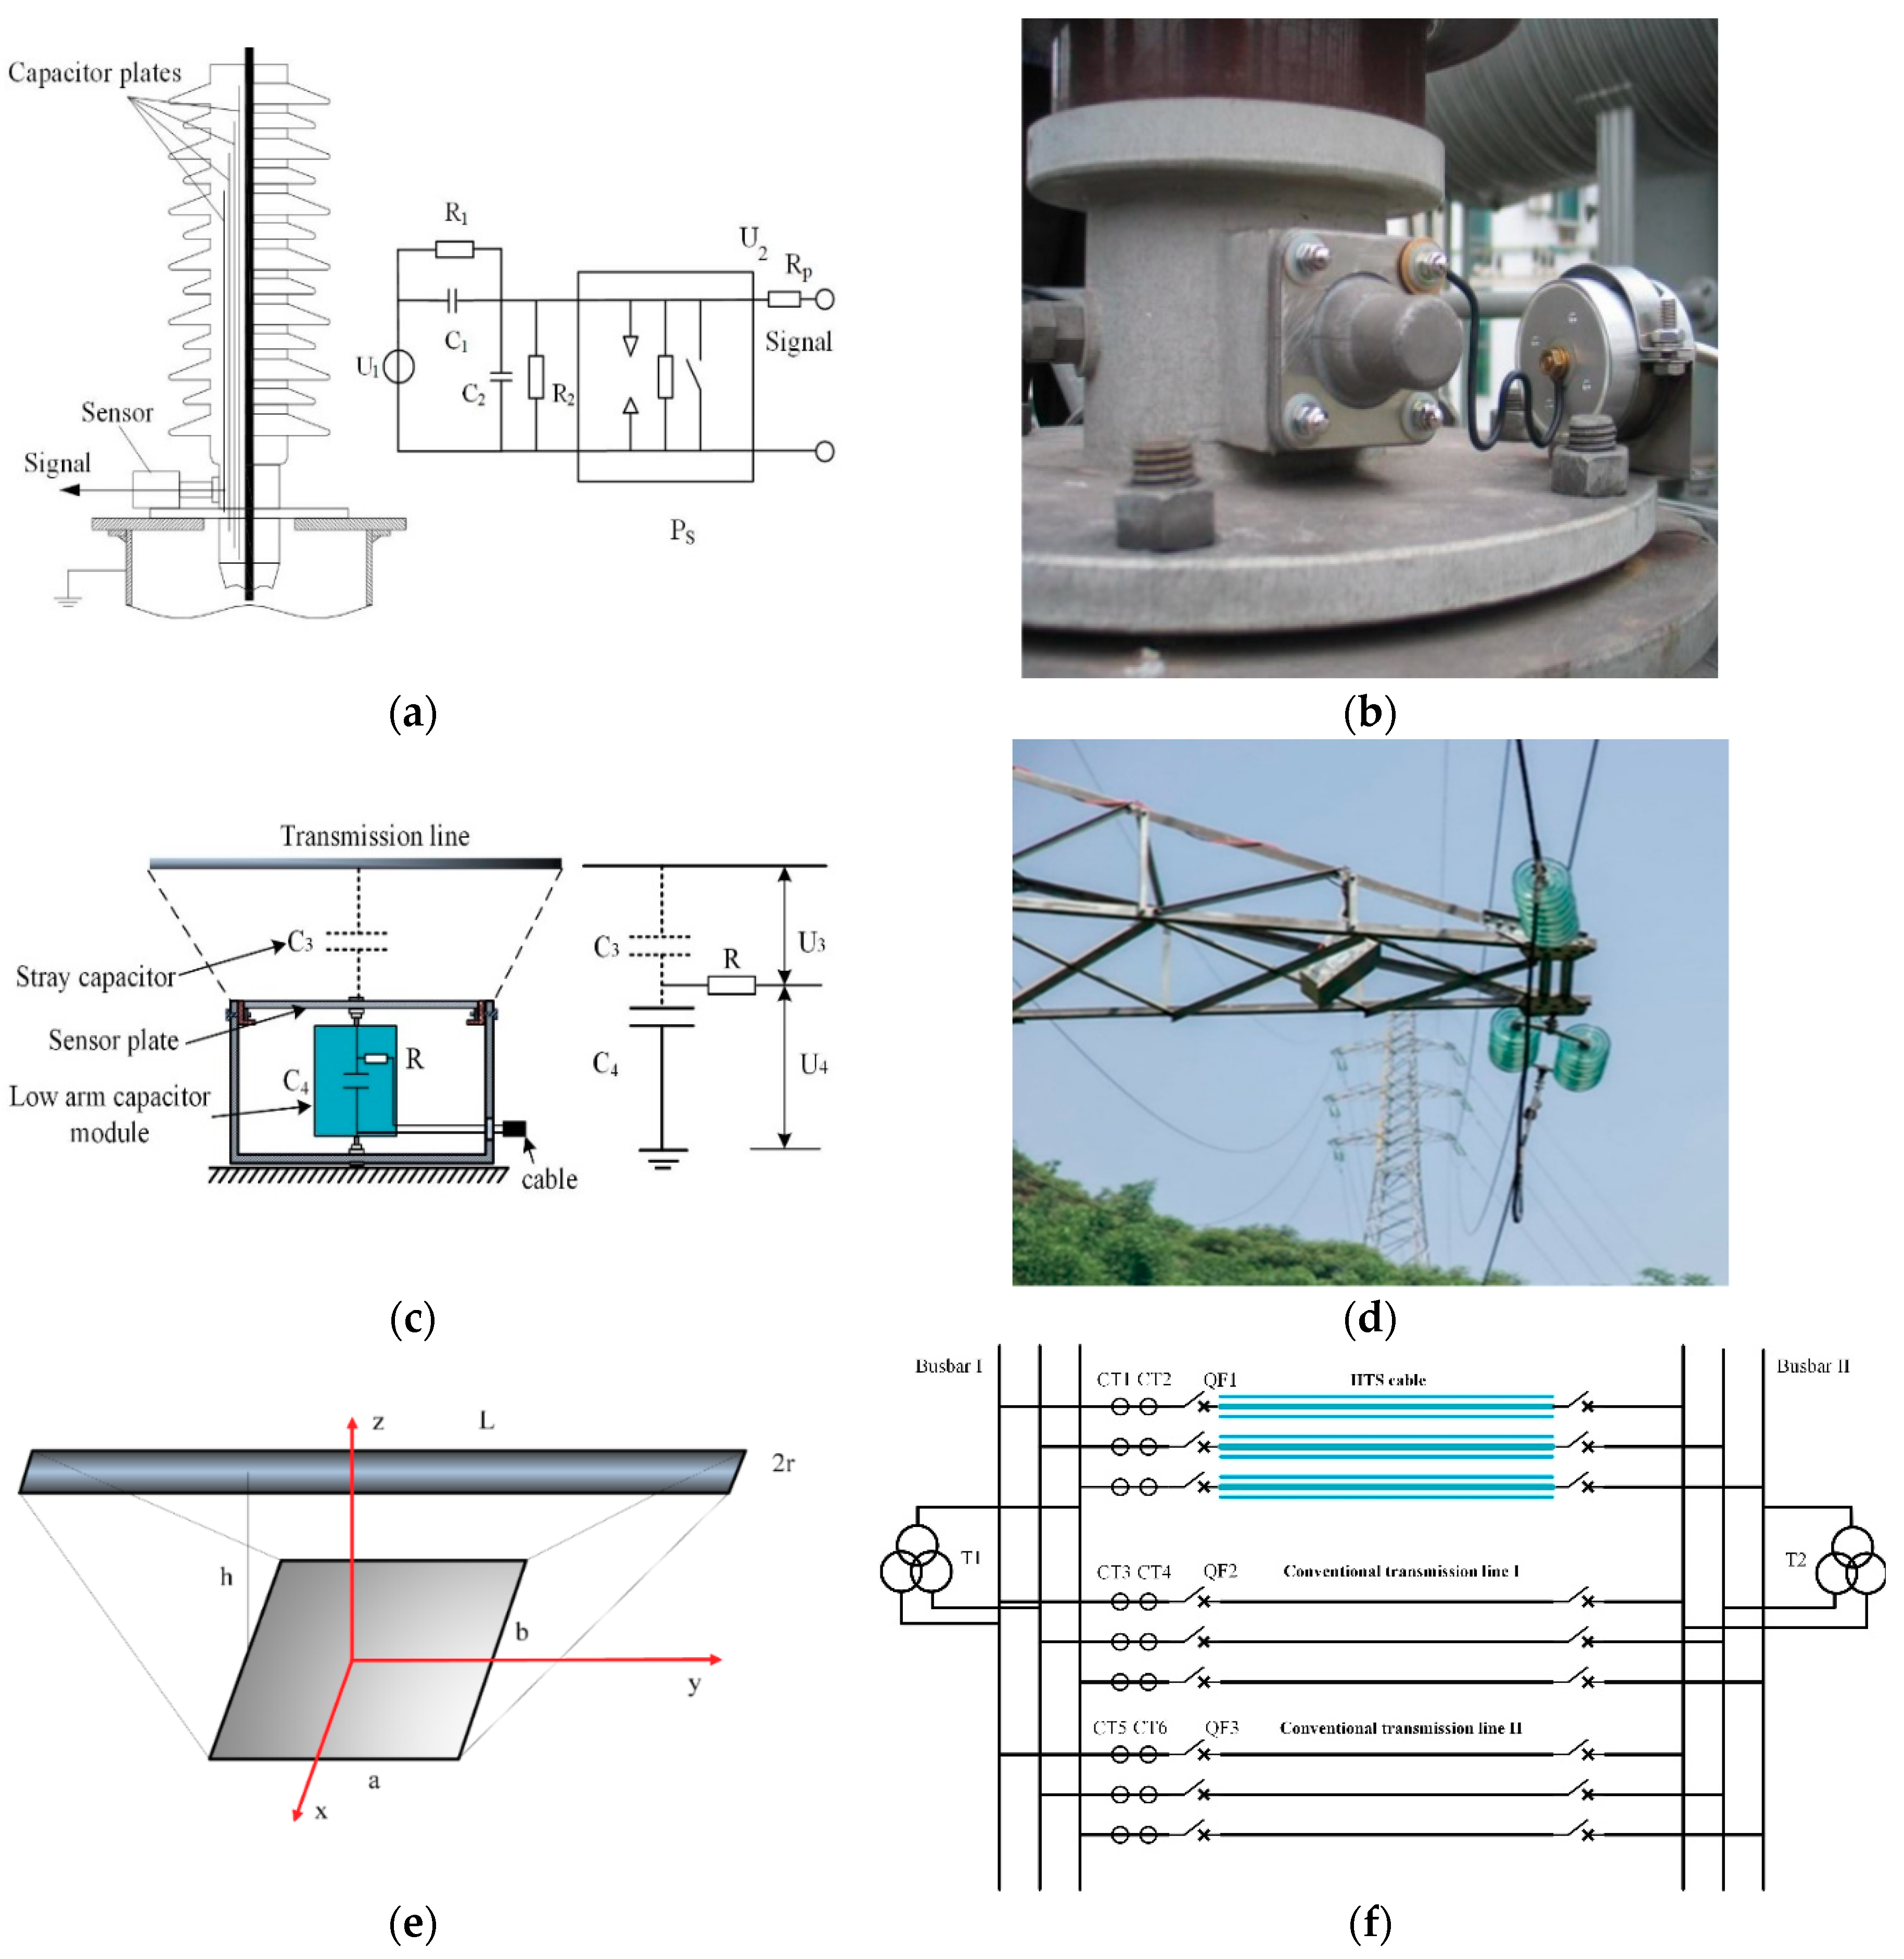
2.1. Overvoltage Sensor

The traditional voltage divider is not appropriate for long-term overvoltage monitoring because of insulation reliability and heat loss problems that arise after long-term operations, thereby increasing the risk of accidents in the power grid. To ensure a secure power system while monitoring overvoltage, two types of overvoltage sensor are designed. One is installed at the transformer bushing tap to monitor overvoltage in substations and one is installed at the tower cross arm to monitor overvoltage on transmission lines. The installation scheme of the voltage sensors are shown in Figure 3b,d.

2.1.1. Non-Contact Transformer Bushing Tap Sensor

The capacitive bushing is represented as a pure capacitor because the power loss angle of the bushing is very low (usually less than 1%), and the value of the capacitance can be obtained through field experiment or rating plate. The circuit of the sensor is presented in Figure 3a according to this simplification, where C1 denotes the bushing capacitor, C2 represents the voltage divider capacitor, R indicates the matching impedance resistor, and PS symbolizes the overvoltage protection unit. Voltage division ratio K is shown as follows:
K = U 1 + U 2 U 2 = C 1 + C 2 C 1

2.1.2. Non-Contact Transmission Line Sensor

The non-contact overvoltage sensor uses the stray capacitance C3 between the overhead transmission line and the sensor board as a high-voltage arm capacitor [14,15,16]. A capacitor is connected as a low-voltage arm capacitor. The overvoltage signal passes through the matching resistor and is then transmitted along the coaxial cable to the data acquisition system. The divider ratio is expressed as
K ' = C 3 + C 4 C 3
where C3 is the high-voltage arm, C4 is the low-voltage arm, and k is the divider ratio. The value of C3 can be estimated by the following equation:
C 3 = 1 / 0 h d z ε ( 2 r + ( h z ) ( b 2 r ) / h ) ( a + ( l a ) / h ) ]
where r is the radius of the transmission line, l is the length of the transmission line, a is the length of the sensor plate, b is the width of the sensor plate, and h is the maximum distance between the sensor plate and the transmission line (Figure 3e). Figure 1d shows the installation of the overvoltage sensor. Figure 3f shows a hybrid operating mode of power gird with HTS cables. HTS cables and conventional transmission lines are in parallel connection to improve the stability and reliability of the power grid.

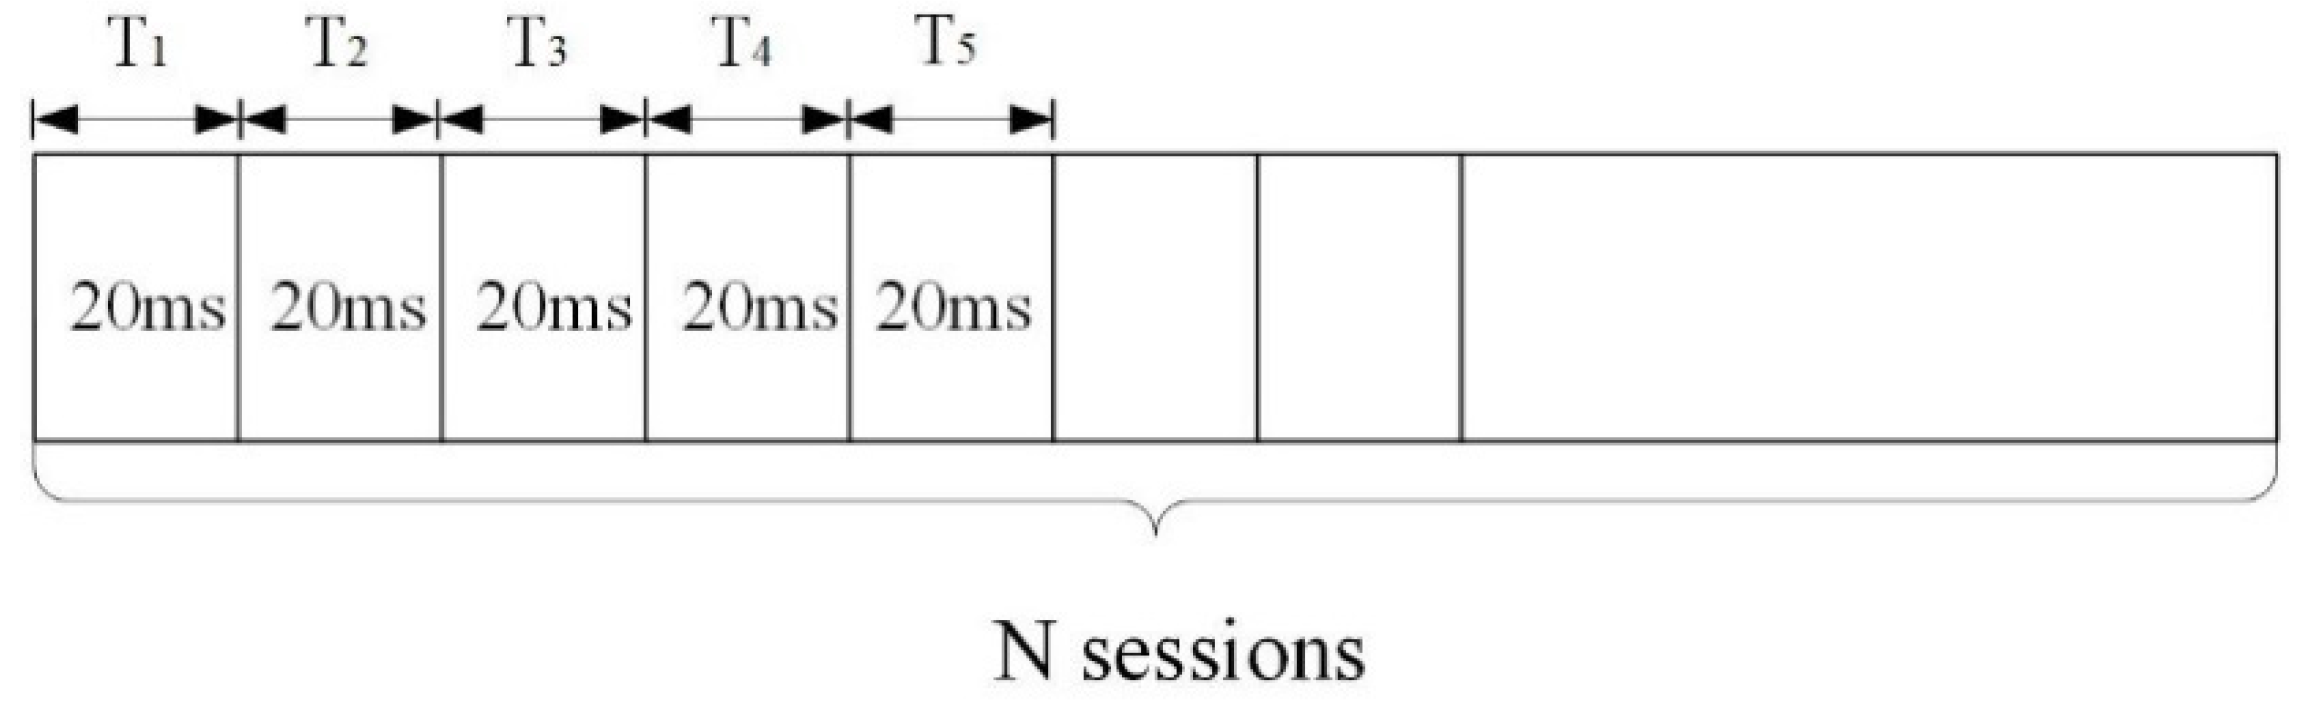
2.2. The Online Variable Sampling Frequency Monitoring System

When an overvoltage occurs, the sensor will detect the high-voltage overvoltage signals, transfer these signals to corresponding low-voltage overvoltage signals, and send them to the signal conditioning board through the coaxial cable. After conditioning and pre-triggering the signals using the board, the signals are sent to the variable sampling frequency system for sampling and storage. The system software can perform functions, such as data analysis and research.
The variable sampling speed data acquisition card employs a self-developed, three-channel data acquisition card with a 12-bit resolution on a 3×256 k×16-bit static random access memory (SRAM) buffer and maximum sampling frequency of 40 MHz. The acquisition card can acquire overvoltage waveform with different sampling rates and pre-trigger lengths. This card can also record signals from fast lightning transients to slow inner overvoltage transients. This card can record signals before the occurrence of overvoltage accidents, and the complete waveform is obtained because of the cyclic sampling design and pre-trigger function. When overvoltage occurs, the system carries out a fast sampling process with a high sampling frequency F1 (5–40 MHz) for 5–10 ms to ensure that even fast transient waveforms, such as lightning overvoltage, are recorded, and the system switches to a lower sampling frequency of F2 (50 kHz to 1 MHz) for long-term internal overvoltage capture process until the entire data acquisition course is completed. The principle of the card is indicated in Figure 4.
INSULAD2053 variable sampling speed data acquisition card is adopted in the system. The high sampling rate F1 is 5 MHz for fast transient waveforms, such as lightning overvoltage and the sampling length T1 is 15 ms. The lower sampling rate F2 is 200 kHz for long-term internal overvoltage capture process and the sampling length T2 is 935 ms. The storage capacity constraints is F1 × T1 + F2 × T2 = 262K pts.

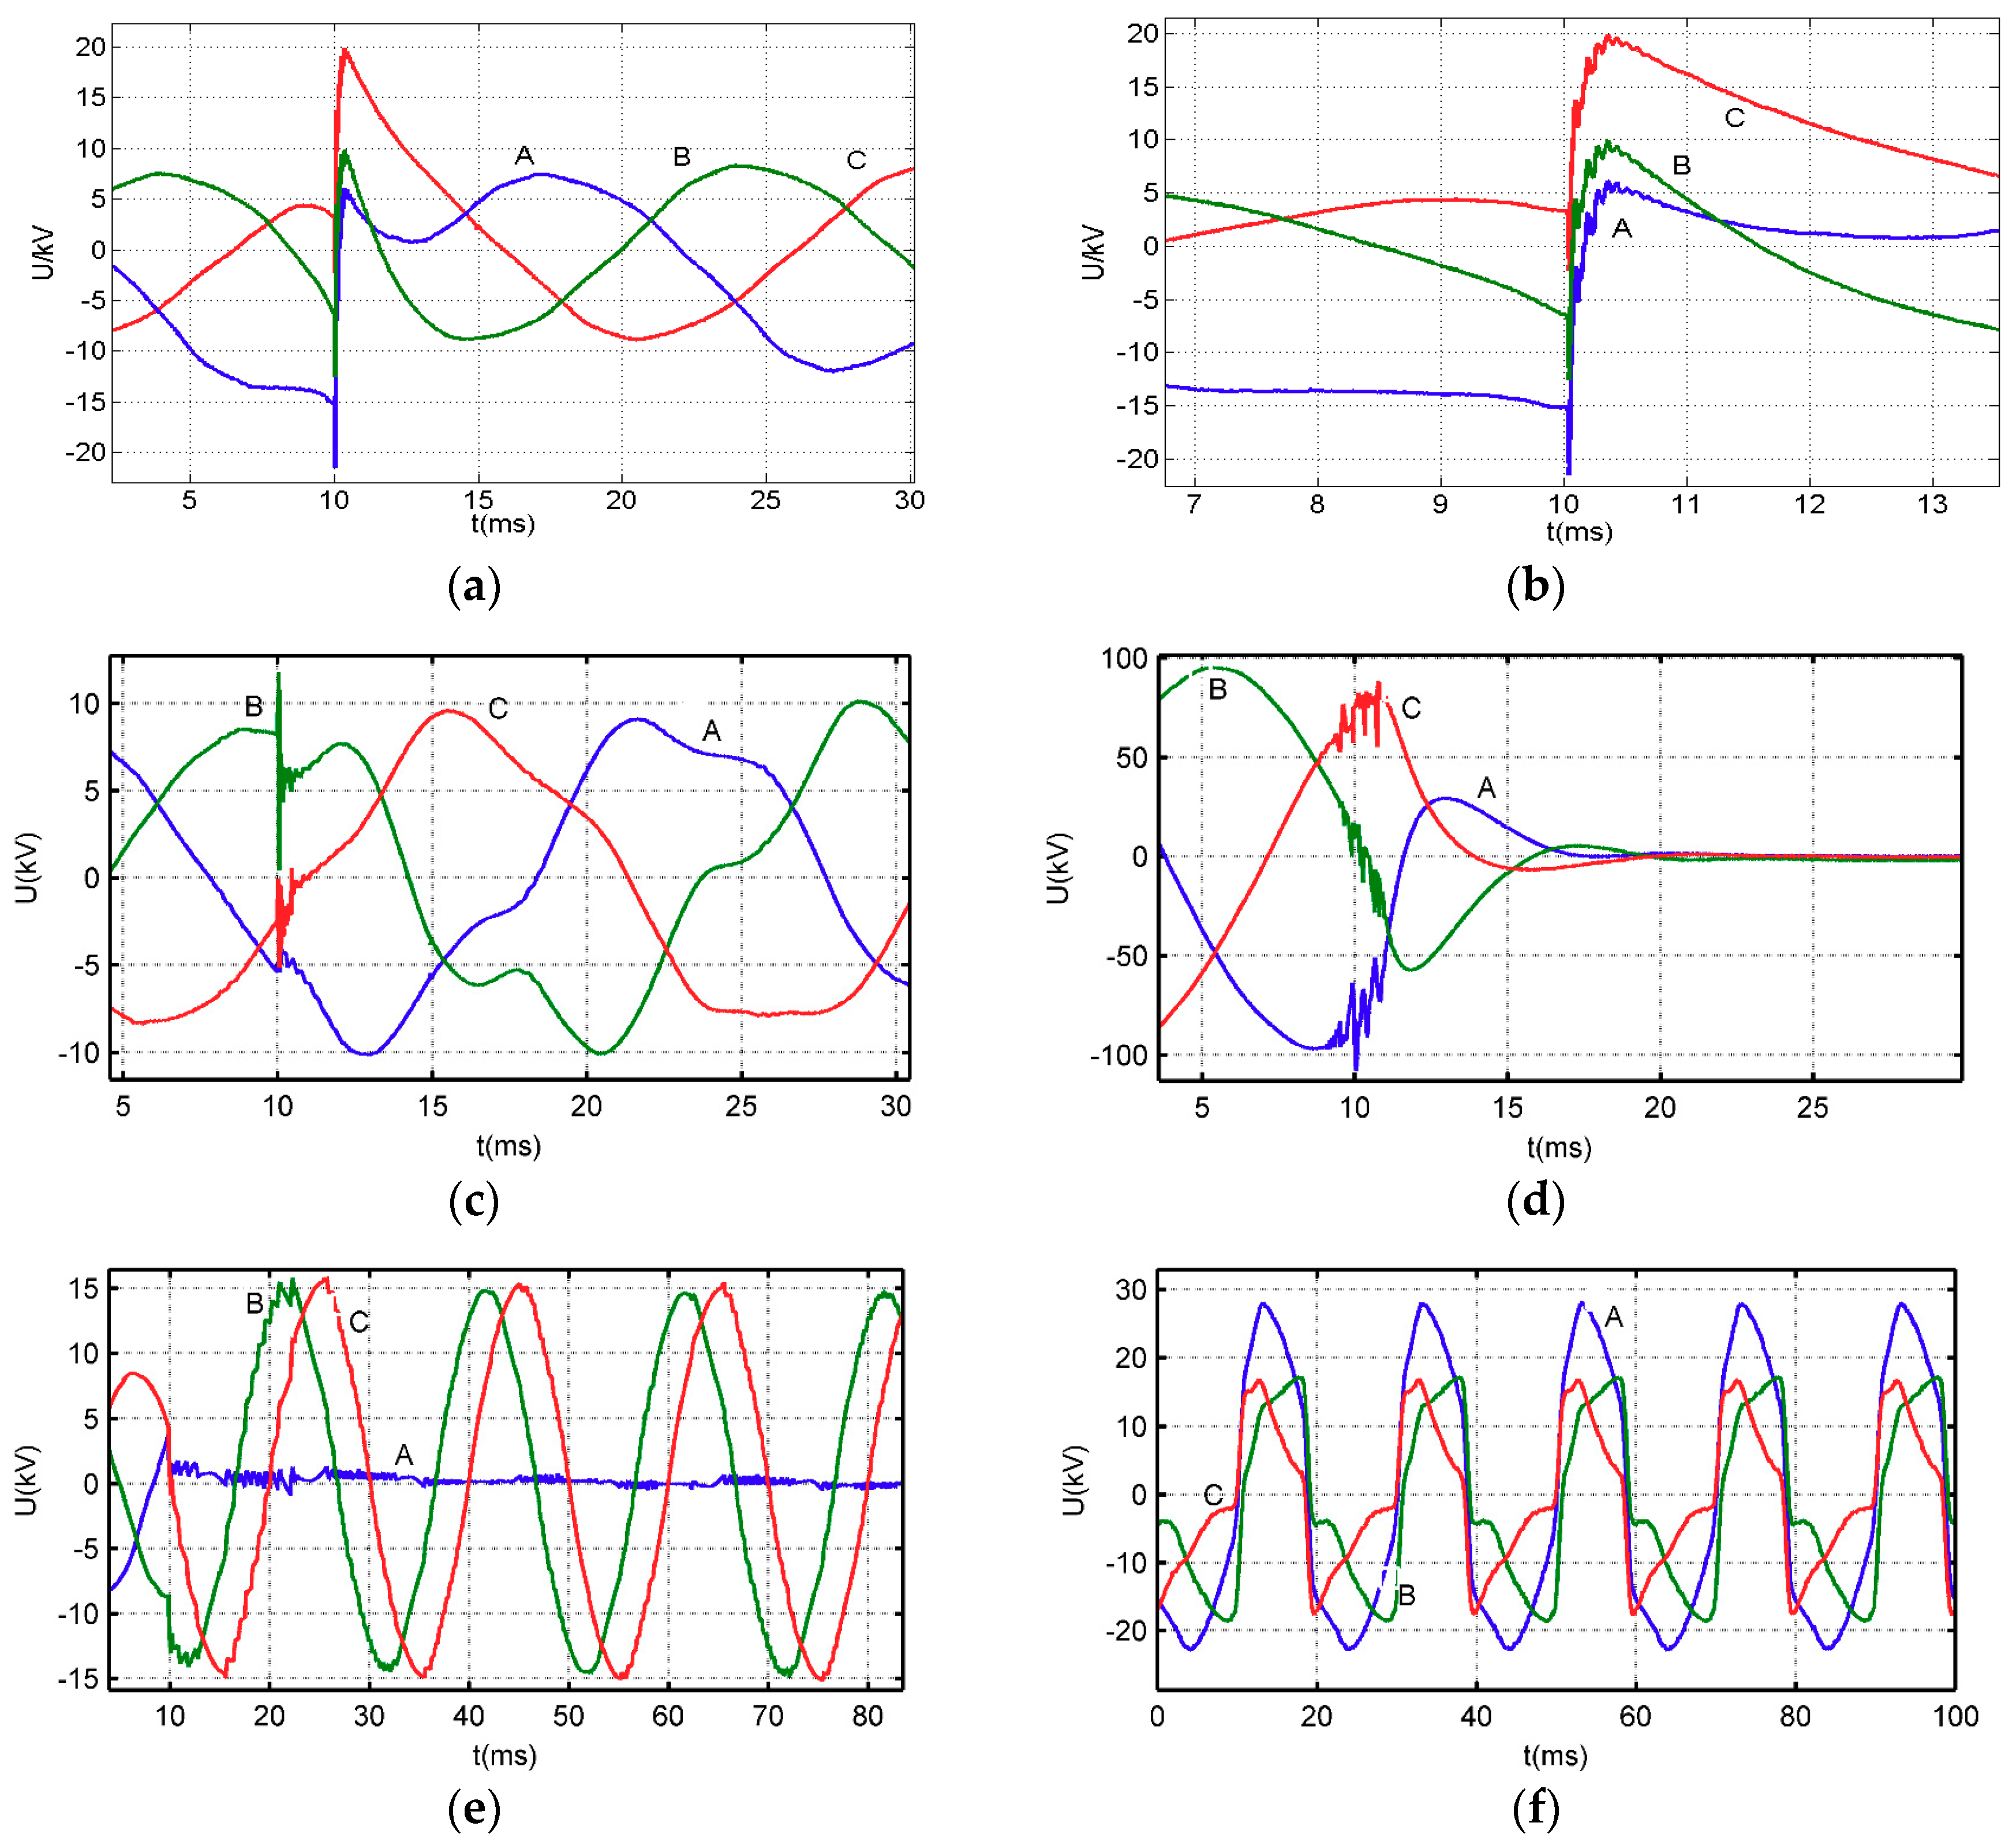
2.3. Typical Field-Captured Overvoltage Waveform

The overvoltage monitoring system has been functioning in an 110 kV substation of Chongqing, China. Figure 5 indicates some typical field-captured overvoltage waveforms:

3. Feature Extraction for Overvoltage Records

Different types of overvoltage have distinct mechanisms, development rules, and waveform characteristics. Targeted extraction of overvoltage characteristics is needed for recognition. Lightning and switching overvoltage usually exhibit a short rise and duration time. The sudden injection of a large amount of lightning charge into a power grid will result in a steep voltage increase, which contributes to the energy of the high-frequency component. Temporary overvoltage and arc grounding overvoltage usually last for several power frequency cycles. The amplitude of the temporary overvoltage changes is slower than that of lightning and switching overvoltage. Thus, the energy of the temporary overvoltage is primarily a low-frequency band. Arc grounding overvoltage contains some high-frequency oscillation components during arc resignation and some low-frequency components when the arc is extinct. Hence, the high- and low-frequency energy of arc grounding overvoltage will appear alternately. Thus, different overvoltage have different frequency components and various energy distribution features. In order to reflect the features of different kinds of overvoltage, Wavelet theory and S-transform SVD theory are adopted to extract the targeted features of overvoltage for recognition.

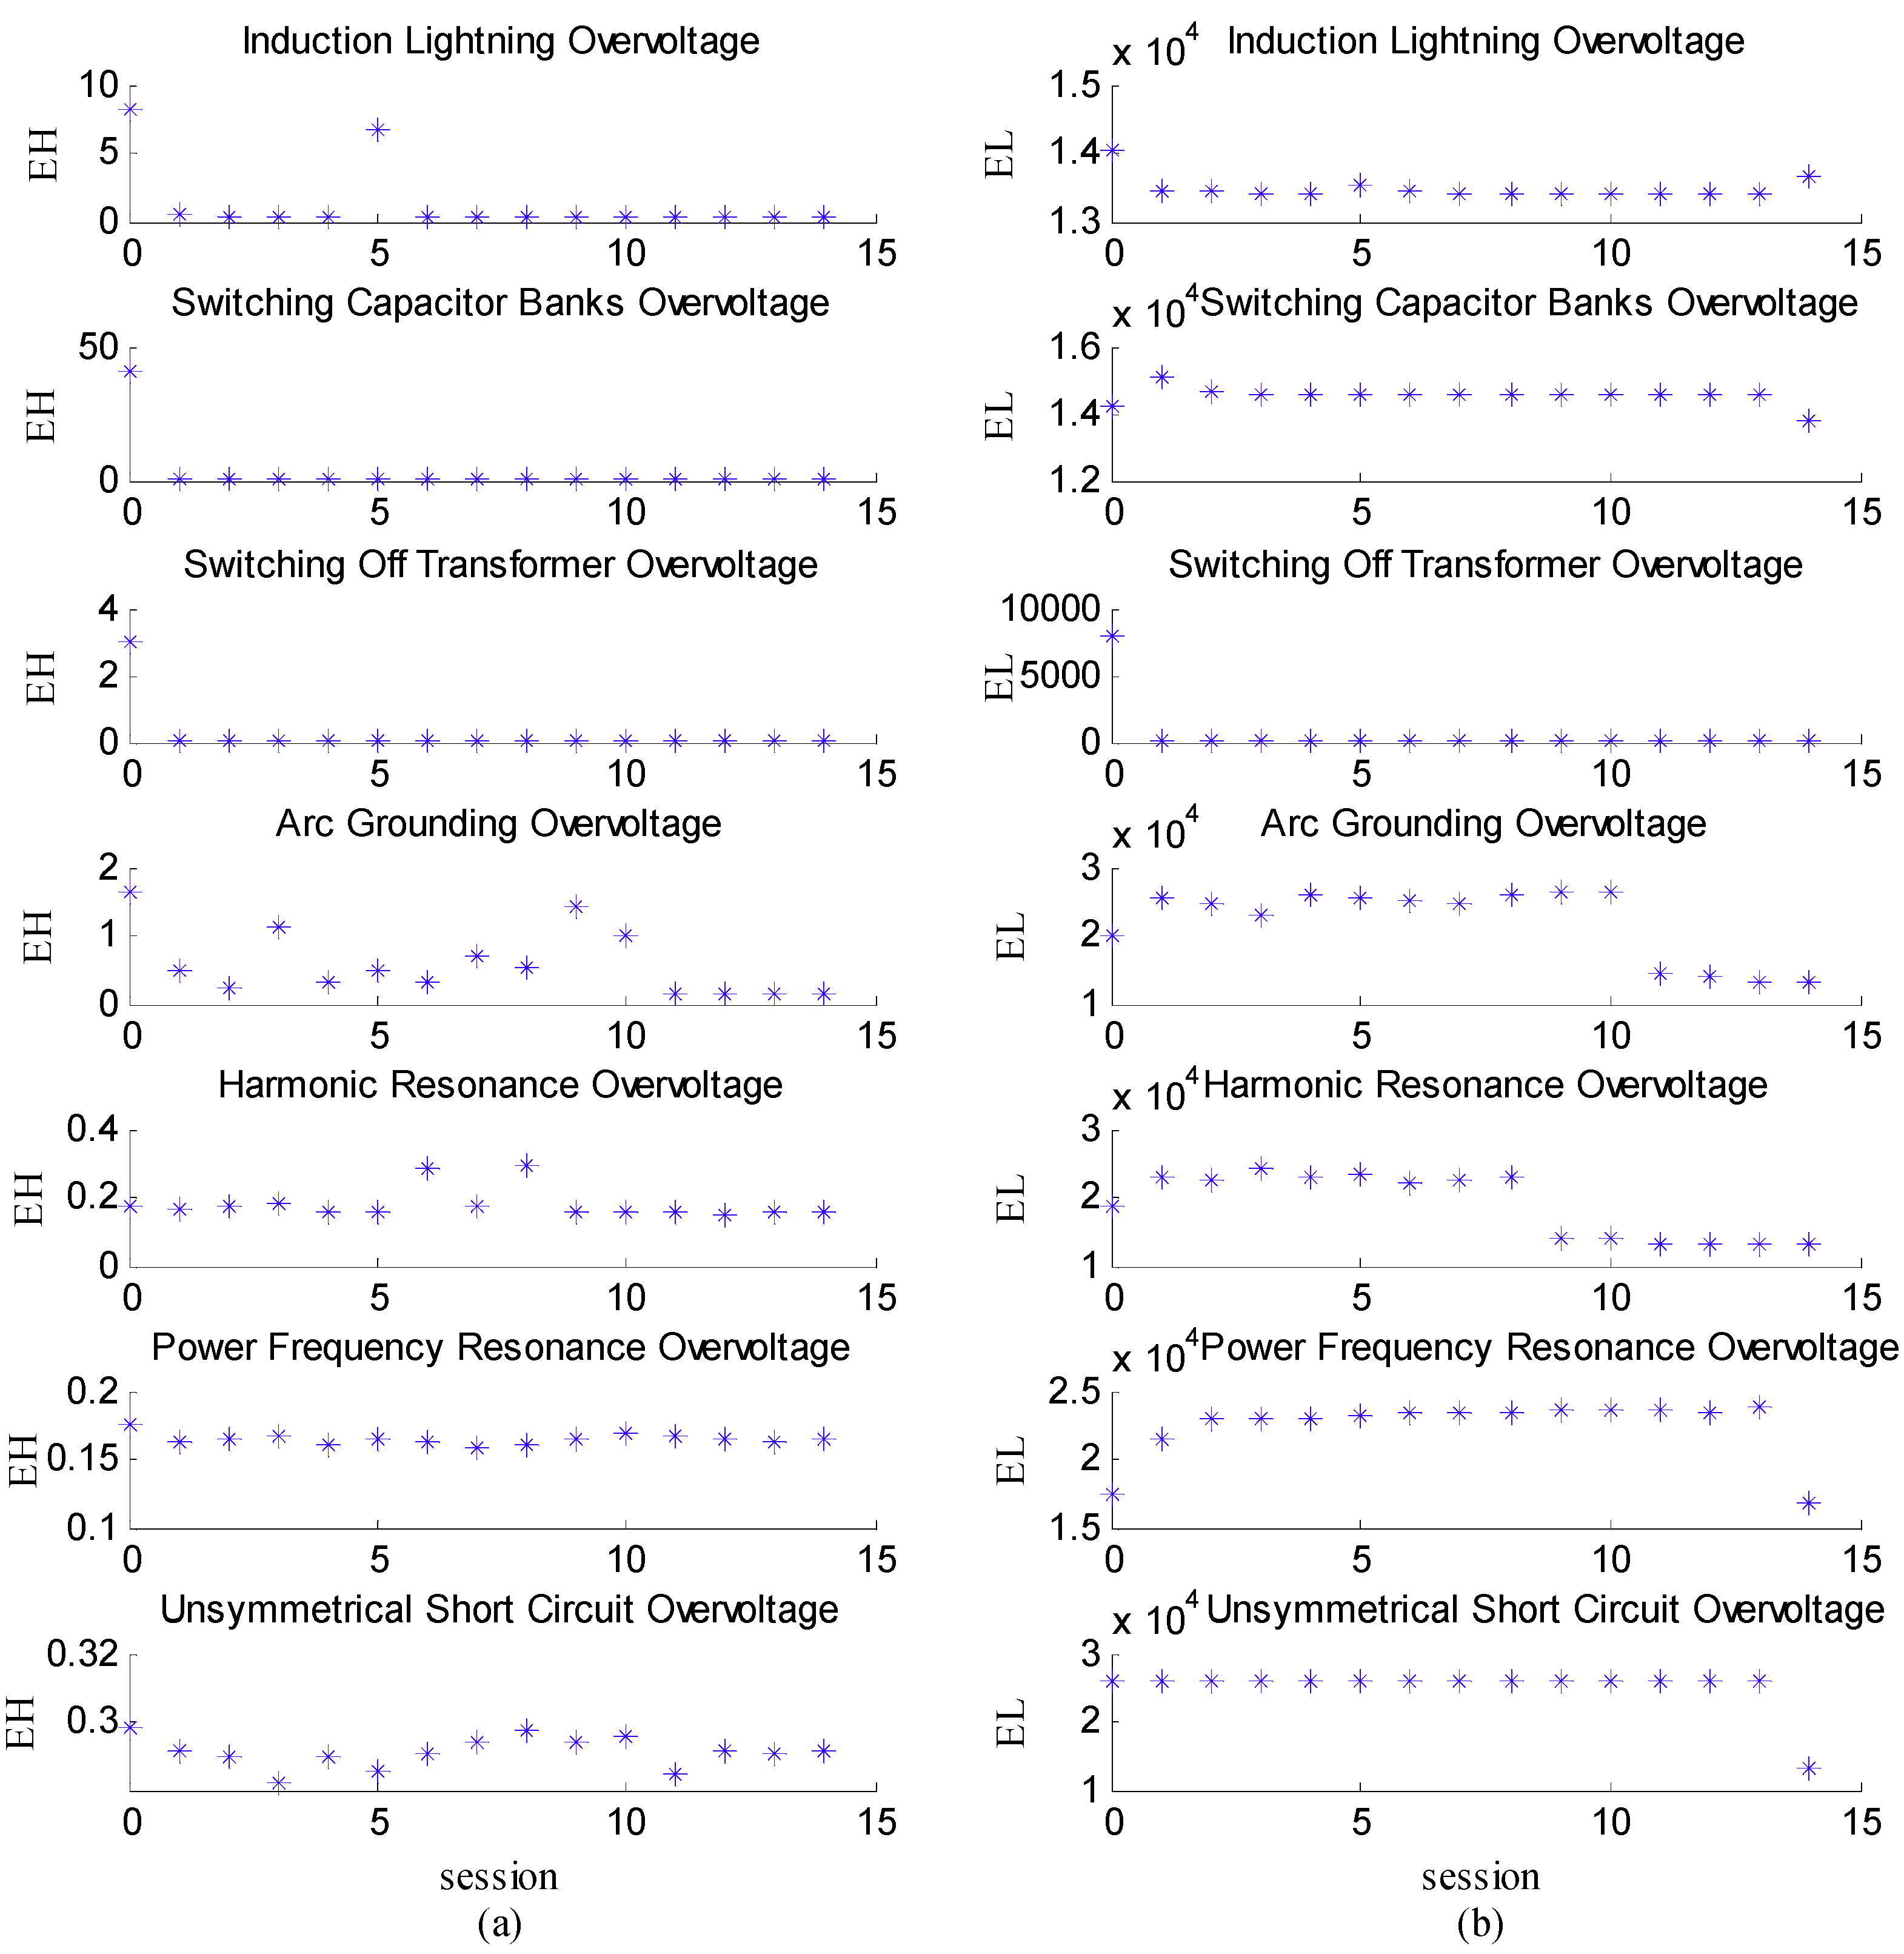
3.1. Wavelet Feature Extraction

Wavelet theory can be employed to transform the time domain signal into the linear superposition of the wavelet function class. Thus, wavelet transformation can localize both the time and frequency domains. This transformation offers a time-frequency-adjustable window to observe the local feature in both domains of the signal [17,18]. For finite energy signal f ( t ) , the continuous wavelet transform is defined as
{ W f ( a , b ) = 1 a + f ( t ) ψ * ( t b a ) d t = < f ( t ) , ψ a , b ( t ) > ψ a , b ( t ) = 1 a ψ ( t b a ) , a R + , b R
where ψ ( t ) is the mother wavelet that can be transformed to wavelet class ψ a , b ( t ) . Mother wavelet function class ψ a , b ( t ) is usually compactly supported. Discrete wavelet transform of the signal f ( t ) can be obtained through discretization of parameters a and b of the wavelet function class by using the binary function
{ a = 2 j , j Z b = 2 j n , n Z
After discretization, the signal f ( t ) is transformed into two parts: approach and detail coefficient. The former and latter coefficients represent the low- and high-frequency portions of the signal, respectively.
The Symlet wavelet used in this reconstruction is biorthogonal wavelet, which is approximately symmetric and can be applied to discrete wavelet transform. The structure of Symlet wavelet is similar to db wavelet family. The difference between them is that Symlet wavelet has better symmetry, which can reduce the phase distortion during signal analysis and reconstruction. The support range of symN wavelet is 2n-1, the vanishing moment is N, and it has good regularity. In most applications of wavelet analysis, wavelets with a support length between 5 and 9 are selected. If the support length is too long, boundary problems will arise. If the support length is too short, the vanishing moment is too low, which is not conducive to the concentration of signal energy. Sym4 wavelet is adopted with a support range of 7 and vanishing moment of 4. Therefore, sym4 wavelet function is taken as the wavelet generating function when the discrete wavelet transform is used to make a reasonable analysis of the signal. The waveform of sym4 wavelet is shown in Figure 6.
The overvoltage signal is decomposed into 15 levels through the “sym4” wavelet to observe the different frequency energy distributions of the voltage signal. The frequency band of each level at the 5 MHz sampling frequency is shown in Table 1.
The signal is divided into several segments in the time domain at a 20 ms length to investigate the energy distribution situation of different frequency components, which is shown in Figure 7.
Thus, the energy distribution of different frequency components in each normal voltage (50 Hz) period can be calculated by using the equation
E f ( i ) = T i ( U f A 2 ( k ) + U f B 2 ( k ) + U f C 2 ( k ) ) T i = 20 m s
where u f A , u f B , and u f C are the wavelet decomposition coefficients that correspond to a frequency band f of phases A, B and C, respectively. On the basis of the frequency components of overvoltage, the frequency band above 2 kHz is classified as a high-frequency band and that which is lower than 2 kHz is classified as a low-frequency band. The signal coefficients in Levels d1–d10 are superimposed to form the high-frequency part of the signal. E H ( i ) , which is the energy distribution of the high-frequency part of the signal, is calculated. In addition, the signal coefficients in Levels d11–a15 are superimposed to form the low-frequency part of the signal. E L ( i ) , which is the energy distribution of the low-frequency part of the signal, is calculated as well.
Energy distribution E t ( i ) of the signal coefficients in d11–a15 is also calculated to further analyze the energy distribution of the low-frequency part of the signal. Thus, after calculating the wavelet analysis and energy distribution series, three kinds of energy distribution series are adopted as character parameters to recognize the aforementioned overvoltages: E H ( i ) , E L ( i ) , E t ( i ) .
Figure 8 and Figure 9 present energy distribution series E H ( i ) , E L ( i ) , and E i ( i ) of different overvoltage types. Figure 8 demonstrates that the energy of d11–d15 in the short circuit is low, and only the energy of a15 increased steadily. Figure 8 also indicates that the energy of d11–d15 in the harmonic resonance remained at a significantly higher value than that in the power frequency resonance. Figure 9 indicates that both the high- and low-frequency energies in the induced lightning, switching capacitors, and switching-off idle transformer overvoltage types increased rapidly during the accidents and reduced to their normal values as overvoltage disappeared. The high- and low-frequency energy of the arc grounding overvoltage increased alternately during arc resignation. E H ( i ) and E L ( i ) are used by Classifier 1 as input feature parameters, considering the tasks of Classifiers 1, 2.1, and 3.1. The energy distribution series of d11–a15 E t ( i ) is also calculated as feature parameters for Classifier 3.1. E H ( i ) , E t ( i ) , and E L ( i ) are employed by Classifier 2.1.

3.2. S-Transform SVD Feature Extraction

Theoretically, switching and lighting overvoltage types are recognized easily using rise time and tail time. However, overvoltage occurs randomly. In addition, wave refraction and reflection, as well as attenuation, are complex. Thus, the overvoltage waveform is deformed during the transmission process. Distinguishing the switching and lightning overvoltage types by simply using these parameters is unreliable. A reliable algorithm should consider the random uncertainty of the overvoltage. An algorithm based on S-transform and partial singular value are developed to reduce the random dispersion of overvoltage signals and recognize switching and lighting overvoltage types.
S-transform is a signal processing method that aids in the inspection of signal energy distributions in the time-frequency domain [19,20,21,22]. The principle of S-transform is based on the wavelet method. Given a signal h (t), its S-transform can be calculated as
S ( τ , f ) = h ( t ) | f | 2 π e ( ( t τ ) 2 / 2 σ 2 ) e 2 j π f t d t = A ( τ , f ) e i θ ( τ , f )
where σ = 1 / f is the scale factor, A ( τ , f ) is the magnitude factor, and e i θ ( τ , f ) is the phase factor. The S-transform of a time discrete signal is a complex matrix where the row and column represent the time domain and frequency domain, respectively. As a result, the absolute value of the element in the matrix indicates the energy distribution in the time-frequency points.
Figure 10 indicates the module value of the S-transform matrix of the zero-sequence voltage signal of the induced lightning overvoltage, switching-off idle transformer overvoltage, and switching capacitors overvoltage, which is different. However, using the matrix as a parameter to recognize the overvoltage type is unnecessary and impossible considering the large dimensions of the matrix. Thus, the partial singular value is employed to abstract the characteristic parameters from the matrix, compress the dimensions of the feature parameters, and reduce the overvoltage signal dispersion. Given a matrix A m × n R m × n , two orthogonal matrices U m × n V m × n and a diagonal matrix Λ will satisfy the following equation:
{ A = U Λ V Λ = d i a g ( λ 1 λ k 0 0 ) k = r a n k ( A )
where λ i is the singular value of the matrix A A T , which meets the following criteria:
i = 1 k ( σ i λ i ) 2 A B F
| σ i λ i | A B 2 , i = 1 , 2 k
where λ i and σ i are the singular values of matrices A and B, respectively. Assuming that the energy distribution matrix of a signal is A, the energy distribution would become B once some disturbances and distortions occur in A during the transmission process. On the basis of Equation (11), the sum of the square of the singular value difference would be smaller than the spectrum radius of the matrix change, whereas Equation (12) indicates that the difference of the singular value would be less than the two-norm of the matrix difference. Equations (11) and (12) demonstrate that the singular value is an effective parameter to represent the overvoltage information when some dispersion events occur in the overvoltage transmission process.
The whole singular value of the matrix contained some redundant information, whereas partial singular value is more effective. Furthermore, the S-transform matrix of the overvoltage signal is divided into nine submatrices, each of which represented a different time and frequency band, considering the large calculation amount in obtaining singular value from high dimension matrix. The maximum singular values of these submatrices are calculated. Figure 11 presents the submatrices of the matrix.
With the use of the submatrix singular values, three parameters are constructed as follows:
{ λ = i = 1 9 λ i max P 1 = i = 1 3 λ i max i = 4 6 λ i max P 2 = i = 7 9 λ i max i = 4 6 λ i max
where λ is the sum of each submatrix, P 1 , P 2 represent the energy differences between frequency bands 1 and 2, respectively. Figure 12a shows the distribution of lighting and switching overvoltage types in the space of P 1 P 2 . The switching and lighting overvoltage types were placed differently. Figure 12b indicates the distribution of the switching overvoltage, including the switching capacitors and switching-off idle transformer overvoltage types in the space of λ P 1 .

4. PSO-SVM Overvoltage Recognition Algorithm

4.1. Particle Swarm Optimization

PSO is an optimization algorithm based on the simulation of group animal behaviors [23]. PSO simulates animal behavior to acquire the best solution. In PSO, when a group of animals moves together, each animal determines its next velocity by observing the current and previous position of another animal.
For group Z composed of m particles, each particle is assumed to be z i = ( z i 1 , , z i L ) , and the velocity of this particle is v i = ( v i 1 , , v i L ) . In the entire iteration process, the best solution for each particle and for the entire group is p i = ( p i 1 , , p i L ) and p b = ( p b 1 , , p b L ) , respectively. PSO searches for the best solution by tracing the best solution of the particle and the entire group:
v i j k + 1 = w v i j k + r 1 ( p i j z i j k ) + r 2 ( p b j z i j k ) z i d k + 1 = z i d k + v i j k + 1 }
where r 1 and r 2 are random values that are used to maintain the diversity of the group. In the iteration process, the inertial weight coefficient w is usually set as a function, which is reduced with increasing iteration numbers to ensure that the particle approaches the solution in the initial stage of iteration quickly and approaches the solution steadily without overshooting in the final process of iteration.
w = w max w max w min k max k

4.2. PSO-SVM Classifier

SVM is a supervised learning method that can be applied for classification or regression. The basic principle of SVM to build an optimal hyperplane with the maximum distance to the sample set in feature space. From this optimal hyperplane, different samples can be identified by using global optimality and largest generalization capacity. In recognizing overvoltage, the lack of sufficient and suitable training samples is a significant difficulty. However, SVM is suitable for recognizing overvoltage because it can construct the optimal hyperplane under a finite training sample condition [23,24,25,26,27]
The choice of kernel function is vital in the SVM classifier. It can replace inner product computation in a high-dimensional space and avoid complex high-dimensional computation. The performance of SVM classifier differed significantly when a different kernel function and the initial values of SVM parameters are used, such as penalty factor C and core function coefficient γ , which are also related to the recognition performance.
The radial basis function (RBF) selected as the core function of this study is as follows:
K ( x i , x ) = exp { γ | x i x | 2 } ,   γ > 0
Improper parameter values will cause the SVM algorithm to demonstrate either lack of learning or overlearning. The p1arameter value of SVM is the critical factor in improving the performance of SVM. PSO has advantages. It offers the best solution without paying much attention to the initial value settings. Additionally, the use of PSO in searching for the best value settings of SVM parameters is reasonable. Therefore, a PSO-SVM algorithm is established to improve the value set of C , γ . The calculation process of this algorithm is as follows:
(1)
The initial value of the PSO algorithm is set, and a random set of particles is produced { C , γ }.
(2)
The training samples are divided into different training groups mi.
(3)
m i is used as the training sample, and other samples are used as testing sets. Then, the recognition rate e i of the sample set m i is calculated.
(4)
The suitable value f of the SVM parameters is calculated by using the following equation:
f = 1 i = 1 X | e ¯ i | / ( X )
(5)
The values of velocity and the particles are renewed iteratively according to the suitable value f.
(6)
Whether the current values of the particles are the best values for the SVM parameters is determined. If not, Step (3) is repeated, or the final value set of SVM is output.
In this hierarchical overvoltage recognition system, the PSO-SVM was used as the classifier algorithm. A diagram of this system is shown in Figure 13. The feature parameters of each classifier are shown in Table 2.
In this structure, the overvoltage is gradually subdivided by the classifiers at different layers. The overvoltage is divided into two groups for the first recognition layer: temporary and arc grounding overvoltage or switching and lightning overvoltage. This grouping is based on the EH (i), EL (i) by Classifier 1. Arc grounding overvoltage is a switching overvoltage. However, it is classified with other long-term overvoltage types, such as resonance overvoltage and power frequency voltage rise, considering its long duration. This recognition process of arc grounding overvoltage would not influence the final recognition results of the overvoltage system. Classifiers 2.1 and 2.2 continued to subdivide the overvoltage by the classification results of Classifier 1 and the same working process for Classifiers 3.1, 3.2, and so on. The feature parameters are not calculated simultaneously but rather at the classifiers of different layers. Thus, this structured process can reduce the amount of calculation significantly because once the overvoltage type is identified at the upper-grade classifiers, the calculation of the features to recognize other overvoltage types would no longer be necessary. Different methods can be used in any classifier during the hierarchical pattern recognizing process. In addition, modifying a classifier with such structure is easy because each classifier is independent.

4.3. Recognition Results

More than 500 field-acquired overvoltage data captured by using the monitoring system are used to test the performance of the hierarchical recognition system. The types of field-acquired overvoltage data include switching-off idle transformer overvoltage, switching capacitors overvoltage, arc grounding overvoltage, asymmetric short circuit overvoltage, high-frequency ferromagnetic resonance overvoltage, fundamental ferromagnetic resonance overvoltage, and induced lightning overvoltage. All these data must be normalized based on the phase voltage before abstracting the features because these overvoltage accidents occurred at different voltage level systems. Half the overvoltage data are used as training samples, and the other half are used as testing samples. Table 3 shows the testing rate of each classifier based on a common SVM and PSO-SVM.
Radial basis function (RBF): K ( x i , x ) = exp { γ | x i x | 2 } ,   γ > 0 is chosen as the kernel function of SVM. The penalty factor C is set as 50, the core function coefficient γ is set as 0.02 and the slack variable ξ is set as 0.001.
The fitness cure of seeking for best C and γ of SVM by PSO is shown in Figure 14. The best C and γ values for the recognition are 22.16 and 0.01, respectively. The initial setting of PSO is 1.5 and 1.7, the inertial weight coefficient w is 0.9, the maximum number of iteration is 200 and the population size is 20.
In the structure of BP neural network, the node number of input layer is 6, the node number of hidden layer is 13, and the node number of output layer is 7, hence the structure of BP neural network is 6-13-7. The transfer function of the hidden layer is logsig function and the transfer function of the output layer is purelin function.
Table 3 indicates that the PSO-SVM performs better than the common SVM in each classifier. A comparison between the hierarchical system (based on PSO-SVM and SVM) and the single-layer recognition system (based on backpropagation (BP) artificial networks) is conducted to test the validity of the hierarchical recognition system based on PSO-SVM. Table 4 presents the testing recognition rates of different overvoltage types.
The hierarchical pattern recognizing system based on PSO-SVM performs better than the common SVM and single-layer BP artificial network system.

5. Conclusions

HTS cables usually adopt a hybrid operating mode. HTS cables and conventional transmission lines are in parallel connection. The power flow distribution of conventional transmission lines and HTS cables can be adjusted by means of auxiliary control equipment, in order to meet the test requirements of different operating conditions of HTS cables. However, overvoltage from parallel connected transmission lines will easily affect the HTS cable.
This paper proposes a complete and effective smart overvoltage monitoring-recognizing system based on non-contact sensors. Lightning and internal overvoltage signals are obtained by specially designed voltage sensors installed at the grounding tap of transformer bushings and the cross arm of transmission towers. A variable sampling technique is employed to solve the conflict between sampling speed and storage capacity. The monitoring system and the recognizing system are working independent of each other, and exchange the records by sharing the same database.
A new hierarchical pattern recognizing structure is proposed in the research of an overvoltage recognizing system. This structure uses different independent classifiers to subdivide different overvoltage types gradually. Different mathematical methods can be used to abstract feature parameters, and appropriate recognition ways are applied to each classifier. Seven kinds of field overvoltage are discussed and analyzed. Aiming at the main feature of each kind of overvoltage, six well designed characteristic quantities are extracted through wavelet theory and S-transform SVD theory. PSO-SVM is employed as classifiers. This recognizing system is verified by more than 500 field records. The result shows that wavelet theory and S-transform SVD theory are suitable for overvoltage feature extraction and this hierarchical pattern recognizing system can recognize and classify the overvoltage effectively and accurately.

Author Contributions

Conceptualization, L.D.; Data curation, L.D. and Y.W.; Formal analysis, J.L.; Validation, K.J.; Writing—original draft, K.J.; Writing—review & editing, K.J.

Funding

This research received no external funding.

Conflicts of Interest

The authors declare no conflict of interest.

References

  1. Weiss, J.D.; Mulder, T.; ten Kate, H.J.; van der Laan, D.C. Introduction of CORC (R) wires: Highly flexible, round high-temperature superconducting wires for magnet and power transmission applications. Supercond. Sci. Technol. 2017, 30, 1. [Google Scholar] [CrossRef]
  2. Laan, D.C.v.d.; Weiss, J.D.; Kim, C.H.; Graber, L.; Pamidi, S. Development of CORC ® cables for helium gas cooled power transmission and fault current limiting applications. Supercond. Sci. Technol. 2018, 31, 085011. [Google Scholar] [CrossRef]
  3. Wang, Y.; Zhang, M.; Grilli, F.; Zhu, Z.; Yuan, W. Study of the magnetization loss of CORC ® cables using a 3D T-A formulation. Supercond. Sci. Technol. 2019, 32, 025003. [Google Scholar] [CrossRef]
  4. Laan, D.C.v.d.; Lu, X.F.; Goodrich, L.F. Compact GdBa2Cu3O7–δ coated conductor cables for electric power transmission and magnet applications. Supercond. Sci. Technol. 2011, 24, 042001. [Google Scholar] [CrossRef]
  5. van der Laan, D.C.; McRae, D.M.; Weiss, J.D. Effect of monotonic and cyclic axial tensile stress on the performance of superconducting CORC® wires. Supercond. Sci. Technol. 2019, 32, 054004. [Google Scholar] [CrossRef]
  6. Wang, Y.; Zheng, J.; Zhu, Z.; Zhang, M.; Yuan, W. Quench behavior of high-temperature superconductor (RE)Ba2Cu3Ox CORC cable. J. Phys. D: Appl. Phys. 2019, 52, 345303. [Google Scholar] [CrossRef]
  7. Malewski, R.; Douville, J.; Lavallee, L. Measurement of switching transients in 735 kV substations and assessment of their severity for transformer insulation. IEEE Trans. Power Deliv. 1988, 3, 1380–1390. [Google Scholar] [CrossRef]
  8. Yang, Q.; Wang, J.; Chen, L.; Sima, W.X.; Xie, B. Identification Method of Back Flash Overvoltage and Shielding Failure of Transmission Lines Considering the Effect of Impulse Corona. High Volt. Eng. 2011, 37, 1149–1157. [Google Scholar]
  9. Sima, W.X.; Xie, B.; Yang, Q.; Wang, J. Identification of Lightning Over-voltage about UHV Transmission Line. High Volt. Eng. 2010, 36, 306–312. [Google Scholar]
  10. Mokryani, G.; Haghifam, M.R.; Esmaeilpoor, J. Identification of ferroresonance based on wavelet transform and artificial neural network. Eur. Trans. Electr. Power 2009, 19, 474–486. [Google Scholar] [CrossRef]
  11. Mokryani, G.; Siano, P.; Piccolo, A. Identification of ferroresonance based on S-transform and support vector machine. Simul. Model. Pract. Theory 2010, 18, 1412–1424. [Google Scholar] [CrossRef]
  12. Long, Y.; Yao, C.; Mi, Y.; Hu, D.; Yang, N.; Liao, Y. Identification of direct lightning strike faults based on mahalanobis distance and S-transform. IEEE Trans. Dielectr. Electr. Insul. 2015, 22, 2019–2030. [Google Scholar] [CrossRef]
  13. Wang, J.; Yang, Q.; Sima, W.; Yuan, T.; Zahn, M. A Smart Online Over-Voltage Monitoring and Identification System. Energies 2011, 4, 599–615. [Google Scholar] [CrossRef] [Green Version]
  14. Jiang, K.; Du, L.; Chen, H.; Yang, F.; Wang, Y. Non-Contact Measurement and Polarity Discrimination-Based Identification Method for Direct Lightning Strokes. Energies 2019, 12, 263. [Google Scholar] [CrossRef]
  15. Chen, S.; Wang, H.; Du, L.; Li, J. Research on Characteristics of Noncontact Capacitive Voltage Divider Monitoring System Under AC and Lightning Overvoltages. IEEE Trans. Appl. Supercond. 2014, 24, 1203–1205. [Google Scholar]
  16. Chen, S.; Wang, H.; Du, L.; Li, J. Research on a New Type of Overvoltages Monitoring Sensor and Decoupling Technology. IEEE Trans. Appl. Supercond. 2014, 24, 1304–1307. [Google Scholar]
  17. Guo, M.; Wu, Z. Noise Reduction for High-Accuracy Automatic Calibration of Resolver Signals via DWT-SVD Based Filter. Electronics 2019, 8, 316. [Google Scholar] [CrossRef]
  18. Yin, Z.; Wang, L.; Zhang, Y.; Gao, Y. A Novel Arc Fault Detection Method Integrated Random Forest, Improved Multi-scale Permutation Entropy and Wavelet Packet Transform. Electronics 2019, 8, 396. [Google Scholar] [CrossRef]
  19. Chilukuri, M.V.; Dash, P.K. Multiresolution S-Transform-Based Fuzzy Recognition System for Power Quality Events. IEEE Trans. Power Deliv.. 2004, 19, 323–330. [Google Scholar] [CrossRef]
  20. Rodríguez, A.; Aguado, J.A.; Martín, F.; López, J.J.; Muñoz, F.; Ruiz, J.E. Rule-based classification of power quality disturbances using S-transform. Electr. Power Syst. Res. 2012, 86, 113–121. [Google Scholar] [CrossRef]
  21. Zang, B.; Zhu, M.; Zhou, X.; Zhong, L. Application of S-Transform in ISAR Imaging. Electronics 2019, 8, 676. [Google Scholar] [CrossRef]
  22. Biswal, M.; Dash, P.K. Estimation of time-varying power quality indices with an adaptive window-based fast generalised S-transform. IET Sci. Meas. Technol. 2012, 6, 189–197. [Google Scholar] [CrossRef]
  23. Jiang, J.; Wu, Y.; Wang, H.; Lv, Y.; Qiu, L.; Yu, D. Optimization Algorithm for Multiple Phases Sectionalized Modulation Jamming Based on Particle Swarm Optimization. Electronics 2019, 8, 160. [Google Scholar] [CrossRef]
  24. Huang, J.; Hu, X.; Geng, X. An intelligent fault diagnosis method of high voltage circuit breaker based on improved EMD energy entropy and multi-class support vector machine. Electr. Power Syst. Res. 2011, 81, 400–407. [Google Scholar] [CrossRef]
  25. Liu, L.; Wang, S.; Zhao, Z. Radar Waveform Recognition Based on Time-Frequency Analysis and Artificial Bee Colony-Support Vector Machine. Electronics 2018, 7, 59. [Google Scholar] [CrossRef]
  26. Ozgonenel, O.; Yalcin, T.; Guney, I.; Kurt, U. A new classification for power quality events in distribution systems. Electr. Power Syst. Res. 2013, 95, 192–199. [Google Scholar] [CrossRef]
  27. Chothani, N.G.; Parikh, U.B.; Bhalja, B.R. New support vector machine-based digital relaying scheme for discrimination between power swing and fault. IET Gener. Transm. Distrib. 2014, 8, 17–25. [Google Scholar] [CrossRef]
Figure 1. Wiring diagram of monitoring system in the substation.
Electronics 08 01194 g001
Figure 2. Workflow of overvoltage monitoring-identification system.
Electronics 08 01194 g002
Figure 3. (a) schematic diagram of the transformer bushing sensor; (b) Installation scheme of the transformer bushing sensor; (c) schematic diagram of the transmission line sensor; (d) Installation scheme of the transmission line sensor (e) Wiring diagram of monitoring system (f) Typical wiring diagram of power gird with high-temperature superconducting (HTS) cables.
Electronics 08 01194 g003
Figure 4. The principle of variable frequency sampling speed data acquisition card.
Electronics 08 01194 g004
Figure 5. Typical field-captured overvoltage waveforms. (a) Induced lightning; (b) Detail view of induced lightning; (c) Switching capacitors; (d) Switching-off idle transformer; (e) Asymmetric short circuit; (f) High-frequency ferromagnetic resonance; (g) Fundamental ferromagnetic resonance; (h) Arc grounding.
Electronics 08 01194 g005aElectronics 08 01194 g005b
Figure 6. Typical waveform of sym4 wavelet.
Electronics 08 01194 g006
Figure 7. Computing session of the energy distribution of different overvoltage signals.
Electronics 08 01194 g007
Figure 8. Et(i) energy distribution series of different overvoltage types. (a) Asymmetrical short circuit; (b) Power frequency resonance; (c) Harmonic resonance.
Electronics 08 01194 g008
Figure 9. (a) EH(i) energy distribution series of different overvoltage; (b) EL(i) energy distribution series of different overvoltage.
Electronics 08 01194 g009
Figure 10. S-transform matrix of the zero-sequence voltage signal. (a) Lightning induced overvoltage; (b) Switching capacitor bank overvoltage; (c) Switching-off transformer overvoltage.
Electronics 08 01194 g010aElectronics 08 01194 g010b
Figure 11. Schematic diagram of the submatrix division.
Electronics 08 01194 g011
Figure 12. Distribution of overvoltage types. (a) Distribution of internal and external overvoltage types in the space of P1–P2; (b) Distribution of the two kinds of internal overvoltage in the space of λ–P1.
Electronics 08 01194 g012
Figure 13. Overvoltage hierarchical recognition system based on particle swarm optimization- support vector machine (PSO-SVM).
Electronics 08 01194 g013
Figure 14. The fitness cure of seeking for best C and γ by PSO.
Electronics 08 01194 g014
Table 1. Frequency band of each level at 5 MHz sampling speed.
Leveld1d2d3d4
Frequency Band (kHz)1.25–2.5k625–1.25k312–625156–312
Leveld5d6d7d8
Frequency Band (kHz)78–15639–7819.5–399.75–19.5
Leveld9d10d11d12
Frequency Band (kHz)4.875–9.752.44–4.8751.22–2.440.61–1.22
Leveld13d14d15a15
Frequency Band (kHz)0.305–0.610.1525–0.3050.07625–0.15250–0.07625
Table 2. Feature parameters of each classifier.
ClassifierFeature Parameters
Classifier 1EH(i), EL(i)
Classifier 2.1EH(i), EL(i), Et(i)
Classifier 2.2P1, P2
Classifier 3.1Et(i)
Classifier 3.2λ, P1
Table 3. Classification rates of each classifier.
Classifier12.1.12.1.22.23.13.2
SVM95.6%90.1%92.8%89.4%87.6%85.7%
PSO-SVM97.4%92.6%96.3%93.8%91.5%94.2%
Table 4. Final classification rates of each kind of overvoltage.
OvervoltagePSO-SVMSVMBPAN
Switching-off idle transformer96.60%90.30%84.50%
Switching capacitors94.70%89.60%83.60%
Arc grounding92.80%88.50%82.80%
Asymmetric short circuit90.40%87.20%70.70%
High-frequency ferromagnetic resonance96.20%90.80%84.30%
Fundamental ferromagnetic resonance95.30%91.40%76.60%
Induced lightning100%92.70%82.50%

