1. Introduction
Smart Homes are currently receiving attention from the IT industry. Various market forecasting organizations predict a rapid growth of these homes, and domestic and foreign companies are also launching many new services for them. Smart Homes also consider effective use of lighting, energy, and security devices, and they are connected with other smart systems such as smart city, smart education, smart key, etc. According to the “2013 Smart Home Industry Status Report” by the Korea Association of Smart Homes, the market size of the previous year (2012) was approximately 6.908 billion won, an 11.8% increase from the year before (6.161 billion won). The result of the survey targeting 156 companies associated with Smart Homes (2013) showed that they were positive about industries related to lighting, residential energy-saving devices/solutions, security imaging, and storage devices or Apps and peripherals for smart TVs [
1,
2,
3,
4]. Despite such various technological developments for Smart Homes, there are still many problems occurring at the residential houses in Republic of Korea (ROK) due to the noises generated between floors or adjacent units.
In ROK, residential noises such as inter-floor noise or environmental problems including the “right of light” are becoming a serious issue in our daily lives, causing excessive physical violence. The number of cases involving environmental disputes is rapidly increasing and the statistics show that conflicts surrounding inter-floor and other residential noises have reached almost 85% of the total neighborhood disputes (as of the second half of 2016). Conflicts in the past were mostly related to factory-emitting smoke or river or atmospheric pollutions, since 1991, however, noise-related complaints have increased constantly.
During this period, complaints against atmospheric pollutions accounted for only 6% of the total complaints, but conflicts over solar access had increased instead. The total number of formal complaints made to the “Office of National Conflict Resolution Commission” in 2000 was 71, but the number increased more than three-fold to 215 (2014), whereas the noise-related ones numbered 25 cases in 2010 and also increased to 55 in 2014. Accordingly, the mental and material damages claimed by the victims against the perpetrators also increased from approximately 11.4% to 20.2% during the same period [
5,
6,
7]. The main reason behind such an increase in the number of environmental disputes including inter-floor noise-related ones is that people have started to consider the mental damages, which they often used to take lightly, as serious physical damage that must be indemnified. For instance, Mr. A, who lives in an apartment house in Seoul, has been suffering from inter-floor noise for a year now. After hearing from the neighborhood center that it is possible to measure the noise, he contacted the center who asked about his specific situation. He replied that he was unable to sleep because of the noise occurring at dawn, sometimes until three A.M. A person from the center visited the family upstairs and asked them to keep the noise down after explaining the situation. In the meantime, the center asked Mr. A to keep a diary (prepared by the center) of noise occurrences after the mediation and send it by fax when the diary is completed to request noise measurement.
The family upstairs was quiet for the time being but soon became noisy again. Mr. A kept the diary until the last page, but he could not request noise measurement as the process takes about 24 h, and it was not easy for him to vacate his home. There are also times when his neighbor upstairs leaves their home or does not make any noise, so he could not easily set the day for the measurement. Mr. A said he was told to check the noise level (dB: unit of decibel) and see if it exceeds the limits every time he makes a complaint. Moreover, even if he attempts to check the noise level despite all the inconveniences, it will come to nothing if he cannot measure any noise while waiting for the right moment.
Among the typical microphones, a dynamic microphone was selected for this study as standard equipment. Meanwhile, the method used in the process of a receiver transforming and representing the sounds into decibels was devised by borrowing an idea from Fleming’s Right-Hand Rule. In other words, the dynamic microphone operating as a receiver allows a sound wave (vibration) to be transformed into an electric signal through diaphragm vibration and we have used Fleming’s Right-Hand Rule as a calculation formula.
Therefore, it is possible to build a more efficient smart home system by adopting a power line communication (PLC)-based digital forensic technology.
Thus, the proposed system design adopted the communications device and the Energy Storage System (ESS) on the power line, which is expected to be used for inter-floor noise forensics and as a household black box.
2. Related Research
In an attempt to reduce neighborly disputes arising from the inter-floor noises, the Ministry of Environment had set up the ‘Neighborhood Center’ under the management by Korea Environment Corporation in 2012. The center’s role was to receive the noise-related complaints, conduct investigation by actually measuring the noise level for assessment, and then try to mediate between involved parties. Despite such an effort, it was pointed out that the center was unable to function properly as they could not deal with the ever-increasing number of complaints or respond to them in an effective way [
5,
6,
7,
8].
The center has been providing counseling to the complainants face-to-face or through online or phone calls for what actions they could take or try to intervene between disputing neighbors before they seek any legal means. If this does work, they can also ask the Environmental Conflict Commission to assess the situation which involves making a judgment on the noise level measured by either side, focusing on the objectivity of the measurement or the method used. As mentioned earlier, measuring the noise level is not simple and cannot be achieved in a single attempt so that most of the victims tend to abandon any further legal pursuit and even if the noise has been measured correctly, the commission usually questions about its reliability or objectivity.
In such a case, the only other option is to seek outside professional help which can be costly compared to the free service offered by the neighborhood center. The companies or institutions specializing in noise measurement usually charge about 700,000 Korean won for their 24-h service.
Aside from its expensiveness, the cost can sometimes exceed the expected compensation: the compensation amounts were 520,000 Korean won, 663,000 Korean won, 793,000 Korean won, and 884,000 Korean won for the noises exceeding more than 5dB than legal limitations for the period of six months, one year, two years, and three years, respectively, all of which had not been quite satisfactory to the 41.9% of complainants in the past (Korea Environment Institution).
In response to such claims, the neighborhood center announced that, with the cooperation of the conflict resolution commission, their own measurement results will be used for the mediation, but the possibility of acceptance by the civil courts is uncertain. They also stressed that noise-related problems cannot be solved by simply measuring the noise levels, and that what is more important is to change or improve the life patterns of individual households so that they prioritize the counseling. Lastly, the center explained that, although people sometimes want to repeat measurement again when the results are not what they have expected, many others are waiting, so the same case cannot be dealt with again. Although the Korea Environmental Conflict Resolution Commission emphasizes residents’ mutual concessions and considerations in the residential areas, the reality is that more attentive policies are needed to reduce noise-related disputes.
This study aims to assist victims of noise problems by proposing a system that can be used to collect objective evidence, support the filing of complaints, and facilitate a faster and more simple compensation process.
In the Republic of Korea, the number of inter-floor noise-related civil complaints received by the Neighborhood Inter-Floor Noise Complaint Center affiliated with the Ministry of Environment has increased from 8795 in 2012 to 28,231 in 2018. Although this organization is actively stepping in to mediate the dispute between neighbors, they do not seem to have any clear means of solving the problem as the causality involved in the noise-related issues are mostly due to the structural problems. The psychological damage can be compensated through a civil suit finding that the noises had exceeded the usual level one can tolerate but such a process requires a long judicial procedure.
Digital forensics is a new area of security service where the relevant fact of a certain activity can be investigated and proved based on digital data by using information equipment as a medium. It is being used for criminal investigations by the national investigation authorities such as police, prosecution, etc., and its necessity is increasingly recognized in the private sectors including financial or security companies as well. For example, this technic is quite useful in collecting legal evidence, preventing internal information, or strengthening internal security of auditing. Meanwhile, digital forensics is largely performed through the process of evidence collection, analysis, and submission. This study has focused on the evidence collection process.
2.1. Measuring Principle Using Microphone Sensors
Microphones are a device that converts sound signals into electrical signals, and telephone transmitters are one type of such device. Sound or noise is measured in decibels (dB) through the microphone sensor embedded in the mobile hardware.
Figure 1 shows the measuring principle of the microphone sensor. As in
Figure 1, most Smart Phones usually have a microphone for talking at the bottom and another one at the top for shooting a picture or a video. The reason for having a separate video microphone is to maximize its serviceability and sound quality. This microphone has another function, which is to maximize the quality of sound by removing the noises. As the method of this function, the distant sound is regarded as noise and eliminated by using the time difference between the sound entering the bottom microphone and the other sound entering the top microphone.
Typically, three factors (i.e., sensitivity, frequency range, and signal conditioning) should be considered when selecting microphones for noise measurement. The sensitivity determines the voltage generated from each sound pressure level, and it is indicated in unit of mV/Pascal. For instance, the sound pressure of 1 Pascal Root Mean Square (RMS) is equivalent to the sound pressure of 94 dB, whereas 20 uPa is equivalent to 0 dB, which is generally considered to be the lowest listening level. Normally, a microphone with higher sensitivity is required when dealing with low-level noises. As for the frequency ranges, most of the microphones have the range of 20 Hz–20 KHz. Microphones with a better low-frequency response will have a larger size and cost. Lastly, signal conditioning converts the data collection device into an overall data collection system by directly linking various types of sensors (thermocouple, etc.) and signals (high-voltage signals, etc.) together. Both performance level and accuracy of data collection are influenced by the conditioning technique used.
In this study, the microphone sensors that can be used for the smart phones have been used to measure the noises and estimate directions. The noise level can be determined through three steps wherein the sounds will be entered via smart phone microphone sensors and then converted into decibels.
2.2. Research Trend for Environmental Control Systems
At the Apple WorldWide Developers Conference (WWDC) 2014, ‘Homekit’ which allowed to control Apple household products through Siri (Speech Interpretation and Recognition Interface) was introduced by Apple themselves and its upgrade version which enabled the same control with Apple Watch was presented in the same year, automating home appliances control according to the life pattern of the user [
4]. Similar technology was developed by LG electronics Korea who attempted to use a smartphone messenger for the control of their home appliances including washing machines, air conditioners, and audio/video systems [
9,
10,
11].
The Radio Frequency Identification (RFID) technology is being used widely overseas for the environmental control systems using external sensors of voice recognition to control signals. Carol Rus, et al. [
12] presented a voice-controlled smart house whereas Corcoran, et al. [
13] introduced the Universal Plug-n-Play (UPnP) to allow wireless network users to experience various types of services with their PDAs or mobile devices. This technology enables an instant voice command to be transmitted to the home server user interface so that the user is free from the local imitations without relying on pre-arranged voice control. Meanwhile, Hwang, et al. [
10] developed an RFID-based multi-user access control algorithm for the smart homes using UPnP. This algorithm monitors the access/activity of the users through the RFID tags worn by them. One of the major disadvantages of such a system was that a large number of RFID detectors had to be installed around the house. Helal, et al. [
8] & Liau, et al. [
9] proposed a wireless smart floor technology which could determine the position of residents with the pressure sensors embedded in the floor panels. Recently, Power Line Communication (PLC)-based smart environmental control systems are starting to receive attention [
14,
15,
16,
17].
2.3. Noise Measurement
The noise restriction level is 58dB for the apartments (2204) or 50dB for the multi-unit houses (2005) [
18]. However, these standards were not as realistic as the statistics pertaining to the number of noise-related disputes had shown. The noise-related issues should be studied by considering the noise-measuring methods first. Usually, the noise levels are defined by the sound pressure levels or sound (acoustic) power levels set by the KS Measurement Standards (
Table 2) [
19].
2.4. Direction Estimation Algorithm
The speed of sound (sound velocity) in the air is approximately 340 m/s so that the time required for it to move 1 cm is approximately 29 us. However, as the minimum unit of measure that can detect the sound volume changes is ‘ms’, the sound waves cannot be measured. Thus, an algorithm which estimates the direction of sound based on vector computation was used.
The computation method of the algorithm using
Table 3 is as follows: Calculate individual average values from three sound measurements taken and align them in descending order to perform a vector computation using the highest and second highest values. This allows estimation of the latitude and longitude of a noise-generating location along with its direction based on the same of the current smartphone’s location. Meanwhile,
Figure 2 describes a method of estimating the point of origin of the sound occurrence based on vector computation.
In this situation, the position of ‘User’ was set as 0 on the distance measuring plane and then the proportion value was calculated by using the highest and next highest noise values obtained from the two different locations [
20,
21]. Each proportion value can be calculated by adding those two noise values and then dividing it with the respective noise values separately. Finally, by using the proportion values of the two locations, the point of origins of the noise in question is estimated to define it as a target location for investigation.
The distance between the current position and the target location and its angle are calculated by converting them into radian values. Since one latitude and longitude degree covers approximately 111 km, their 7th (approximately 10 cm unit) and 8th (approximately 1 cm unit) values should be compared to perform an accurate calculation of an indoor position. The direction estimating algorithm using the radian values is shown in
Table 3.
2.5. Korean Regulations for the Limits and Criteria with Regard to Inter-floor Noises in Astagement and Multi-unit Houses
Table 4 is showing the regulations on the inter-floor noises: the direct noise levels are estimated based on one-minute-long equivalent sound level (Leq) and maximum sound level (Lmax) and the airborne noise levels are estimated based on a five-minute-long equivalent sound level. Nevertheless, a noise level of 5dB should be added to these restriction levels for both apartments and multi-unit houses constructed before June 30, 2005. Also, the measuring method of inter-floor noises should comply with the Measuring Standards of Business Site Noises (Official Test Standards for Noises and Vibrations) promulgated by the Minister of Environment, under Item. 2, Sec. 1, Art. 6) of the Environmental Examination and Inspection Act, which requires the measurements to be taken at more than one place for the duration of at least one hour. Regarding the equivalent sound levels of both durations (one and five minutes), the largest value should be taken in each case (Note. 3) and the noise should be considered excessive when it exceeds the Lmax more than three times in an hour.
Considering these regulations, this study proposes a measuring system with which the users will be able to collect the evidence for the noise-related issues conveniently.
2.6. Comparison with Other System
The accuracy of the apps used for noise measurement was assessed in Reference [
22]. A smartphone (iPhone) was used and 37 apps from the 62 apps searched by using the keywords associated with ‘noise measurement’ were selected. From the measurement results, 31 apps exceeded the error range of ±2 dB, which is an error range of common noise meters, whereas 18 apps exceeded the error range of ±5 dB and the average error of 13 apps was ±11 dB. It was necessary to pay special attention to most of these apps when using them as they did not seem to be completely fit for measuring noises. In Reference [
23], the accuracy of the smartphone’s noise measuring apps which can be used for the evaluation of noise generation in a working area was assessed to analyze their individual performance levels. As an experimental condition, the noise was gradually increased by 5 dB at a time within the range of 60–95 dB while using a pink noise having a frequency range of 20 kHz. The result obtained by using a total of 20 iPhone apps and Android apps showed that they had an average error of 0.07 dB when measuring noises within a particular range.
The existing study [
22,
23] had dealt with the accuracy of noise measuring apps commonly used for smartphones and found that many of them exceeded the error rate of actual noise meters or some of them produced higher accuracy only in a particular environment. Therefore, a step where the measurement values can be calibrated or compensated is required for improvements when measuring noises with a microphone sensor embedded in smartphones.
Meanwhile, research [
24] used a noise measuring method using the difference in the loudness and proposed an algorithm which enables a robot to estimate the location of the target. The mobile robot was able to generate the coordinates of a sound source with its sensor and estimated the approximate bearing of the source by finding the direction while distinguishing four experimental areas distinguished by using a sound source tracking device.
Research [
25] proposed a noise-tracking system using four microphones. By using a GCC (Generalized Cross Correlation)-PHAT (Phase Transform) method, the system calculates the difference in the sound arrival times between the microphones and the optimal location was determined by using Iterative Least Square based on the arrival time differences. The accuracy of the measurements was in centimeters after comparing the actual location and the estimated location.
Research [
26] proposed a method of locating the positions of microphone and speaker and a talker in an ad hoc network. A performance evaluation was carried out by assuming a situation where a participant sets his/her laptop computer on a conference table to communicate with others through the built-in microphone set. In this case, the distance error was 22 cm between the actual and estimated positions of the microphone.
Research [
27] proposed a method of determining the locations of microphone and sound source based on the difference in arrival times. The arrival times were calculated by arranging the flat-type microphone array in a grid form often referred to as a ‘unit cube’ to estimate locations.
Research [
28] proposed an algorithm which allows a mobile robot to track the position of a sound source by using three microphones. The angles of the sound entering into each microphone were measured for the estimation purpose. This method exhibited 3–10% higher accuracy than the existing Threshold-based method. There were many instances of performing performance evaluations in a limited environment in the existing research [
24,
25,
26,
27,
28] as it estimated the direction by using specialized equipment such as microphone array, etc. However, such a method has a problem when applying it to an actual household, so that another method which can be conveniently used at home with the common smartphones is often used. Thus, this study proposes a power line communication (PLC)-based solution where noises are measured through the microphone sensor replacing CCTV to estimate and record/save the direction of the sound source and sound level (dB) as evidence.
3. Digital Forensics System using PLC for Inter-Floor Noise Measurement: Focusing on PLC-based Android Solution Replacing CCTV Solution
The dispute over inter-floor noises in apartments or residential buildings has become a serious problem, often leading to a civil suit or even a criminal case. In most cases, disputing parties are civilians who attempt to collect evidence when arguing with their neighbors or settling a civil suit. It seems that there are not any effective solutions for this problem currently but some of the modern technologies may be useful in producing evidential materials such as noise measurements or a video including a scene causing a noise. This study focuses on digital forensics as a means of producing concrete evidence, explaining the causality of noise-occurring events, or analyzing the factors or elements involved in the dispute. A number of IT or ICT technologies are being used for digital forensics along with other sophisticated analysis tools to guarantee the reliability of the collected evidence. However, due to the technological/technical complexity, digital forensic work is often performed by the firms specializing in it, which can be quite costly. This study aims to find an effective and efficient way of collecting evidence based on digital forensic technology and attempts to construct an analytical model with which the victims of noise can measure the noise level by themselves directly on the spot. The system design developed with Java/Android was made as simple and convenient as some of the recording/measuring devices available on the market, such as a vehicle black box, for example.
3.1. Structure of the Proposed System: Digital Forensics System Using PLC for Inter-Floor Noise Measurement
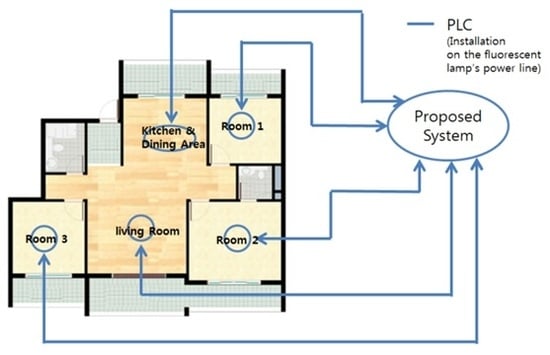
The system flow chart of the system developed with OPNET is shown in
Figure 3: a single main PLC system is installed in each building whereas every household is equipped with the proposed system. The PLC system is connected to the lamp’s power line along with the microphone sensor. To collect more accurate measurements and for easier management, the interior space should be partitioned and apply the same installation method to each space after assigning individual IDs to them [
29,
30,
31]. Those Ids are shown in
Table 5.
The entire system is shown in
Figure 4. Such a system is scheduled to be installed in each of the seven homes in a smart home-type four-story multi-unit villa for testing. The villa will be equipped with a solar ESS, home server, and other basic smart home systems adopting a smart grid technology.
Figure 5 is describing the three individual stages of the proposed system: the physical stage includes microphone sensor and PLC system whose function is to collect the inter-floor noise data to maintain the home IoT system in an optimal state. The middle stage includes the sensor manager which controls the installed sensor and other relevant equipment mentioned in the first stage. The third stage contains the applications which support noise measuring and data storing functions. In this stage, texts and images are used to indicate the noise levels whereas a graph represents them as a recording service.
3.2. The Algorithm Used for Measuring Inter-Floor Noises and Collecting Evidence: Application Stage
The algorithm specifically developed for the purpose of measuring inter-floor noises and collecting evidence is shown in
Figure 6 where the reference value for the measurement has been set in dB first following government regulation. Then, the measurements taken at the site go through the filtering process to produce proposer noise data which will be subjected to a comparison with the reference value. The noise measuring process is repeated three times to guarantee reliability and if the measurement value is lower than the reference value, they will not be saved in the database. Such a process should be repeated three times or more.
The filtering process is described in
Figure 7 where the noise collected by the microphone sensor is converted into an electric signal and then into a dB unit indicating its loudness. In this case, the dB value is calculated by multiplying 20 by the common logarithm value calculated against the ratio between reference loudness and measured loudness which are being respectively designated as A and B in the picture. The values change depending on the logarithmic function.
The noise measuring system model proposed in this study is shown
Figure 8. The model was implemented with Java Android along with the UML. After initiating the system process, the time and date will be checked from Main Class. The reference value is set together this point and will be delivered to Input Class for storage, followed by noise measuring and recording through the microphone using the recorder function. The noise data being recorded is then passed to Noise Recorder Class amplifies the noise by using get Noise Level function and Filtering Class in Filtering Class receives the data and improves the quality of noise with its EMA filter (i.e., removing statics and amplifying the sound). Finally, Calculate Class generates the noise value in dB based on the ‘converted amplitude value’ presented by the calculator function, which indicates the loudness. This process is repeated three times or more to increase the reliability of the calculation.
4. Performance Evaluation
It runs on a smartphone to set the reference value based on user input (an integer value) and allow the time and date data to be checked automatically. After the user confirms his/her reference value with the Toast function, he/she will be able to initiate the noise measuring process by clicking ‘Start Measuring’ box.
The screen on the left is showing the noises which did not exceed the reference value, indicating them with green bars whereas the screen on the right side is showing the noises which had exceeded the reference value, representing them with red bars. These results are then transmitted to the SD card for storage. The user can instantly and continuously check all the evaluation results just by looking into the contents saved the card.
To evaluate the noise measurement performance of the proposed system in this study, an experiment was conducted for the sound sources identical to actual noises.
4.1. Noise Measurement Experiment and Analysis
A total of 35 free test sound sources consisting of 22 domestic noises (9 types) and 13 other noises (7 types) were used as sound sources. These are distributed at MC2Method [
32]. The types of sound sources are shown in
Table 6. For the experiment, these sound sources were played by the computer in the lab and measured under the condition wherein the speaker, three Smart Phones, and the noise measuring apparatus had been equally spaced 50 cm apart. The noise measuring apparatus [
33] used for the experiment was one that conformed to the Korean Industrial Standard (KS Standard), whereas the apps that had received more than 4.5 out of 5 in assessment points at the Android Google Market were selected as the noise measuring system [
34] and sound level meter/noise detector [
35].
Assuming that the measurement value of the noise measuring apparatus [
33] had 100% accuracy (valuation criteria), the size of error between the criteria and each app was compared. It is possible to consider the accuracy to be high if the resulting measurements are identical.
Figure 9,
Figure 10 and
Figure 11 show the results obtained from the measuring method proposed in this study using noise measuring apparatus [
33], noise measuring apps [
34], and db sound level meter/noise detectors [
35] to evaluate the measuring performances.
Figure 9 shows the graph that displays the noise measurement results obtained from the proposed system together with the measurement values presented in Reference [
33]. After measuring 35 test sound sources, all of the measurements except six were identical to the criteria, suggesting that the proposed system had an accuracy of about 82.8%. Moreover, the same system recorded a margin of error of less than ±3 dB, which is the general margin of error of a common noise measuring apparatus.
Figure 10 shows the noise measurement results from References [
33,
34]. At least 5 out of 35 measurements were identical to the criteria, thus having an accuracy of about 14.2%. Especially, Reference [
34] exhibited a margin of error exceeding the normal range of ±5 dB of a common noise measuring apparatus.
Figure 11 shows the measurements from References [
33,
35]. After measuring 35 test sound sources, there were no measurement values equivalent to the criteria (0% accuracy). There were some difficulties in measuring the actual noises as Reference [
35] presented some irregular deviations compared to Reference [
33]. Thus, the proposed system had the highest accuracy with approximately 83%.
4.2. Direction Estimation Experiment and Analysis
To evaluate the performance of direction estimation, diameters of 1–5 m in the lab were first set for the experiment. Next, a direction that was to be the base direction and ten other directions with different angles were selected to find the original direction of the sound source by using the proposed system.
Table 7 shows the results (accuracy) from this experiment.
The results showed that the mean value of the absolute error was the smallest (4.2°) when the distance between the user and the noise was 3 m, compared to 7.4° at 5 m and 12.2° at 1 m. The large mean error and the resulting low accuracy at 1 m were deemed attributable to the too-close measuring distance.
Reference [
30] explained that there was an error of 2–3 degrees when estimating the angles by using a microphone array and a mobile robot, and this research confirmed that the proposed method had the same performance level of direction estimation on the Android platforms.
The performance evaluation was carried out ahead of practical application, and the results revealed that the system had operated in a flexible way under the experimental environment. When comparing with the existing commercial noise measuring apps that provide simple real-time measurement or single measurement, the proposed system performs the measurement at least three times to increase the accuracy and has a function of estimating the origin of the noise based on them so that more accurate information can be provided to the user.
5. Conclusions and Future Work
Finding a proper and effective solution for the noise-related disputes between the residents living in an apartment or multi-unit house has been a difficult task for the government or judicial officers as there was not any reliable noise-measuring method available. Specifically, the pieces of equipment for collecting evidence (noises in this case) are too expensive, and the clients have to vacate their homes while measurements are taken.
While so many elements are complexly involved in the problems related to inter-floor noises, it is very difficult to conduct direct on-site analysis or construct analytical models that many rely on the paid services provided by private companies or organizations. Thus, we proposed a system that the clients can use for conveniently measuring inter-floor noises by installing the PLC system on the power line of a household fluorescent lamp. The PLC technology used in this study was described in detail in a previous study [
15,
16,
17].
The proposed system is easy to handle as the language and modeling standards used for implementing the system are universal (Java Android & UML). Commercialization of this system is expected following the completion of patent registration. Meanwhile, the Digital Forensics System device can interact with users via diverse IoT sensors. Thus, the system that this paper deals with is set up in such a way that floor noise information is intelligently collected and utilized as evidence in the event of a serious issue in order to enable more effective interaction with the user. The system blocks power when the noise level does not meet the criteria but allows power when the noise reaches a certain level. Perhaps if a house is not equipped with Internet access, its lighting system will have some kind of “miniature” online access system.
The proposed system is scalable, and we were able to confirm that it works flexibly in the experimental environment. It provides application services through the server and the Database connected in the PLC network where a multiple number of microphone sensors collect noise data for later processing, which can be valuable in noise-related civil complaints. This system design is expected to be used widely in the field of digital forensics for noise-oriented conflicts or crimes as simply as the vehicle-mounted black boxes.
Compared with the existing commercial noise measuring apps that provide simple real-time measurement or single measurement, the proposed system performs the measurement at least 3 times to increase the accuracy and has a function of estimating the origin of the noise based on them so that more accurate information can be provided to the user.
The proposed system also exhibited accuracy of approximately 83% under a testing environment wherein other noise-measuring apps were involved. This was the highest level of accuracy compared with References [
34,
35]. The result of the direction estimation experiment has shown a mean margin of error of 4.2° at a distance of 3 m from the origin of the noise, confirming that the proposed system will be able to provide relatively accurate direction estimation performance on the mobile platforms and suggesting its usefulness under the household environment wherein the height of an individual home is about 2.5 m on average.
6. Discussion
Since 2005, the analysis methods for the multimedia voice evidence, especially the file-type voice evidence expressed with the binary system, have been quite limited and not systematized so that a systematized evidence evaluation method is required for a quick response. Although the human voice is often used in crimes using phones due to its anonymity, there is an identifier called ‘voiceprint’ which can distinguish/identify people and it is being used widely for the criminal cases. The voiceprint is also considered as a meaningful identifier in the field of biometrics along with fingerprint and DNA [
36,
37,
38,
39].
Thus, this study presented a digital forensics system which allows for collecting evidence to be used at the Korean court, which should be legal and free from forgery to guarantee the integrity of data. The system automatically records the noises exceeding the noise threshold (criterion) set in advance and the recorded data cannot be forged or falsified. The technological details of this part have been excluded unavoidably as they are being included in a patent pending approval. There have been many neighborhood disputes over inter-floor noises in our country in almost every apartment or multi-unit house leading to a serious confrontation or even lethal retaliation involving murder. For this reason, the police are researching an efficient and legal method which allows them to collect evidence at a residence to which one or more noise-related complaints have been reported. The goal and motivation of the study are to monitor and collect legal evidence for a very malicious and persistent act of noise generation rather than a simple form of inter-floor noise often generated by the children’s activities.
Currently, the noise criterion which can be a basis for claiming compensation is an average of 40 dB for a minute’s measurement during the daytime and an average of 35 dB for the same period during the nighttime. It is necessary for the victim to send and keep the contents-certified letter asking the person generating the noises to refrain from making them. Additionally, the medical certificate issued by a psychiatrist is mostly used as direct evidence of damage.


