Article

A Tilt Sensor Node Embedding a Data-Fusion Algorithm for Vibration-Based SHM

1
Advanced Research Center on Electronic Systems “Ercole De Castro” (ARCES), University of Bologna, Via V. Toffano 2/2, 40125 Bologna, Italy
2
Department of Electrical, Electronic and Information Engineering, University of Bologna, 40123 Bologna, Italy
3
Department of Civil, Chemical, Environmental and Materials Engineering, University of Bologna, 40123 Bologna, Italy
*
Author to whom correspondence should be addressed.
Electronics 2019, 8(1), 45; https://doi.org/10.3390/electronics8010045
Submission received: 30 November 2018 / Revised: 27 December 2018 / Accepted: 29 December 2018 / Published: 1 January 2019
(This article belongs to the Special Issue Signal Processing and Analysis of Electrical Circuit)

Abstract

:
This work describes a miniaturized sensor network based on low-power, light-weight and small footprint microelectromechanical (MEMS) sensor nodes capable to simultaneously measure tri-axial accelerations and tri-axial angular velocities. A real-time data fusion algorithm based on complementary filters is applied to extract tilt angles. The resulting device is designed to show competitive performance over the whole frequency range of the inertial units. Besides the capability to provide accurate measurements both in static and dynamic conditions, an optimization process has been designed to efficiently make the fusion procedure running on-sensor. An experimental campaign conducted on a pinned-pinned steel beam equipped with a network comprising several sensor nodes was used to evaluate the reliability of the developed architecture. Performance metrics revealed a satisfactory agreement to the physical model, thus making the network suitable for real-time tilt monitoring scenarios.

1. Introduction

The deployment of vibration-based Structural Health Monitoring (SHM) systems involves a plurality of requirements to be satisfied. Technology non-invasiveness, real-time analysis capability, and compatibility with long-term installation can be listed among them [1,2,3]. The ability to continuously provide up-to-date information about current structural health conditions requires dedicated hardware and software resources. In time, these can be combined to obtain wide-area sensor networks embedding local data processing functionality.
The goal of providing early anomaly detection and damage localization is pivotal in SHM [4,5,6,7,8,9]. Compactness and reduced power consumption make microelectromechanical (MEMS) sensors suitable for structural monitoring; also, they can be directly deployed on-structure, all the while allowing for low-cost frameworks and extending electronics life cycle. Accelerometers are particularly suited to capture linear accelerations: despite this, damage metrics applied to data acquired in the proximity of unfavorable locations fail in properly detecting anomalies, primarily due to a reduced Signal to Noise Ratio (SNR) [10].
Recent trends in electronics highlighted the possibility to combine MEMS technology with multi-degree-of-freedom measurement units. As such, monitoring schemes are moving towards redundant but more accurate and reliable configurations, capable to gather both static and dynamic features. Tailoring this necessity to civil and industrial applications, the concurrent usage of accelerometers and gyroscopes provides a set of complementary quantities which can compensate for each other. Experimental validations of this integrated strategy have been conducted for high-rise buildings [11], showing that the joined exploitation of acceleration and tilt sensors yields a more precise understanding of the structural deformation at higher frequencies. Similarly, coupled linear and rotational measurements have shown to have superior performance in monitoring wind induced vibrations in tall infrastructures [12,13,14,15]. Furthermore, diagnosis systems for bridge monitoring purposes have been implemented through sensor networks comprising gyroscopes and PCB accelerometers [10,16] showing superior performance in damage localization.
At the same time, current monitoring solutions embrace the idea to provide devices with embedded data fusion algorithms, that is, each sensor node combines multiple sensor signals to reduce the uncertainty of single-source sensing architectures. Among the possible techniques, which may include Kalman [17,18,19,20] or particle filtering [21,22], Complementary Filters (CF) based on the simultaneous adoption of low-pass and high-pass filtering demonstrated to be extremely effective. In fact, being the CF overall transfer function constant over the whole spectrum [23,24,25,26], their design combines well with wide-band sensing strategies. Similar studies are usually based on processing procedures computed off the sensor node, however, to provide real-time embedded signal processing capabilities, especially while chasing rapid phenomena, fully tunable filter chains which do not strongly impinge on the computational effort should be considered.
Consistently with the aforementioned scenarios, the presented work describes a monitoring system based on small footprint, low-power and light-weight MEMS sensors which can be interchangeably used as accelerometers, gyroscopes, or tilt nodes thanks to an embedded data fusion algorithm. Specific attention was given to the software implementation of the CF technique, essential to extract tilt information directly on the node by means of a low-complexity algorithmic scheme. As a result, the sensor-near electronic design strategy could be adopted. The deriving versatility, scalability and computational efficiency allow to optimally shape the network in relation to each specific monitoring application.
The paper is organized as follows. Section 2 is firstly dedicated to the architectural description of the monitoring system, in which the sensor nodes represent the hardware core blocks dedicated to acquisition tasks. The sensor node schematic diagram and the relative prototype are detailed, highlighting the properties of the digital gyroscope, whose exploitation represents the core of the work. The data fusion algorithm is then introduced, including the calibration steps chosen to set the parameters of the digital filters. Section 3 shows that an Overlap-Add (OLA) processing method provides highly accurate measurements in static conditions. Moreover, in the same Section, a test-bench is introduced to evaluate the validity of the proposed system for modal analysis purposes, comparing the extracted frequencies of vibration to the theoretical predictions. Finally, conclusions will be drawn in Section 4.

2. Materials and Methods
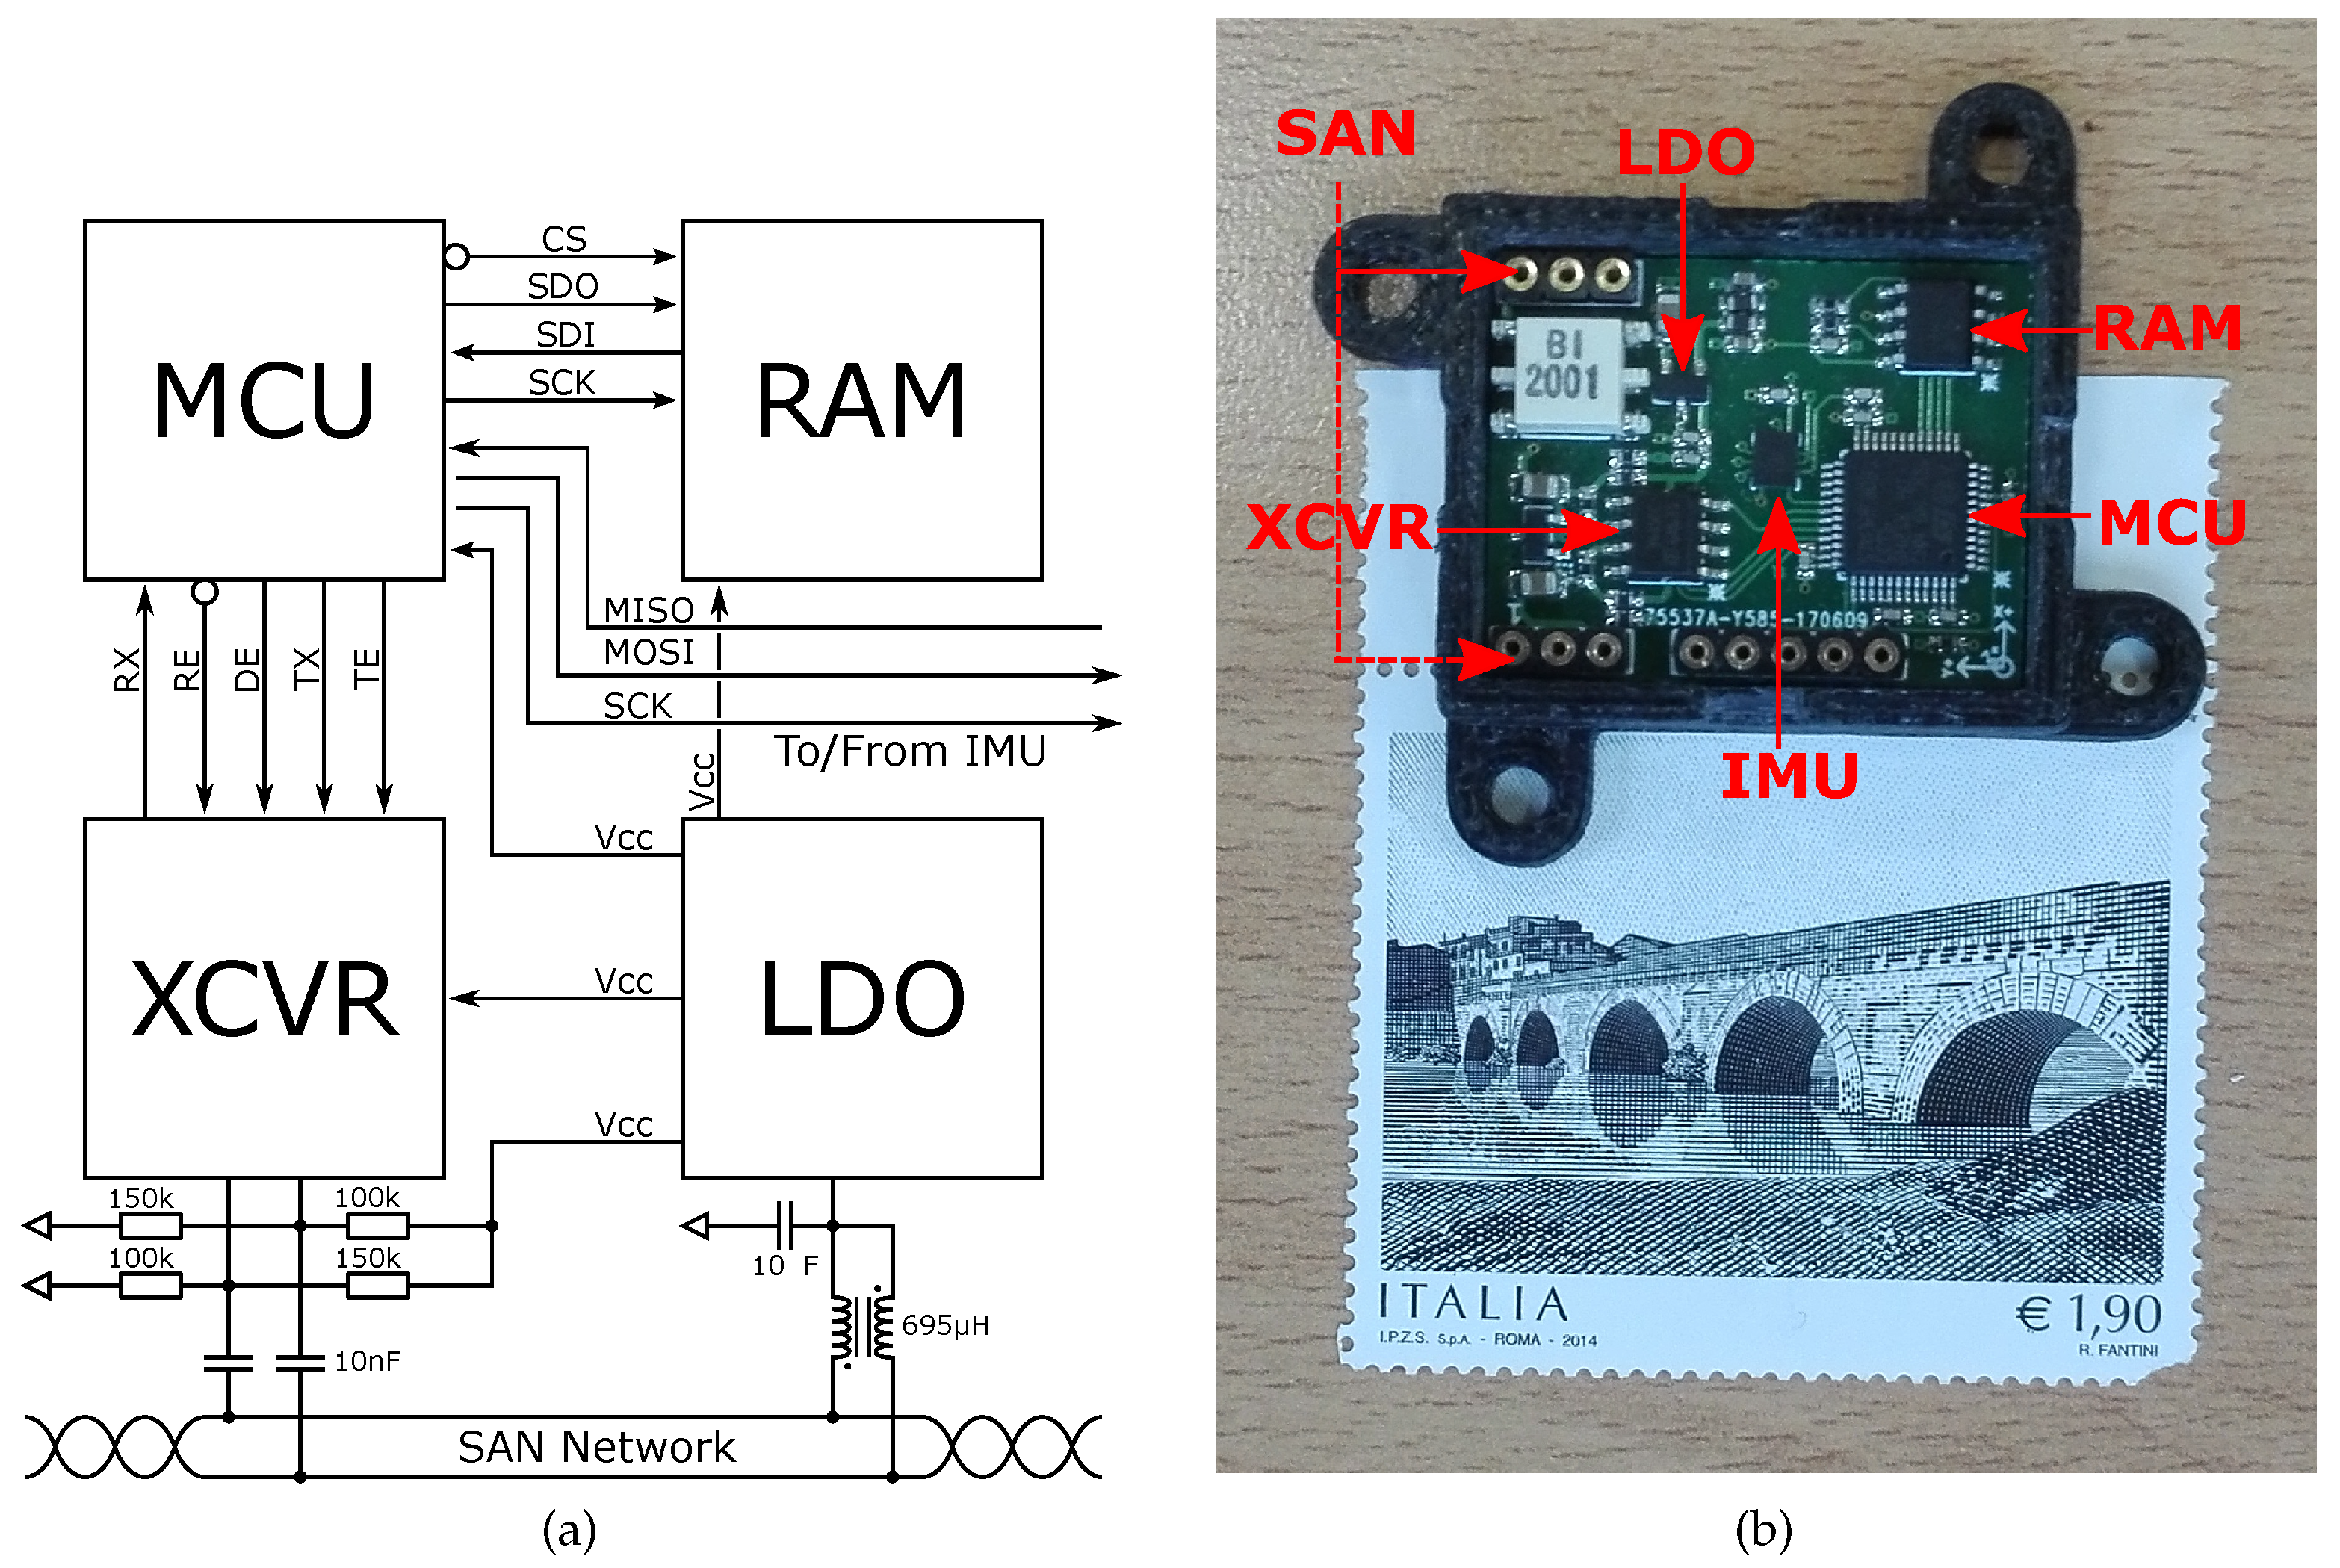
2.1. Sensor Node

The developed sensor node characteristics are: (a) 30   mm × 23 mm stamp-size, (b) 3.5 g light-weight and (c) reduced power consumption, which allow to gradually distribute processing power, hence striving to realize a decentralized monitoring platform. This device represents an improved version of a previous and already validated circuitry customized to acquire acceleration data only [27]. Devices are connected by a Sensor Area Network (SAN) bus exploiting data-over-power (DoP) communication, whereas meaningful information is pre-processed by means of a lossless encoding technique; finally, data is transmitted to a connected PC via a purposely designed companion gateway device. When SAN is powered at 5.0 V, 44.8 mW are drained.
From an architectural point of view, all the building blocks sketched in Figure 1a are controlled by a Micro-Controller Unit (MCU) equipped with Digital Signal Processing (DSP) instructions, Floating Point Unit (FPU) and limited FLASH memory. A serial RAM is integrated for temporary storage, while network connectivity to the bus is accomplished through a low-power transceiver (XCVR). Serial Peripheral Interface (SPI) and I2C serial protocol guarantee internal and external communication between components and connected peripherals.
Angular velocities and acceleration signals are collected using an LSM6DSL iNEMO Inertial Measurement Unit (IMU), an ST Microelectronics system-in-package [28] featuring a 3D digital accelerometer and a 3D digital gyroscope, accessed by means of a dedicated SPI interface. It exhibits full-scale acceleration ranges of ±2 g, ±4 g, ±8 g and ±16g and angular rate ranges of ±125 dps, ±250 dps, ±500 dps, ±1000 dps and ±2000 dps. In shutdown mode, 3 μA are absorbed from the 3.3 V power supply fixed by a Low-Drop-Out regulator (LDO). It consumes 0.65 mA in the most-demanding configuration, thus enabling always-on low power measurements. Power-down, low-power, normal-mode, and high-performance mode are the four different operating modes available for the sensing elements, whose Output Data Rate spans from 12.5 Hz up to 6.664 k Hz and is real-time programmable by means of a digital low-pass filter.
The integrated tri-axial gyroscope belongs to a category of devices producing a positive digital output for counterclockwise rotation around a predefined axis. Its sensitivity of 4.375 mg/LSB (Least Significant Bit) for the chosen output range of ± 125 dps is subjected to minimal drifts over time, also withstanding a thermal excursion between 40 °C and 85 °C. Furthermore, this inertial component features an ultra-low noise density of about 4 mdps/ Hz in high-performance mode, exhibiting a competitive resolution within its class. In order to reinforce the placement, facilitate the installation step and protect circuitry against electromagnetic coupling or atmospheric-driven failures, common in harsh environments, each node is lodged in a dedicated case weighing less than 6 g on the whole.
The resulting sensor node, depicted in Figure 1b, can be permanently installed on the structures to be monitored as its physical and electrical properties do not interfere with their behavior.

2.2. Sensor Data Fusion

Data-level fusion algorithms are encouraged by the widely shared opinion that reliability, resolution, availability, and accuracy are primary issues in every SHM process [29,30]. Compensation and auto-calibration obtained by a complementary and integrated approach strengthen the inspection phase in seizing multiple aspects of the same phenomena [31]. In structural applications, the synchronized measurement of angular and linear displacements enables to estimate inclination with finer precision.
On one hand, accelerometers perform well at low frequencies: in fact, even if dynamic features suffer from crosstalk, this undesired effect is filtered out by the acceleration transfer function. On the other hand, gyroscopes work optimally in the superior spectral band; they, however, suffer from the integration procedure mandatory to transform angular velocities into tilt values. Among the variety of methods theorized for tilt estimation, the strategy here proposed and embedded in the sensor node is based on high-pass filtered angular velocities and low-pass filtered accelerations. The sensor data fusion mechanism, which is consistent with FIR Complementary Filters suggested in [25], is chosen to minimize phase and magnitude distortion around the cutoff frequency.

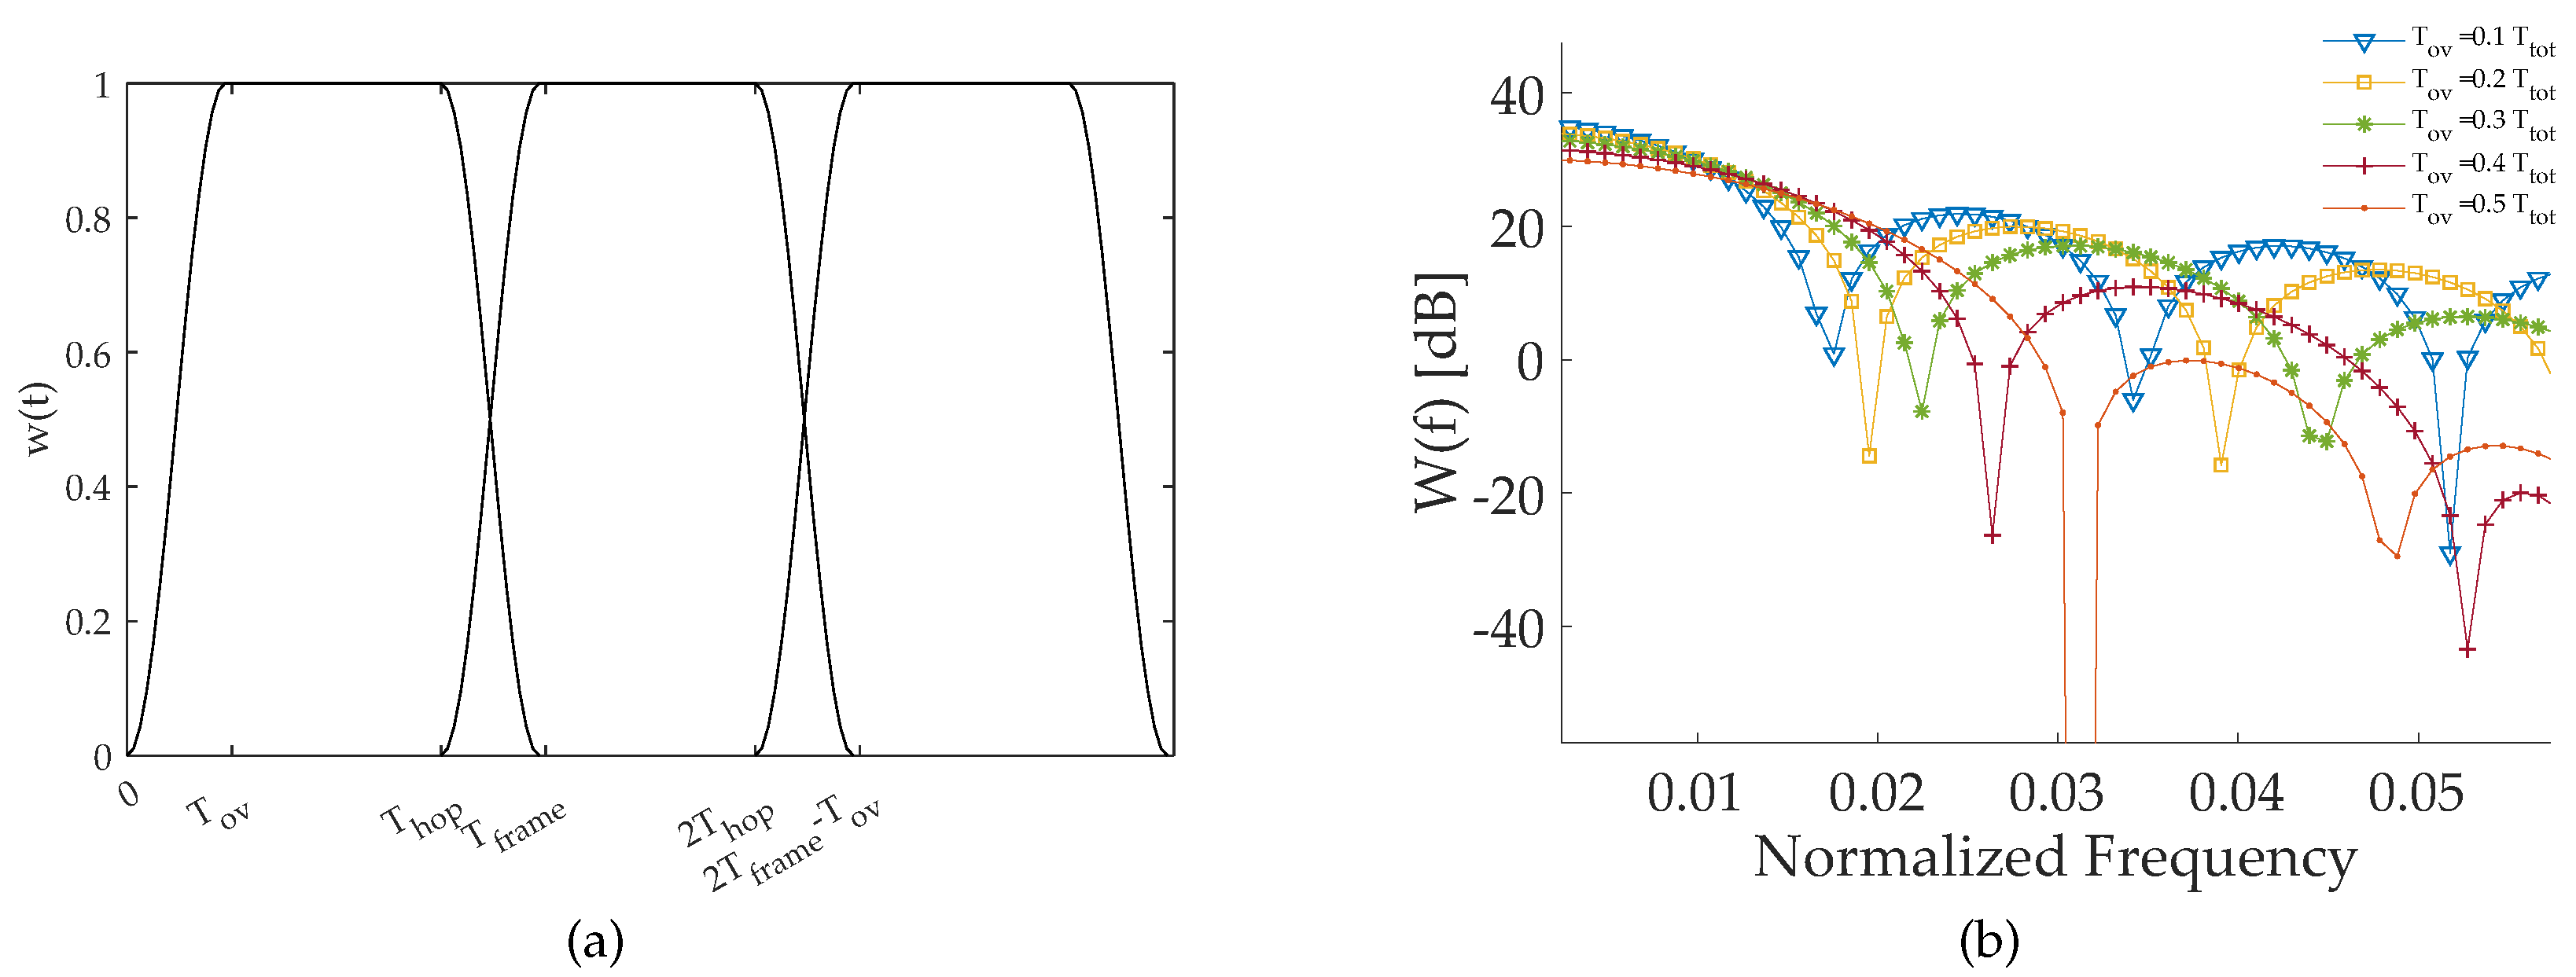
2.3. Algorithm Definition

The time-dependent acceleration-based and angular-based tilt values, addressed in the following as θ a and θ g , characterize the modal behavior of structures undergoing vibrations. For the sake of clarity, in case of devices installed on the top surface of a structure, Figure 2 schematically depicts the problem from a geometric point of view. In detail, the sensor node laying on the x y -plane is programmed to estimate inclinations of the vertical plane, consequently, the tilt is intended as a positive value around the z axis.
The acceleration vector constitutes of three components a x , a y , a z recorded along the three directions, whereas angular rates w x , w y , w z correspond to rotational spins projected on the same axes. Radial acceleration a r = a z and tangential acceleration a t = a x 2 + a y 2 are fused together to extract the tilt values θ ^ a defined as
tan θ ^ a = a t a r = a x 2 + a y 2 + ξ c + ξ a a z + ξ c + ξ a
Crosstalk noise ξ c and accelerometer intrinsic noise ξ a usually affects the collected data, their contribute becoming evident at higher frequencies. Such disturbances must be filtered out by an appropriate low-pass transfer function, thus providing an accurate estimation only for pseudo-static behavior.
Angles described by rotation around predefined directions can be numerically computed by integrating the absolute angular velocity components
ω ^ g = ω x 2 + ω y 2 + ω z 2 + ξ b + ξ g
in which drift errors caused by inherently biased and noisy measurements, respectively indicated as ξ b and ξ g , typically impact on pseudo-static measurements. The robustness of integration with respect to high-pass filtering leads to precise gyroscope-driven tilt estimations only in the dynamic regime.
According to the aforementioned CF technique, by taking the Fourier Transform (FT) of Equations (1) and (2), the estimated θ ^ a ( f ) and ω g ( f ) enter the fundamental fusion step to obtain a unique fused value θ ^ ( f ) defined as
θ ^ ( f ) = H L ( f ) θ ^ a ( f ) j H H ( f ) 2 π f ω ^ g ( f )
This is accomplished by applying in parallel two second order filters: H L ( f ) θ ^ a ( f ) is the low-pass filtered version of data coming from accelerometer, whereas angular rate signals undergo an high-pass filtering elaboration. The two quantities H L ( f ) and H H ( f ) designate the following low-pass and high-pass filtering envelopes
H L ( f ) = 1 1 + f f β 2 n H H ( f ) = 1 1 + f β f 2 n H L ( f ) + H H ( f ) = 1
where f β indicates the cut-off frequency of the filters. Fused inclination values at every instant in time are finally computed by applying the Inverse Fourier Transform (IFT) of the output provided by expression (3).

2.4. Embedded Processing

The processing flow implemented on the sensor node is schematically depicted in Figure 3. The sampling frequency F s is chosen on the basis of the spectral content, following the Nyquist theory. The number of samples N t o t is related to the maximum available storage capability of each sensor. The CF data fusion was performed in the Fourier domain by adopting the Overlap-Add (OLA) method [32].
According to the OLA paradigm, data must undergo a windowing phase. Window size in the time-domain N s is at least one order of magnitude smaller than the entire time-series N t o t . The window adopted in this study is displayed in Figure 4a, and can be mathematically described as:
w ( t ) = sin 2 π 2 t T o v 0 t < T o v 1 T o v t < T h o p cos 2 π 2 t T h o p T o v T h o p t < T f r a m e
where T f r a m e is N s F s , T o v is the time interval in which consecutive windows are overlapped, and T h o p = T f r a m e T o v is hop size. Windowed data are then Fourier transformed and filtered, so that the finally derived tilt values can be concatenated.
The optimal selection of the cutoff frequency of the complementary filters is highly dependent on the sensor technology, as well as on the specific application case. In the experiments related to static tilt conditions, such parameter has been selected on the basis of a calibration step which led to the minimization of the mean square error, as shown in Figure 5a.
For the global accuracy, the selection of the window length N s is also very relevant, since this parameter directly affects the quality of the filter approximation based on the discrete FT. This implies that the ratio between the frequency resolution of the windowed and non-windowed processing ( Δ f t = F s N t o t and Δ f w = F s N s , respectively) should be lower bounded:
Δ f t Δ f w = N s N t o t α N s α N t o t
where α is a predefined accuracy threshold.
It is worth noting that, since the rising and falling edge respectively obey to a sin 2 ( t ) and a cos 2 ( t ) trend, the mask of this window is shaped to satisfy the Constant-Overlap-Add (COLA) constraint stated in Equation (7):
k = 0 N w 1 w ( t k T h o p ) = 1 , t
being N w = T t o t T h o p the total number of iterations. This necessary and sufficient condition allows to correctly reconstruct signals split into successive windowed frames. The COLA constraint implies that the spectral values of the window functions must be zero at all harmonics of the hop rate F h o p = 1 T h o p , consequently, it must ensure that
W ( k F h o p ) = 0 , k = 1 , , N w 1
Taking the Fourier Transform of the window described in (5) and introducing the overlap fraction o = T o v T f r a m e , it follows that
W ( f ) = ( 2 f o T f r a m e ) 2 1 ( 2 f o T f r a m e ) 2 T h o p cos ( π f o T f r a m e ) sinc ( f T h o p ) e j π f T f r a m e
clearly showing zero values for f = k F h o p and then compliant to (8), independently either from the duration of the window and the number of samples to be overlapped.
A narrow amplitude of the first lobe of the window spectrum, together with a highly attenuated second lobe, would be desirable. However, the spectrum obtained by processing windows with increasing values of T o v (see Figure 4b) clearly demonstrates that a wider first lobe corresponds to a deeper attenuation of secondary lobes. As a result, the final choice must be properly balanced among these two opposite behaviors, in order to reach the best performance.
Besides accuracy, also the computational cost to perform the OLA processing is strongly affected by the selection of T o v and N s . As well known, the FFT has O ( N s log 2 N s ) complexity, implying a logarithmic decrease when N s is reduced. Therefore, the computational effort C paid to process a generic sequence of N t o t elements divided into N w frames results in
C = N w N s log 2 ( N s )
Specifically, the contribution associated with the number of overlapped samples is upper bounded to 2 N t o t whenever the maximum allowable T o v is chosen. On the contrary, the logarithmic relation connected to the dimension of the window leads to a consistent reduction of C as N s downsizes. Consequently, following what was anticipated in (6), there is a clear trade-off between the computational cost and the filter approximation accuracy.
To fully exploit the versatility of the circuitry, all the parameters necessary to perform the processing were stored in registers programmable at run-time: the gyroscope full-scale, the sampling frequency, the total number of samples to be acquired, the overlap fraction, and the output data rate.

3. System test and Discussion

To evaluate the reliability of the developed hardware and software architecture, after a validation phase in which window parameters have been quantified, the accuracy of tilt estimation has been examined experimentally in almost static conditions, and successively in dynamic regimes.

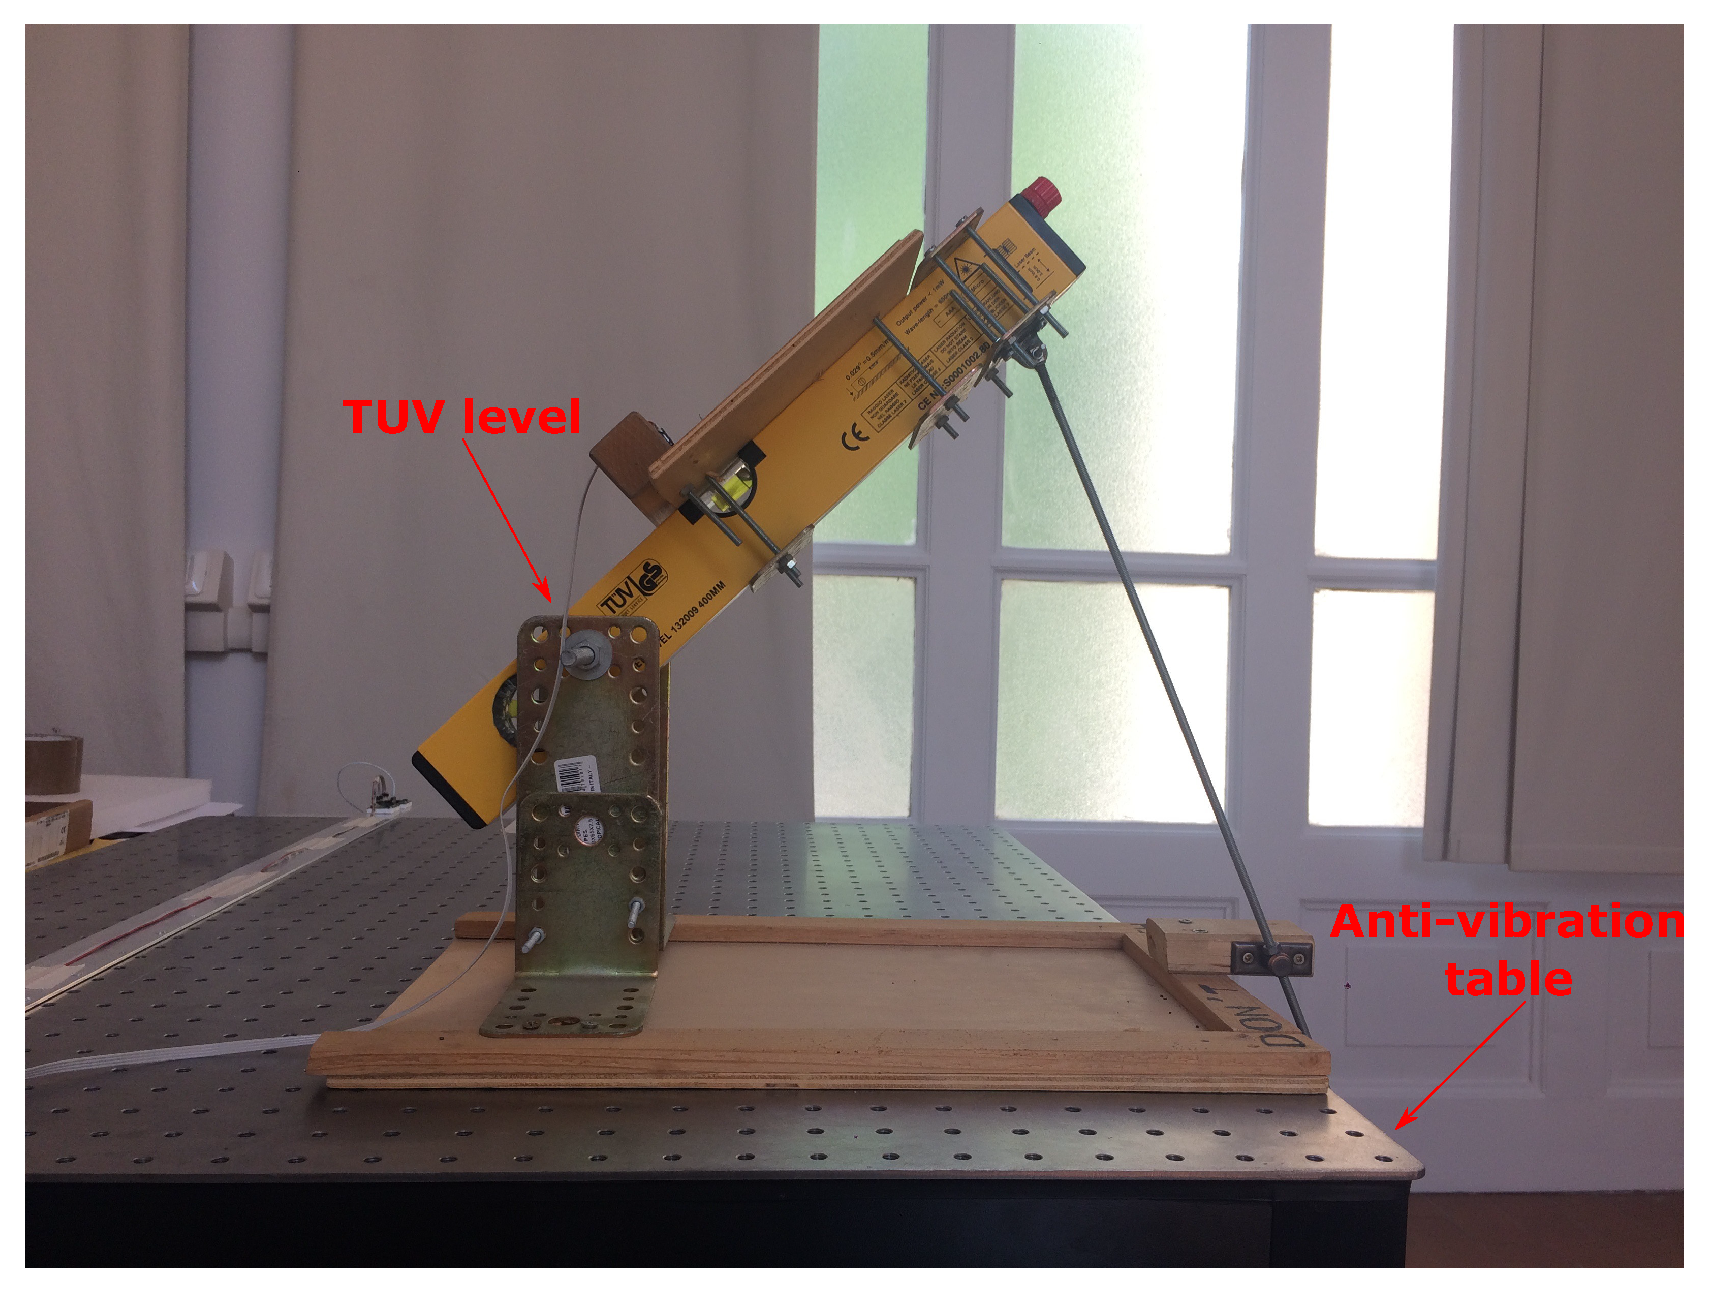
3.1. System Validation in Static Condition

A Newport IG Breadboard anti-vibration table shown in Figure 6 was used to filter out unwanted surrounding vibrations, while a sensor was statically tilted to a fixed angle during an initial trial necessary to extract the proper complementary filters cutoff frequency.
The sampling frequency was set to 1250 Hz. Since the maximum available temporary storage capability is 30 kBytes and each sensor concurrently acquires two data bytes for each one of the six inertial degrees of freedom, the available number of samples on each channel cannot exceed 2500. Obeying to internal DSP functionalities, which impose window length to be a power of two, and assuming a resolution ratio α = 0.02 , 64 samples shifted with an overlapping ratio equal to 0.25 were selected, ensuring an optimal trade-off among the spectral design of the corresponding window frame and the computational complexity.
Experimental data were processed with f β values varying from 80 Hz to 180 Hz with an increasing step of 1.5 Hz. The optimal cutoff frequency was obtained by minimizing the square error
S E = ( θ T U V θ ¯ S ) 2
between the constant θ T U V reference angle provided by a TUV GS level included in the same setup and the mean value θ ¯ S extracted from collected samples. The global minimum displayed in Figure 5a corresponding to a cutoff frequency of 153.5 Hz was finally set as the optimal cutoff frequency. Figure 5b shows that the selection of the most appropriate cutoff frequency effectively captures the actual tilt value, while a wrong selection may cause periodic artifacts, the periodicity of them being related to the window dimension.
In the following, first and second order statistics have been used to establish the accuracy of the measured inclinations in stationary conditions, with a sensor node fixed at three different inclinations: 30 ° , 45 ° , 60 ° . Table 1 points out the distribution of mean value and standard deviation for each configuration: relative error E r lower than 0.7% and σ always less than two-tenths of a degree prove that results are highly precise.
It is worth pointing out how variance slightly arises for increasing inclination values, showing an almost linear trend. This evidence paves the way to an auto-calibration procedure transferable onto the node itself: once a finer-scale training would be executed, biased measurements could be internally corrected after inferring the proper compensation curve.

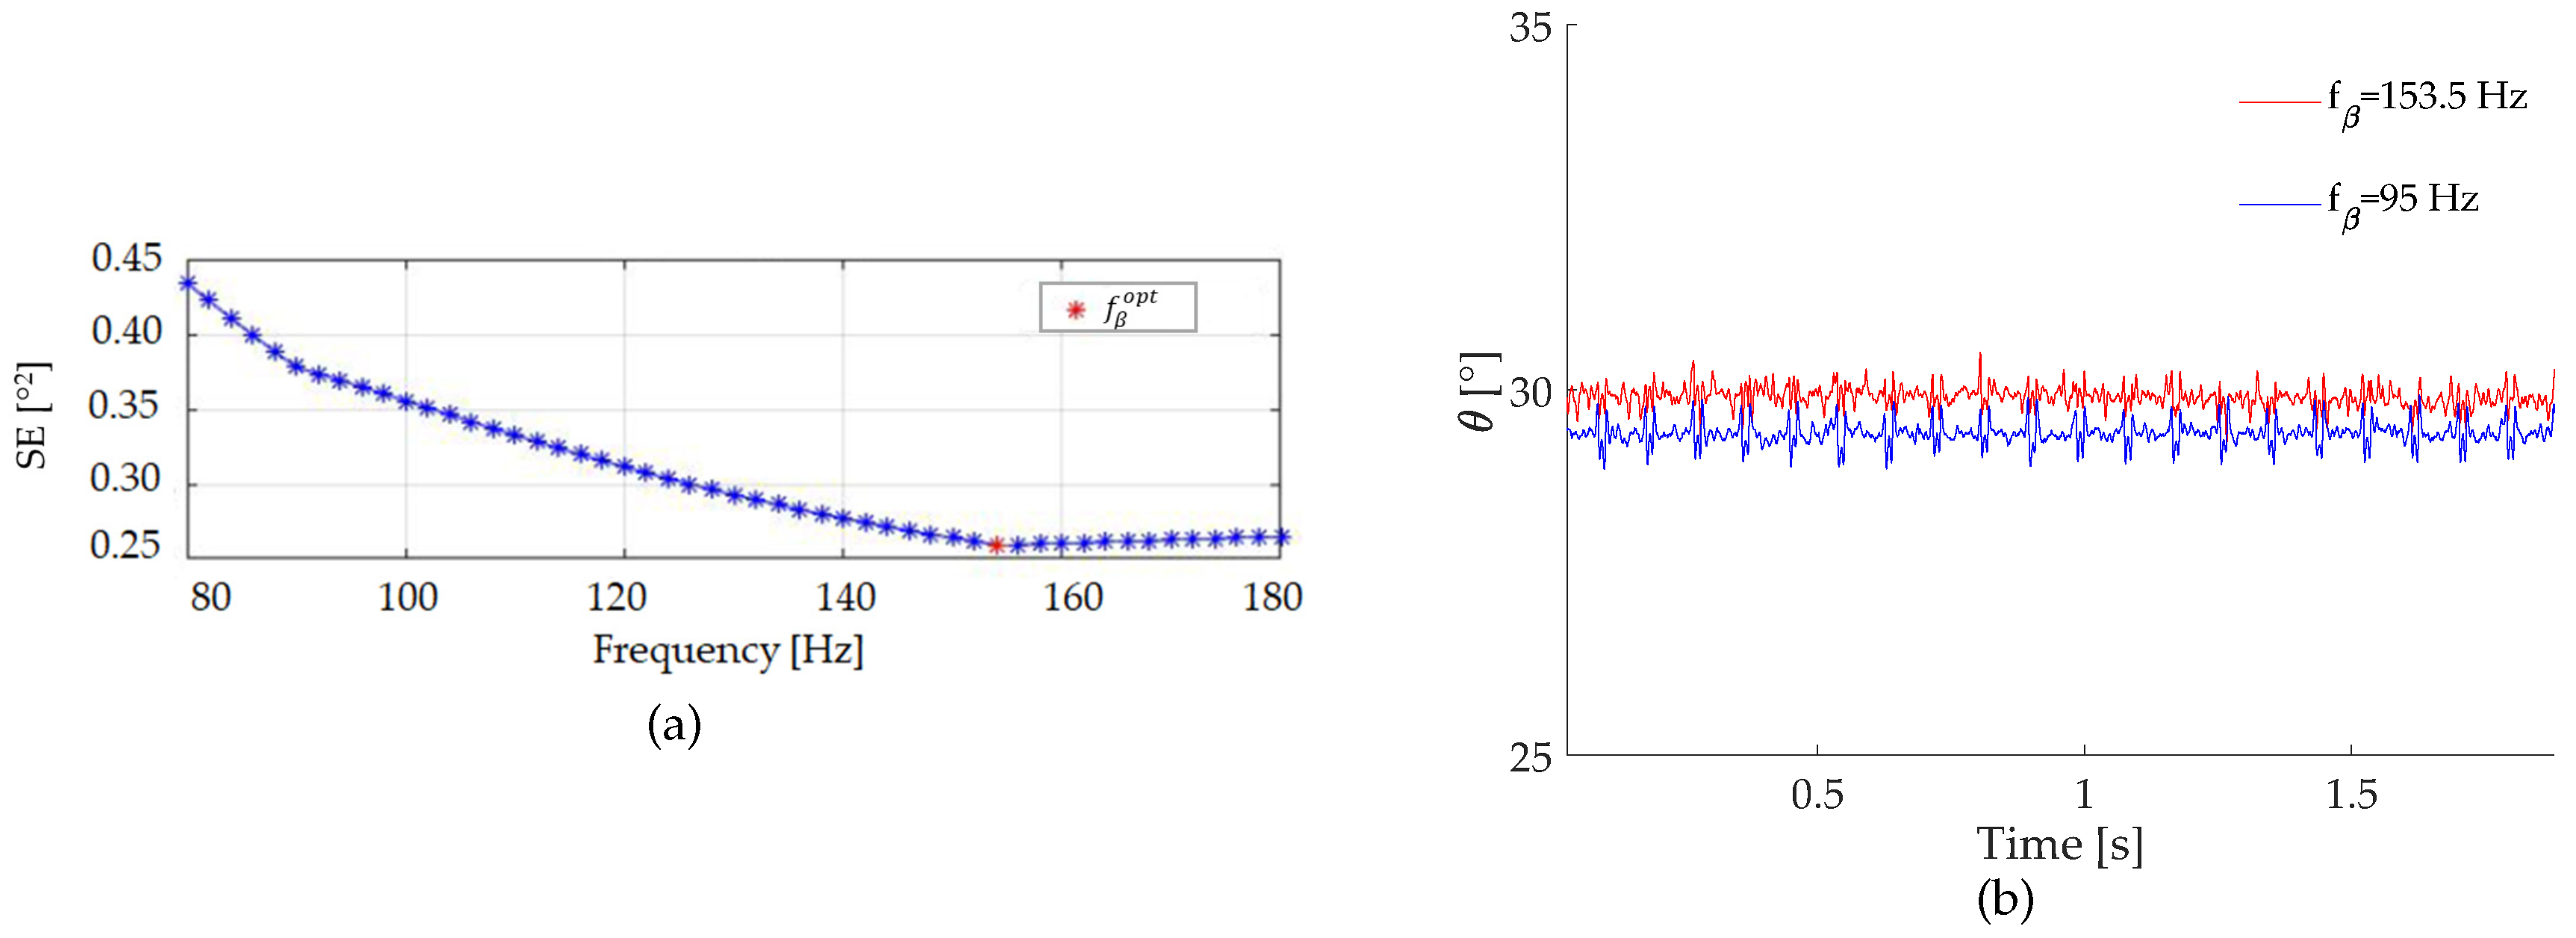
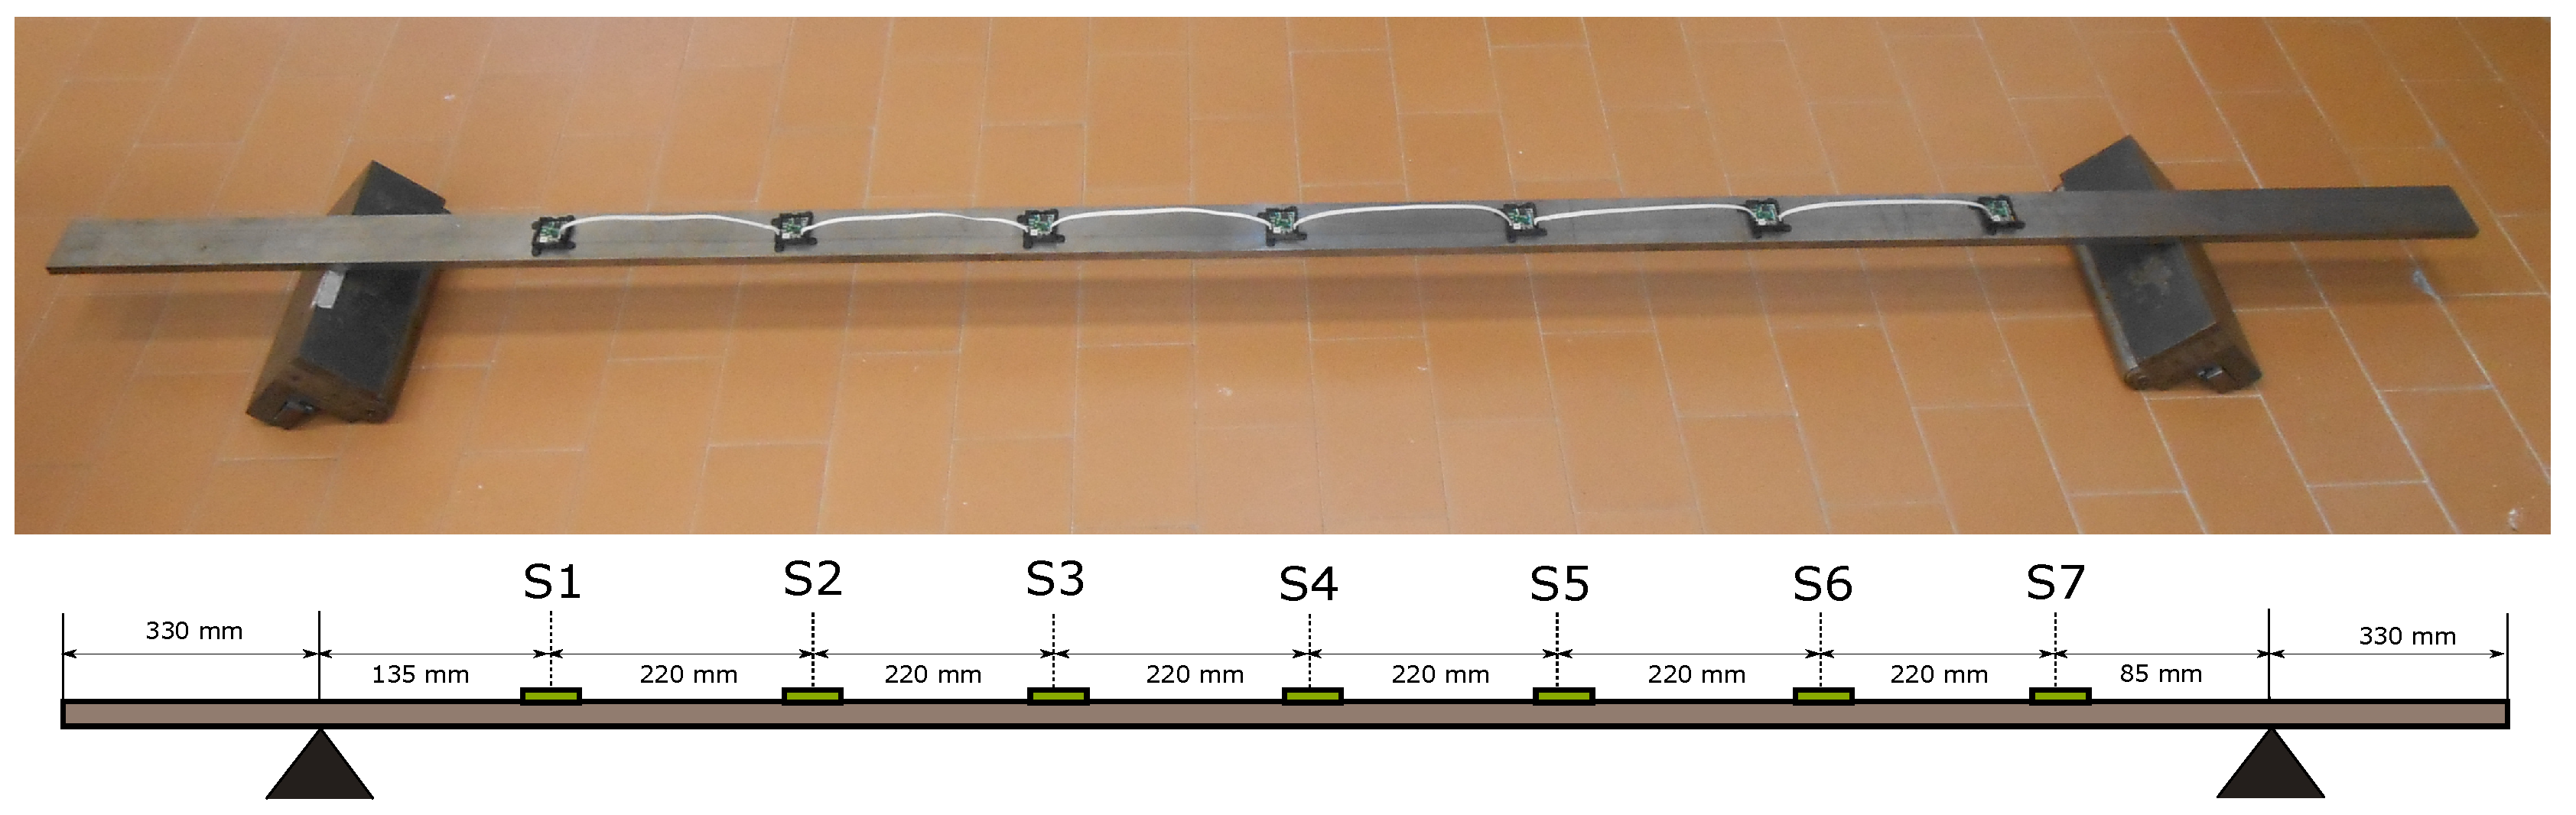
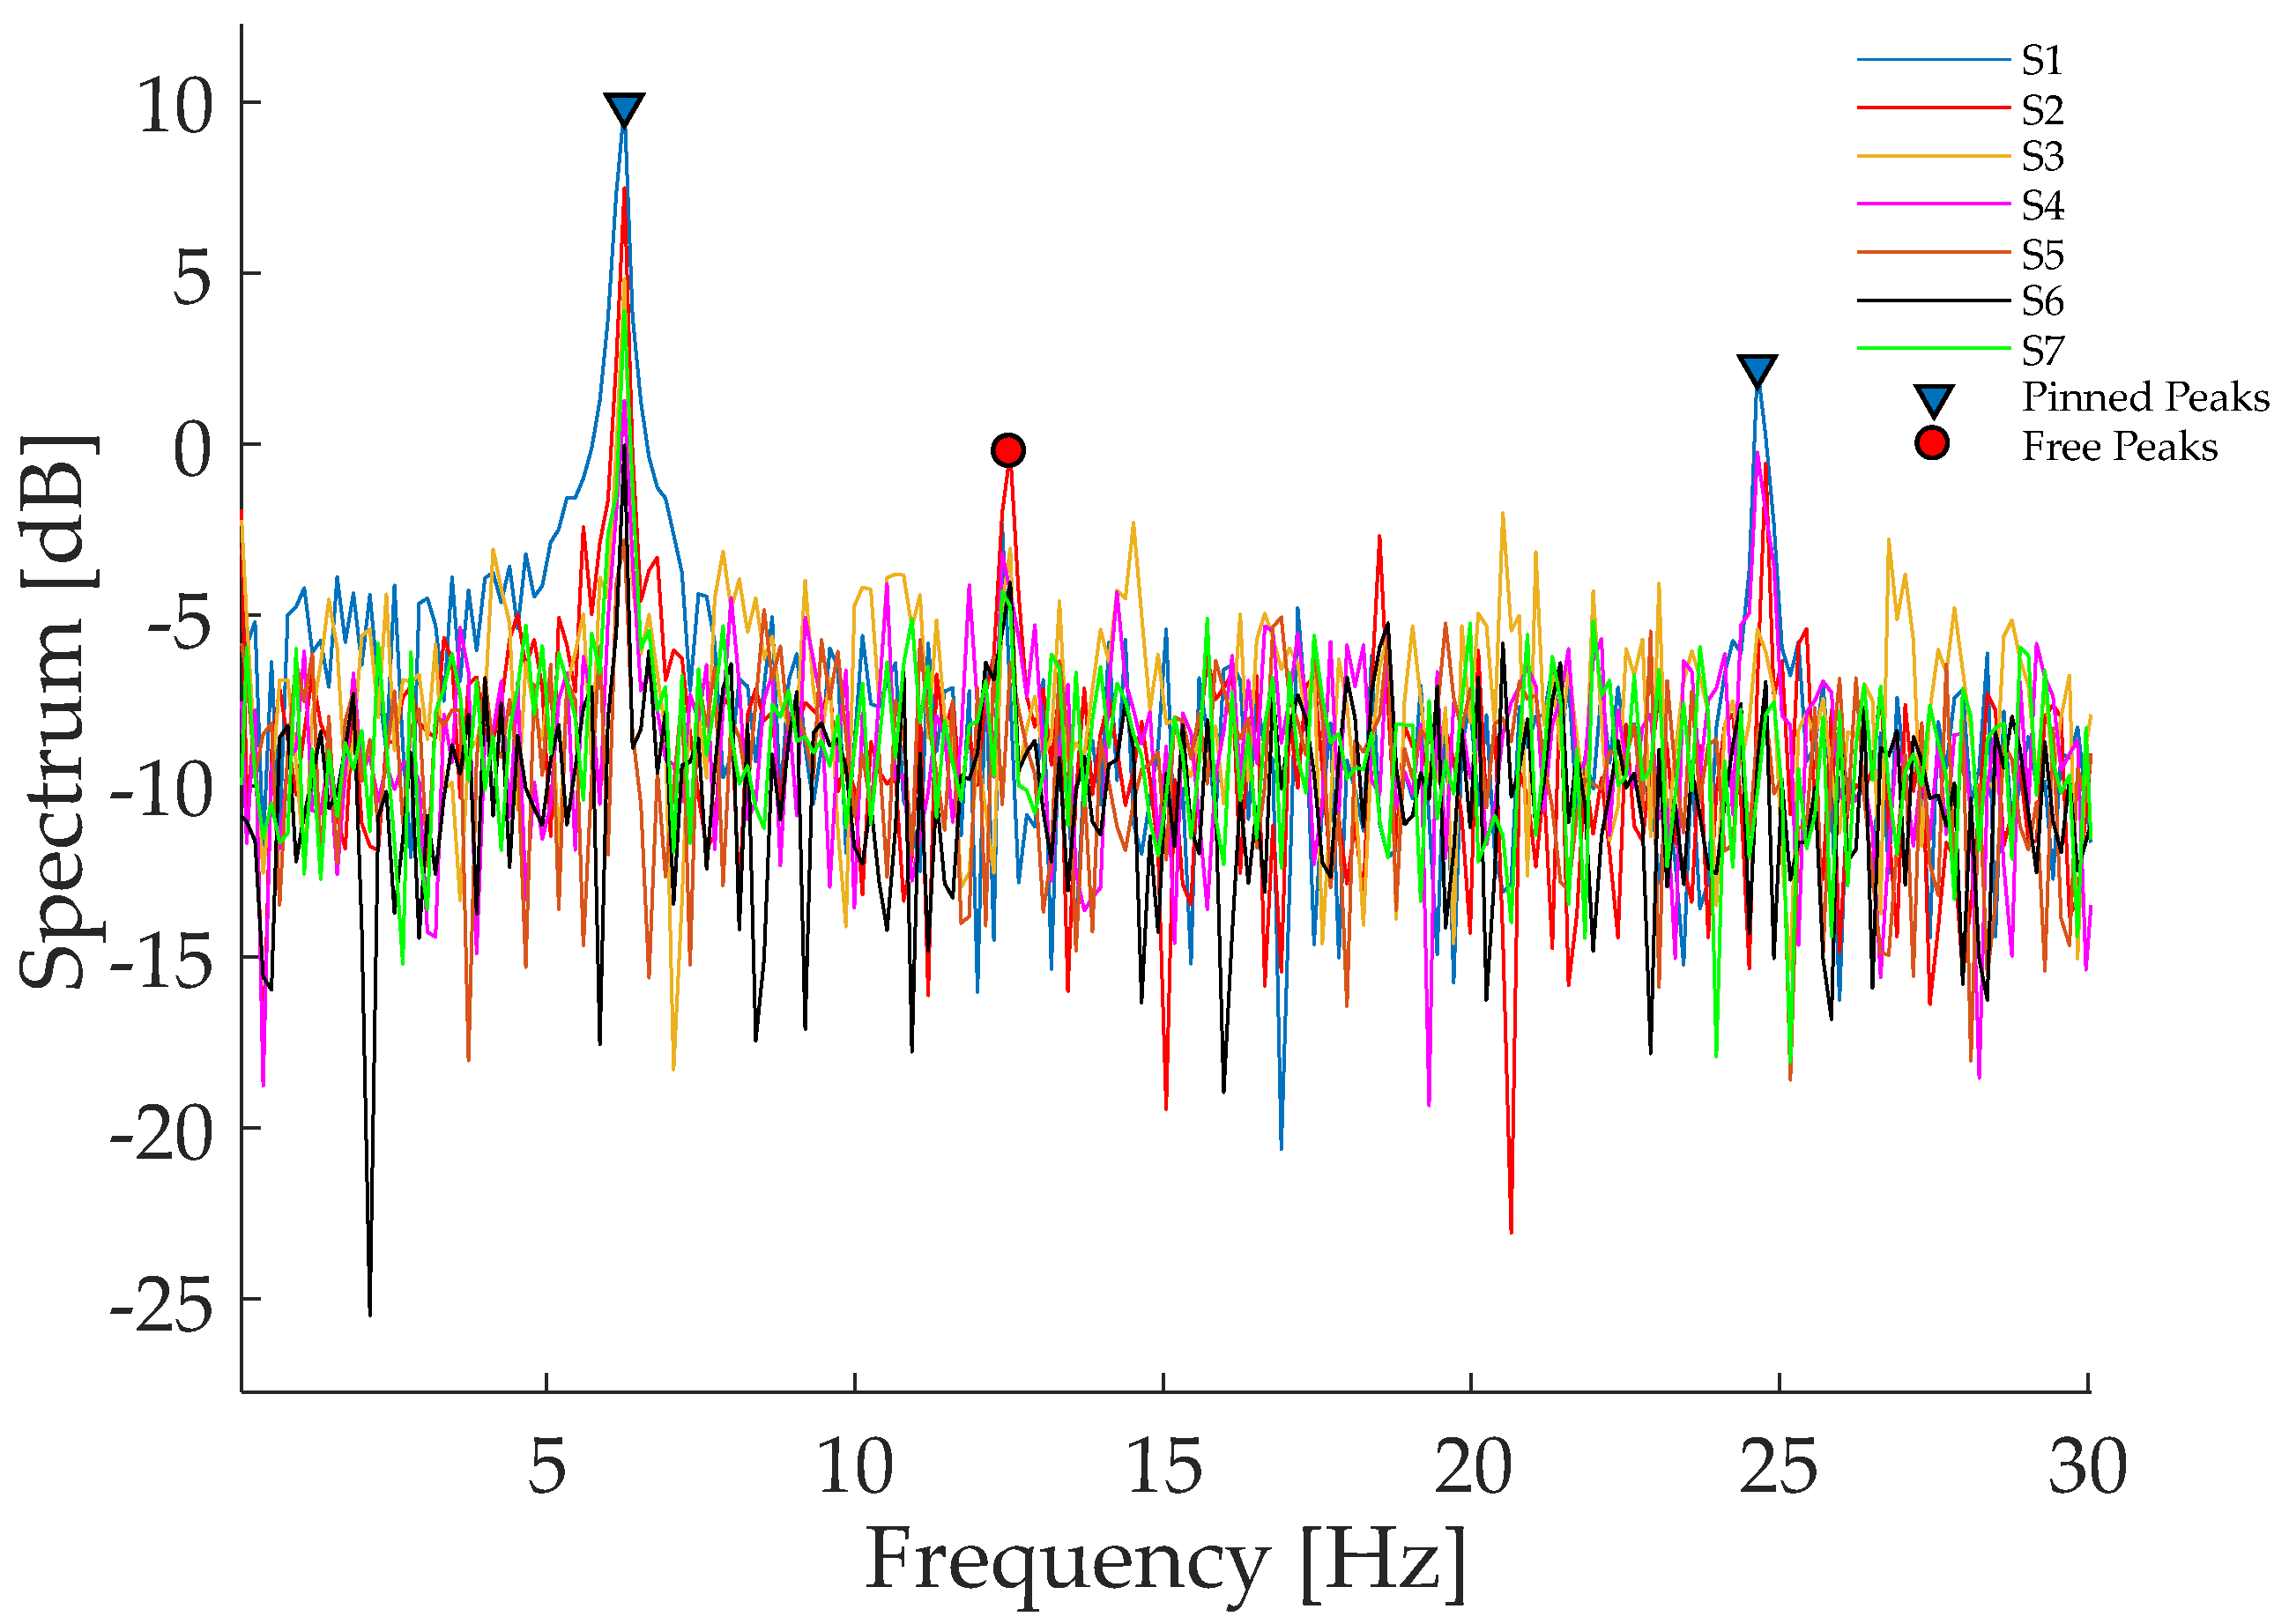
3.2. Vibration Analysis

The study of the dynamic properties of the system in the frequency domain is typically carried out estimating the most energetic natural frequencies, firstly for the extraction of the instantaneous rate of vibration and subsequently to assess the integrity.
As displayed in Figure 7, a network comprising seven sensor nodes and one interface connected in a daisy-chain fashion was mounted on a pinned-pinned L = 2140 mm steel beam with cross-section base b = 60 mm and height h = 10 mm , thus corresponding to a moment of inertia I = b h 3 / 12 . The material density is ρ = 7880 k g / m 3 and the Young’s modulus E = 195 G P a can be used to predict the first natural frequencies through the closed formula
f n = ( π n ) 2 2 π L E I ρ b h
Sensors were placed at a step of 220 mm starting from the first node, whose distance from the fixed left edge of the beam is 135 mm.
An explicit relationship exists between acceleration and inclination observed with respect to a common direction. Resorting to trigonometric relationships for the scheme introduced in Figure 2, the time-spatial dependent angle θ , described by rotations of the sensor, can be geometrically interpreted as the derivative of vertical position displacements along the longitudinal direction.
Mathematically speaking, the governing equation of a thin rod undergoing transverse motion is defined as [33]
z ( x , t ) = n = 1 ( A n cos ( ω n t ) + B n sin ( ω n t ) ) sin ( β n x )
where appearing quantities A n , B n are constants deriving from boundary conditions and ω n = 2 π f n correspond to the nth-cyclic pulsation. Algebraic manipulation of (13) yields to the more compact form
z ( x , t ) = n = 1 R n sin ( ω n t + α n ) sin ( β n x ) , R n = A n 2 + B n 2 ; α n = arctan A n B n
on which a derivative operation can be performed providing the final result stated in (15).
θ ( x , t ) = z ( x , t ) x = n = 1 β n R n sin ( ω n t + α n ) cos ( β n x )
Comparing (13) to (15), it can be inferred that the spectral content of z ( x , t ) and θ ( x , t ) is localized at the same angular frequencies ω n . As a consequence, frequency analysis accomplished on tilt angles or acceleration signals allow identifying the same modes of vibration, predictable through Equation (12). For this reason, in this experiment, we have evaluated how similar is the frequency spectrum computed on the acceleration data with respect to the one computed on the result of the CF data fusion procedure.
It is important to highlight that, besides data and power communication, the bus connecting the sensor nodes also natively allows for time base synchronization in the acquisition. As a consequence, an output-only estimation of vibrating components can be put in place. Gathering data at a sampling frequency F s = 1250 Hz ensures a Nyquists’ bandwidth compliant with the theoretical estimation up to a satisfying accuracy. The beam was excited at the two-thirds of the span by means of an impact hammer, thus allowing it to oscillate in a condition of free vibrations. Since the dynamic operating conditions substantially differ from static measurements, a new calibration phase is necessary to be executed.
The most appropriate cutoff frequency was selected according to the spectral range of interest. More explicitly, supposing that the energy of a structure is mainly distributed among the lower spectral components, the analysis here conducted included the characterization of the first and second harmonic, corresponding to f 1 = 6.195 Hz and f 2 = 24.778 Hz for the setup under test. Thereafter, a value of f β = 27 Hz was adopted to properly balance accelerometers and gyroscopes performance. Window size equal to 128 samples was chosen in order to provide high-resolution data, and an overlap factor o = 0.4 enabled to smooth the envelope of the window transition bands.
The joint hardware-software optimization of the circuitry allowed us to compute Power Spectral Densities (PSD) of tilt signals, processed exploiting FFT and Welch estimation method. In order to assess the reliability of the proposed multi-type sensor framework, results obtained for windowed and non-windowed processing were compared to the performance obtained applying the aforementioned techniques to the same radial acceleration dataset used for tilt angles estimation.
Improvements in the quality of the vibration analysis can be inferred from Figure 8. Basing on data extracted from a single sensor node installed on the top surface of the beam, the introduction of the right cutoff frequency intensely attenuates spurious peaks. Furthermore, the spectral trend estimated through the windowing strategy is almost perfectly superimposed to the one extracted processing the whole dataset at one time and it is also coherent to numerical predictions.
An important observation comes from the analysis of Figure 9: a deep correlation is present between the experimental and theoretical modes of vibration, being the relative error always below 1% under all the investigated methods. Moreover, the FFT estimator not only accomplishes the highest level of accuracy but also implies a lower computational cost if executed by local on-sensor processing units.
Another significant evidence comes from the analysis of Figure 10, were the seven spectra obtained from the sensors placed in the positions described by Figure 7 are superimposed; not only the peaks corresponding to the different vibrating harmonics are distinctly resolved over the whole band and are characterized by a satisfactory peak-to-noise ratio of about 15 dB, but also a high degree of coherence between them is evident.
Finally, it can be observed that the obtained spectra allow detecting both the pinned-pinned frequencies (triangular marked peaks) and the free-free flexural behavior of the beam (red circles), which may arise because the hinging supports do not perfectly anchor the structure. As a result, improved real-time algorithms embedded into electronic equipment permit to capture detailed snapshots of the rotational properties characterizing vibrating structures.

4. Conclusions

This work describes a tilt sensor node, along with all the implemented procedures adopted to acquire and process high-quality signals in real-time. Inclination values are extracted with a simple but robust sensor data fusion algorithm supported by an optimized onboard signal processing scheme, accomplishing high accuracy both in pseudo-static and dynamic conditions. Reduced computational complexity, combined with scalability, versatility, and non-invasiveness, perfectly cope with long-term monitoring instances. The suitability of the designed framework to vibration-based SHM instances makes it possible to integrate such a network for modal analysis purposes, comprehending the development of new modal shapes reconstruction strategies which represent a big concern in modal analysis scenarios.

Author Contributions

Conceptualization, N.T., F.Z., A.M., V.S. and L.D.M.; Data curation, F.Z. and V.S.; Methodology, N.T., F.Z. and V.S.; Supervision, N.T., A.M. and L.D.M.; Validation, N.T. and F.Z.; Visualization, F.Z. and V.S.; Writing—original draft, F.Z. and V.S.; Writing—review & editing, N.T., F.Z., A.M. and L.D.M.

Funding

This work has been funded by INAIL within the BRIC/2016, ID = 15 framework, project SMARTBENCH.

Conflicts of Interest

The authors declare no conflict of interest.

References

  1. Farrar, C.R.; Worden, K. An introduction to structural health monitoring. Philos. Trans. R. Soc. Lond. A Math. Phys. Eng. Sci. 2007, 365, 303–315. [Google Scholar] [CrossRef] [PubMed] [Green Version]
  2. Carden, E.P.; Fanning, P. Vibration based condition monitoring: A review. Struct. Health Monit. 2004, 3, 355–377. [Google Scholar] [CrossRef]
  3. Lynch, J.P.; Loh, K.J. A summary review of wireless sensors and sensor networks for structural health monitoring. Shock Vib. Dig. 2006, 38, 91–130. [Google Scholar] [CrossRef]
  4. Poncelet, F.; Kerschen, G.; Golinval, J.C.; Verhelst, D. Output-only modal analysis using blind source separation techniques. Mech. Syst. Signal Process. 2007, 21, 2335–2358. [Google Scholar] [CrossRef]
  5. Esfandabadi, Y.K.; De Marchi, L.; Testoni, N.; Marzani, A.; Masetti, G. Full wavefield analysis and Damage imaging through compressive sensing in Lamb wave inspections. IEEE Trans. Ultrason. Ferroelectr. Freq. Control 2018, 65, 269–280. [Google Scholar] [CrossRef] [PubMed]
  6. Hu, X.; Wang, B.; Ji, H. A wireless sensor network-based structural health monitoring system for highway bridges. Comput.-Aid. Civ. Infrastruct. Eng. 2013, 28, 193–209. [Google Scholar] [CrossRef]
  7. Manthei, G.; Plenkers, K. Review on In Situ Acoustic Emission Monitoring in the Context of Structural Health Monitoring in Mines. Appl. Sci. 2018, 8, 1595. [Google Scholar] [CrossRef]
  8. Ngabo, C.I.; El Beqqali, O. 3D tilt sensing by using accelerometer-based wireless sensor networks: Real case study: Application in the smart cities. In Proceedings of the 2018 International Conference on Intelligent Systems and Computer Vision (ISCV), Fez, Morocco, 2–4 April 2018; pp. 1–8. [Google Scholar]
  9. Giri, P.; Ng, K.; Phillips, W. Laboratory simulation to understand translational soil slides and establish movement criteria using wireless IMU sensors. Landslides 2018, 15, 2437–2447. [Google Scholar] [CrossRef]
  10. Sung, S.H.; Park, J.W.; Nagayama, T.; Jung, H.J. A multi-scale sensing and diagnosis system combining accelerometers and gyroscopes for bridge health monitoring. Smart Mater. Struct. 2013, 23, 015005. [Google Scholar] [CrossRef]
  11. Hu, R.; Xu, Y.; Lu, X.; Zhang, C.; Zhang, Q.; Ding, J. Integrated multi-type sensor placement and response reconstruction method for high-rise buildings under unknown seismic loading. Struct. Des. Tall Spec. Build. 2018, 27, e1453. [Google Scholar] [CrossRef]
  12. Li, X.; Rizos, C.; Tamura, Y.; Ge, L.; Yoshida, A.; Cranenbroeck, J. Fundamental bending mode and vibration monitoring with inclinometer and accelerometer on high-rise buildings subject to wind loads. In Proceedings of the 5th World Conference Structural Control and Monitoring, Tokyo, Japan, 12–14 July 2010; pp. 1–15. [Google Scholar]
  13. Yigit, C.O.; Li, X.; Inal, C.; Ge, L.; Yetkin, M. Preliminary evaluation of precise inclination sensor and GPS for monitoring full-scale dynamic response of a tall reinforced concrete building. J. Appl. Geod. 2010, 4, 103–113. [Google Scholar] [CrossRef]
  14. Su, J.Z.; Xia, Y.; Chen, L.; Zhao, X.; Zhang, Q.L.; Xu, Y.L.; Ding, J.M.; Xiong, H.B.; Ma, R.J.; Lv, X.L.; et al. Long-term structural performance monitoring system for the Shanghai Tower. J. Civ. Struct. Health Monit. 2013, 3, 49–61. [Google Scholar] [CrossRef] [Green Version]
  15. Dong, L.; Wang, H.; Wang, G.; Qiu, W. A wireless multifunctional monitoring system of tower body running state based on MEMS acceleration sensor. In Proceedings of the 2018 19th International Symposium on Quality Electronic Design (ISQED), Santa Clara, CA, USA, 13–14 March 2018; pp. 357–363. [Google Scholar]
  16. König, S.; Leinfelder, P. First results with MEMS tilt sensors on bridges. In Proceedings of the Intertial Sensors and Systems (ISS), Karlsruhe, Germany, 20–21 Septenber 2016; pp. 1–15. [Google Scholar]
  17. Leavitt, J.; Sideris, A.; Bobrow, J.E. High bandwidth tilt measurement using low-cost sensors. IEEE/ASME Trans. Mech. 2006, 11, 320–327. [Google Scholar] [CrossRef]
  18. Liu, Y.; Noguchi, N.; Ishii, K. Development of a low-cost IMU by using sensor fusion for attitude angle estimation. IFAC Proc. Vol. 2014, 47, 4435–4440. [Google Scholar] [CrossRef]
  19. Li, C.; Azzam, R.; Fernández-Steeger, T.M. Kalman Filters in Geotechnical Monitoring of Ground Subsidence Using Data from MEMS Sensors. Sensors 2016, 16, 1109. [Google Scholar] [CrossRef] [PubMed]
  20. Yean, S.; Lee, B.S.; Yeo, C.K.; Vun, C.H. Algorithm for 3D orientation estimation based on Kalman filter and gradient descent. In Proceedings of the 2016 IEEE 7th Annual Information Technology, Electronics and Mobile Communication Conference, Vancouver, BC, Canada, 13–15 October 2016; pp. 1–6. [Google Scholar]
  21. Ren, Y.; Ke, X. Particle filter data fusion enhancements for MEMS-IMU/GPS. Intell. Inf. Manag. 2010, 2, 417. [Google Scholar] [CrossRef]
  22. Lim, J.; Hong, D. Cost reference particle filtering approach to high-bandwidth tilt estimation. IEEE Trans. Ind. Electron. 2010, 57, 3830–3839. [Google Scholar] [CrossRef]
  23. Lee, H.S.; Hong, Y.H.; Park, H.W. Design of an FIR filter for the displacement reconstruction using measured acceleration in low-frequency dominant structures. Int. J. Numer. Methods Eng. 2010, 82, 403–434. [Google Scholar] [CrossRef]
  24. Park, J.W.; Sim, S.H.; Jung, H.J. Displacement estimation using multimetric data fusion. IEEE/ASME Trans. Mech. 2013, 18, 1675–1682. [Google Scholar] [CrossRef]
  25. Liu, C.; Park, J.W.; Spencer, B., Jr.; Moon, D.S.; Fan, J. Sensor fusion for structural tilt estimation using an acceleration-based tilt sensor and a gyroscope. Smart Mater. Struct. 2017, 26, 105005. [Google Scholar] [CrossRef] [Green Version]
  26. Shi, L.; He, Y.; Luo, Q.; He, W.; Li, B. Tilt Angle On-Line Prognosis by Using Improved Sparse LSSVR and Dynamic Sliding Window. IEEE Trans. Instrum. Meas. IM 2018, 67, 296–306. [Google Scholar] [CrossRef]
  27. Testoni, N.; Aguzzi, C.; Arditi, V.; Zonzini, F.; De Marchi, L.; Marzani, A.; Cinotti, T.S. A Sensor Network with Embedded Data Processing and Data-to-Cloud Capabilities for Vibration-Based Real-Time SHM. J. Sens. 2018, 2018, 2107679. [Google Scholar] [CrossRef]
  28. STMicroelectronics. iNEMO Inertial Module: Always-On 3D Accelerometer and 3D Gyroscope; Technical Report; STMicroelectronics: Geneva, Switzerland, 2017. [Google Scholar]
  29. Khaleghi, B.; Khamis, A.; Karray, F.O.; Razavi, S.N. Multisensor data fusion: A review of the state-of-the-art. Inf. Fusion 2013, 14, 28–44. [Google Scholar] [CrossRef]
  30. Lahat, D.; Adali, T.; Jutten, C. Multimodal data fusion: an overview of methods, challenges, and prospects. Proc. IEEE 2015, 103, 1449–1477. [Google Scholar] [CrossRef]
  31. Kok, M.; Hol, J.D.; Schön, T.B. Using inertial sensors for position and orientation estimation. arXiv, 2017; arXiv:1704.06053. [Google Scholar]
  32. Smith, J.O. Spectral Audio Signal Processing; W3K Publishing: Palo Alto, CA, USA, 2011. [Google Scholar]
  33. Graff, K.F. Wave Motion in Elastic Solids; Courier Corporation: Chelmsford, MA, USA, 2012. [Google Scholar]
Figure 1. Hardware instrumentation: (a) Schematic diagram of the sensor node and (b) its relative prototype inside an ad-hoc case.
Electronics 08 00045 g001
Figure 2. Geometric relation between tilt angles and acceleration referred to z-direction for a device installed on the top of a structure.
Electronics 08 00045 g002
Figure 3. Schematic representation of signal processing method programmed onboard.
Electronics 08 00045 g003
Figure 4. Window function implemented to diminish the computational burden of the data fusion algorithm working on sensor: (a) Time-domain working principle of the OLA mechanism and (b) window spectral properties for overlapping fraction spanning in the interval [0.1; 0.5].
Electronics 08 00045 g004
Figure 5. (a) Optimal cutoff frequency estimation and (b) effect of the cutoff frequency selection on OLA sensor data fusion (actual tilt value: 30°).
Electronics 08 00045 g005
Figure 6. Experimental setup in pseudo-static conditions: anti-vibration table equipped with TUV level.
Electronics 08 00045 g006
Figure 7. Experimental setup in vibrating condition.
Electronics 08 00045 g007
Figure 8. Comparison of spectra resulting from the windowed and non-windowed approach with respect to the spectral content of radial acceleration.
Electronics 08 00045 g008
Figure 9. Spectral analysis on tilt values extracted by sensor node S2: comparison of the error distribution in vibrating modes extraction from acceleration and tilt signals via FFT and Welch strategy.
Electronics 08 00045 g009
Figure 10. Comparison of spectral density characteristics of tilt signals estimated via FFT elaboration by nodes located at different positions.
Electronics 08 00045 g010
Table 1. Statistics obtained from measurements in different pseudo-static configurations: mean value, relative error and standard deviation.
Reference TiltMeasured Tilt E r σ
[°][°][%][°]
3030.18320.6110.1399
4545.00240.0050.1523
6060.31160.5190.1985

