Article

Distinction between Arcing Faults and Oil Contamination from OLTC Gases

by
Sergio Bustamante
1,*,
Jose L. Martinez Lastra
2,
Mario Manana
1 and
Alberto Arroyo
1
1
Department of Electrical and Energy Engineering, Universidad de Cantabria, Av. Los Castros 46, 39005 Santander, Spain
2
Faculty of Engineering and Natural Sciences, Tampere University, Korkeakoulunkatu 6, 33720 Tampere, Finland
*
Author to whom correspondence should be addressed.
Electronics 2024, 13(7), 1338; https://doi.org/10.3390/electronics13071338
Submission received: 29 February 2024 / Revised: 27 March 2024 / Accepted: 29 March 2024 / Published: 2 April 2024
(This article belongs to the Special Issue Monitoring, Diagnosis, and Prognostics for Power Industry Devices)

Abstract

:
Power transformers are the most important and expensive assets in high-voltage power systems. To ensure an adequate level of reliability throughout the transformer’s lifetime, its maintenance strategy must be well defined. When an incipient fault occurs in the transformer insulation, a gas concentration pattern, representative of the type of fault, is generated. Fault-identification methods use gas concentrations and their ratios to identify the type of fault. None of the traditional or new fault-identification methods attempt to detect transformer oil contamination from on-load tap changer (OLTC) gases. In this study, from dissolved gas analysis (DGA) samples of transformers identified as contaminated in a previous study, fault-identification methods based on graphical representations were used to observe the patterns of results. From such patterns, Duval’s triangle and pentagon methods were modified to include a new zone indicating oil contamination (OC) from OLTC gases. Finally, the proposed modifications were validated using 75 DGA samples extracted from previous studies that were identified as D1 or D2 faults or contaminated from OLTC. This validation showed that only 14.7% and 13.3% of the DGA samples fell within the new OC zone of the proposed triangle and pentagon, respectively.

1. Introduction

The most important and expensive asset in high-voltage power systems is the power transformer; therefore, its maintenance strategy must be well defined to guarantee an adequate level of reliability throughout the transformer’s lifetime [1,2].
Dissolved gas analysis (DGA) is the most widely used method for identifying incipient faults in transformer insulation. DGA measures gas concentrations in transformer oil generated by the degradation of solid and liquid insulations due to faults. When electrical and thermal faults occur in the transformer oil, the combustible gases generated are hydrogen (H2), methane (CH4), ethane (C2H6), ethylene (C2H4), and acetylene (C2H2). When a thermal fault occurs in cellulosic insulation, the gases generated are carbon monoxide (CO) and carbon dioxide (CO2).
When an incipient fault occurs in the transformer insulation, a gas concentration pattern representative of the type of fault is generated. Fault-identification methods use gas concentrations and their ratios to identify the type of fault. The most commonly used fault-identification methods are Doernenburg’s ratio method (DRM), Rogers’ ratio method (RRM), IEC ratio method (IRM), Duval’s triangle method (DTM), and Duval’s pentagon method (DPM) [3,4]. DRM, RRM, and IRM employ ratios between gas concentrations to identify the type of fault. In addition, IRM uses a graphical representation to observe the trend of the DGA samples. DTM and DPM employ graphical representations to determine the type of fault from gas concentrations, and the trend of DGA samples is also observed.
In previous studies, new fault-identification methods or modified versions of existing ones were developed. These methods were intended to improve the accuracy of traditional fault-identification methods. In [5,6,7], some of the traditional fault interpretation methods were improved or modified. An extended version of DTM to detect simple and multiple faults was developed in [7]. The development of algorithms and models for fault diagnosis in power transformers is presented in [8,9,10,11]. New fault-identification methods were developed and explained in [12,13,14,15]. In these methods, new graphical representations were created to identify the type of incipient fault. The method presented in [15] uses seven hydrocarbon gases to identify the type of fault. This method can be used to identify the six main fault types and oil leakage from the on-load tap changer (OLTC). The last two gases used, in addition to the combustible gases discussed above, are propylene (C3H6) and propane (C3H8). These two gases are generally not measured by the DGA, so the use of this method depends on their availability.
In another previous study [16], a methodology to identify transformer oil contamination from OLTC gases was developed. In this methodology, the C2H2/H2 ratio was used as a criterion to determine the contamination of the transformer oil by gas filtration from OLTC. In addition, transformers with C2H2 concentrations higher than or equal to 10 ppm were associated with oil contamination by studying the remaining DGA samples of each transformer. This part of the methodology was called expert knowledge (EK).
Traditional or new DGA interpretation methods do not identify transformer oil contamination from OLTC gases, or this identification is dependent on obtaining C3H6 and C3H8 concentrations, which are usually not available. In [16], it was found that the application of the C2H2/H2 ratio criterion does not always indicate oil contamination, and it was necessary to apply EK.
In this study, graphical representations of fault-identification methods were employed to establish whether there was a pattern in the distribution of results. From such patterns, modifications to DTM and DPM are proposed in this study. In these modifications, a new zone is added, indicating transformer oil contamination from OLTC gases. The proposed DTM and DPM modifications were validated using DGA samples extracted from previous studies. As stated above, the aim of this work is to create a new zone in the DTM and DPM, indicating the oil communication between the OLTC compartment and the main tank.
The novelty of this work lies in the creation of new zones on the most commonly used fault-identification methods to detect oil contamination from OLTC gases. This work introduces the concept of potential oil contamination from OLTC gases using fault-identification methods. This is not considered in traditional or new methods that rely on the concentrations of the five most commonly measured combustible gases in the DGA to identify faults.
The paper is structured as follows: Section 1 introduces the background and the novelty of the work. Section 2 describes the methodology followed in this work. Section 3 presents the application of traditional graphical fault-identification methods to the DGA results of contaminated transformers. From the pattern of results obtained by applying the fault-identification methods to the DGA samples of contaminated transformers, modifications to these methods are presented in Section 4. Section 5 shows the application of the proposed modifications in the methods to DGA samples identified as arcing faults from references. Section 6 discusses the results obtained by applying the modified fault-identification methods to the DGA data extracted from the literature. In particular, the DGA results falling within the proposed new zone are analyzed in detail. Section 7 presents the conclusions of this work. Finally, Appendix A contains the DGA results from the references that were used to validate the proposed modifications.

2. Materials and Methods

2.1. Dissolved Gas Analysis

One of the most widely used tools for diagnosing incipient faults in power transformer insulation is the DGA. The degradation of liquid and solid insulation produces gases in the oil [3,4], which are measured by the DGA. Depending on the fault type that occurs in the transformer oil, the gases generated and their concentrations are different, as shown in Table 1. H2 is present in all faults, varying in concentration depending on the fault type. CH4, C2H6, and C2H4 are mainly generated in thermal faults. C2H2 is generated in high- and low-energy discharges and in thermal faults in which the temperature is above 700 °C. In the latest version of the DTM [17] and DPM [18], the authors split D1 and D2 faults according to whether they occur in paper (-P) or in oil (-H).
In power transformers that have an OLTC, the gases generated in the OLTC compartment oil can be filtered to the main tank [3,4]. Gas filtration between the OLTC compartment and the main transformer tank modifies the gas concentrations obtained in the DGA samples, leading to an incorrect diagnosis of active faults in the transformer oil.
Gases in OLTC oil are generated owing to faults or normal operation, depending on the OLTC design. OLTC operations produce gases corresponding to D1 faults, in which the highest gas concentrations correspond to C2H2 and H2 [19,20].
The amount of C2H2 is usually less than the amount of H2 when electrical discharges occur in the transformer oil. When an electrical discharge is generated in the OLTC compartment, C2H2, due to its high solubility, leaks out of the OLTC compartment faster than H2 [21]. This results in a C2H2 concentration in the transformer oil greater than the H2 concentration. This transformer oil contamination from OLTC gases is known as communicating OLTC. When this occurs, the typical C2H2 concentration in the oil ranges from 2–20 ppm to 60–280 ppm according to the IEC guide [3].
In a previous study [16], a methodology to determine transformer oil contamination from OLTC gases was developed. This methodology was applied to 175 transformers with an OLTC. In the developed methodology, the criterion based on the C2H2/H2 ratio was applied to determine transformer oil contamination. Next, EK was applied, in which transformers with C2H2 concentrations equal to or higher than 10 ppm were studied considering the trend of their remaining DGA samples.
From this study, 26 power transformers were defined as contaminated by OLTC gas filtration in the main oil tank. These transformers had OLTC arc-breaking-in-oil (A-) and resistor (-R-) types. The number of power transformers with an OLTC design of a diverter switch and tap selector in the same oil compartment (-C) was 18, and the remaining 8 presented an OLTC design with the diverter switch and tap selector in different oil compartments (-S). Therefore, 18 power transformers defined as contaminated were of OLTC ARC type, and 8 were of OLTC ARS type.
The work presented in this article used the DGA results of the power transformers defined as contaminated in the previous study mentioned above. These DGA results correspond to those used to determine the contamination of the transformer and to the subsequent analyses carried out after the detection of the communicating OLTC. In order to make the working database reliable, the most recent DGA results were screened for abnormal or missing results according to the indications given in [4]. A total of 108 DGA results from 26 transformers were used in this study.

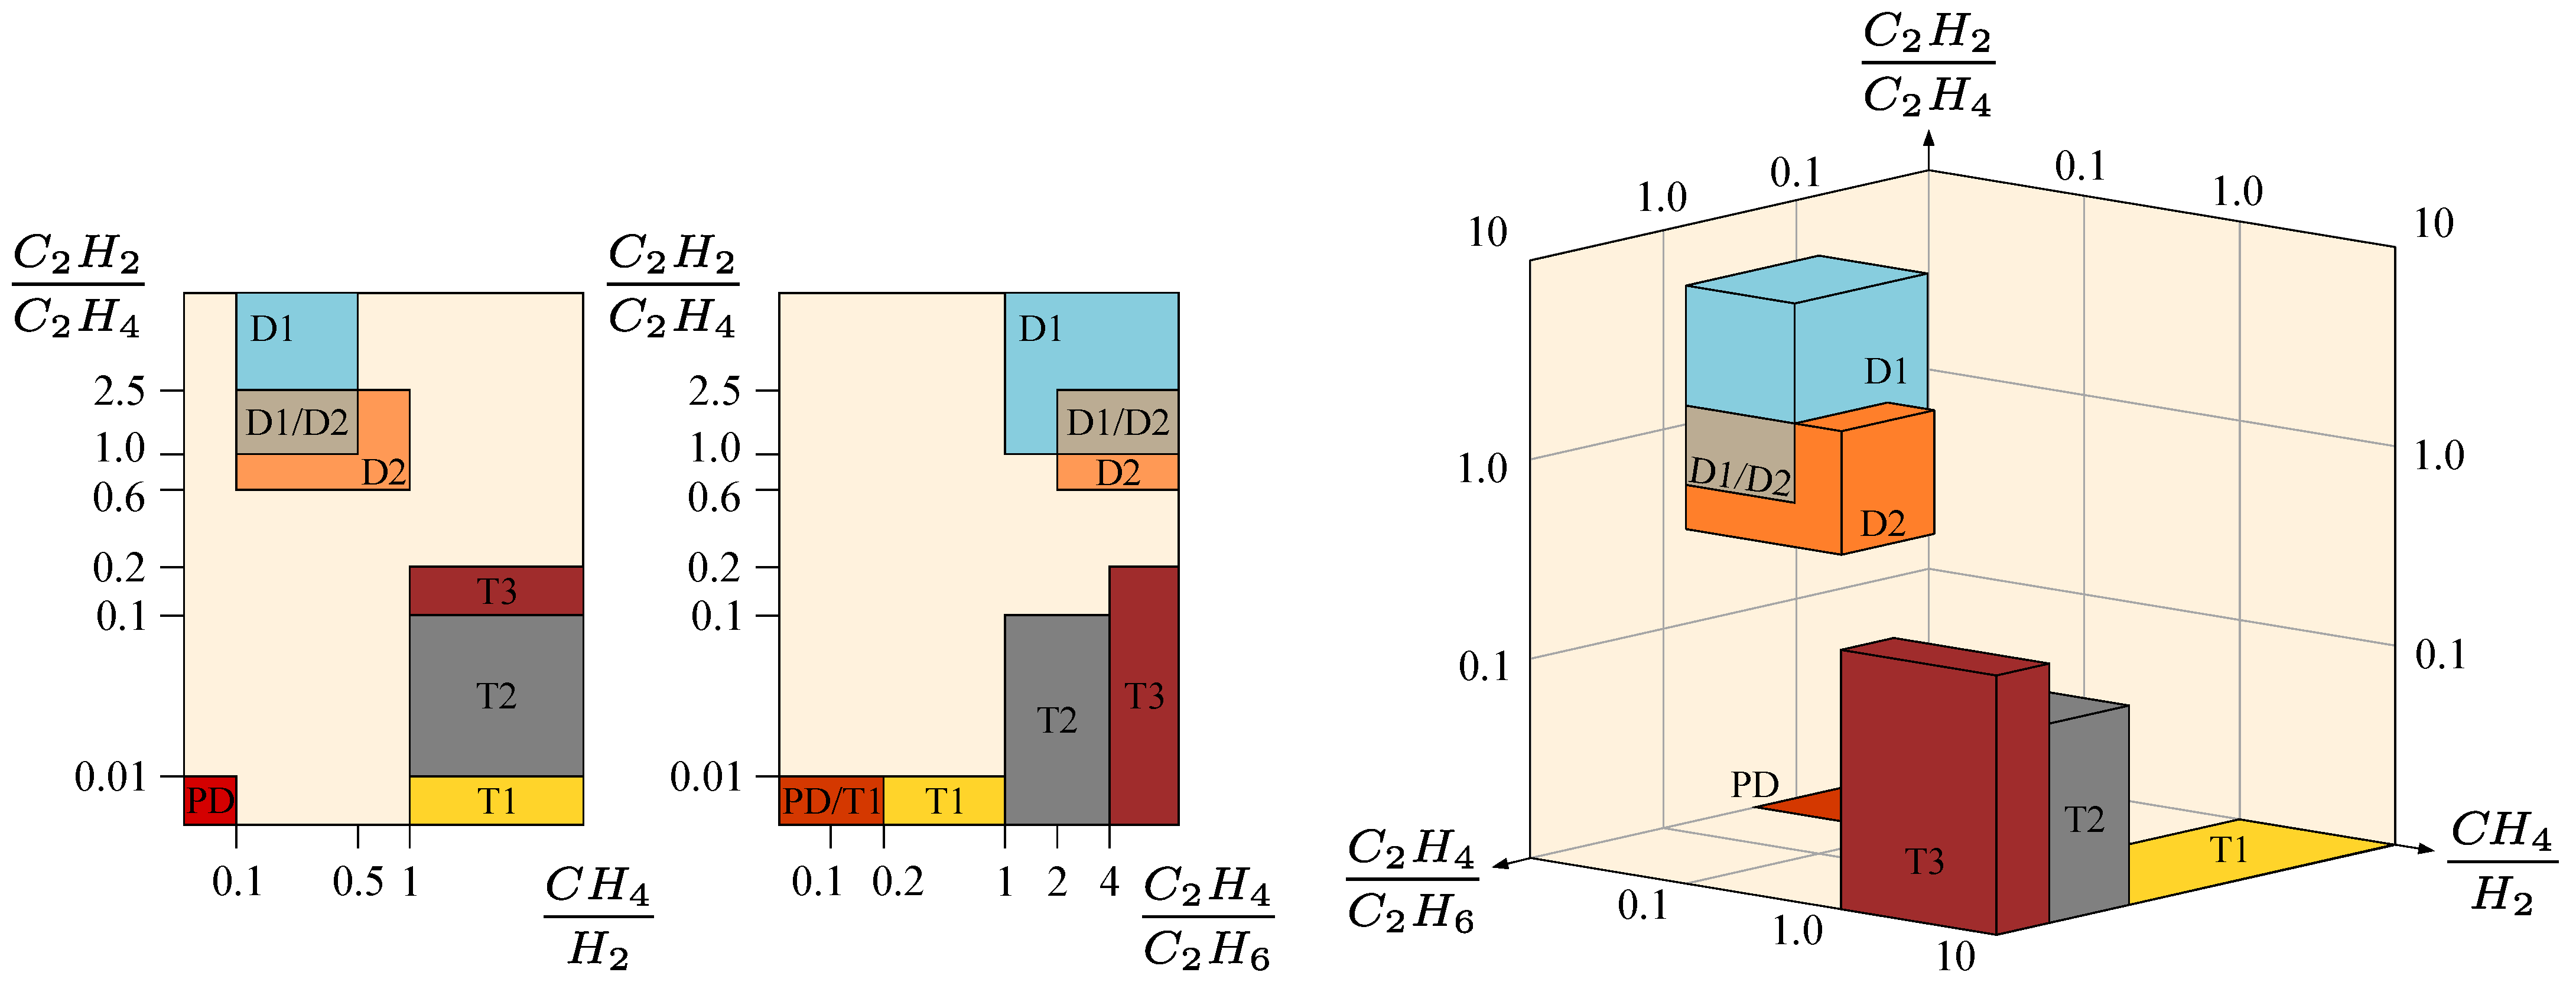
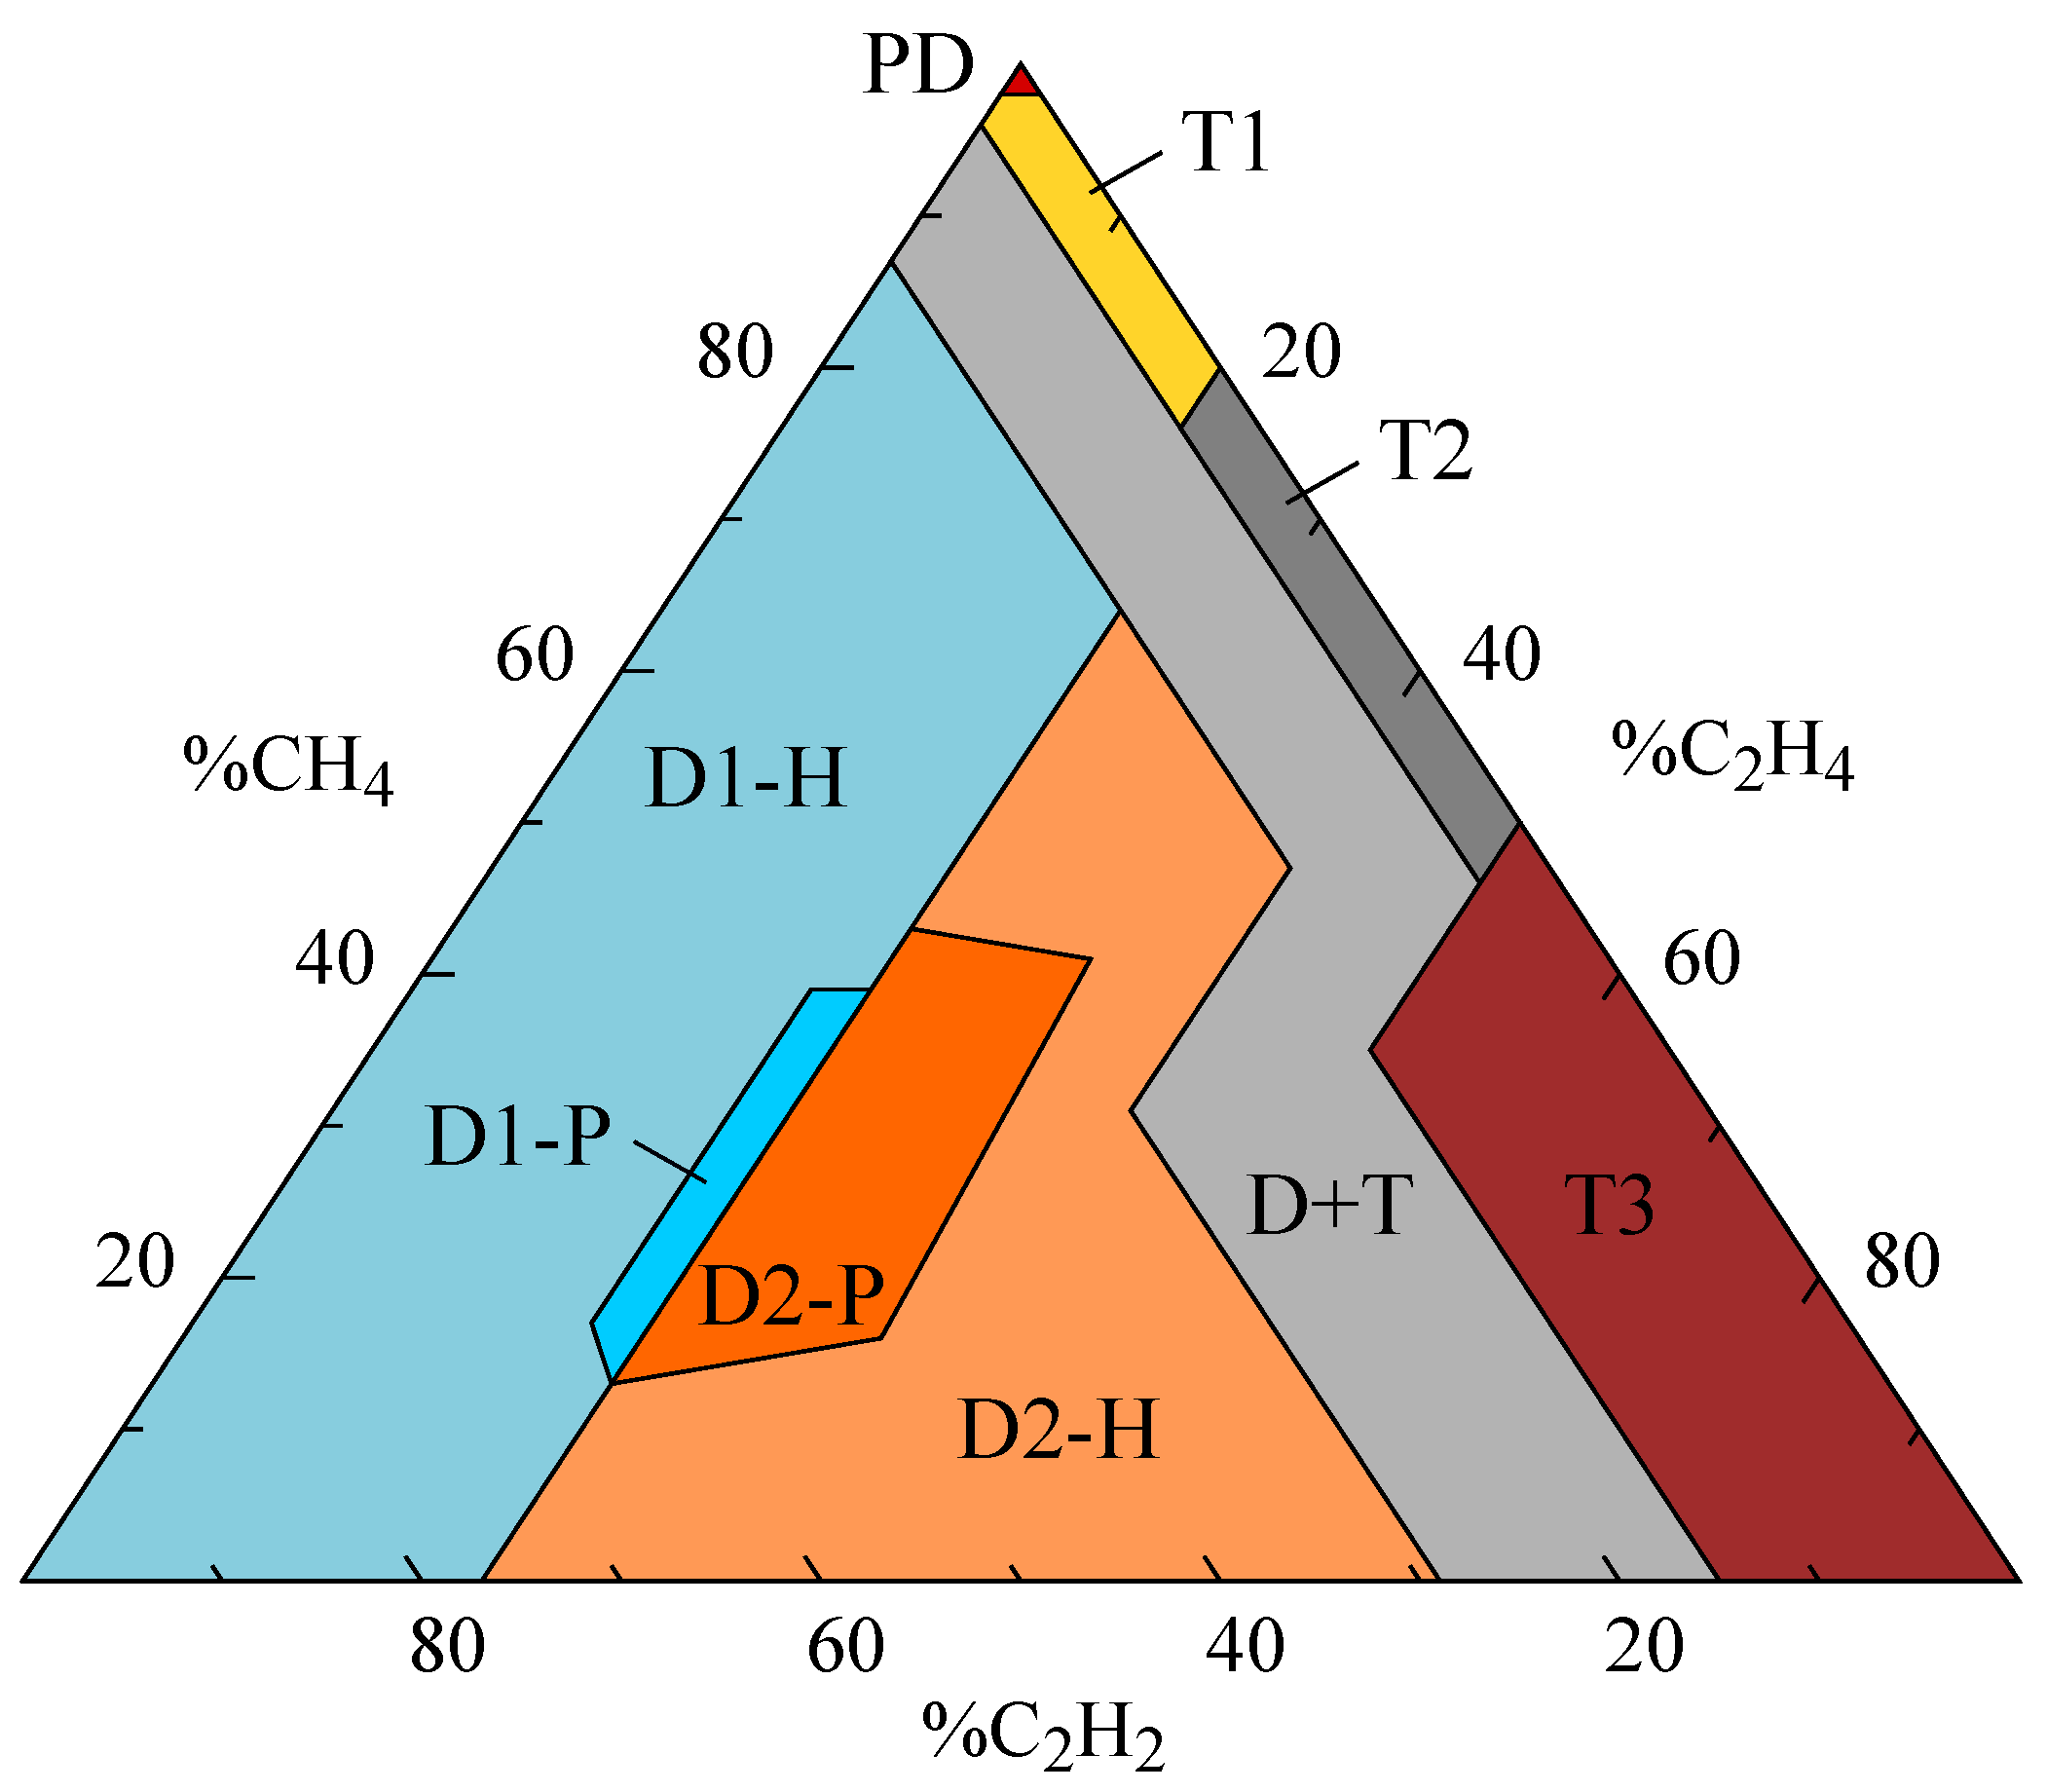
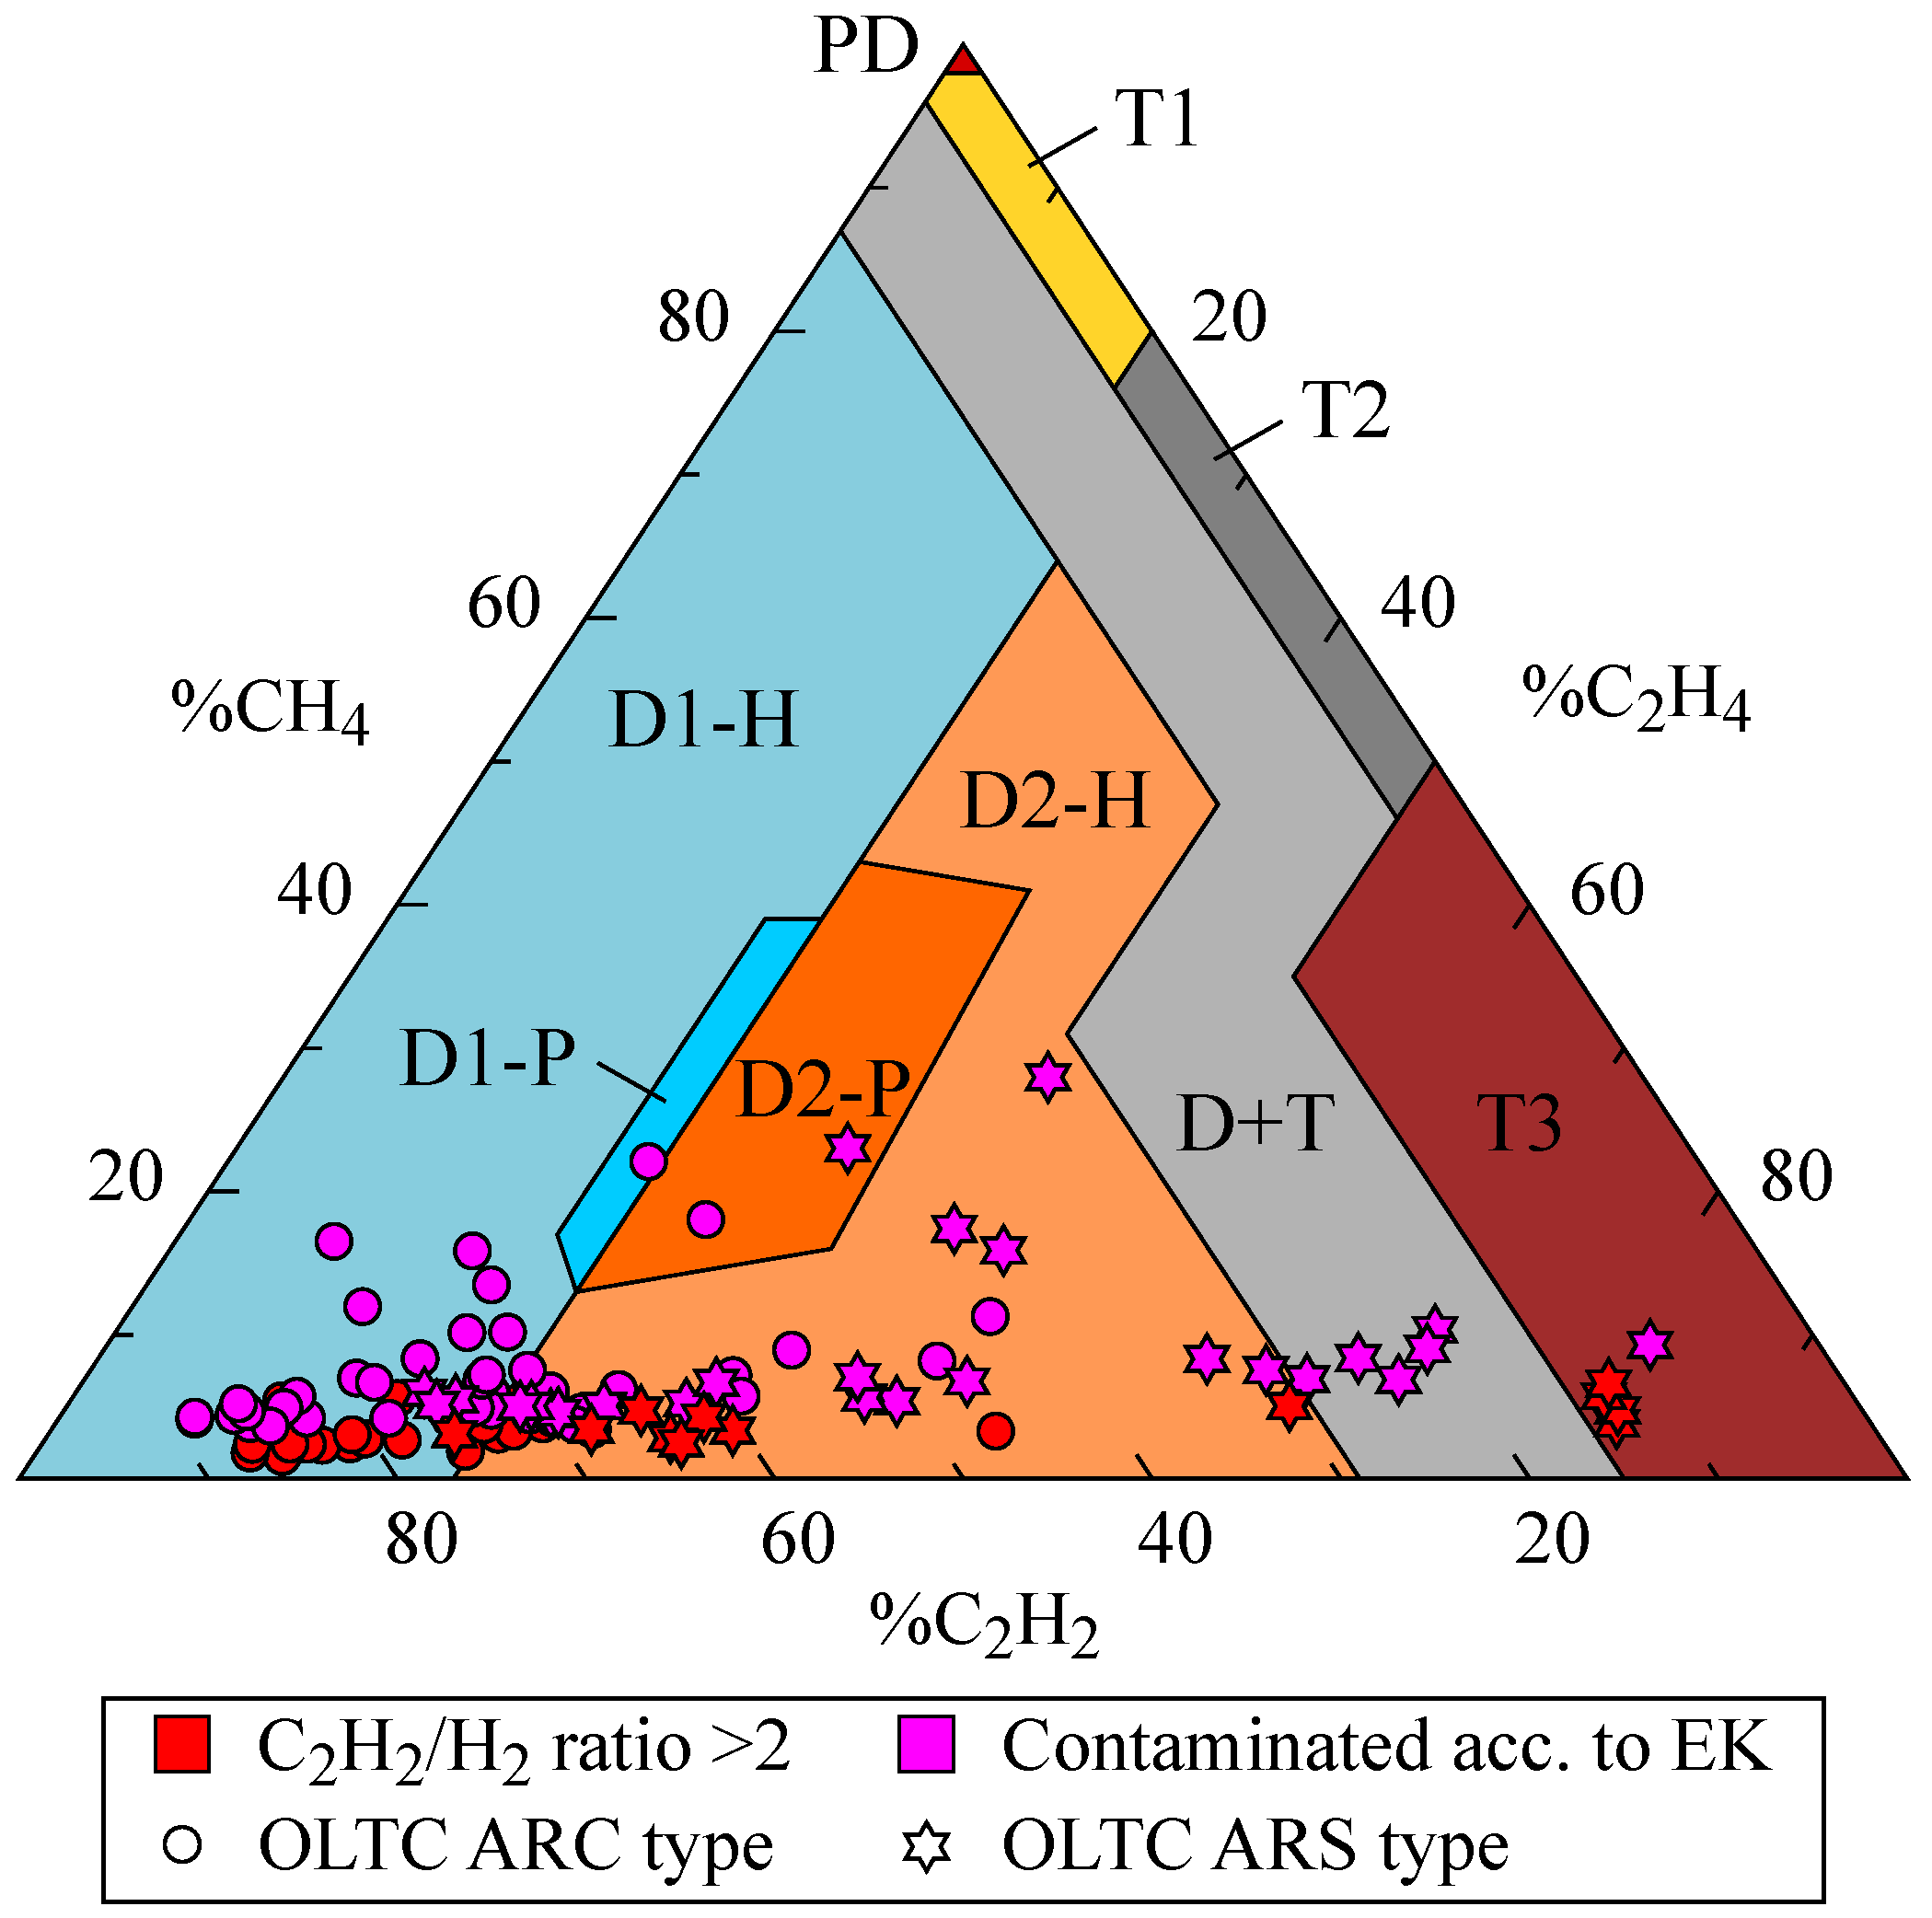
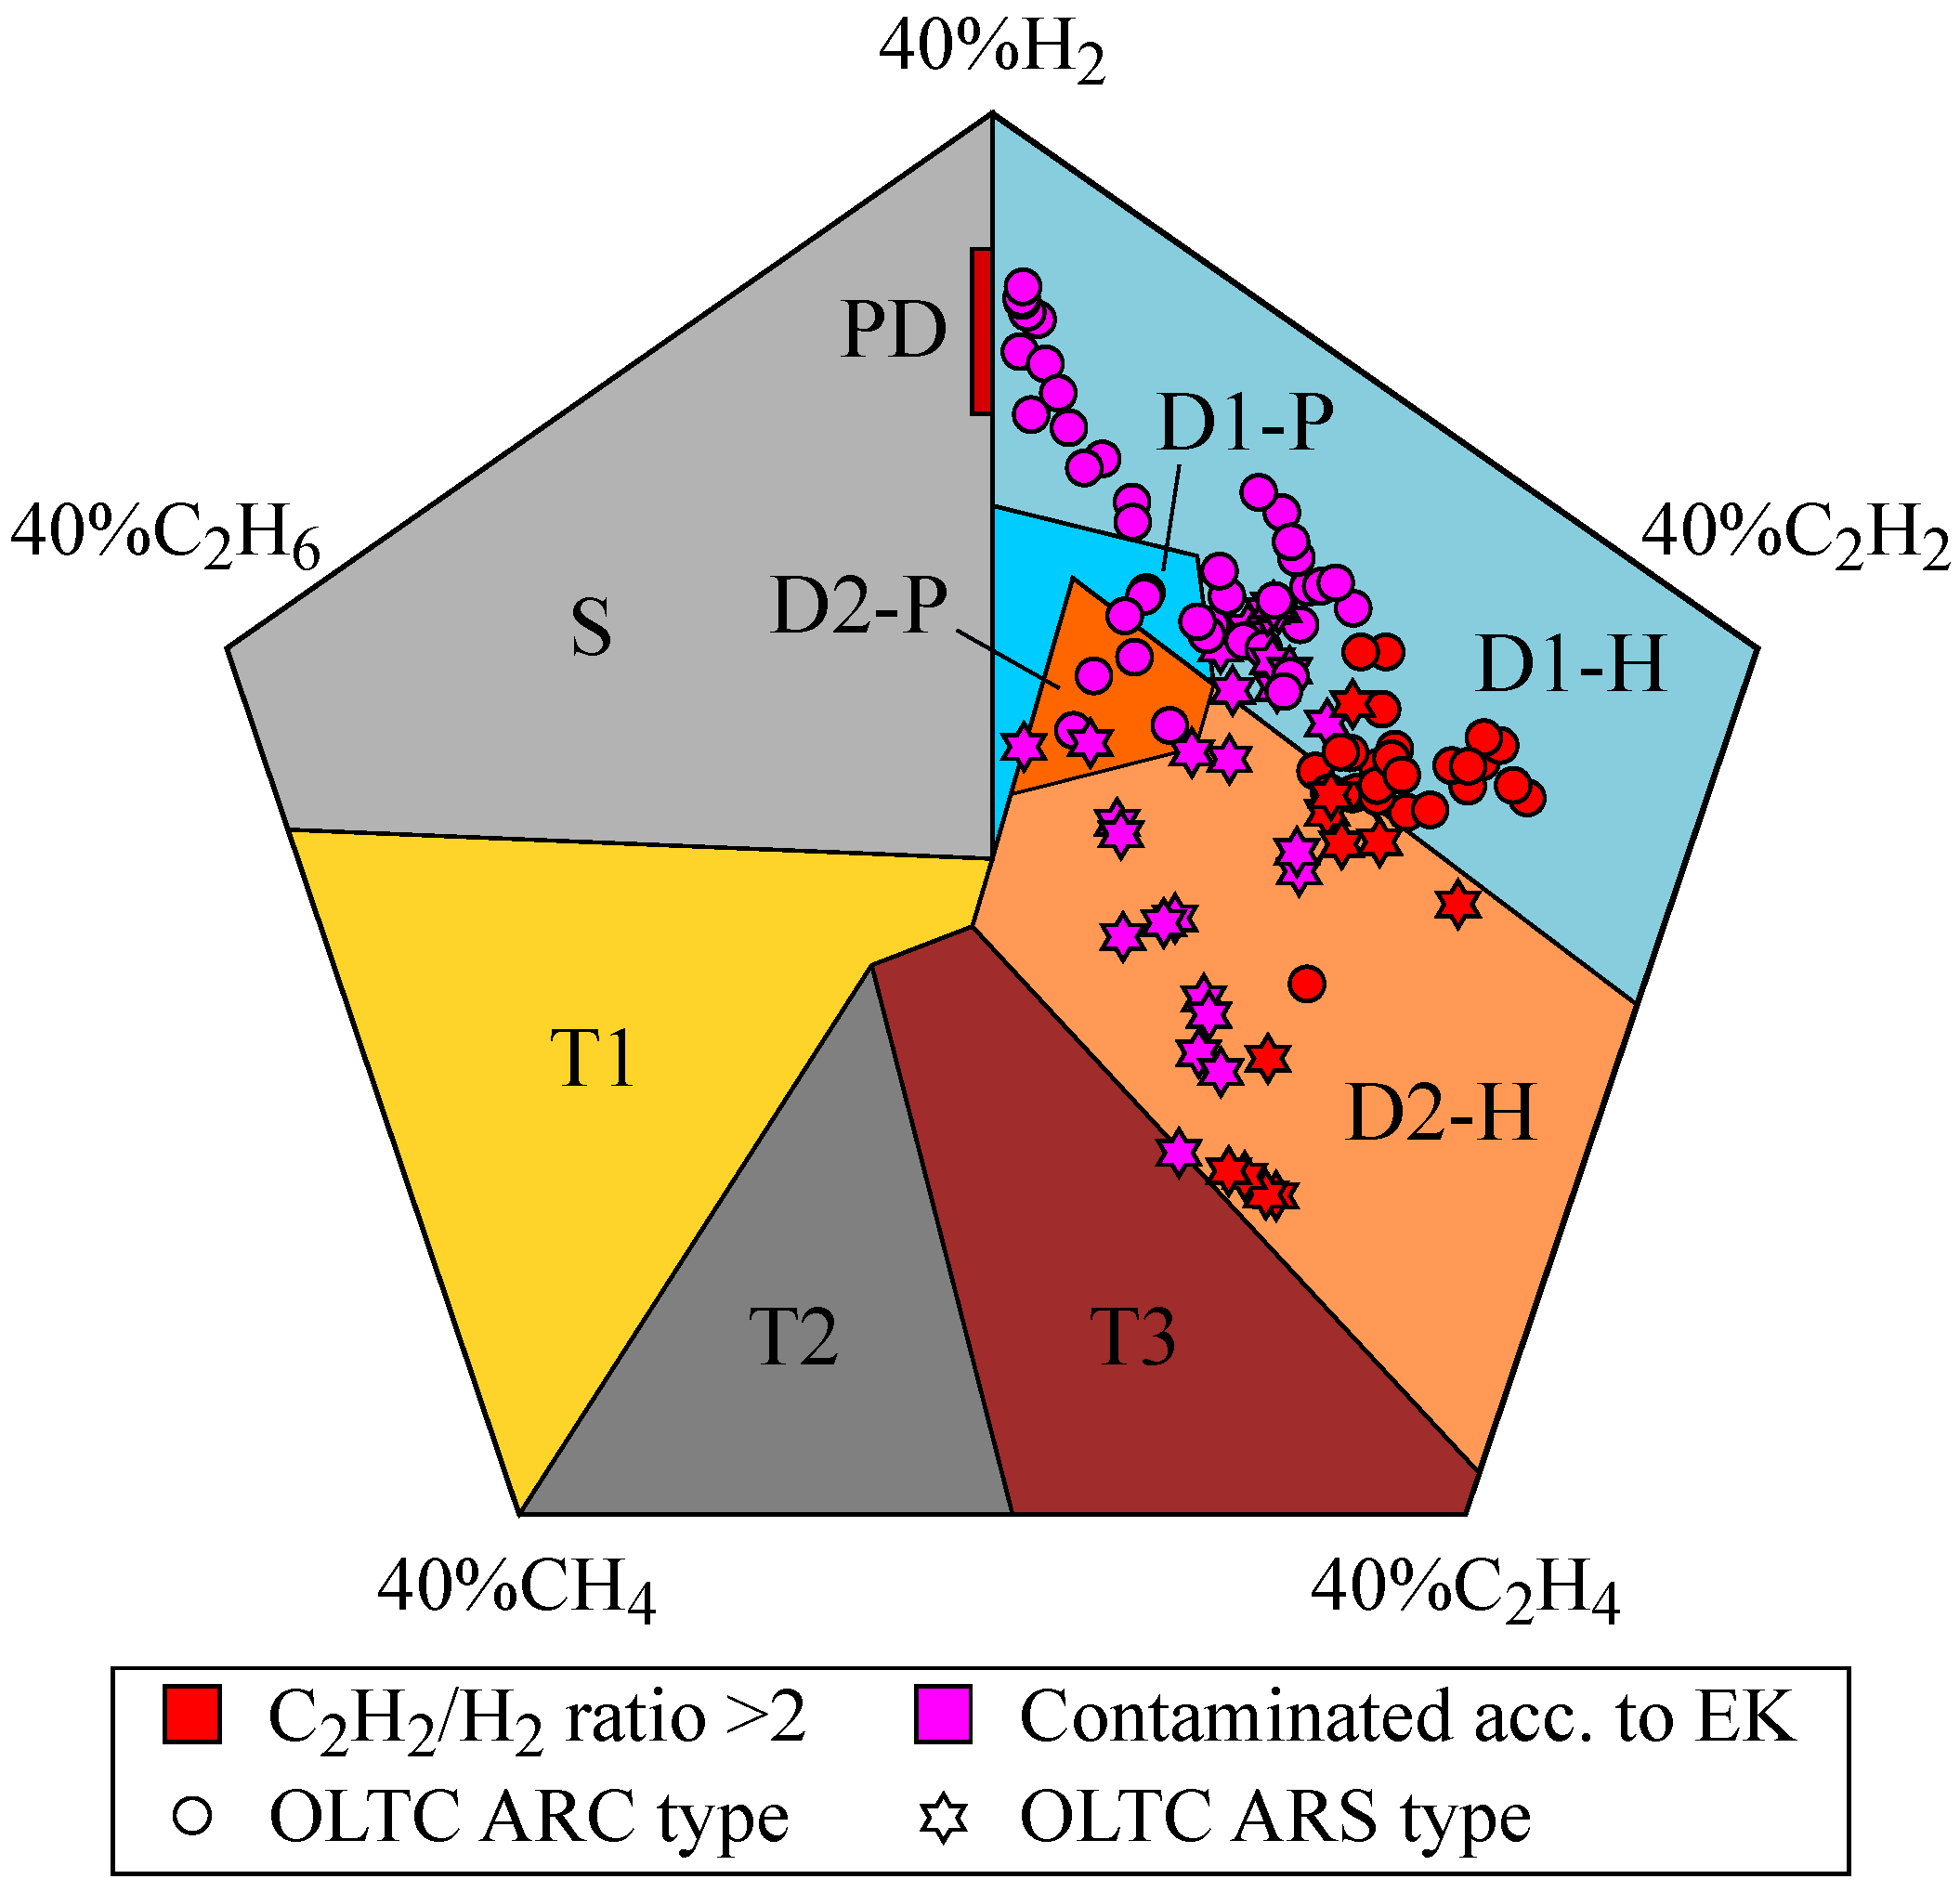
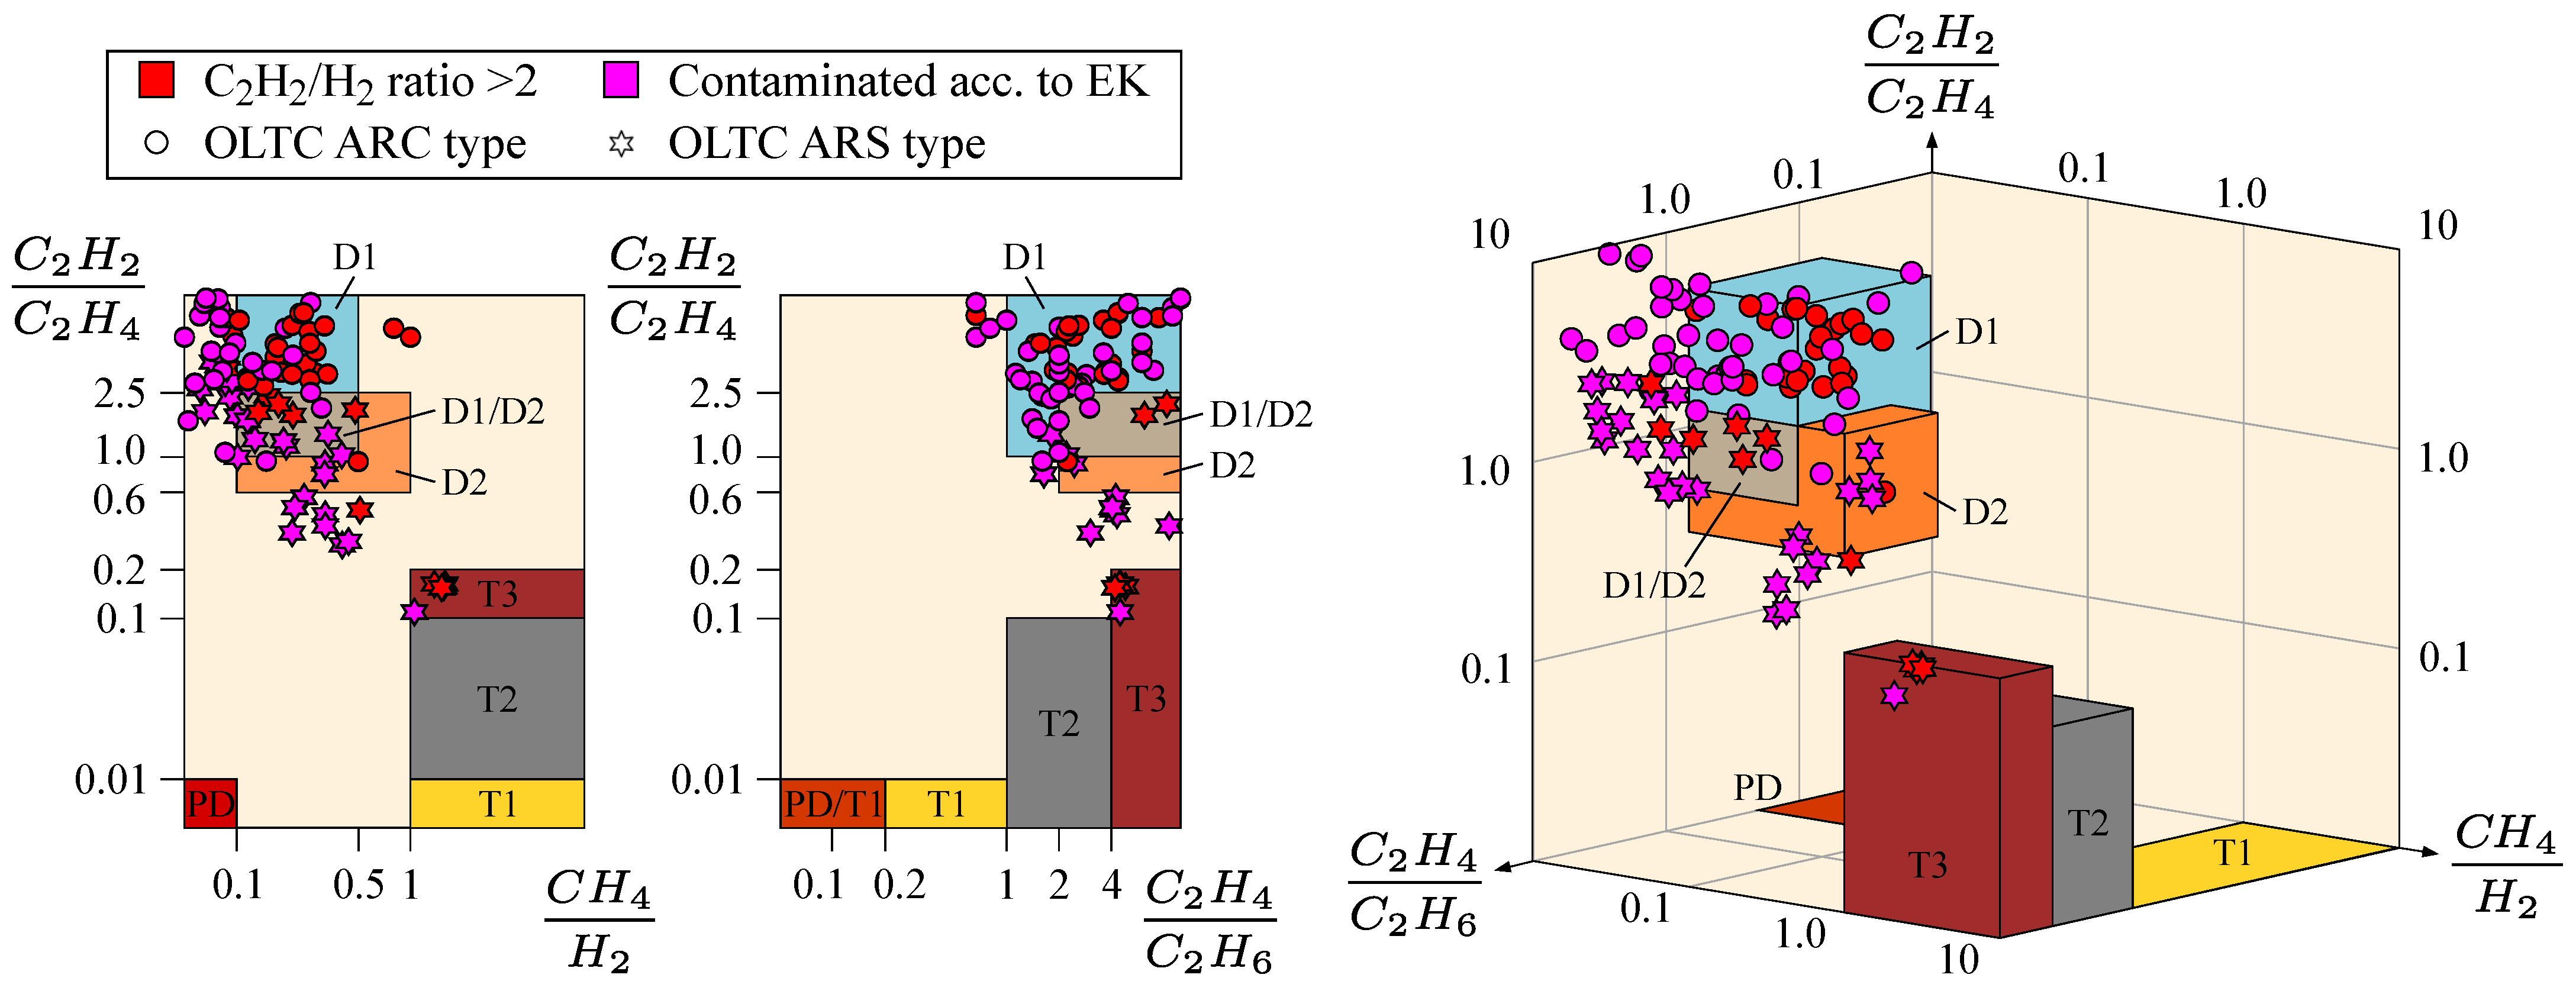
2.2. DGA Interpretation Methods

Power transformer fault-identification methods use the ratios of gas concentrations obtained from DGA to identify the fault. IRM, DTM, and DPM are the most commonly used methods listed in IEC and IEEE guidelines that allow visual representation of the data [3,4,17,18].
Following the screening of the DGA results described above, the fault-identification methods were then applied to the DGA samples of the transformers defined as contaminated. The selected methods to identify the fault of each DGA sample were DTM, DPM, and IRM. These methods were selected because a graphical representation was allowed. Thus, it was possible to observe the trend of the results.
IRM uses three gas concentration ratios to identify six faults, as shown in Table 2. From the ratios obtained in several DGA samples, it is possible to make a graphical representation of the evolution of the fault over time by plotting the ratios on three or two axes, as shown in Figure 1.
DTM uses three gas concentrations to identify the transformer faults. The gases used by DTM are CH4, C2H2, and C2H4. In DTM, a graphical representation is generated to identify the fault type using the percentages of the three gases, as shown in Figure 2. Such percentages are calculated as follows:
% C 2 H 2 = 100 x x + y + z % C 2 H 4 = 100 y x + y + z % C H 4 = 100 z x + y + z
where x, y, and z are the concentrations of C2H2, C2H4, and CH4, respectively, in ppm.
The graphical representation of several DGA samples allows for determining the fault trend. The coordinates of each DTM fault zone defined in Figure 2, expressed in relative percentages of CH4, C2H4, and C2H2, are as follows:
  • T1: (98, 2, 0), (98, 0, 2), (96, 0, 4), (76, 20, 4), (80, 20, 0)
  • T2: (80, 20, 0), (76, 20, 4), (46, 50, 4), (50, 50, 0)
  • T3: (50, 50, 0), (46, 50, 4), (35, 50, 15), (0, 85, 15), (0, 100, 0)
  • D+T: (96, 0, 4), (87, 0, 13), (64, 23, 13), (47, 40, 13), (31, 40, 29), (0, 71, 29), (0, 85, 15), (35, 50, 15), (46, 50, 4), (76, 20, 4)
  • PD: (98, 2, 0), (98, 0, 2), (100, 0, 0)
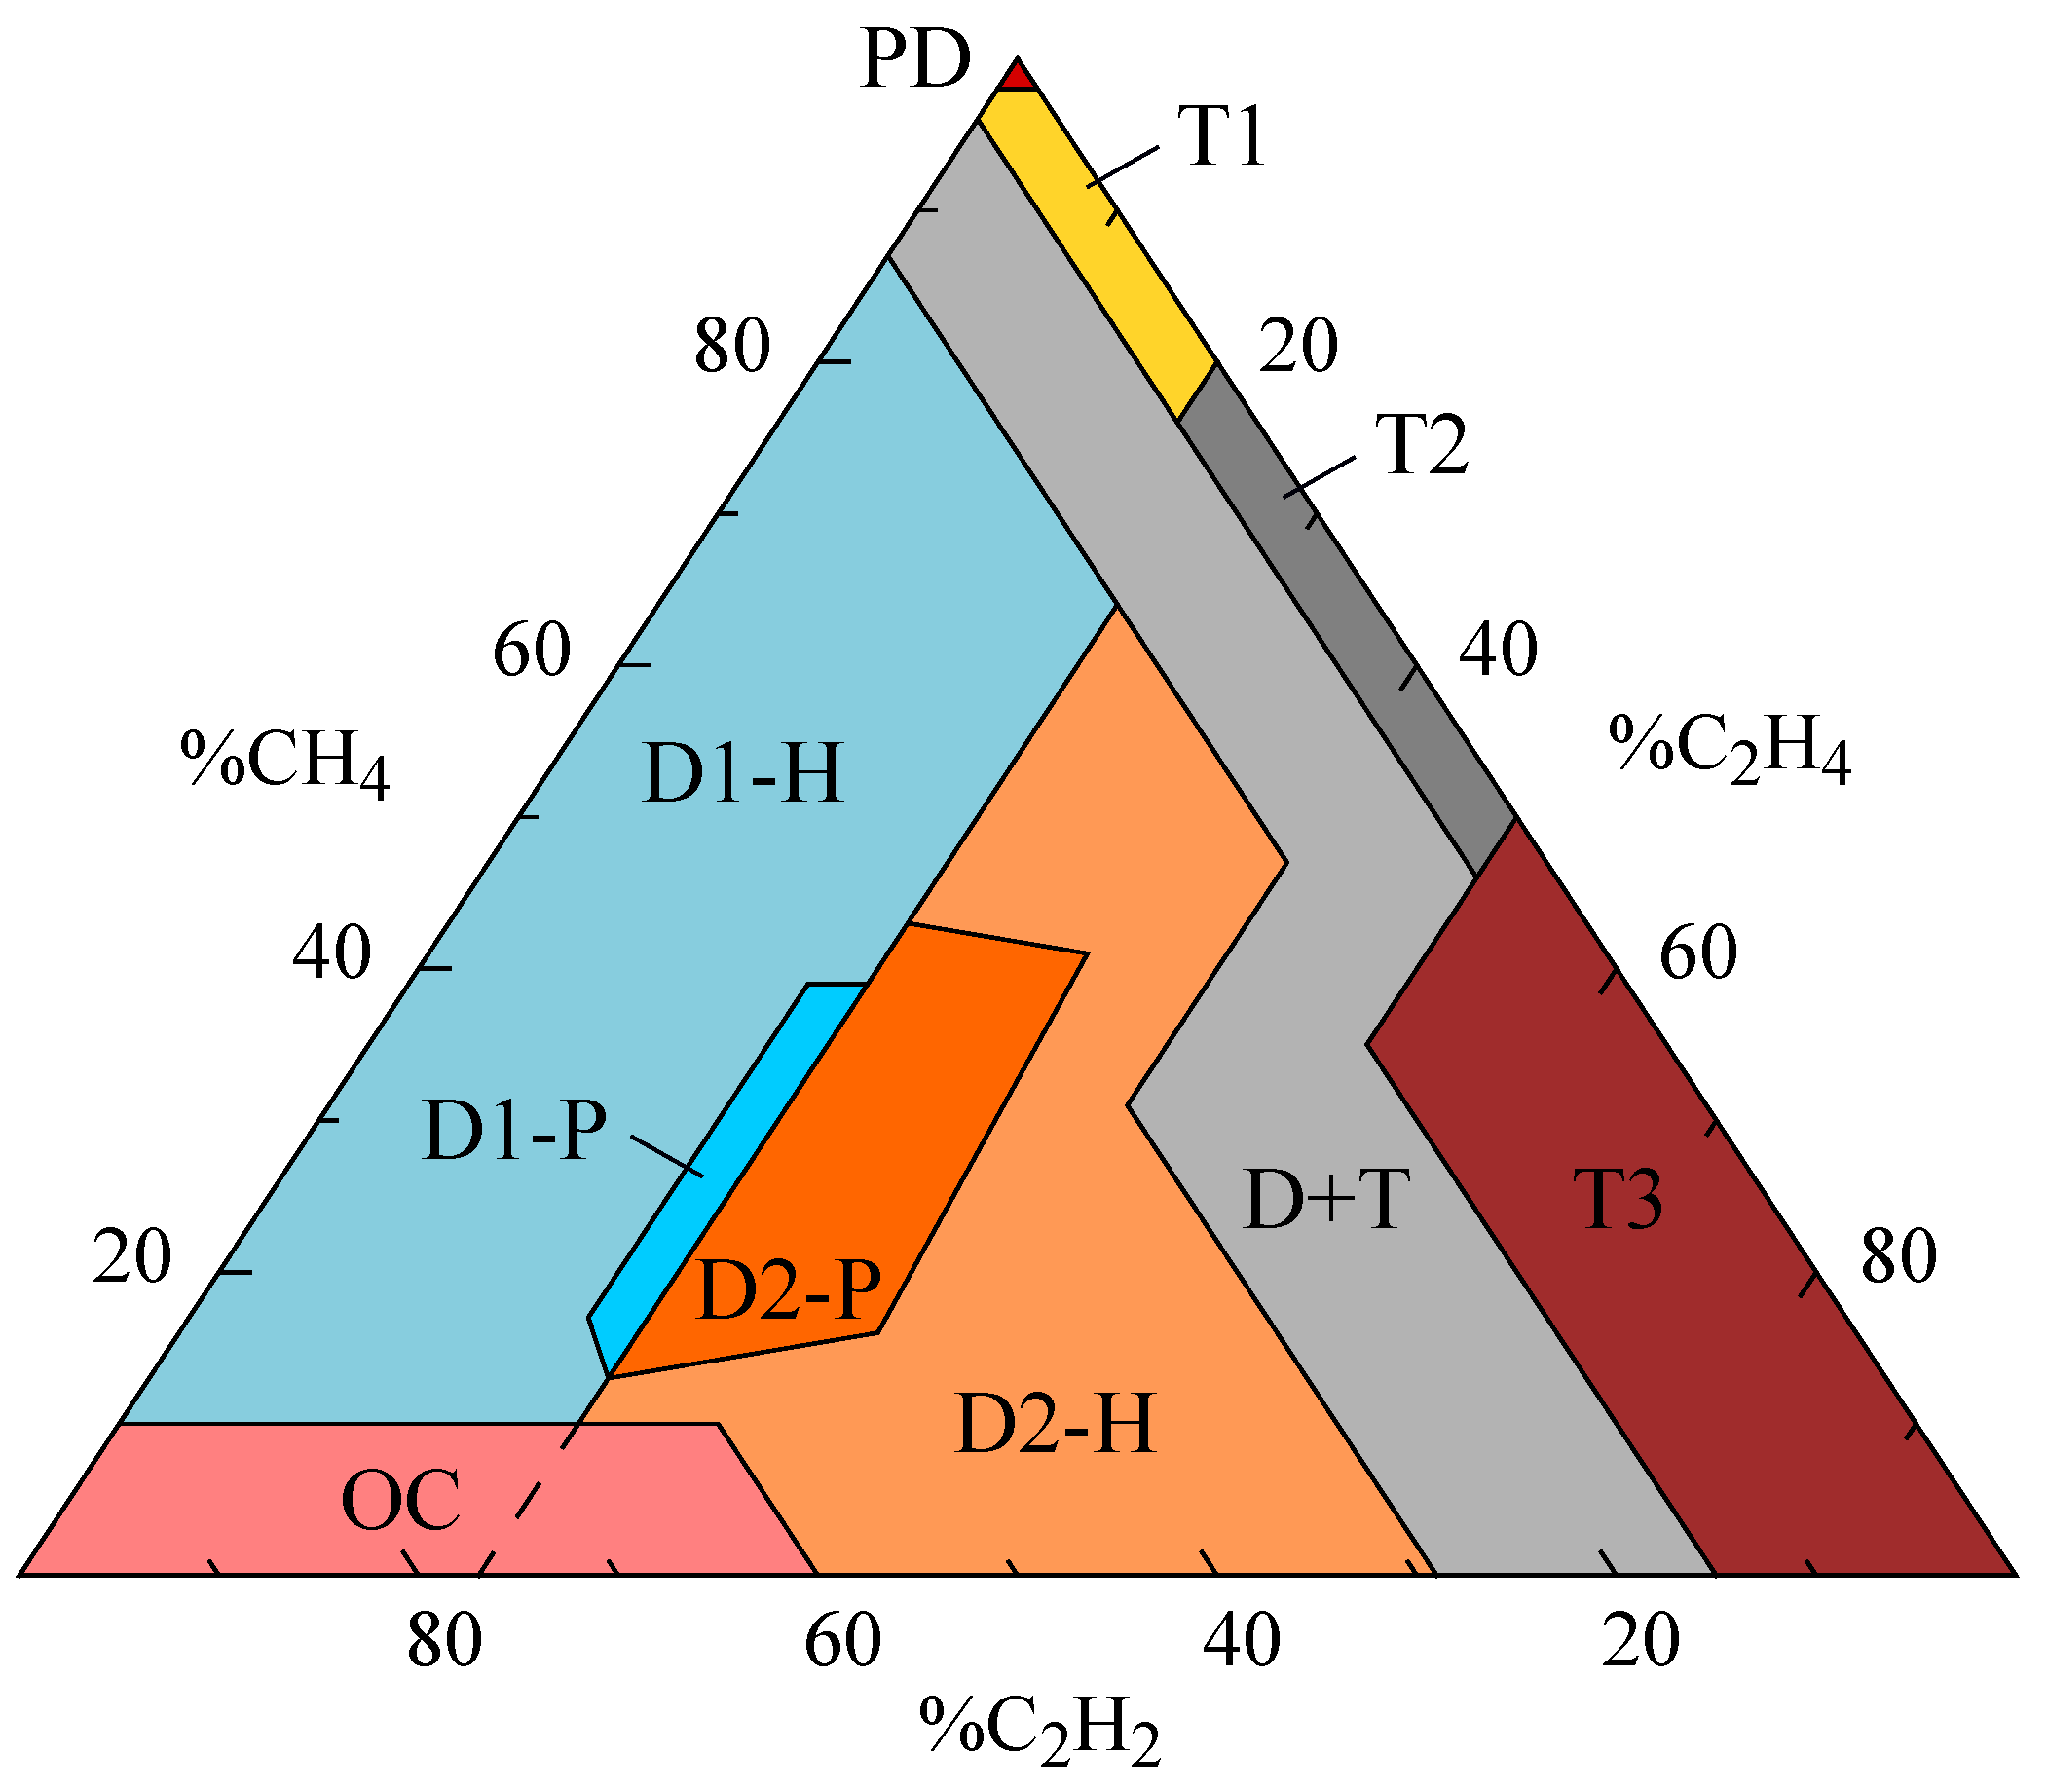
  • D1-H: (43, 23, 34), (64, 23, 13), (87, 0, 13), (0, 0, 100), (0, 23, 77), (13, 23, 64), (17, 20, 63), (39, 20, 41), (39, 23, 38)
  • D1-P: (39, 23, 38), (39, 20, 41), (17, 20, 63), (13, 23, 64)
  • D2-H: (0, 23, 77), (0, 71, 29), (31, 40, 29), (47, 40, 13), (64, 23, 13), (43, 23, 34), (41, 33, 26), (16, 35, 49), (13, 23, 64)
  • D2-P: (43, 23, 34), (41, 33, 26), (16, 35, 49), (13, 23, 64)
DPM uses five gas concentrations to define the transformer faults. As in IRM, DPM identifies the same six faults plus stray gassing (S). The gases used by DPM are C2H4, H2, C2H2, C2H6, and CH4. In DPM, the transformer fault is identified through a graphical representation of a pentagon. Each axis connecting the center of the pentagon to its vertices is associated with a gas, with 40% of the gas concentrations at the vertices, as shown in Figure 3.
The relative percentage of each gas is placed on the gas axes. The relative percentage of each gas is calculated using the following equations:
% H 2 = 100 v v + w + x + y + z % C 2 H 2 = 100 w v + w + x + y + z % C 2 H 4 = 100 x v + w + x + y + z % C H 4 = 100 y v + w + x + y + z % C 2 H 6 = 100 z v + w + x + y + z
where v, w, x, y, and z are the concentrations of H2, C2H2, C2H4, CH4, and C2H6, respectively, in ppm.
By plotting the five gas percentages of a DGA sample over the pentagon, an irregular polygon is obtained. The centroid of this irregular polygon identifies the fault type. The equations for calculating the centroid are:
C x = 1 6 A i = 0 n 1 ( x i + x i + 1 ) ( x i y i + 1 x i + 1 y i ) C y = 1 6 A i = 0 n 1 ( y i + y i + 1 ) ( x i y i + 1 x i + 1 y i ) A = 1 2 i = 0 n 1 ( x i y i + 1 x i + 1 y i )
where x i and y i are the coordinates of the five points, A is the area of the irregular polygon, and C x and C y are the coordinates of the centroid.
The coordinates of each DPM fault zone are as follows:
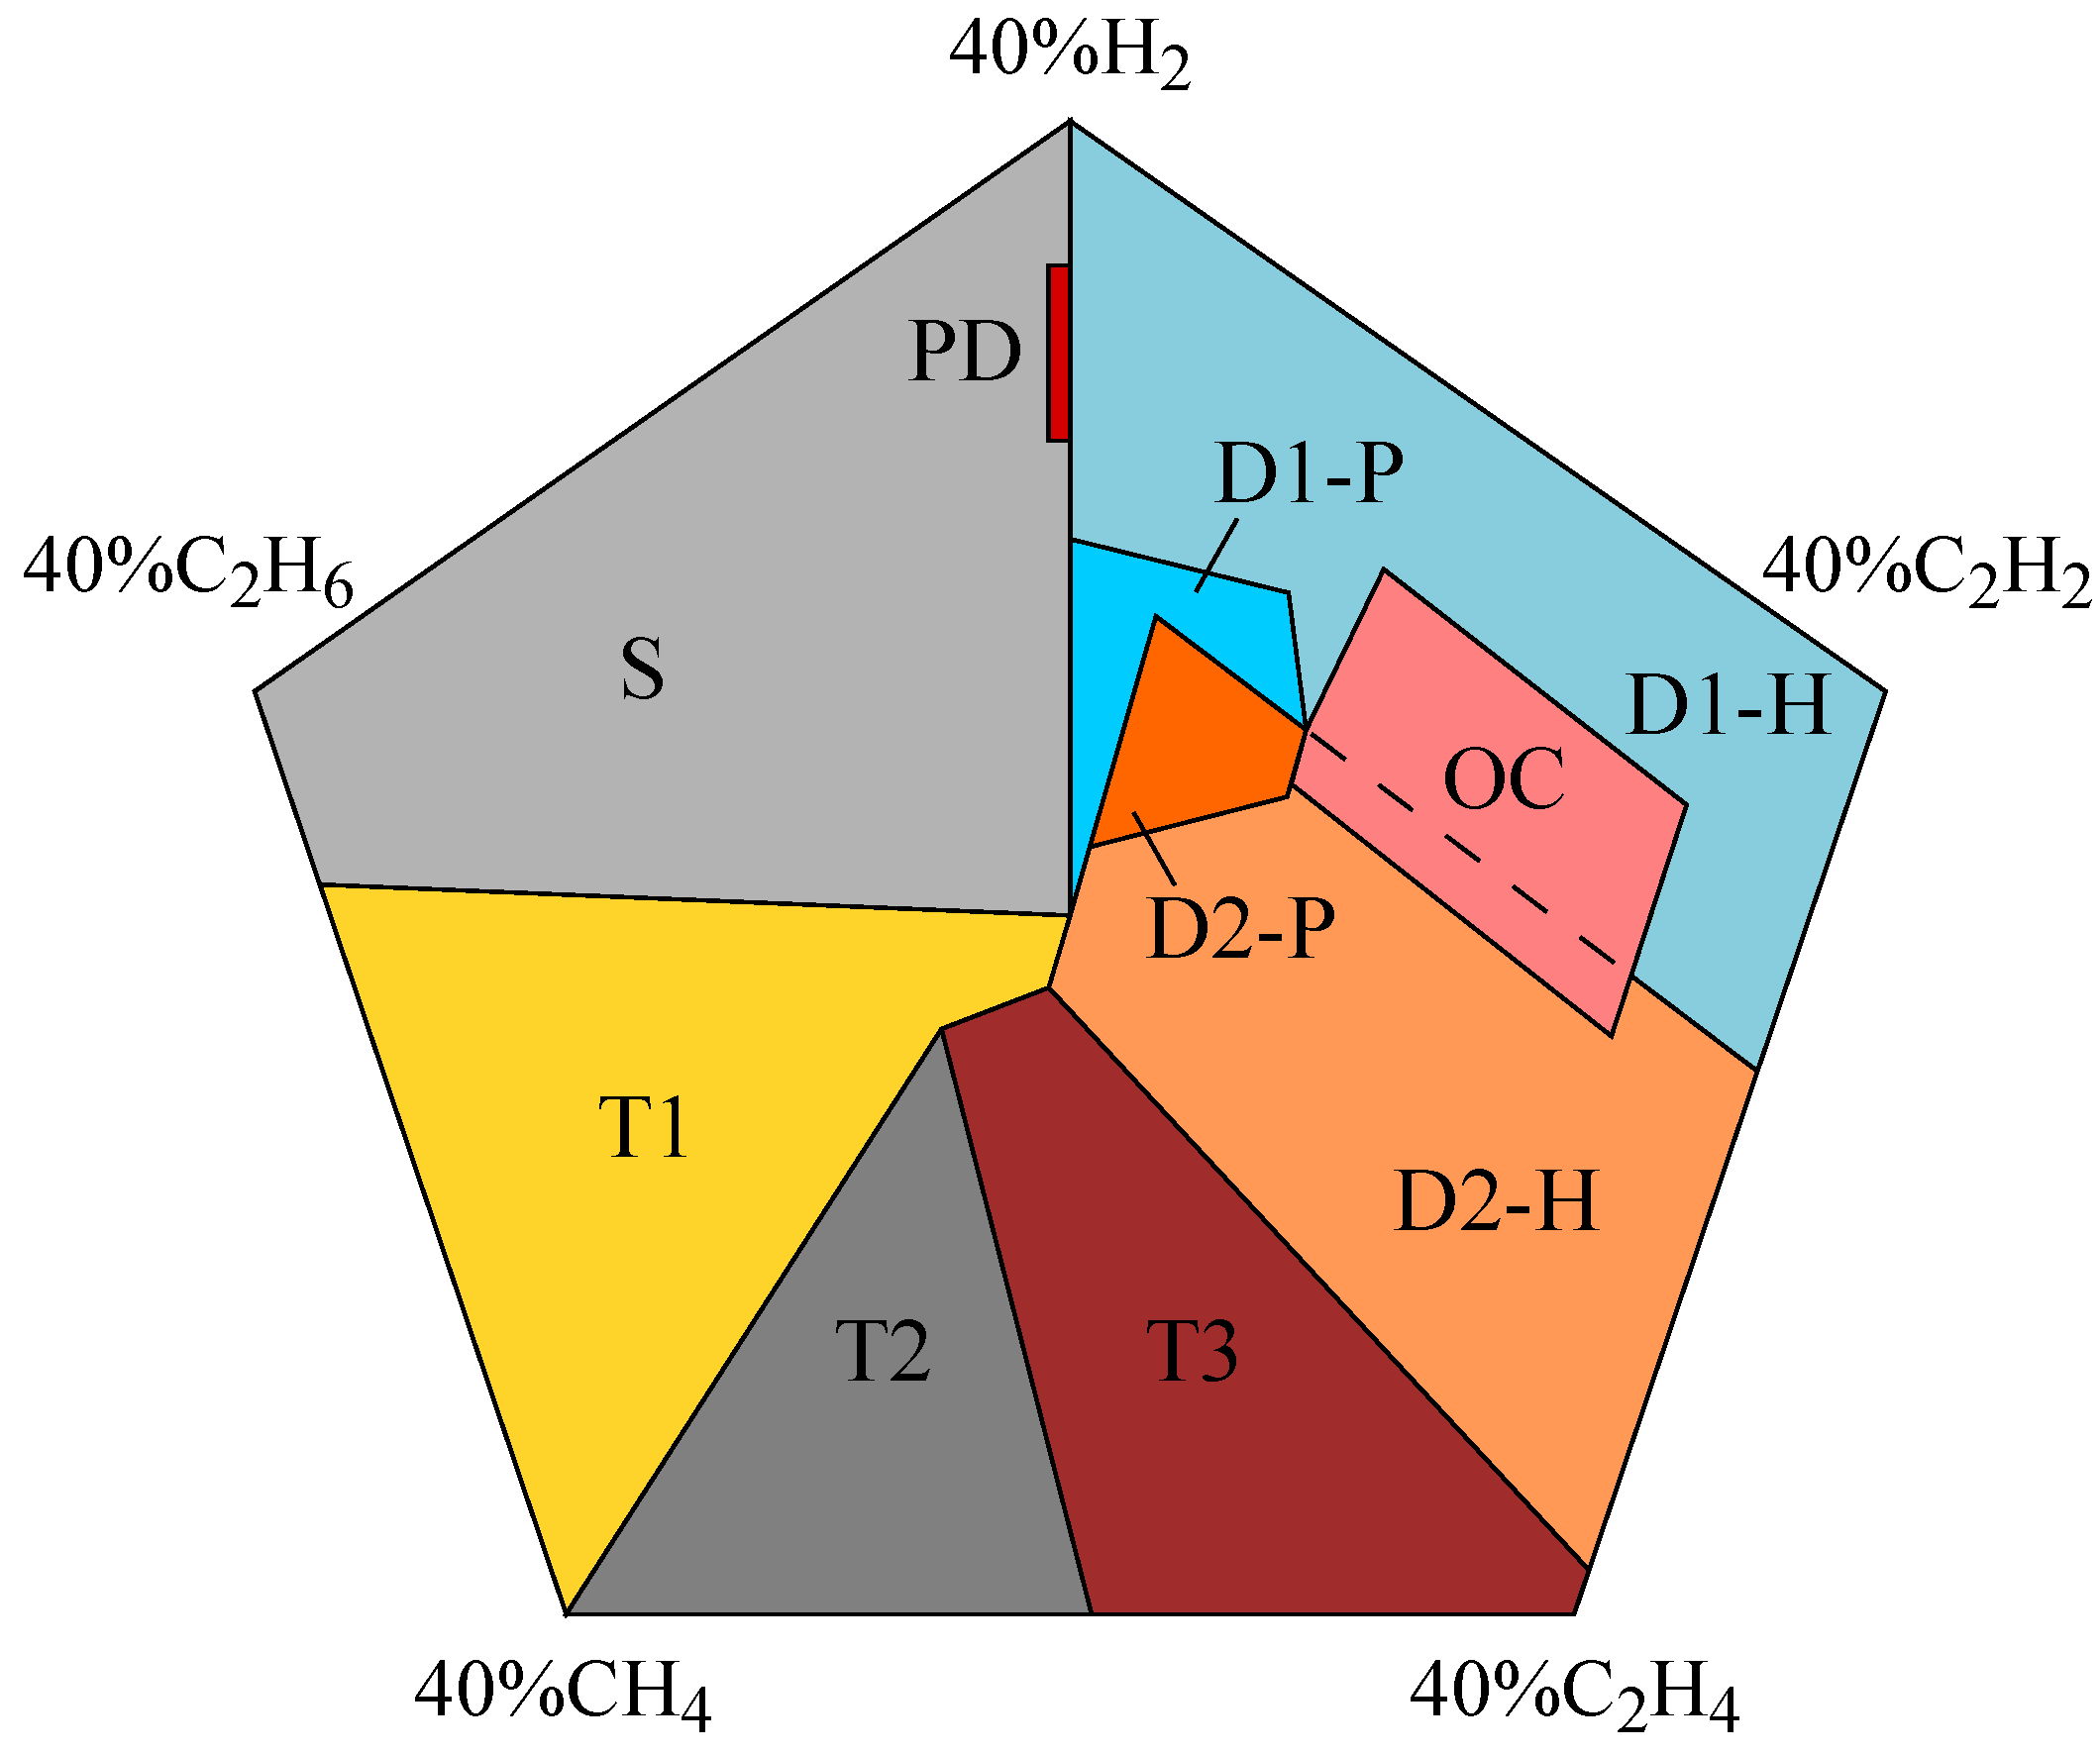
  • PD: (0, 24.5), (0, 33), (−1, 24.5), (−1, 33)
  • D1-H: (0, 40), (38, 12), (32, −6), (11.03, 10.56), (10.19, 17.14), (0, 19.74)
  • D1-P: (0, 1.5), (0, 19.74), (10.19, 17.14), (11.03, 10.56), (4, 16), (0.97, 4.84)
  • D2-H: (11.03, 10.56), (32, −6), (24, −30), (−1, −2), (0, 1.5), (0.97, 4.84), (10.12, 7.25)
  • D2-P: (4, 16), (11.03, 10.56), (10.12, 7.25), (0.97, 4.84)
  • T3: (24, −30), (−1,−2), (−6,−4), (1, −32)
  • T2: (1, −32), (−6, −4), (−22.5, −32)
  • T1: (−22.5, −32), (−6, −4), (−1, −2), (0, 1.5), (−35, 3)
  • S: (−35, 3), (0, 1.5), (0, 24.5), (0, 33), (−1, 24.5), (−1, 33), (0, 40)
After applying the fault-identification methods described above to the DGA database of contaminated transformers, this work studied the pattern of results obtained. Then, based on the pattern of results obtained, this study proposes several modifications of the fault-identification methods in power transformer insulation. Finally, these modifications are tested and validated against several DGA results collected in references.

3. Application of Traditional DGA Interpretation Methods to Contaminated Transformers Data

This section presents the results of applying traditional fault-identification methods (IRM, DTM, and DPM) to the DGA results of contaminated transformers. Starting from the DGA database of contaminated power transformers explained in the previous section, this section analyses the pattern of results obtained in IRM, DTM, and DPM.
The pattern of results obtained using the DTM is shown in Figure 4. As shown in Figure 4, most of the DGA samples were concentrated in the zones that indicate arcing faults in oil (D1-H and D2-H), where the C2H2 percentage was higher than 60%, and the CH4 and C2H4 percentages were less than 10% and 40%, respectively. Several DGA samples were concentrated in the zones that indicate thermal faults (D+T and T3). According to these results, the samples presented a mixture of thermal faults and oil contamination from OLTC gases, given that C2H2 concentrations were higher than those generated in thermal faults.
The results of applying the DPM to the DGA samples from contaminated transformers are shown in Figure 5. The results of DGA samples from transformers determined to be contaminated according to the C2H2/H2 ratio criterion were in a very small area of D1-H and D2-H faults. Several DGA samples approached the boundary between faults D2-H and T3, which were from the same transformer that, as previously mentioned regarding DTM results, presented a mixture of thermal faults and oil contamination.
The results of DGA samples from the transformers defined as contaminated according to EK were dispersed in D1 and D2 fault zones. This is because the predominant gas was not only C2H2 in these DGA samples, and H2 and C2H4 concentrations were higher than in the case of application of the C2H2/H2 ratio criterion.
Figure 6 shows the results of applying IRM to DGA samples. As in the previous cases, the results were concentrated near and in the D1 and D2 fault zones. Samples of the transformer with a mixture of thermal faults and oil contamination were placed in fault zone T3, as expected. By applying this method, many results did not return fault identification, which is one of the disadvantages of IRM.
As a summary, Table 3 shows the number and types of faults identified by each of the selected methods. In DTM and DPM, the majority of results indicated D1-H and D2-H faults, 95 out of 108 DGA samples in both cases. In IRM, 33 DGA samples were identified as D1 or D2 faults, 5 as T3 faults, and 70 were not identified whatsoever.

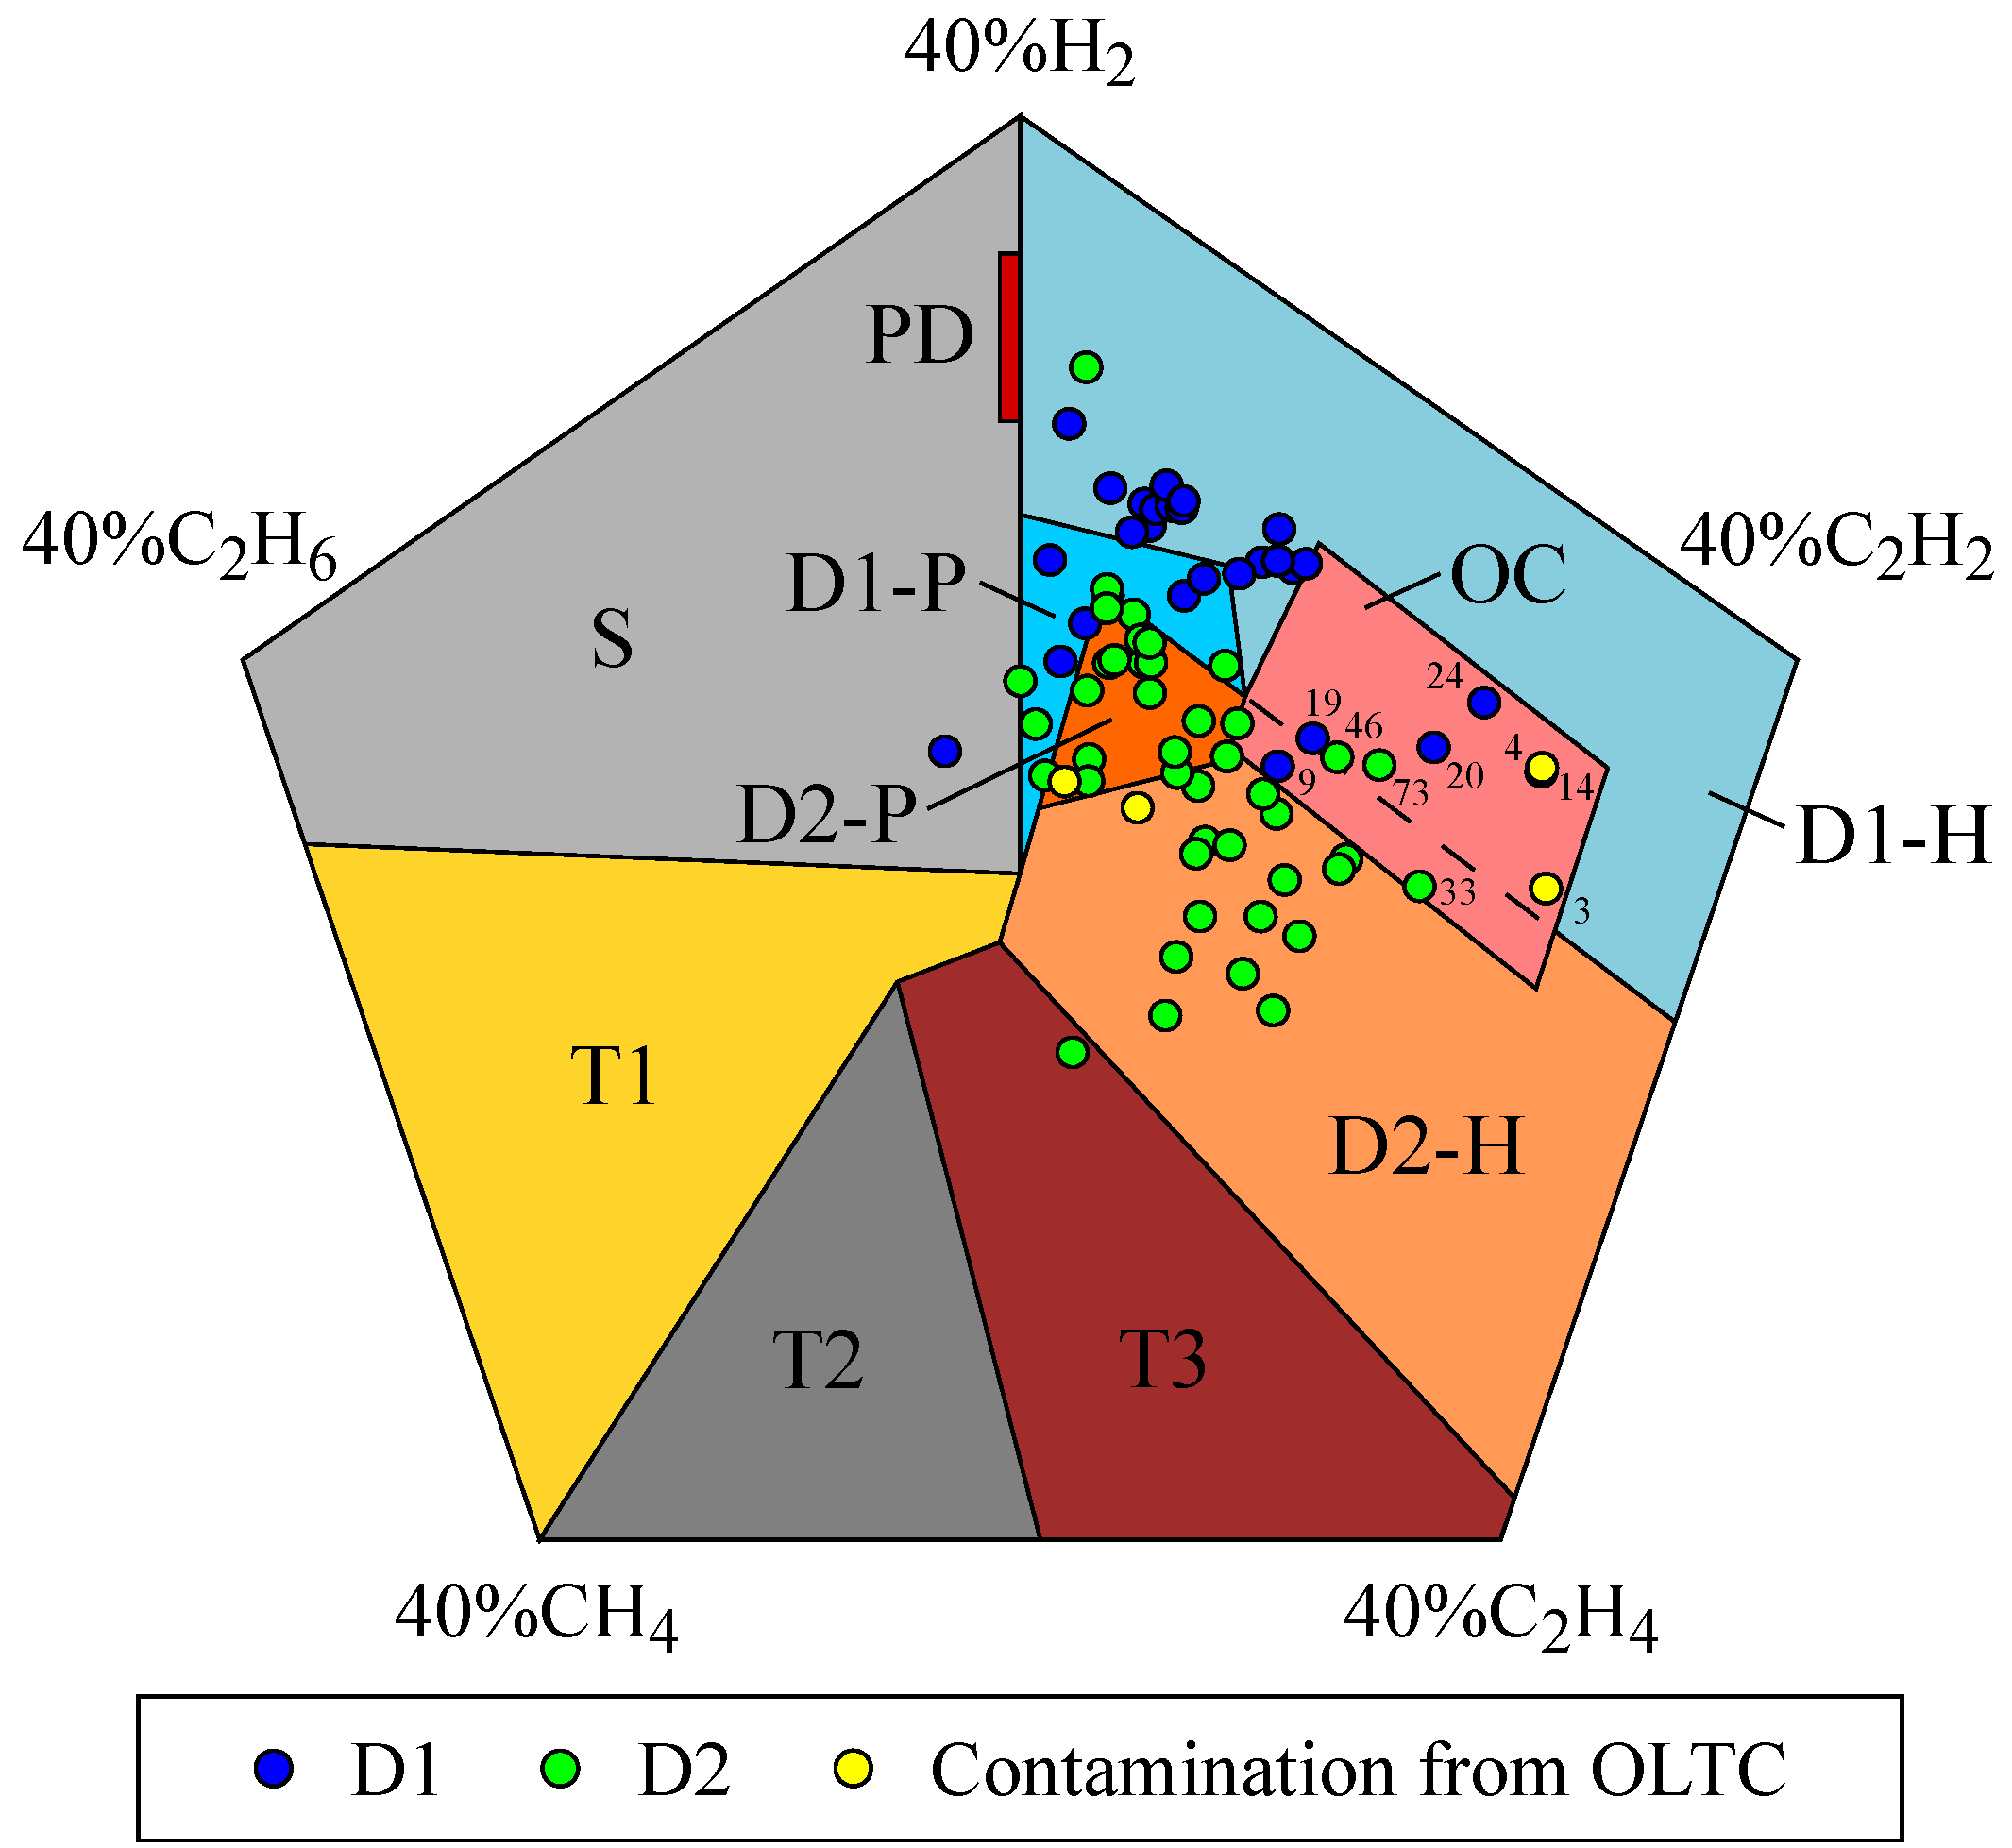
4. DTM and DPM Modification Proposals

Based on the analysis of the patterns of results obtained using the DTM and DPM explained in the previous section, this section proposes modifications to the DTM and DPM fault zones. Given that most results were found in D1 and D2 fault zones (see Table 3), a new zone was created above them to indicate oil contamination from OLTC gases. This new zone is called oil contamination (OC). In the case of transformers that do not have OLTC, the OC zone should not be used; instead, the D1 and D2 zones below will be used to identify faults; thus, a dashed line was added in the new zone to distinguish between D1 and D2 faults.
Figure 7 shows a new OC fault zone for DTM. As mentioned above, the new zone corresponds to a C2H2 percentage greater than or equal to 60%, a CH4 percentage less than or equal to 10%, and a C2H4 percentage less than or equal to 40%.
The triangular coordinates of the new and modified zones, expressed in relative percentages of CH4, C2H4, and C2H2, are as follows:
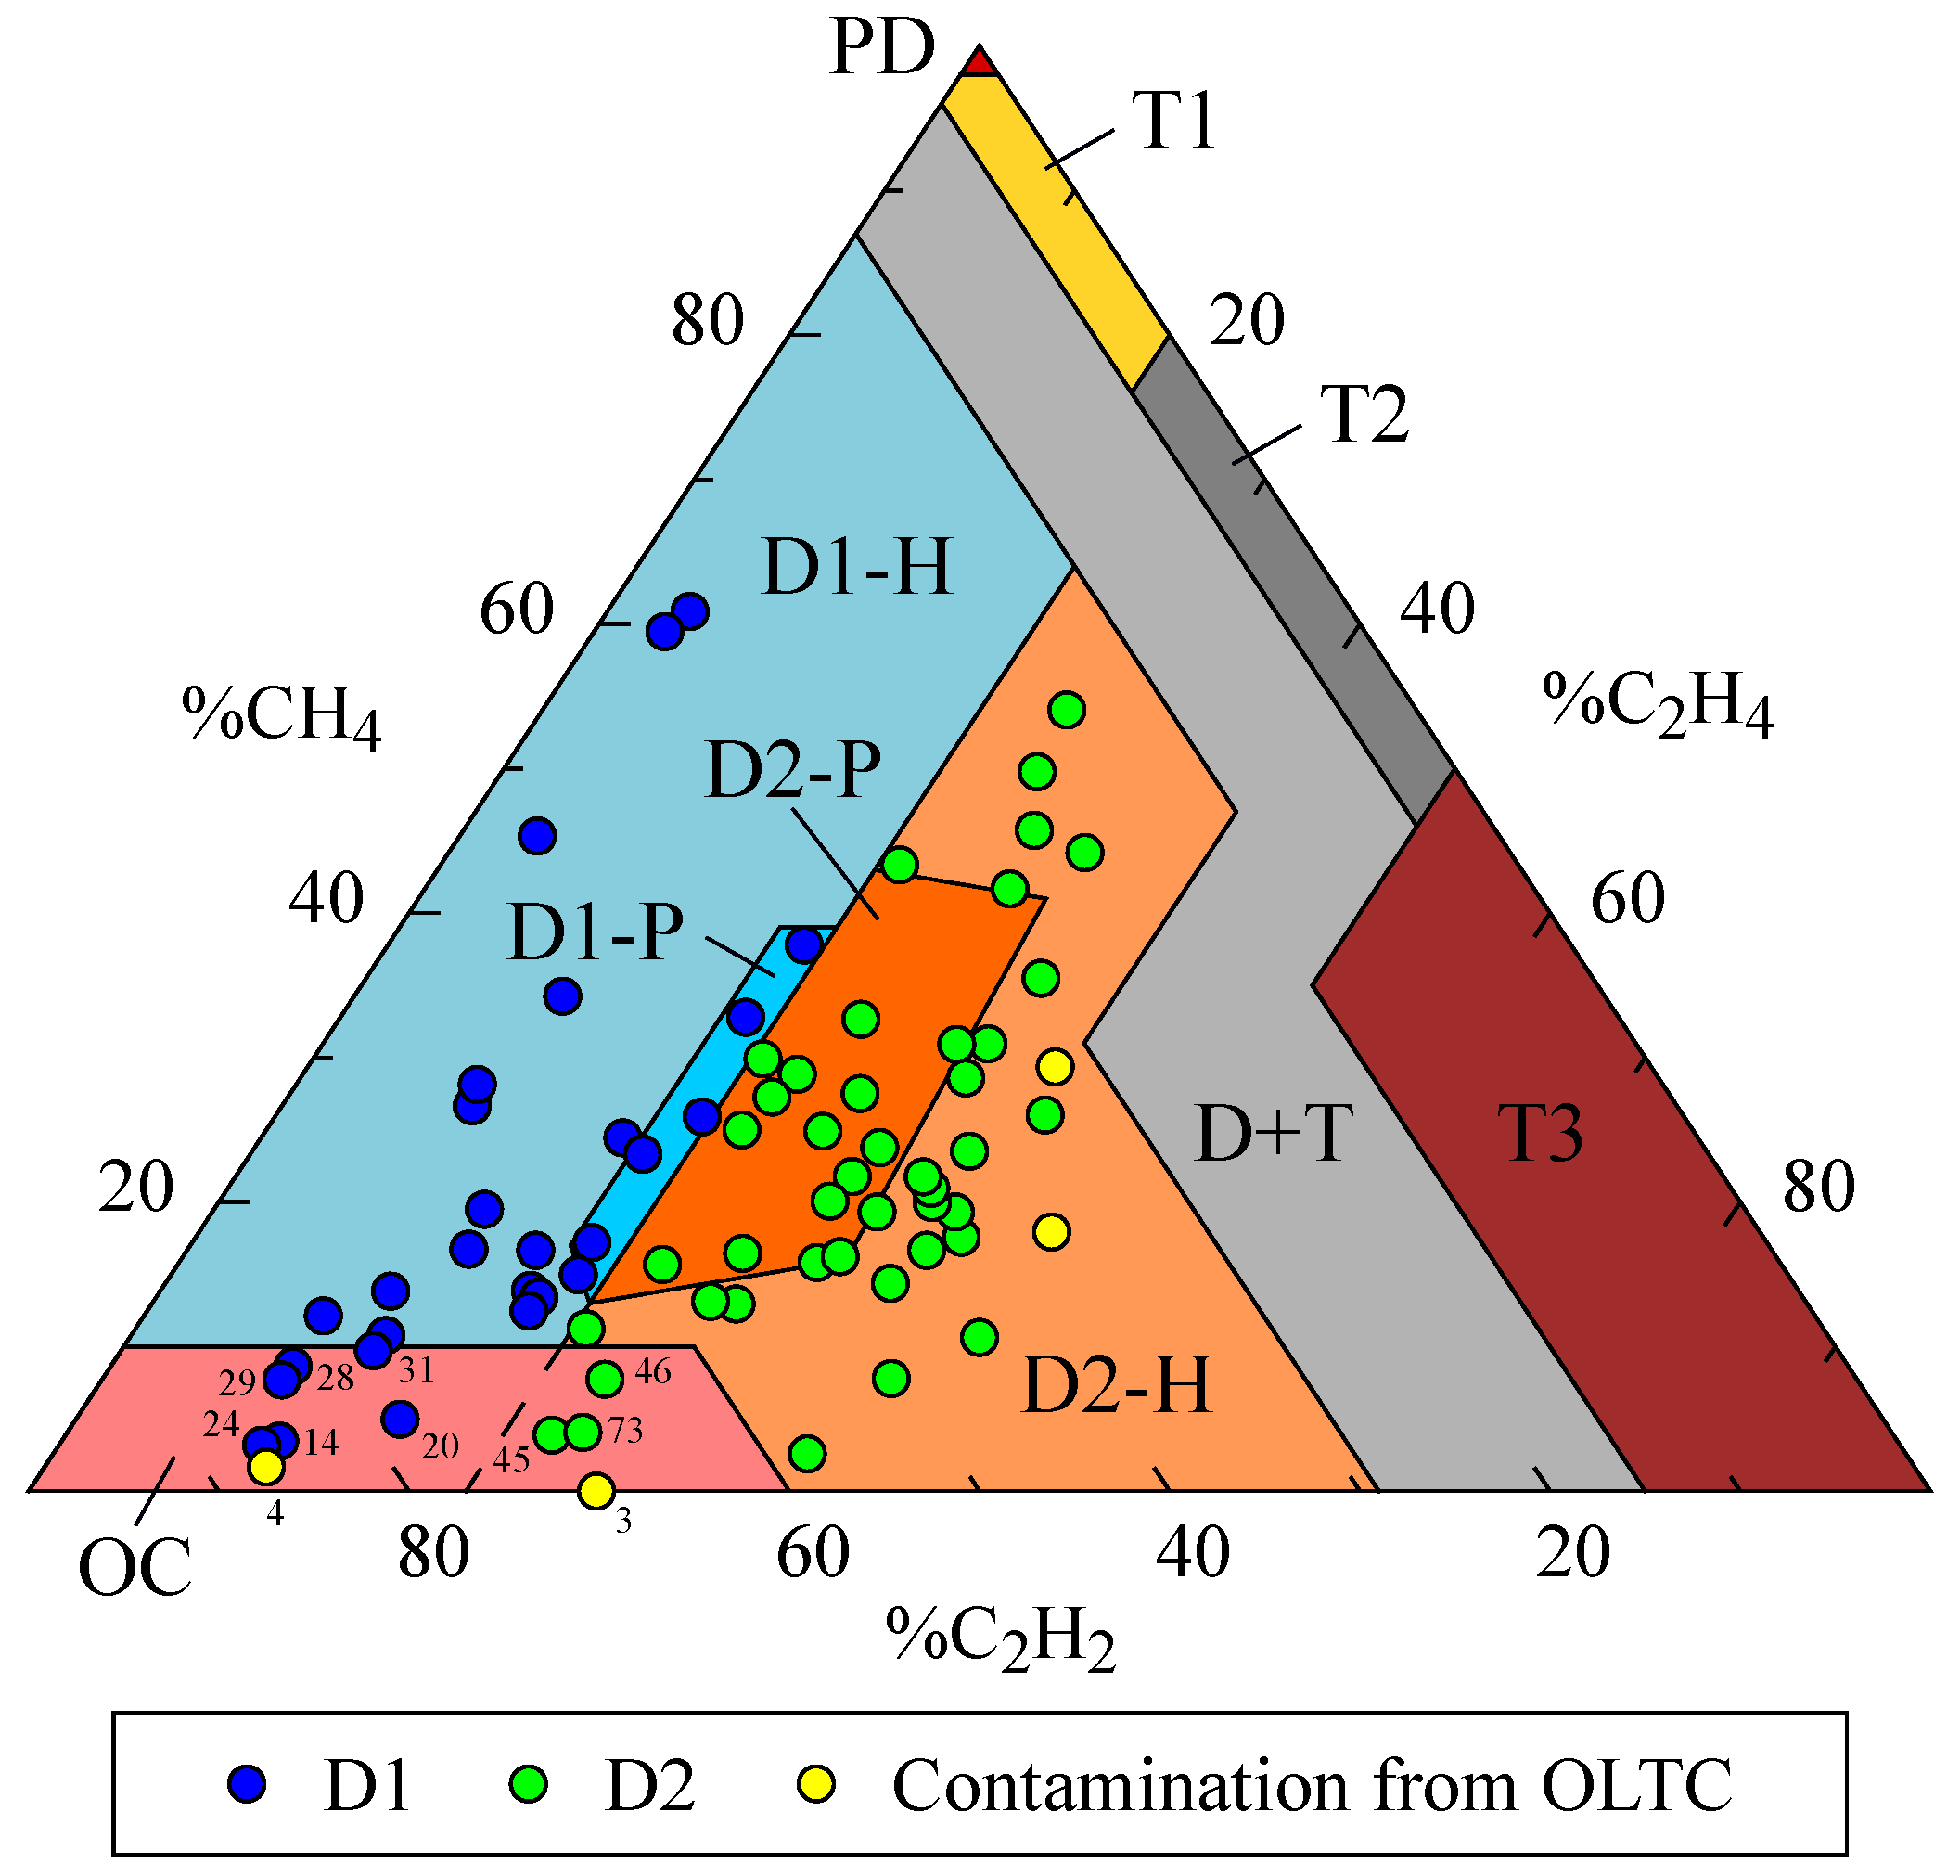
  • D1-H: (10, 0, 90), (87, 0, 13), (64, 23, 13), (39, 23, 38), (39, 20, 41), (17, 20, 63), (13, 23, 64), (10, 23, 67).
  • D2-H: (10, 23, 67), (13, 23, 64), (16, 35, 49), (41, 33, 26), (43, 23, 34), (64, 23, 13), (47, 40, 13), (31, 40, 29), (0, 71, 29), (0, 40, 60), (10, 30, 60).
  • OC: (0, 0, 100), (10, 0, 90), (10, 30, 60), (0, 40, 60).
Figure 8 shows the new zone created for DPM. It is located in the D1 and D2 fault zones. Most of the DGA results presented in Figure 5 are grouped in this new area. As in the case of DTM, this new zone is called OC.
The new coordinates of the new and modified zones for DPM are as follows:
  • D1-H: (0, 40), (38, 12), (32, −6), (26.11, −1.37), (28.7, 6.9), (14.6, 18.3), (11.03, 10.56), (10.19, 17.14), (0, 19.74)
  • D2-H: (10.3, 7.9), (25.2, −4.3), (26.11, −1.37), (32, −6), (24, −30), (−1, −2), (0, 1.5), (0.97, 4.84), (10.12, 7.25)
  • OC: (14.6, 18.3), (11.03, 10.56), (10.3, 7.9), (25.2, −4.3), (26.11, −1.37), (28.7, 6.9)

5. Results—Application of Proposed DTM and DPM to DGA Data Extracted from Previous Studies

For the DTM and DPM versions proposed in the previous section, DGA samples extracted from [5,6,13,14,22,23,24,25,26,27,28,29,30,31] were used to validate the proposed modifications in the methods, as shown in Table A1, Table A2 and Table A3. The DGA samples used were identified in their references as D1 or D2 faults or oil contamination from OLTC gases. Only DGA samples identified as D1 or D2 faults were used because the new fault zone was located above them. DGA samples indicating oil contamination from OLTC gases were also used to validate the new fault zone of both methods.
Figure 9 shows the fault identification of DGA samples using the proposed DTM. Faults D1 and D2 are plotted in blue and green, respectively, and the transformer oil contamination is plotted in yellow. The numbers within the OC zone correspond to the DGA samples in Table A1, Table A2 and Table A3.
Note from Figure 9 that only two out of four DGA samples classified as contaminated from OLTC gases entered the new DTM zone. DGA samples nos. 1 and 2 were declared as contaminated after an inspection was conducted; holes were found to exist between the main conservator and the OLTC conservator. In this case, oil contamination occurred directly and not by filtration; the higher C2H2 solubility accelerated its diffusion outside the OLTC compartment. Given that the oil contamination flowed through a hole between the conservators, the gases generated in the OLTC mixed with the transformer oil; therefore, the proposed DTM did not correctly identify these DGA samples.
Figure 9 shows that 6 out of 28 DGA samples identified in [13,14,23,24,25,28,30,31] as D1 fault entered the new DTM zone. The DGA samples that entered the new zone were nos. 14, 20, 24, 28, 29, and 31. Samples nos. 14, 20, and 24 would be classified as contaminated according to the C2H2/H2 ratio. Concerning samples nos. 20 and 24, it was indicated in [24] that there was communicating OLTC. According to EK, samples nos. 28 and 29 would be defined as contaminated from the OLTC gases due to the high C2H2 concentration and low concentrations of the rest of the gases, except for H2, which presented similar values to the C2H2 concentration in both cases. Sample no. 31 belonged to a transformer with an off-load tap changer in each winding connected to a gas-insulated switchgear (GIS) [30]. Consequently, the new OC zone would not be taken into account during fault identification.
Figure 9 shows that 3 out of 44 DGA samples defined in previous studies as D2 fault entered the new zone of the proposed DTM. DGA samples entering the new zone were nos. 45, 46, and 73. DGA sample no. 73 met the condition of a C2H2/H2 ratio greater than 2, so it would be classified as contaminated. DGA samples nos. 45 and 46 had very high concentrations of H2 and C2H2, respectively, so it is assumed that an investigation was conducted to determine the origin of these gases.
Figure 10 shows the application of the DPM with the new zone created for the DGA samples in Table A1, Table A2 and Table A3. D1 and D2 faults are plotted in blue and green, respectively, and the transformer oil contamination is plotted in yellow. The numbers within the OC zone correspond to the DGA samples in Table A1, Table A2 and Table A3.
As in the case of the proposed DTM, the same two DGA samples that were determined to be contaminated from OLTC did not enter the OC zone, as shown in Figure 10.
Figure 10 shows that samples nos. 9, 14, 19, 20, and 24, identified as D1 faults, entered the OC zone. Samples nos. 14, 20, and 24, as previously commented, had a C2H2/H2 ratio higher than 2, so they would be identified as contaminated. Furthermore, samples nos. 20 and 24 had communicating OLTC [24]. Sample no. 9 also had a C2H2/H2 ratio higher than 2. Finally, sample DGA no. 19 would be classified as oil contamination, according to EK.
Concerning the DGA samples identified as D2 faults, 3 out of 44 DGA samples entered the OC zone, as shown in Figure 10. These samples were nos. 33, 46, and 73. Samples nos. 46 and 73 also entered the OC zone in the proposed DTM. DGA sample no. 33 met the condition of a C2H2/H2 ratio higher than 2, and also had a C2H2 concentration of 7672 ppm; therefore, it is assumed that inspections were performed to identify the source of this large concentration.

6. Discussion

As previously mentioned, it was observed that the majority of DGA samples that entered the new zones created in DTM and DPM would be classified as oil contamination from OLTC gases according to the C2H2/H2 ratio criterion or EK, as shown in Table 4 and Table 5. Furthermore, Table 4 and Table 5 show the DGA results in which the gas concentrations were very high (high-concentration column). For them, an additional inspection should be performed to determine the source of the gases because there was a high probability of active faults in addition to oil contamination from OLTC gases.
The DGA samples that entered the OC zone of the proposed DTM were 11 in total (14.7%). It was not possible to determine whether the new zone would be applied to a DGA sample because it was not known if the power transformer had OLTC [14]. In another DGA sample, the new zone would not be applied because the GIS transformer had an off-load tap changer [30]. According to [24], 4 DGA samples showed either contamination from OLTC gases or power transformers with communicating OLTC. Therefore, these DGA samples were correctly identified with the OC zone. Also, according to [24], 2 DGA samples from 2 power transformers without communicating OLTC entered the new zone, but they had very high gas concentrations; therefore, it is assumed that an inspection was performed to determine the origin of the gases. Finally, the samples from the 3 transformers in [25] would be classified as contaminated from OLTC gases by applying the C2H2/H2 ratio or EK; therefore, the identification through the proposed DTM worked.
The DGA samples that entered the new zone of the proposed DPM, without considering the DGA samples that showed contamination from OLTC gases, were 10 in total (13.3%). According to [24], 4 DGA samples showed either contamination from OLTC gases or power transformers with communicating OLTC. Therefore, they were correctly identified with the OC zone. Also, according to [24], 2 DGA samples from 2 power transformers without communicating OLTC entered the new zone, but they had very high gas concentrations; therefore, it is assumed that an inspection was performed to determine the origin of the gases. For 3 specific DGA samples [14], it was not possible to determine whether the application of the new OC zone worked because it was not known if the power transformers had OLTC. Finally, concerning the proposed DPM, a DGA sample in [25] would be classified as contaminated transformer oil according to the criterion of C2H2/H2 ratio; thus, the identification through the proposed DPM worked.
As seen above, the gas concentration ranges from the DGA results used to validate the method modifications that entered the new OC zone are 52–7672 and 4–1900 ppm for acetylene and hydrogen, respectively, while the concentration ranges from the DGA database for the contaminated transformers used to generate the method modifications are 10–273 and 0–334 ppm for acetylene and hydrogen, respectively. It is, therefore, not possible to define a range of absolute gas concentrations to distinguish between the presence of a fault and oil communication between the OLTC compartment and the main tank. According to the IEC guide [3], the range of typical acetylene concentrations in transformers with a communicating OLTC is 60–280 ppm. This range of concentrations is very similar to that used to generate the proposed modifications. As discussed above, the DGA results with very high acetylene concentrations identified in Table 4 and Table 5 should prompt a detailed investigation of the transformer to identify the source of the problem and attempt to correct it.
As indicated in [17], the concern for arcing in oil (D1-H and D2-H) and contamination from OLTC gases is much lower than for arcing in paper (D1-P and D2-P). Therefore, the investigation of arcing in oil and oil contamination can be delayed to observe the trend in gas concentrations or perform DGA on the OLTC oil to contrast the concentrations. The proposed modifications to the DTM and DPM are intended to assist the maintenance technician in deciding to define oil contamination or the presence of an active fault and, thus, to plan further investigations and the urgency with which they should be carried out.
The application of the modified methods may raise the question of whether the OC zone should be used to identify the defect or, on the contrary, whether the D2-P or D1-P zones below it should continue to be used. This is a limitation of the modifications proposed in this study; the knowledge of the maintenance technicians must not be forgotten when interpreting the DGA results. Maintenance engineers should interpret the DGA results and the gas increases between oil analyses to define the presence of a fault or oil contamination throughout the application of the new zone and, in addition, whether there may also be abnormal OLTC operation causing gas concentrations in the transformer oil to increase.
In summary, the proposed DTM and DPM worked correctly in most cases. However, note that the knowledge of the maintenance engineers, both in the interpretation of DGA results and the transformer duty and specifications, is critical to identifying oil contamination from OLTC gases or any other type of fault.

7. Conclusions

This study is based on a previous one [16] that developed a methodology to determine transformer oil contamination from OLTC gases. Fault identification through DTM and DPM of DGA samples from transformers identified as contaminated showed that most of the results were located in zones that presented high- and low-energy discharge faults. IRM graphical representation was also used to identify the faults, but most of the DGA samples were unidentified.
From the graphical representations of DTM and DPM, a zone indicating transformer oil contamination from OLTC gases was created over the D1-H and D2-H fault zones. This new area is called oil contamination (OC). The new OC zone in the DTM corresponds to a C2H2 percentage greater than or equal to 60%, a CH4 percentage less than or equal to 10%, and a C2H4 percentage less than or equal to 40%.
DGA samples extracted from previous studies that were identified as D1 or D2 faults or contaminated from OLTC were used to validate the proposed methods. It was found that 11 (14.7%) and 10 (13.3%) of the 75 DGA samples used entered the OC zone of the proposed DTM and DPM, respectively. In most DGA samples, the identification of OC faults worked correctly either by applying the criterion of C2H2/H2 ratio or EK on each DGA sample. Some DGA samples that entered the OC zone might not be considered if OLTC is not present, but this was not the case because the previous studies from which the used DGA samples were extracted did not indicate it.
The DTM and DPM modifications proposed in this study are intended to assist maintenance technicians in distinguishing between arcing faults and oil contamination from OLTC gases.
As future work, it is intended to continue the study of oil contamination between the OLTC compartment and the main tank by trying to correlate the DGA results of the transformer oil with the DGA results of the OLTC oil. This may be time-consuming as the DGA on the OLTC oil is not performed annually but on an exceptional basis, so it is complicated to have a good database of both types of results. It will also be necessary to take into account the fact that during the exhaustive inspections carried out periodically on OLTCs, the OLTC oil is usually changed if it is very dirty, so it will help to distinguish whether there is contamination of the transformer oil or whether the high concentrations of gases are due to the presence of a fault.

Author Contributions

Conceptualization, S.B., J.L.M.L., M.M. and A.A.; methodology, S.B.; software, S.B.; validation, S.B., J.L.M.L., M.M. and A.A.; formal analysis, S.B.; investigation, S.B.; resources, S.B., M.M. and A.A.; data curation, S.B.; writing—original draft preparation, S.B.; writing—review and editing, J.L.M.L., M.M. and A.A.; visualization, J.L.M.L., M.M. and A.A.; supervision, J.L.M.L. and M.M.; project administration, M.M. and A.A.; funding acquisition, M.M. All authors have read and agreed to the published version of the manuscript.

Funding

This study was partially funded by the FLEXIGRID project from the European Union’s Horizon 2020 research and innovation programme [grant number 864579].

Institutional Review Board Statement

Not applicable.

Informed Consent Statement

Not applicable.

Data Availability Statement

The data used in this study are not available because they belong to a third party and are sensitive and private data.

Acknowledgments

The authors acknowledge the support received from EDP Redes España.

Conflicts of Interest

The authors declare no conflicts of interest.

Abbreviations

The following abbreviations are used in this manuscript:
DGADissolved gas analysis
DRMDoernenburg’s ratio method
DPMDuval’s pentagon method
DTMDuval’s triangle method
EKExpert knowledge
GISGas-insulated switchgear
IRMIEC ratio method
OLTCOn-load tap changer
RRMRogers’ ratio method
D+TMixture of thermal and electrical faults
D1Low-energy discharge
D1-HLow-energy discharge in oil
D1-PLow-energy discharge in paper
D2High-energy discharge
D2-HHigh-energy discharge in oil
D2-PHigh-energy discharge in paper
OCOil contamination from OLTC gases
PDPartial discharge
SStray gassing
T1Thermal faults (<300 °C)
T2Thermal faults (300–700 °C)
T3Thermal faults (>700 °C)
C2H2Acetylene
C2H4Ethylene
C2H6Ethane
C3H6Propylene
C3H8Propane
CH4Methane
COCarbon monoxide
CO2Carbon dioxide
H2Hydrogen

Appendix A. DGA Dataset from References

The DGA samples used from references for validation of the proposed DTM and DPM are shown in Table A1, Table A2 and Table A3.
Table A1. DGA results from previous studies identified as contaminated from OLTC gases.
Sample No.H2CH4C2H2C2H4C2H6COCO2Ref.
192265465204433704[26]
2160596379415783661[26]
3801014301924067[24]
441527293519[24]
Table A2. DGA results from previous studies identified as D1.
Sample No.H2CH4C2H2C2H4C2H6COCO2Ref.
51309856765--[13]
617905806193363219564250[23]
71202540815001600[23]
881169.9112161205[28]
9109493456189--[14]
1065.523.3262.11--[14]
1114.149.51.51.3--[14]
1229.54.529.13.50.5--[14]
1326630.260.226.24.9--[14]
142413319435--[14]
152742797335--[14]
162402096285--[14]
1730722109332--[14]
187820281311-784[24]
19305100541161334403700[24]
20543120188041141762800[24]
21123016369223327130115[24]
22951039110122467[24]
236870102855009007929388[24]
241900285773095731681732[24]
251084188769166838199[24]
261464.1202.4486.4179.163.624.4840.9[31]
27319.260.5139.947.152.1569.31644.9[31]
28343.7354.10.75622530[25]
29171.3141.60.3102910[25]
3010581334529759138[30]
3120542191735299121166[30]
327611302884420454210[30]
Table A3. DGA results from previous studies identified as D2.
Sample No.H2CH4C2H2C2H4C2H6COCO2Ref.
33858132476722793208--[14]
3432.45.513.212.61.4--[14]
35800139330002817304--[14]
3649068784967199241404--[14]
3749723012215151--[14]
386152006810242--[14]
3959423010213044--[14]
40213462475--[14]
411607615129491680--[14]
4223539.452572109.63--[14]
4351287185.21163.5911.5--[14]
446203252441813814802530[24]
4513301018266202311820[24]
4644089757304192991190[24]
4721043187102121671070[24]
48285011153675198713823304330[24]
497020185044102960021401000[24]
50545130239153166602850[24]
517150144017601210976082260[24]
52755229460404328455580[24]
5313,50061104040451021286901460[24]
541570111018301780175135602[24]
553090502025403800323270400[24]
5618204056343653510108610[24]
57133631451[24]
58137671045371961678[24]
5934215649495315[24]
6026021527733435130416[24]
61751526147105322[24]
62605212121882510[24]
6342025080053041300751[24]
6431023076061054150631[24]
6580016060026023490690[24]
66150039532339528365576[24]
6720,00013,00057,00029,000185026002430[24]
6837001690327028101282286[24]
692770660763712545221490[24]
7011702553253121851800[24]
7110,000673010,400733034519803830[24]
72157073517401330877114240[24]
73323.966260.62481960[25]
74120319466048271[23]
7531367468714397[29]

References

  1. Miao, X.; Quan, H.; Cheng, X.; Xu, M.; Huang, Q.; Liang, C.; Li, J. Fault Diagnosis of Oil-Immersed Transformers Based on the Improved Neighborhood Rough Set and Deep Belief Network. Electronics 2024, 13, 5. [Google Scholar] [CrossRef]
  2. Zhu, J.; Fu, Z.; Li, K.; Su, A. Chromatography Denoising with Improved Wavelet Thresholding Based on Modified Genetic Particle Swarm Optimization. Electronics 2023, 12, 4249. [Google Scholar] [CrossRef]
  3. IEC 60599:2022; Mineral Oil-Filled Electrical Equipment in Service—Guidance on the Interpretation of Dissolved and Free Gases Analysis. IEC: Geneva, Switzerland, 2022.
  4. IEEE Std C57.104-2019 (Revision of IEEE Std C57.104-2008); IEEE Guide for the Interpretation of Gases Generated in Mineral Oil-Immersed Transformers. IEEE: Piscataway, NJ, USA, 2019; pp. 1–98. [CrossRef]
  5. Desouky, S.S.; Kalas, A.E.; El-Aal, R.A.A.; Hassan, A.M.M. Modification of Duval triangle for diagnostic transformer fault through a procedure of dissolved gases analysis. In Proceedings of the 2016 IEEE 16th International Conference on Environment and Electrical Engineering (EEEIC), Florence, Italy, 7–10 June 2016; pp. 1–5. [Google Scholar] [CrossRef]
  6. Bachri, K.O.; Sumari, A.D.W.; Soedjarno, B.A.; Ahmad, A.S. The implementation of A3S information fusion algorithm for interpreting Dissolved Gas Analysis (DGA) based on Doernenburg Ratio. In Proceedings of the 2017 International Symposium on Electronics and Smart Devices (ISESD), Yogyakarta, Indonesia, 17–19 October 2017; pp. 335–340. [Google Scholar] [CrossRef]
  7. Wani, S.A.; Gupta, D.; Farooque, M.U.; Khan, S.A. Multiple incipient fault classification approach for enhancing the accuracy of dissolved gas analysis (DGA). IET Sci. Meas. Technol. 2019, 13, 959–967. [Google Scholar] [CrossRef]
  8. Hua, Y.; Sun, Y.; Xu, G.; Sun, S.; Wang, E.; Pang, Y. A fault diagnostic method for oil-immersed transformer based on multiple probabilistic output algorithms and improved DS evidence theory. Int. J. Electr. Power Energy Syst. 2022, 137, 107828. [Google Scholar] [CrossRef]
  9. Lu, W.; Shi, C.; Fu, H.; Xu, Y. A Power Transformer Fault Diagnosis Method Based on Improved Sand Cat Swarm Optimization Algorithm and Bidirectional Gated Recurrent Unit. Electronics 2023, 12, 672. [Google Scholar] [CrossRef]
  10. Jin, Y.; Wu, H.; Zheng, J.; Zhang, J.; Liu, Z. Power Transformer Fault Diagnosis Based on Improved BP Neural Network. Electronics 2023, 12, 3526. [Google Scholar] [CrossRef]
  11. Zhang, D.; Li, C.; Shahidehpour, M.; Wu, Q.; Zhou, B.; Zhang, C.; Huang, W. A bi-level machine learning method for fault diagnosis of oil-immersed transformers with feature explainability. Int. J. Electr. Power Energy Syst. 2022, 134, 107356. [Google Scholar] [CrossRef]
  12. Kim, S.; Kim, S.; Seo, H.; Jung, J.; Yang, H.; Duval, M. New methods of DGA diagnosis using IEC TC 10 and related databases Part 1: Application of gas-ratio combinations. IEEE Trans. Dielectr. Electr. Insul. 2013, 20, 685–690. [Google Scholar] [CrossRef]
  13. Mansour, D.A. Development of a new graphical technique for dissolved gas analysis in power transformers based on the five combustible gases. IEEE Trans. Dielectr. Electr. Insul. 2015, 22, 2507–2512. [Google Scholar] [CrossRef]
  14. Gouda, O.E.; El-Hoshy, S.H.; E.L.-Tamaly, H.H. Condition assessment of power transformers based on dissolved gas analysis. IET Gener. Transm. Distrib. 2019, 13, 2299–2310. [Google Scholar] [CrossRef]
  15. Bräsel, E.; Sasum, U. Online Transformer Gas Diagnostics on the Basis of IEC 60567/60599. In Proceedings of the International Conference on Power Transformers ”TRANSFORMER 09”, Torun, Poland, 2–4 June 2009; pp. 89–93. [Google Scholar]
  16. Bustamante, S.; Manana, M.; Arroyo, A.; Laso, A.; Martinez, R. Determination of Transformer Oil Contamination from the OLTC Gases in the Power Transformers of a Distribution System Operator. Appl. Sci. 2020, 10, 8897. [Google Scholar] [CrossRef]
  17. Duval, M.; Buchacz, J. Gas Formation from Arcing Faults in Transformers—Part II. IEEE Electr. Insul. Mag. 2022, 38, 12–15. [Google Scholar] [CrossRef]
  18. Duval, M.; Buchacz, J. Identification of Arcing Faults in Paper and Oil in Transformers—Part I: Using the Duval Pentagons. IEEE Electr. Insul. Mag. 2022, 38, 19–23. [Google Scholar] [CrossRef]
  19. CIGRE. DGA in Non-Mineral Oils and Load Tap Changers and Improved DGA Diagnosis Criteria. In Materials and Emerging Test Techniques (D1); WG D1.32. Technical Brochure no. 443; CIGRE: Paris, France, 2010. [Google Scholar]
  20. IEEE Std C57.139-2015 (Revision of IEEE Std C57.139-2010); IEEE Guide for Dissolved Gas Analysis in Transformer Load Tap Changers. IEEE: Piscataway, NJ, USA, 2016; pp. 1–45. [CrossRef]
  21. Mollmann, A.; Pahlavanpour, B. New guidelines for interpretation of dissolved gas analysis in oil-filled transformers. Electra 1999, 186, 31–51. [Google Scholar]
  22. Ghoneim, S.S.; Taha, I.B. A new approach of DGA interpretation technique for transformer fault diagnosis. Int. J. Electr. Power Energy Syst. 2016, 81, 265–274. [Google Scholar] [CrossRef]
  23. Gouda, O.E.; El-Hoshy, S.H.; El-Tamaly, H.H. Proposed heptagon graph for DGA interpretation of oil transformers. IET Gener. Transm. Distrib. 2018, 12, 490–498. [Google Scholar] [CrossRef]
  24. Duval, M.; de Pabla, A. Interpretation of gas-in-oil analysis using new IEC publication 60599 and IEC TC 10 databases. IEEE Electr. Insul. Mag. 2001, 17, 31–41. [Google Scholar] [CrossRef]
  25. Jadav, R.B.; Saha, T.K.; Ekanayake, C. Transformer diagnostics using dissolved gas analysis and polarisation and depolarisation current measurements—A case study. In Proceedings of the AUPEC 2011, Brisbane, Australia, 25–28 September 2011; pp. 1–6. [Google Scholar]
  26. Samsudin, R.; Ramli, A.Q.; Berhanuddin, A.; Zaidey, Y. Field experience of transformer untanking to identify electrical faults and comparison with Dissolved Gas Analysis. In Proceedings of the 2009 3rd International Conference on Energy and Environment (ICEE), Malacca, Malaysia, 7–8 December 2009; pp. 299–305. [Google Scholar] [CrossRef]
  27. Mehta, D.M.; Kundu, P.; Chowdhury, A.; Lakhiani, V.K. DGA diagnostics save transformers—Case studies. In Proceedings of the 2015 International Conference on Condition Assessment Techniques in Electrical Systems (CATCON), Bangalore, India, 10–12 December 2015; pp. 116–120. [Google Scholar] [CrossRef]
  28. Pattanadech, N.; Sasomponsawatline, K.; Siriworachanyadee, J.; Angsusatra, W. The conformity of DGA interpretation techniques: Experience from transformer 132 units. In Proceedings of the 2019 IEEE 20th International Conference on Dielectric Liquids (ICDL), Roma, Italy, 23–27 June 2019; pp. 1–4. [Google Scholar] [CrossRef]
  29. Pattanadech, N.; Wattakapaiboon, W. Application of Duval Pentagon Compared with Other DGA Interpretation Techniques: Case Studies for Actual Transformer Inspections Including Experience from Power Plants in Thailand. In Proceedings of the 2019 5th International Conference on Engineering, Applied Sciences and Technology (ICEAST), Luang Prabang, Laos, 2–5 July 2019; pp. 1–4. [Google Scholar] [CrossRef]
  30. Mahmoudi, N.; Samimi, M.H.; Mohseni, H. Experiences with transformer diagnosis by DGA: Case studies. IET Gener. Transm. Distrib. 2019, 13, 5431–5439. [Google Scholar] [CrossRef]
  31. Piotrowski, T.; Rozga, P.; Kozak, R. Comparative Analysis of the Results of Diagnostic Measurements with an Internal Inspection of Oil-Filled Power Transformers. Energies 2019, 12, 2155. [Google Scholar] [CrossRef]
Figure 1. Graphical representation of the IRM on 2 and 3 axis (Adapted from [3]).
Electronics 13 01338 g001
Figure 2. Latest version of DTM, developed in 2022, which distinguishes between low and high-energy discharges in oil or paper (Adapted from [17]).
Electronics 13 01338 g002
Figure 3. Latest version of DPM, developed in 2022, which distinguishes between low and high-energy discharges in oil or paper (Adapted from [18]).
Electronics 13 01338 g003
Figure 4. Application of DTM to DGA samples from transformers identified as contaminated in [16].
Electronics 13 01338 g004
Figure 5. Application of DPM to DGA samples from transformers identified as contaminated in [16].
Electronics 13 01338 g005
Figure 6. Application of IRM to DGA samples from transformers identified as contaminated in [16].
Electronics 13 01338 g006
Figure 7. Proposed modifications to DTM.
Electronics 13 01338 g007
Figure 8. Proposed modifications to DPM.
Electronics 13 01338 g008
Figure 9. Application of the proposed DTM to reference DGA samples.
Electronics 13 01338 g009
Figure 10. Application of the proposed DPM to reference DGA samples.
Electronics 13 01338 g010
Table 1. Gases generated by fault type [3,4].
Fault TypeGenerated Gas
H2CH4C2H6C2H4C2H2
Thermal faults (<300 °C)T1 ·
Thermal faults (300–700 °C)T2 ·
Thermal faults (>700 °C)T3
Partial dischargePD ·
Low-energy dischargeD1
High-energy dischargeD2
•: major concentration; ∘: secondary concentration; · : trace concentration.
Table 2. DGA interpretation of IRM [3].
Fault Type C 2 H 2 C 2 H 4 CH 4 H 2 C 2 H 4 C 2 H 6
PDNS a<0.1<0.2
D1>10.1–0.5>1
D20.6–2.50.1–0.5>2
T1NS a>1 but NS a<1
T2<0.1>11–4
T3<0.2 b>1>4
a NS = Non-significant regardless of the value; b An increasing value of the amount of C2H2 may indicate that the hot-spot temperature is higher than 1000 °C.
Table 3. Application of fault-identification methods to DGA samples from transformers identified as contaminated from OLTC gases.
MethodDefinition
Criteria
Fault TypesNo Fault
Identified
D1D1-HD1-PD2D2-HD2-PD1/D2D+TT1T2T3PDS
DTMIEC ratio24012000040
EK28131250010
Total52143250050
DPMIEC ratio26014000000
EK41714500100
Total67728500100
IRMIEC ratio2112004012
EK612001058
Total2724005070
−: Not identifiable by the method.
Table 4. DGA samples that entered the new DTM zone.
Sample
No.
Fault
Identified
from
References
H2CH4C2H2C2H4C2H6COCO2C2H2/H2
Ratio
EKHigh Gas
Concentrations
Ref.
3Contamination
from OLTC
801014301924067 [24]
4Contamination
from OLTC
41527293519 [24]
14D12413319435-- [14]
20D1543120188041141762800[24]
24D11900285773095731681732[24]
28D1343.7354.10.75622530 [25]
29D1171.3141.60.3102910 [25]
31D120542191,735299121166 [30]
45D213301018266202311820 [24]
46D244089757304192991190 [24]
73D2323.966260.62481960 [25]
Table 5. DGA samples that entered the new DPM zone.
Sample
No.
Fault
Identified
from
References
H2CH4C2H2C2H4C2H6COCO2C2H2/H2
Ratio
EKHigh Gas
Concentrations
Ref.
3Contamination
from OLTC
801014301924067 [24]
4Contamination
from OLTC
41527293519 [24]
9D1109493456189-- [14]
14D12413319435-- [14]
19D1305100541161334403700 [24]
20D1543120188041141762800[24]
24D11900285773095731681732[24]
33D2858132476722793208--[14]
46D244089757304192991190 [24]
73D2323.966260.62481960 [25]
Disclaimer/Publisher’s Note: The statements, opinions and data contained in all publications are solely those of the individual author(s) and contributor(s) and not of MDPI and/or the editor(s). MDPI and/or the editor(s) disclaim responsibility for any injury to people or property resulting from any ideas, methods, instructions or products referred to in the content.

