3. Architecture and Implementation
Cyanobacterial blooms pose a serious threat to the health of the aquatic ecosystem and human health, so early detection of HACBs is essential to mitigate their negative impacts. Unfortunately, the problem is far from trivial due to the complex nature of the phenomena that involve biological entities and ecosystems. For the EWS to be practical, the system must be able to measure and monitor the state of water bodies and environmental factors such as temperature, pH, and nutrients. To unravel the behavior of such systems, it is necessary to appeal to models and simulations. Designing such an EWS is a multifaceted problem where biology and engineering must cooperate, developing models and simulations, investigating new sensors and measuring technologies, or automating measurements and sampling of the water bodies. Due to this complexity, we proposed and developed DEVS-BLOOM, an EWS based on DEVS, which allows simulating and analyzing the behavior of water bodies in the face of various environmental conditions.
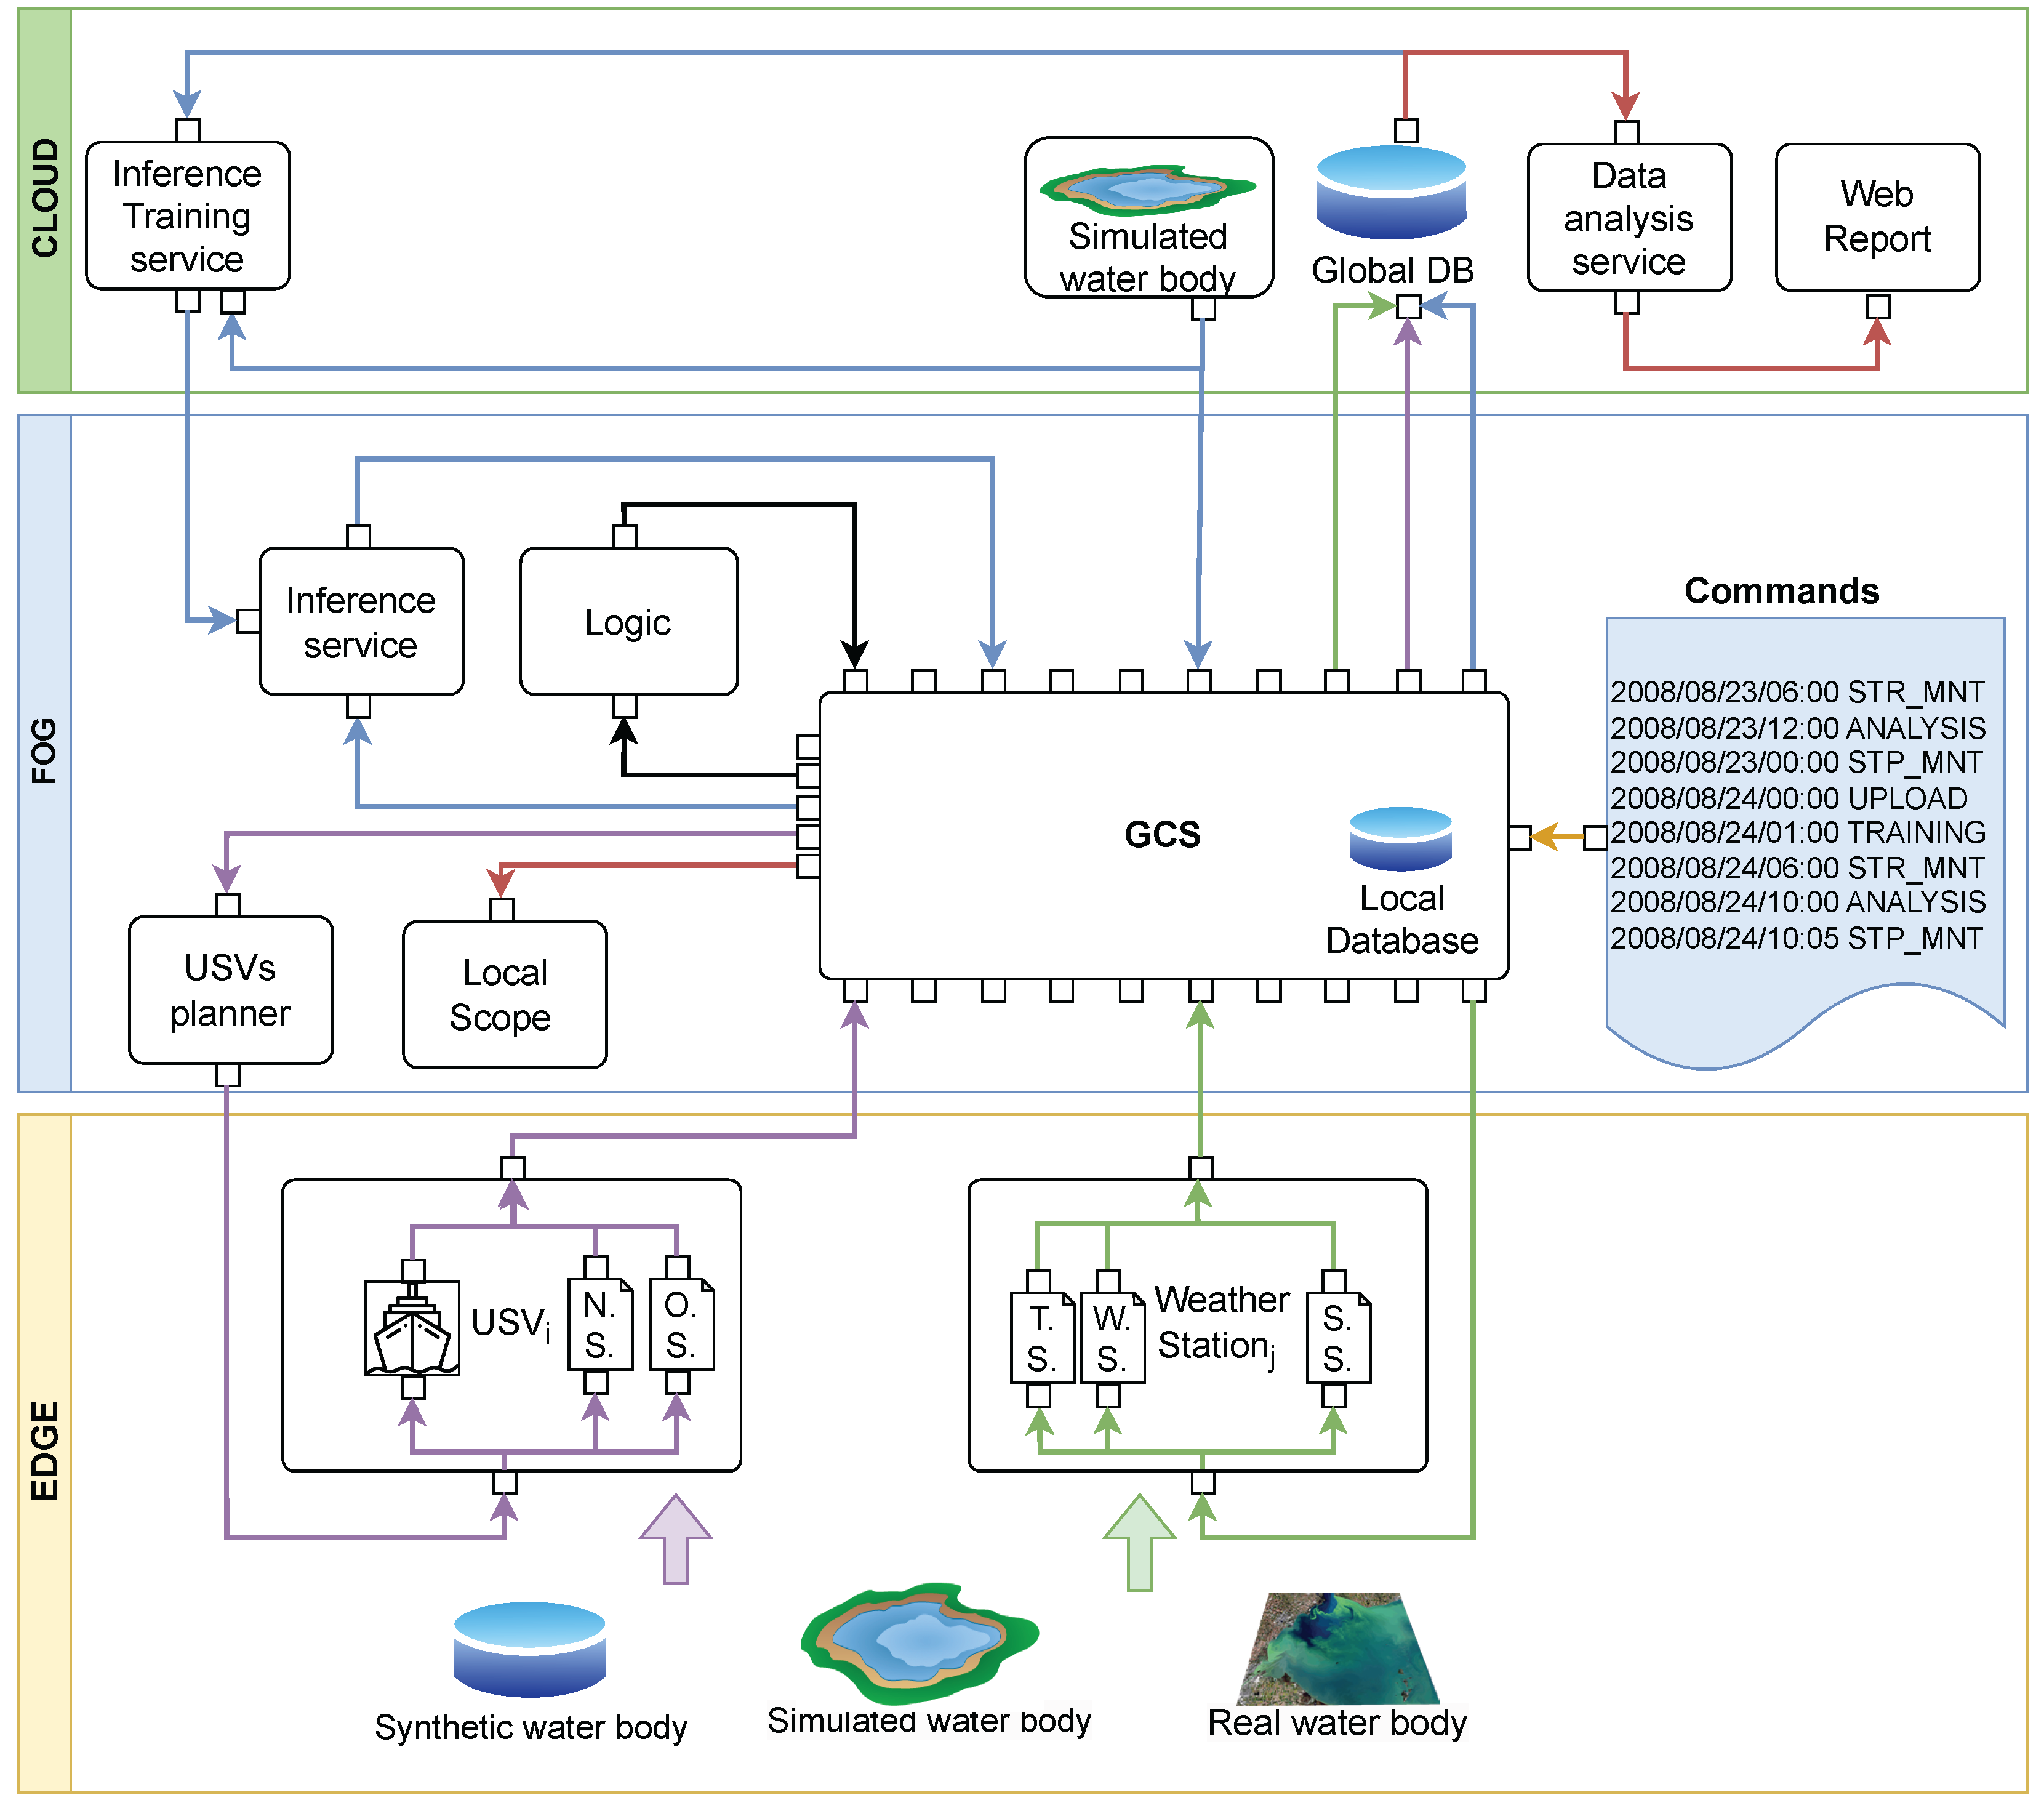
The EWS for monitoring HACB development must integrate automated data acquisition with parameterized model simulation. The used approach is oriented towards a system architecture, a more holistic and integrative model that includes the use of the mathematical models mentioned above and a modern model of the automated infrastructure of EWSs. Consistent with the IoT paradigm, the approach was segmented into three distinct layers, depicted in
Figure 1, each encompassing the various subsystems necessary for addressing the challenge.
The Edge layer represents the devices and systems closest to the physical world, typically at the network’s periphery, such as the USVs that carry out surveillance/measurement missions, weather stations, or cameras. The Fog layer is an intermediate layer between the Edge and Cloud layers, providing computational resources closer to the data source. The Ground Control Station (GCS) sits in this layer, as well as local database and file storing services, the USV planner, etc. The Cloud layer involves centralized processing and storage capabilities, including the web interface, web report generators, cloud storage, data analysis, etc.
The EWS is based on continuous observation of environmental parameters modeled by DEVS. With AI-pretrained models, the inference service makes predictions that activate alerts to indicate the possible occurrence of cyanobacteria blooms. The GCS considers these alerts to monitor the zones where the bloom is expected to appear. It sends USV to monitor the area, taking measures and confirming or rejecting the alert. The efficiency of this system lies in its ability to prevent critical situations before they occur.
In adherence to the Model-Based System Engineering (MBSE) methodology, a deliberate architectural design decision was made to completely isolate User Interface (UI) implementation within a dedicated layer known as the Front-End. This separation of concerns not only enhances the modularity of the system, but also ensures a clear distinction between the presentation layer and the underlying functionality.
Conversely, all the intricate logic, algorithms, and overall system functionality are intricately woven into a distinct layer identified as the Back-End. This compartmentalization of the Back-End enhances maintainability and allows for a more streamlined development process. Developers can focus on the intricacies of system functionality without the complexities associated with UI design, fostering a more efficient and organized development workflow.
Following this approach, the UI integrates with the inference service of DEVS-BLOOM [
6] that implements different AI models. These models are completely transparent to the web application and thus to the final user. The inference service supports different models, such as the predictive model that is described in [
6] based on differential equations, or a particle transport model presented in [
20,
21] that determines Cyanobacterial Bloom (CB) distribution from the water currents and the inherent CB behavior (in particular, its biological growth and vertical displacements). In addition, the research group of the authors is currently focused on the implementation of a deep-learning model that is expected to provide more accuracy in the predictions of blooms. The model is based on Long Short-Term Memory (LSTM) networks, which are suitable for forecasting in other fields of application [
22,
23,
24].
Due to MBSE methodology, a model-based database is generated from the initial design phases. This early availability of a data foundation has proven to be instrumental in the development life cycle. It has enabled the parallel development of both the Front-End and Back-End, with developers working concurrently on their respective layers. This parallelism accelerates the overall development timeline and allows for early feedback and testing of system components. The foresighted integration of a database aligns with the core tenets of MBSE, where a holistic view of the system, encompassing data and functionality, is essential. Because of the presence of a database available early on, potential challenges related to data handling and storage are identified and addressed proactively, contributing to the overall robustness of the system.
As development progresses, the convergence of the Front-End and Back-End layers requires a minimal integration effort during the final stages. The well-defined interfaces between these layers, coupled with the continuous collaboration between UI designers and system developers, ensures a seamless integration process. This approach not only minimizes the risk of integration-related issues, but also allows for a more efficient and reliable deployment of the complete system.
As a result, our framework collectively contributes to a robust, modular, and efficiently developed system. This holistic approach sets the foundation for a scalable and maintainable solution, with the flexibility to adapt to evolving requirements in the future.
3.1. Back-End
The DEVS formalism offers an accurate mathematical representation of discrete dynamical systems. The DEVS-BLOOM framework uses DEVS to model the components of the EWS, including dynamics of water bodies (considering factors such as temperature, nutrient levels, and solar radiation that are crucial to understanding and preventing the proliferation of cyanobacteria), USVs, weathers stations, inference services or data logging and storing. Apart from the expressivity and accuracy of DEVS for modeling the different components, it enforces a formal definition of the interfaces between other components. This is a feature that DEVS-BLOOM leverages to integrate both simulated models and real devices seamlessly.
The coupled DEVS model in
Figure 2 is constructed for the purpose of monitoring a bloom using an inference service that guides an USV.
In this model, the USV dynamic and control are simulated according to differential equations, the sensor measurements are real or emulated using a SimulatedBody service, the inference service is used in the Fog layer, and it is trained on the Cloud layer. In this simple case, the planner sends the inferred to the USV as a reference. The USV has to finish reaching the marked reference point, forced to adjust its trajectory as its dynamics are altered by the influence of water currents and wind speed. In addition, an atomic model called Generator is included, which emulates the water technician manipulating the GCS. This has a significant added value because it allows the system generating orders during the simulation.
Our Back-End follows the IoT architecture described above. It is worth to mention that the exchange of information, execution of control logic, and training loops among the IoT layers are realized in a closed-loop configuration.
All the information generated by the simulation models or taken by real sensors is registered in a global database that resides in the cloud layer;
Figure 3. There is a database for each of the directories corresponding to each lake model. The data are organized in sub-folders according to the date on which the information was collected. In this way, it is possible to have multiple simulated and real models registered for the same water body. The stored data are categorized into system sensor data (Sensor*), bloom data (Bloom*), USV data (USV*) and others.
While the data share common fields such as identifier, source, timestamp, latitude and longitude, as can be seen, there are differences between the different types of data. This, combined with the large amount of information to be handled, makes it impossible for the manager to make an effective assessment of cyanobacterial blooms from the use of raw data. For this reason, the web interface represents a considerable advantage for the efficient visualization of the behavior of HACB and monitoring devices.
This global database is the source of information that feeds the UI, which is also implemented on the cloud layer. Based on this information, the Web Report service provides all necessary services for monitoring and visualization of the data in a user-friendly way in different tabs. These tabs perform the main functions of visualization and monitoring of the simulation results, which is explained in detail later, including the Scenario Configuration Tab, where the manager is able to configure an initial state of the simulation and generate new data from it.
3.2. Front-End
As a general guiding principle, the application we present in this work is based on well-known libraries and components to guarantee that it is robust and easy to maintain. The web application’s architecture is based on Django, a prevalent web development framework. In addition to many valuable capabilities that facilitate the creation of the application, a decisive factor in choosing Django is that it is written in Python, which is also the programming language that supports DEVS-BLOOM, mainly because it is pervasively used in applications of data analysis and machine learning.
Since DEVS-BLOOM is also based on this programming language, that election simplifies the integration between the two components. The web application is an interface to the capabilities that DEVS-BLOOM provides, adapting and customizing the interface according to the type of user. In this way, different roles are defined, which encapsulate a different and partial vision of the system that best suits the needs of each user.
In addition, security is a prevalent issue in web applications. The Django web framework, particularly its built-in user management system, facilitates the development of correct access control, including user authentication (whether the user is who they say they are) and authorization (whether the user is allowed to act as the system).
DEVS-BLOOM-WebUI is primarily focused on data access, visualization, and management. Data can originate from different sources (simulation models, real hardware), have others, and be separate (alerts, USV monitoring, water body state, etc.). Depending on the case of use, different technologies, protocols and data formats fit better with the specific needs, i.e., to exchange information safely and efficiently between DEVS-BLOOM and DEVS-BLOOM-WebUI. JSON is the preferred data format for general-purpose information since it is simple and human readable, in some cases (in particular, due to the large size of the data, JSON may not be the most appropriate form), therefore, appealing to other solutions such as the direct exchange of files in the CSV format (Comma Separated Values) or a more sophisticated format such as NetCDF4.
In the following paragraphs, we briefly describe the properties of each data format.
- JSON
(JavaScript Object Notation) is a simple text-based data exchange format pervasive in web applications. Initially, JSON was created for JavaScript applications as it allows (de)serialization of data with a subset of Javascript data types. However, many applications soon adopted it as a simpler, easier to process and more compact alternative to XML (Extensible Markup Language). Below is an example of a JSON data object:
{
“name”:“WaterBody”,
“date”:“19 May, 2021”,
“10:10 AM”,
“type”:“Bloom”,
“level”:“Alto”
}
- CSV
(Comma Separated Values) is also a text-based data format that unsurprisingly uses commas to separate values (though the delimiter could also be a semicolon, spaces, or any other symbol). It is used to store tabular data in plain files. CSV is a veteran data format that is still very popular due to its simplicity of process and human readability. In summary, CSV is easy to create, human readable, compact, easy to parse, fast to manipulate, and can be read using almost any text editor. Below is an example of a CSV file:
id,source,timestamp,lat,lon,power
USV,RedLeader,2008-08-23 00:00:06,47.5064888000488,
-122.216850280762,0.497
USV,RedLeader,2008-08-23 00:30:06,47.5064888000488,
-122.216850280762,0.494
USV,RedLeader,2008-08-23 01:00:06,47.50666680751364,
-122.2167099159214,0.491
USV,RedLeader,2008-08-23 01:30:06,47.50676240194273,
-122.2168043398511,0.481199260965549
- NetCDF4
(Network Common Data Form version 4) is implemented on top of HDF5 (Hierarchical Data Format version 5), a data format that can represent very complex and heterogeneous data objects. Thus, NetCDF4 inherits many features from HDF5, including self-describing capabilities, high performance, scalability, a robust software ecosystem of open-source tools, and a long-term data archiving solution. Since NetCDF4 is a binary format, showing an excerpt of the data file would be useless. However, it may be helpful to think of a hierarchical structure where there are datasets, which contain the actual data, and groups, which organize the datasets.
A web application in Django follows the Model–View–Controller (MVC) architectural pattern, often referred to as Model–View–Template (MVT), since nowadays, most web development frameworks strongly rely on template rendering engines. These engines provide an easy method to generate dynamic web pages using a template with placeholders for data and other customizations. Though there are many popular template rendering engines, such as Django Template Language (DLT), Jinja2, Angular, or Mustache, they are very similar in their conception, syntax, and features, differentiated in other aspects, such as the integration with specific frameworks or whether they are designed for client-side or server-side rendering.
The core components of a Django web application include models, views, templates, and URLs. The models represent the application’s data structure and allow developers to interact with the database using an object-oriented approach. To that end, an essential component is the Object–Relational Mapping (ORM) that takes the classes defined in the model as inputs and generates a representation as tables in the relational database. Thus, ORMs abstract the underlying relational model and dbms, generating a mapping between both models and encapsulating the queries and operations with the database.
Views handle the logic for processing user requests and generating responses. Views receive input from the user, interact with the model to retrieve or manipulate data, and then pass the data to templates for rendering, defining how data are presented to the user or application.
Templates are responsible for rendering the HTML5 to the user’s browser. Django has built-in support for templates in DTL. This simple yet powerful language includes features such as loops, conditional, and filters and even allows the embedding of Python-like expressions.
Finally, the URLs define the web application’s routing logic, i.e., how URL or URL patterns map to a specific view that should handle the request to that URL. Apart from a straightforward way of structuring the application, it helps maintain readability and modularity since each project can define URLs.
As mentioned before, the application has to support different roles that determine what the user should be presented with. This is handled with different views that provide an adapted interface depending on the user’s necessities and permissions on the system. The more prominent roles are admin, manager, water technician, biologist, engineer.
Combining data with a web-based interactive visualization is a fundamental pillar of the web application. Data visualization clarifies complex datasets, making them easier to examine, identify patterns and trends, and facilitate information communication to non-expert audiences.
Data visualization in our application is empowered by Django-Dash and Plotly. Django-Dash is a modular application framework allowing users to create custom dashboards seamlessly integrated with Django, supporting theming (in Dash themes are called layouts) and multiple workspaces. Plotly, on the other hand, is a top-rated open-source graphing library compatible with many programming languages such as R, Python, MATLAB, Perl, Julia, and Arduino. We considered it in favor of other popular solutions such as Bokeh, Matplotlib, or Seaborn.
Plotly is powerful and versatile, with many features that make it fit like a glove in DEVS-BLOOM-WebUI. It provides interactive visualizations allowing for users to zoom, pan, hover over data points, and dynamically update chars. The
Figure 4 shows a map view generated with Plotly where the trajectories commanded and followed by two USVs working in parallel can be analyzed.
Among Plotly’s many advantages is its ability to create animations with the map view, as can be observed. The UI organizes all the data related to the USVs and displays their routes throughout the same day. The slider below the map allows the user easy visualization of the trajectories of the ships for each available simulation day. Also, play and pause buttons are included so that the dynamics of the ships in their bloom monitoring function are automatically observed throughout the days.
Due to its versatility, the graphic library also enables the representation of heat maps and facilitates a point-to-point analysis of the depicted values. This functionality proves highly beneficial for other perspectives, such as illustrating the HACB densities recorded by the USVs sensors, as depicted in
Figure 5.
As can be seen, the Plotly tool enables the inclusion of interactive features with the user, such as the buttons placed on the right of the map. They are programmed in such a way that the information they provide adjusts to the signals displayed on the map, showing the maximum, minimum, and average values of algae density along with their corresponding timestamps.
Furthermore, depending on which button is pressed, the color scheme of the heat map changes and the displayed values are automatically filtered so that algae values that are above or below the average can be conveniently displayed.
Signals can be dynamically selected and deselected, as can the water body, as desired by the user to recognize similarities or patterns among the displayed data. Using the mouse, detailed information such as latitude, longitude, algal density and the exact timestamp at which the data were recorded by the USV algae sensor is revealed. This interactively accurate approach provides a more complete and detailed user experience, facilitating the understanding and analysis of HACB.
Though similar results can be achieved with Matplotlib and Bokeh, they often require more code. Plotly’s syntax is concise and expressive, making it easier to create complex visualizations with less code compared to the more verbose syntax of Matplotlib and Bokeh. In addition, Plotly can be seamlessly integrated into web applications to create interactive dashboards, a feature not native to Matplotlib or Seaborn.
Table 2 compares popular data visualization libraries available in Python.
To further enhance the practicality and user engagement with the DEVS-BLOOM framework, we introduce an innovative component within the DEVS-BLOOM-WebUI: the
Scenario Configuration Editor (SCE). This interactive tool empowers users to intuitively design and configure the deployment of monitoring infrastructure within a selected water body. The SCE provides a graphical interface where users can choose the type of water body and strategically place various components such as USVs, sensors, weather stations, and drones. This visual editor simplifies the complex task of setting up a simulation environment and ensures that users from diverse backgrounds can effectively participate in the early detection and monitoring process. By allowing for the manual configuration of the simulation scenario, followed by the generation of a .json file that serves as input for the Python-based simulation, the SCE bridges the gap between user input and simulation execution. This seamless integration of user-defined scenarios into the DEVS-BLOOM simulation framework ensures the system’s flexibility and user-centered design.
4. User Interface Use Case
The web application is currently in an alpha stage. Though it is still under development [
25], it is mostly functional. Simulation output data are needed to access and manage the system from the point of view of a user, administrator or operator. Due to the large size of the data and the simplicity of its manipulation, source files in CVS format are used. As mentioned above, the editor service allows for the initial conditions of the simulation to be configured, thus obtaining results based on the user’s indications. The data acquired are within the established locations, and the alerts are produced according to the limits set for the sensors. The web interface has a user-friendly design that allows for the information to be obtained more visually and interactively, allowing the user checking the user’s estimates.
A typical use case and scenario is presented below, showing the interaction steps between the users and the system. In this scenario, the Santillana reservoir, located near Madrid in Spain, is simulated. An area close to the dam, where water intakes for human supply are located, is analyzed. The study area is really small, so that it can be monitored with only one single USV.
On a weekly basis, the Bloom Prediction service is run to predict the appearance of possible Blooms, and the results are shown in the Bloom Prediction tab. In the event that Blooms occur, the water technician configures and activates the monitoring system in the Scenario Editor tab.
While the monitoring system is active, the water technician can check the status of the USVs using the USV Monitor tab. When the USVs have a communication line, data are uploaded to the system and the Data Analysis service is launched. The analysis can be relevant for both water managers and water technicians and may be visualized in Data Analysis tab. The Data Analysis service also generates alerts in the system, which can be consulted in Warnings Analysis tab. In addition, these alerts can be redirected to the water technician and water manager. As has been shown, different roles must be allowed access to different types of information and interface views. The role may be configured in the Administration tab.
Each of the different actors involved in the project can access the information provided by the Web UI system according to the use of case. As can be seen in the Use of Case Diagram,
Figure 6, for each actor involved, there is a different use case.
The biologist is engaged in the analysis of the measures taken by sensors, having access to the map and the readout signals. The System Administrator does not enter into a rigorously evaluate the results obtained, as this is not his main task. However, this actor has the duty to support the services deployment (such as the inference and forecast service); organise, update and optimize the Database information on USVs, water bodies, sensors and bloom models; configure the web views and interactive graphics to display information in an efficient way for other actors; perform user administration in which the permissions and the role of each of the different users are configured. The Water Authority is able to make decisions on the management of water bodies. For this reason, the The Water Authority may make decisions on the management of water bodies. Therefore, the authorities are only interested in access to the management of alerts and the visualisation of maps. In this way, the necessary actions can be taken to deal with high levels of blooms. On the other hand, Water Operators should have access to alarm management, map display, signal reading, service deployment and database updating in order to monitor waterbodies in real or simulated time. Together with the System Administrator, they are the only one able to modify the database that provides information and services to the other actors involved.
The use of each UI view for the described use case is analyzed below.
4.1. Bloom Prediction
In the Back-End, the Bloom prediction service runs daily, which uses the latest available weather forecast to predict the hydrodynamics of the water body, and from this to predict the evolution of Bloom over the next few days. This service is a suitable way to observe the evolution of Bloom beyond the available measurements. Thus, this information is beneficial for water technicians, water managers, biologists, and the corresponding authorities. Also, future alerts can be generated in the Warnings application according to the selected Bloom level limits if the user wishes.
The water technician uses this tab to analyze the possible occurrence of Bloom, as shown in
Figure 7.
In this tab, the user can select the water body, the predicted signals and the time interval. It is not feasible to analyse more than one week worth of data due to lack of confidence in the meteorological forecasts. In the prediction map shown, it can be seen that during that week, some days display high densities of algae, which also move to other areas. Therefore, the water technician must activate the monitoring system.
4.2. Scenario Editor
If the monitoring system has already been deployed, it is not necessary to configure it, but if not, the water technician can use an SCE to configure the monitoring scenario.
The SCE is a pivotal addition to the DEVS-BLOOM-WebUI, enabling users to meticulously craft and tailor the deployment of monitoring infrastructure within a water body. This tool is instrumental in setting up the initial conditions for the simulation which influence the results and the effectiveness of the EWS. The SCE provides a user-friendly graphical interface that allows for the intuitive placement and configuration of components such as USVs, sensors, weather stations, and drones on a virtual map of the selected water body.
Through the SCE, users can set the strategic deployment of monitoring equipment, ensuring comprehensive coverage and optimal data collection. The editor facilitates the creation of complex scenarios by allowing for users to define the working areas for USVs, establish links between USVs and blooms, and set parameters for each component. Once the scenario is configured, the SCE generates a .json file that encapsulates the user-defined setup, which DEVS-BLOOM then utilizes to execute the scenario.
The SCE’s integration into the DEVS-BLOOM framework exemplifies the seamless fusion of user input with the EWS, making it an indispensable tool for researchers and practitioners in aquatic ecosystem monitoring. The SCE’s capabilities are not limited to the initial setup; it also allows for dynamic adjustments during the monitoring process. This flexibility is crucial for adapting to changing environmental conditions or incorporating new elements into the escenario. As a result, the SCE enhances the adaptability and responsiveness of the EWS, providing a robust platform for proactively managing cyanobacterial harmful algal blooms.
Figure 8 illustrates the SCE interface, showcasing how users interact with the system to define the scenario. In the figure, it can be seen that a USV is configured to monitor a possible bloom in an area close to the dam, where the water intake for human supply is located.
4.3. USV Monitor
Upon activation of the system, the USV pursues Bloom, capturing essential signals for reconstructing its status. Once a communication line is established, the USV transmits the collected data to the central database. The water technician can then oversee the information stored in the database, with a specific focus on monitoring the USVs status for any potential uncontrolled events. This monitoring process is facilitated through the dedicated USV Monitoring tab.
This tab provides all the information related to the trajectories of the USVs. The Application collects all the trajectories described by the USV objects, showing the variation between the actual and reference trajectories supplied by the planner.
Ships’ trajectories are dynamically represented, showing their route and route planning for each simulation day. A slider control is incorporated to allow for the user to observe the trajectories described by the USVs.
Figure 9 illustrates the trajectory followed by the USV in the Santillana water body. It can be seen that the USV is limited to the operational area that is restricted in the scenario editing to avoid possible collisions or obstructions along the banks of the water body. The USV effectively covers the region of interest, starting monitoring that day at the initial point of Bloom. During the day, it follows Bloom according to the references generated by the inference model and returns to the initial point of Bloom at the end of the monitoring day. The base is near, where broadband communication is available to upload to the cloud all data recorded during the session, in case it could not be uploaded earlier.
4.4. Data Analysis
After the close of the monitoring day, the data are available in the database for analysis. Then, data Analysis Services trigger alerts that are analyzed in the following section.
The visual tab associated to data analysis is designed to provide managers with a detailed examination of the signals captured by the system’s sensors. This functionality allows the analysis of patterns, the identification of possible events, and the evaluation of the quality of actions taken by authorities. The data obtained are presented graphically and interactively for a more efficient interpretation, showing their value according to the date recorded.
For each water body, the signals recorded during the entire monitoring are available, and signals from actual sensors, simulated sensors, and even the forecast service can be compared. The user can zoom in to examine a specific period in detail, scroll through time to identify patterns, or even select and highlight areas of interest. The tool enables the selection of signals desired for visualization, subsequently represented as a set of subplots.
Figure 10 shows an example of this, illustrating the temporal oxygen signals from a real USV sensor and the north component of the wind speed from a virtual sensor.
4.5. Warnings
Once the simulation/monitoring is executed, within the Alarm and Water Body Management view, the Warning Service aims to alert when a predefined maximum value is exceeded in any of the sensors or analysis results. The simulator uses the marked restrictions, and once the simulator values reach or exceed the initially established threshold, the user is provided with an instant notification about critical situations.
Figure 10.
View of the data analysis application. Simulated Oxygen sensor signal (blue) and north wind speed component signal (orange) are displayed.
Figure 10.
View of the data analysis application. Simulated Oxygen sensor signal (blue) and north wind speed component signal (orange) are displayed.
The Application allows the selection of the water body on which the user wants to carry out the alert study, the date, and the alert file (if there is more than one). As shown in
Figure 11, a table is generated indicating in which situations and locations the set limits are exceeded. To improve the clarity of the information presented, an alert service is designed that compiles only the maximum values reached daily. Each sensor has a color assigned to it in the table display, which makes it easy to visualize the data extracted from the alarm service. In the first instance, the values obtained by the oxygen sensor (BloomMesOS) and the algae level (BloomMesS) incorporated in the ship are selected as the values to be monitored.
The table presents a variety of parameters detailing the measurements made. Each column plays a vital role in the presentation of this information. The ’Source’ column provides details on the source or origin of the recorded data. The ’Date’ column highlights the time the maximum value was reached during the day; this temporal information is essential for understanding the variability of the measurements over time. The ’Latitude’ and ’Longitude’ columns provide precise geospatial data revealing the exact location of the measurements; the combination of these coordinates provides a crucial geographical reference for the analysis and interpretation of the results. Finally, the ’Value’ column represents the numerical measurements or estimates that reflect the monitored magnitude, forming the core of the quantitative information to be reported. If any other type of warning report is required, the administrator can modify the alarm service in the simulator.
This view also includes a map view for the analysis of Bloom levels. As in the previous table, the interface allows for the user to choose the water body to be observed, along with the option to select the visible Bloom signals and the available dates corresponding to the simulation.
In
Figure 12, Bloom’s map obtained for the Santillana water body can be observed. The map shows several Bloom signals superimposed on the same geolocation: the measured and inferred algae sensor signal. In this way, the interactive interface makes it easy to select any point on the map, providing instant information on latitude, longitude, algae level, and the date the value was recorded.
Buttons are included to the map’s right, allowing the filtering of the entire signal between above- and below-average algae level values based on selected dates. Similarly, each button displays information on the dates on which the maximum and minimum algae levels are reached and the total duration in hours of the data display. The map automatically adjusts according to the range of values selected, thus enriching the user experience by providing the ability to explore specific data within a defined time interval, offering a more detailed analysis of Bloom signals.
This view is primarily intended for water managers and biologists who need to know the behavior of algal blooms visually and straightforwardly.
4.6. Administration
The following
Figure 13 shows a view of a prototype user administration service. With administrator permissions, users’ roles and editing capabilities can be modified within the interface. At the same time, new users can be registered by providing relevant contact information, degree, or additional information in each case.
5. Conclusions
In this paper, we presented DEVS-BLOOM-WebUI. This advanced web application acts as the Front-End of DEVS-BLOOM, a framework based on the DEVS oriented towards the IoT. This framework includes powerful capabilities such as data logging and storage, inference services, AI model training, and seamless integration of simulated and real components. The WebUI leverages the features of DEVS-BLOOM, providing accessible and adaptable interfaces for users from diverse backgrounds.
The web application’s architecture is grounded in the use of Django, a robust and popular web development framework written in Python, which is also the programming language supporting DEVS-BLOOM. This choice ensures ease of maintenance and robustness given Python’s widespread use in data analysis and machine learning applications. The application encompasses a comprehensive suite of tools, including user and permissions management, data inspection dashboards, AI model training, prediction exploration, early warning notifications, and decision support systems.
A notable addition to DEVS-BLOOM-WebUI is the SCE, which provides users with an intuitive means of designing and configuring the deployment of monitoring infrastructure within a water body. This interactive tool complements the existing features of the WebUI by enabling the creation of detailed simulation scenarios, which are crucial for the effective operation of the EWS.
The practical implementation of the IoT-based EWS, as discussed in this paper, highlights the importance of design considerations, sensor technologies, and communication protocols that are essential for the system’s seamless data integration and real-time operation. DEVS-BLOOM-WebUI, with its integrated suite of tools and the SCE, represents a significant advancement in the field of aquatic ecosystem monitoring, offering a comprehensive solution for the early detection and management of HACB.
DEVS-BLOOM-WebUI reflects the synergy between advanced simulation frameworks and user-centered design, providing a robust and flexible platform that can adapt to the evolving needs of researchers, water managers, and decision-makers in the pursuit of preserving aquatic ecosystems and public health.
As future lines of work, it is still needed to define formal metrics and experimental protocols that will be used to assess the performance and usefulness of the application. Given the complexity of the system and the heterogeneity of potential users, the definition of these protocols has to be consensuated with experts from the different fields that are involved, such as biologists, water authorities and engineers.


