Article

PV-OPTIM: A Software Architecture and Functionalities for Prosumers

Department of Economic Informatics and Cybernetics, Bucharest University of Economic Studies, 010552 Bucharest, Romania
*
Author to whom correspondence should be addressed.
Electronics 2024, 13(1), 161; https://doi.org/10.3390/electronics13010161
Submission received: 12 December 2023 / Revised: 21 December 2023 / Accepted: 28 December 2023 / Published: 29 December 2023
(This article belongs to the Topic Software Engineering and Applications)

Abstract

:
The future development of the energy sector is influenced by Renewable Energy Sources (RES) and their integration. The main hindrance with RES is that their output is highly volatile and less predictable. However, the utility of the RES can be further enhanced by prediction, optimization, and control algorithms. The scope of this paper is to disseminate a smart Adaptive Optimization and Control (AOC) software for prosumers, namely PV-OPTIM, that is developed to maximize the consumption from local Photovoltaic (PV) systems and, if the solar energy is not available, to minimize the cost by finding the best operational time slots. Furthermore, PV-OPTIM aims to increase the Self-Sustainable Ratio (SSR). If storage is available, PV-OPTIM is designed to protect the battery lifetime. AOC software consists of three algorithms: (i) PV Forecast algorithm (PVFA), (ii) Day Ahead Optimization Algorithm (DAOA), and (iii) Real Time Control Algorithm (RTCA). Both software architecture and functionalities, including interactions, are depicted to promote and replicate its usage. The economic impact is related to cost reduction and energy independence reflected by the SSR. The electricity costs are reduced after optimization and further significantly decrease in case of real-time control, the percentage depending on the flexibility of the appliances and the configuration parameters of the RTCA. By optimizing and controlling the load, prosumers increase their SSR to at least 70% in the case of small PV systems with less than 4 kW and to more than 85% in the case of PV systems over 5 kW. By promoting free software applications to enhance RES integration, we estimate that pro-environmental attitude will increase. Moreover, the PV-OPTIM provides support for trading activities on the Local Electricity Markets (LEM) by providing the deficit and surplus quantities for the next day, allowing prosumers to set-up their bids.

1. Introduction

As electricity prices have recently risen [1,2], solar energy has become increasingly attractive. Additionally, the availability of numerous grants and non-repayable funding options has encouraged the installation of Photovoltaic (PV) systems at consumer sites [3]. The solar energy gained has increased as the technology becomes more affordable and its integration is improved. Previous research focused on track systems and floating solar panels to facilitate a better integration into the power systems [4]. Another important supporter for PV systems integration are the storage devices [5,6] that can be properly designed to ensure a higher local usage [7]. Monitoring PV systems and coupling their operation with programmable appliances [8] have become essential to provide descriptive and predictive analytics [9,10,11] and integrate off-grid PV systems [12].
In this context, the primary goal of PV-OPTIM is to optimize the use of energy from local PV systems, aligning the PV generation curve with the residential load curve. PV systems typically produce the most energy at midday, coinciding with peak solar irradiation. However, residential energy demand peaks in two main phases: a smaller peak in the morning as people prepare for the day, and a larger peak in the evening when they return home and use heating and boilers. During the morning peak, PV generation is often insufficient due to lower solar irradiation, particularly in winter. Conversely, in the evening, PV generation is minimal or nonexistent as solar irradiation fades. This mismatch results in energy being generated at times when it is not needed, leading to losses. Therefore, the big hump of the PV generation curve does not overlap with the two humps of the residential load curve. This gap causes energy losses as the energy is generated and either consumed at the same time or lost. PV-OPTIM aims to address this by optimizing operational times, especially during periods of low solar availability like cloudy days, snowy conditions, or at night in order to minimize energy costs and maximize efficiency. PV-OPTIM facilitates the optimization of controllable appliances and schedules them to operate during the PV operation times. When storage is available, PV-OPTIM takes into account the charging/discharging cycles and protects the battery lifetime.
Furthermore, PV-OPTIM supports researchers to simulate the implementation of various Demand Side Management (DSM) and Demand Response (DR) programs and evaluate the behavior of the prosumers after optimizing their schedule based on different tariff schemes. Furthermore, PV-OPTIM enables implementation of flexibility and Direct Load Control (DLC) mechanisms. It is a system used by electric utilities to manage energy demand and ensure grid stability. DLC allows a utility company to remotely control certain appliances or equipment in consumers’ homes or businesses during peak demand times [13,14]. This is typically undertaken with prior agreement from the consumers/prosumers. Commonly controlled appliances include air conditioners, heating systems, water heaters, and pool pumps, as these can consume significant amounts of power. During periods of high electricity demand or when the grid is under stress, the utility can temporarily turn off or cycle these appliances. This helps in reducing the overall demand on the grid [15,16]. In exchange for participating in a DLC program, consumers often receive incentives like bill credits or reduced electricity rates. By managing demand, DLC helps in maintaining the stability of the electric grid, preventing outages, and reducing the need for additional power plants. DLC is increasingly integrated with smart grid technology, allowing for more efficient and responsive control of energy use [17]. By reducing peak demand, DLC can decrease the need for utilities to rely on less efficient and more polluting power plants, thus contributing to environmental conservation. Customers/prosumers usually have the option to opt-out of DLC events, although this might affect the incentives they receive [16,18,19]. Overall, DLC is a critical instrument for DSM, balancing energy supply and demand and promoting efficient energy use. PV-OPTIM can be integrated in simulators for EV charging stations [20,21] and electricity markets, especially for Peer-to-Peer (P2P) markets on the energy communities’ level.
PV-OPTIM has a major economic and environmental impact. The economic impact is related to cost reduction and energy independence reflected by the SSR. The electricity costs are reduced after optimization and further decrease significantly in case of real-time control, the percentage depending on the flexibility of the appliances and the configuration parameters of the Real Time Control Algorithm (RTCA). By optimizing and controlling the load, prosumers increase their SSR to at least 70% in the case of small PV systems with less than 4 kW and to more than 85% in the case of PV systems over 5 kW. Moreover, the PV-OPTIM provides support for trading activities on the Local Electricity Markets (LEM) by providing the deficit and surplus quantities for the next-day, allowing prosumers to set-up their bids. Another perspective over the economic impact is obtained in the case of the battery systems. By setting a high level of State-of-Charge (SOC), RTCA avoids multiple discharging cycles during the day, thereby prolonging the life of the batteries and maintaining them as charged to cover the load during the night.
Additionally, PV-OPTIM increases the motivation and involvement of prosumers in DSM or Demand Response (DR) programs by providing support for generation and load management based on advanced tariff systems and DLC mechanisms. The energy poverty may be mitigated by this software as it enables optimal bids and interoperability with a local market where low-income consumers can trade at better prices than those offered by suppliers.
Furthermore, PV-OPTIM has an impact on distribution system operators. By optimizing and locally controlling consumption, the exchanges between the prosumers and the main grid are reduced. The load peaks are avoided, enabling a more stable integration and management of the PV systems.
For the aggregators and electricity suppliers, PV-OPTIM is a reliable software for implementing DR programs, setting up LEM, and flexibility markets. In addition to the economic impact, PV-OPTIM also has a significant environmental impact by reducing consumption from the grid and maximizing the consumption from the local PV systems. Thus, CO2 emissions are reduced by 1000 kg and coal consumption by 400 kg per MWh generated by the residential PV systems.
The contribution of this paper consists of providing software architecture and functionalities for prosumers, including interactions, in order to promote and replicate its usage. The authors of the current version of PV-OPTIM would like to mention that it was used for simulations and results in [22,23], which is referred to as “Mind the Gap between PV Generation and Residential Load Curves”. Therefore, in “Mind the Gap between PV Generation and Residential Load Curves”, we described the methods and algorithms, whereas in the current work, we provide the software architecture that implement the methods and algorithms [23] and functionalities for the proposed prototype for prosumers. By promoting free software applications to prosumers, we believe that pro-environmental attitudes will increase. Moreover, the PV-OPTIM provides support for trading activities on LEM, allowing prosumers to create bids.

2. Literature Review

Several recent studies focused on smart Home Energy Management (HEM) [24,25,26,27,28]. Several machine learning algorithms to assist a smart HEM process were proposed [27]. In order to minimize energy costs, it receives the following as input data: prediction of load, wind and PV generation forecast, and real-time prices. The objective function is to minimize the costs, which makes this HEM different from our proposal. Furthermore, the control of appliances was not envisioned in this study.
Concepts, configurations, and enabling technologies for a HEM were underlined [28]. A multi-objective HEM system based on optimization algorithms and IoT was also proposed in [29]. The optimization method, which is based on a new improved version of the Butterfly Optimization Algorithm (BOA), consisted of two main goals, energy consumption cost and user satisfaction, whereas ZigBee is proposed as communication protocol due to its lowest consumption among various wireless technologies. The results are compared with the Particle Swarm Optimization (PSO) algorithm and BOA. However, this study did not propose a real-time control algorithm and technologies to achieve it.
Another study strengthened HEM systems, including IoT, to support smart cities, DSM, and new business models [30]. It aimed to find out trends, opportunities, future research, and challenges revealing cybersecurity, privacy, scalability, and interoperability issues. The authors found out that some of them may even expose residents to health risks. They also mentioned several ready-to-use HEM products: Smart Nest thermostat, Norm Smart Thermostat, Ambi Climate, Keen Home, etc.
An optimization strategy consisting of deep reinforcement learning for HEM was proposed [31]. The strategy consisted of a deep Q-learning (DQN) and double DQN (DDQN) to schedule the operation of appliances. The DDQN proved to be better for minimizing the cost. The results are compared with a PSO algorithm and validated using a PV-battery system.
Two comprehensive reviews on smart HEM were provided in [24,25]. A power management of PV system output is proposed in [6] to integrate flexible appliances and harvest benefits from RES and load flexibility. An intelligent controller based on an adaptive neuro fuzzy inference system was conceived to use two PV systems and provide energy supply for buildings according to their load profiles. The results provided the maximum usage of PV system output.
Furthermore, a Smart Adaptive Switching Module (SASM) architecture using fuzzy logic for an efficient integration of RES was proposed [32], showing a case study of a PV system located in Hulubeşti, Romania. The SASM works by considering the appliances size, their operational priority, and the PV output forecast. It connects the load using several fuzzy logic rules. Moreover, intelligent systems can be integrated with LEM to use the surplus and increase the revenue of the households [33,34,35].
Additionally, proposals for practical implementation of HEM to minimize the energy cost have been provided on GitHub (https://github.com/alabatie/optim-pv-battery#readme, accessed on 1 November 2023). Competitions on “Power Laws: Optimizing Demand-side Strategies hosted by DrivenData” (https://drivendata.co/blog/power-laws-optimization-winners/, accessed on 1 November 2023) provided interesting solutions to optimize the usage of a PV system and storage (battery), but the control is not included. They consisted of dynamic programming Q-Network and deterministic policy network. Grey systems and reinforcing learning are also promising in developing innovative HEM systems [36].
PV systems are becoming increasingly prominent due to their enhanced efficiency, just as global power demand continues to rise. A primary focus for both researchers and the industrial sector remains the optimization of power extraction from PV panels. Several enhancements have been introduced to enhance the performance of PV systems and maximize their utilization. These include techniques such as MPPT controllers, cooling and cleaning systems, tracking systems, floating PV systems, and the integration of PV-storage. In reference [4], an extensive review was conducted, particularly emphasizing solar tracking and floating PV systems. This review covers the concepts, advantages, and limitations of floating PV systems in the context of PV power optimization.
Efficiently integrating EVs into the future energy system is an important step in reducing carbon emissions within the energy sector. The utilization of EVs not only provides system flexibility but also offers various revenue-generating opportunities for users across multiple scenarios. In a recent study, researchers employed linear and mixed-integer linear programming algorithms to model the optimization of PV systems and the integration of PV with trading, specifically focusing on households equipped with bidirectional charging EVs [37]. The study focused on charging and discharging efficiencies of bidirectional EVs using linear the mixed-integer linear programming MILP. As a result, the revenues derived from this approach were found to be 30% lower when compared to the linear programming approach, which assumed fixed efficiencies. For an average German household using a bidirectional EV to optimize PV, the annual revenues amount to approximately EUR 310, with the majority of earnings occurring during the summer months. However, when incorporating local energy trading and leveraging the EV, an additional EUR 530 per year could be added to the overall revenue.
Paper [38] outlines an optimization approach for a hybrid PV/wind energy system, with a primary focus on minimizing both the loss of load probability and the overall system cost. The study is structured into several key components, including the optimization of the PV array, wind turbine, battery system, determining the optimal tilt angle for the PV array, and sizing the inverter optimally. The overarching objective of this optimization effort is to identify the ideal capacities for the PV array and wind turbine, ultimately leading to the most cost-effective system configuration. To accomplish this, a hybrid algorithm was employed, combining various methods to determine the optimal system configuration.
In [39], a comprehensive literature review was undertaken to gain insights into various approaches and goals related to the optimization of PV and thermal systems. The research specifically compared two multi-objective evolutionary algorithms: one based on decomposition and the other utilizing multi-objective particle swarm optimization. The analysis focused on assessing the energy and exergy efficiencies within the proposed system. The findings of this investigation revealed that both energy and exergy efficiencies experienced a significant increase as the ambient temperature rose. Ultimately, the study concluded that the first method, based on decomposition, outperformed the second method in terms of optimizing the proposed PV/thermal system.
The widespread adoption of solar PV systems, complemented by the careful selection of an appropriately sized battery, stands as a highly favored approach for minimizing energy costs and facilitating a seamless transition towards sustainable energy practices. The primary objective is to attain self-sufficiency and sustainability while reducing reliance on the traditional electrical grid. To achieve this, another study [40] introduced two pivotal elements: an efficient energy management model and the optimal sizing of battery systems. The development of the energy management system relies on linear programming techniques, with solutions sought through the application of both simplex and interior-point methods. By leveraging these approaches, the study aimed to effectively curtail the overall energy consumption costs and, in parallel, reduce dependence on the electrical grid, thereby promoting more sustainable and self-reliant energy usage.
The widespread deployment of photovoltaic (PV) systems presents new challenges, particularly concerning the management of power fluctuations resulting from the increasing penetration of PV energy into the economy, grid stability, and energy exchanges. In this context, the concept of self-consumption, involving the local utilization of a portion of generated PV energy, emerges as a solution to mitigate variations in solar power production, thereby alleviating stress on the grid. Another study focused on optimizing the integration of PV systems on the rooftops and facades of buildings with a particular emphasis on enhancing self-consumption objectives [41]. These objectives encompassed various aspects such as reducing energy exchanges with the grid, bolstering grid stability, and maximizing economic profitability. The research explores how different parameters, including building consumption patterns, load profiles, and building height, influence the optimal integration of PV systems in France. The results emphasize that the most effective placement of PV systems is notably impacted by the variables examined and the precise objectives of the optimization process. This underscores the intricate interdependencies of various factors when striving to achieve an efficient integration of PV systems.
The challenge of load matching poses a significant hurdle to the widespread adoption of PV systems in building applications. For instance, ref. [42] aimed to address this issue by undertaking a load matching assessment and optimization of PV systems across various climate zones in China. The study investigated the impact of factors such as the tilt angle, orientation, PV plot ratio, and building height on the attainment of zero energy buildings. The outcomes of the load matching assessment reveal that in all climate zones of China, rooftop PV systems in low-rise buildings can generate sufficient electricity to fulfill a substantial portion of the energy requirements, amounting to at least 70% of the total demand. This underscores the feasibility of PV systems in helping meet the energy needs of these buildings, contributing to the advancement of sustainable and energy-efficient structures.

3. Methods

PV-OPTIM is developed based on the methodology proposed in the authors’ previous work, “Mind the Gap between PV Generation and Residential Load Curves” [23], that describes an Adaptive Optimization and Control (AOC) module that forecasts the PV output, optimizes the load, monitors and controls appliances following four steps: (i) data processing and PV forecast; (ii) day-ahead optimization; (iii) real-time control; (iv) evaluation (as in Figure 1). In Step 1, data are extracted and processed from the following sources: weather APIs (current weather and predictions), IoT appliances, or smart plugs and inverter (including battery system if connected). The records are pre-processed and loaded into a local database. Then, the PV Forecast Algorithm (PVFA) is applied on the weather predictions extracted from the APIs to forecast the PV output for the next days on an hourly basis. In Step 2, the Day Ahead Optimization Algorithm (DAOA) is applied to optimally schedule the appliances based on the available PV power and operating constraints set by the user. As a result, the optimal schedule is obtained and saved in the local database. In Step 3, Real Time Control Algorithm (RTCA) continuously monitors the operation of the PV systems (including the batteries if connected) and the operation of the appliances. It also checks for the start/end time of the scheduled appliances and switches on/off the corresponding devices. The objective of RTCA is to closely follow the generation curve and to fit the load to the available PV power. Therefore, RTCA implements several operating rules that interrupt or reschedule some appliances if the load exceeds the available generation power or if the battery is discharging below the thresholds provided by the user. The evaluation of the results is performed in Step 4 using several well-known metrics for prediction, including Root Mean Squared Error (RMSE), coefficient of determination (R2), and Mean Absolute Percentage Error (MAPE), and six measures to quantify the benefits of the AOC, including total daily Cost, total daily Income, and Self-Sustainable Ratio (SSR) calculated after Optimization ( C o s t O d ,    I n c o m e O d ,    S S R O d ) as well as after Real-time control ( C o s t R d ,    I n c o m e R d ,    S S R R d ).
As depicted in Figure 1, PV-OPTIM software consists of two components: the PV-OPTIM app, which is a web application that enables user interface, and the AOC module with three algorithms implemented in Python and running on a Raspberry Pi. The orchestration pipeline between the algorithms, request/response flows, and the database is implemented in Node-RED. To communicate with the inverter and the weather APIs, http requests are used. For smart plugs or IoT appliances, Message Queuing Telemetry Transport (MQTT) messages are used to read the consumption data and send switch on/off commands. The algorithms implemented in the AOC module are briefly described in the following section.
PVFA provides the PV forecast for the next 24 h using five Machine Learning (ML) ensemble models trained on the previous 30 days records of the weather and PV generation data: Random Forest, Gradient Boosting, eXtreme Gradient Boosting, Histogram-based Gradient Boosting, and Voting. The data preparation, modeling, training, and tuning of the ML models are described in the AOC methodology in “Mind the Gap between PV Generation and Residential Load Curves” [23], including the detailed flowchart and pseudocode. The output of the PVFA represents the hourly values of the PV forecast.
The main objective of DAOA is to efficiently use the PV availability determined by the PVFA and maximize the consumption during the PV generation hours. In case PV generation is not sufficient to cover the load (in case of cloudy days or if the appliances must operate during night hours), the objective function is to minimize the electricity cost using the tariff rates provided by the grid supplier. DAOA is a heuristic algorithm that iterates through the list of the programable appliances, and, at each step, it schedules the optimal time slot for each appliance by following its objective function.
For the optimization, the prosumer inputs the following data through the PV-OPTIM interface: characteristics of the appliances (capacity, required operation time, type) and the constraints regarding the operation of the appliances during the day (duration, number of operations or cycles, preferences regarding the operating time slots). The appliances are divided into three categories (types) based on their operating cycle: (1) interruptible—their operation can be interrupted any time, and their schedule can be split into multiple time slots; (2) shiftable—their operation cannot be interrupted, and the schedule should cover the entire operating cycle expressed by the required operation time; and (3) storage (battery type)—their charging can be interrupted. For example, if the Air Conditioner (AC) is set as interruptible and the user intends to use it 120 min between 9:00 AM and 1:00 PM, then DAOA may split the operation into four time slots of 30 min. In case of an electric oven, the cycle cannot be interrupted, so if the user set its operating hours between 11:30 AM and 2:00 PM with a duration of 60 min, then DAOA schedules the entire cycle at a convenient time depending on the availability of the PV generation. As a result, DAOA determines the optimal start and end time for each programmable appliance and saves the optimal schedule into the database.
In real-time, RTCA reads the optimal schedule and decides whether to start or delay the appliances depending on the availability of the PV generation. The appliances are divided into two categories: controllable—their operation can be delayed or interrupted by RTCA; non-controllable—their optimal schedule is not altered by RTCA. For example, if the user set the washing machine as non-controllable and DAOA schedules its operation between 9:00 AM–11:00 AM, then RTCA will start the appliance at 9:00 AM and will not interrupt the operation even if the PV generation is not sufficient to cover the load. For a controllable appliance (e.g., a heating device or AC), RTCA may delay its start time or interrupt it if the PV generation is not available. Therefore, RTCA adjusts the load to the generation curve to minimize the deficit and to reduce the electricity costs. Its efficiency depends on the user option regarding the number of appliances that are set as controllable. If in case all appliances are non-controllable, then RTCA will act only as an automation system that implements the optimal schedule without reducing the real-time deficit. Benefits can be obtained if more appliances are set as controllable and RTCA reduces the load as much as possible to fit the PV generation curve. A full description of the algorithms including the mathematical models, flowcharts, and pseudocodes are provided in the authors’ previous work “Mind the Gap between PV Generation and Residential Load Curves” [23].

4. Software

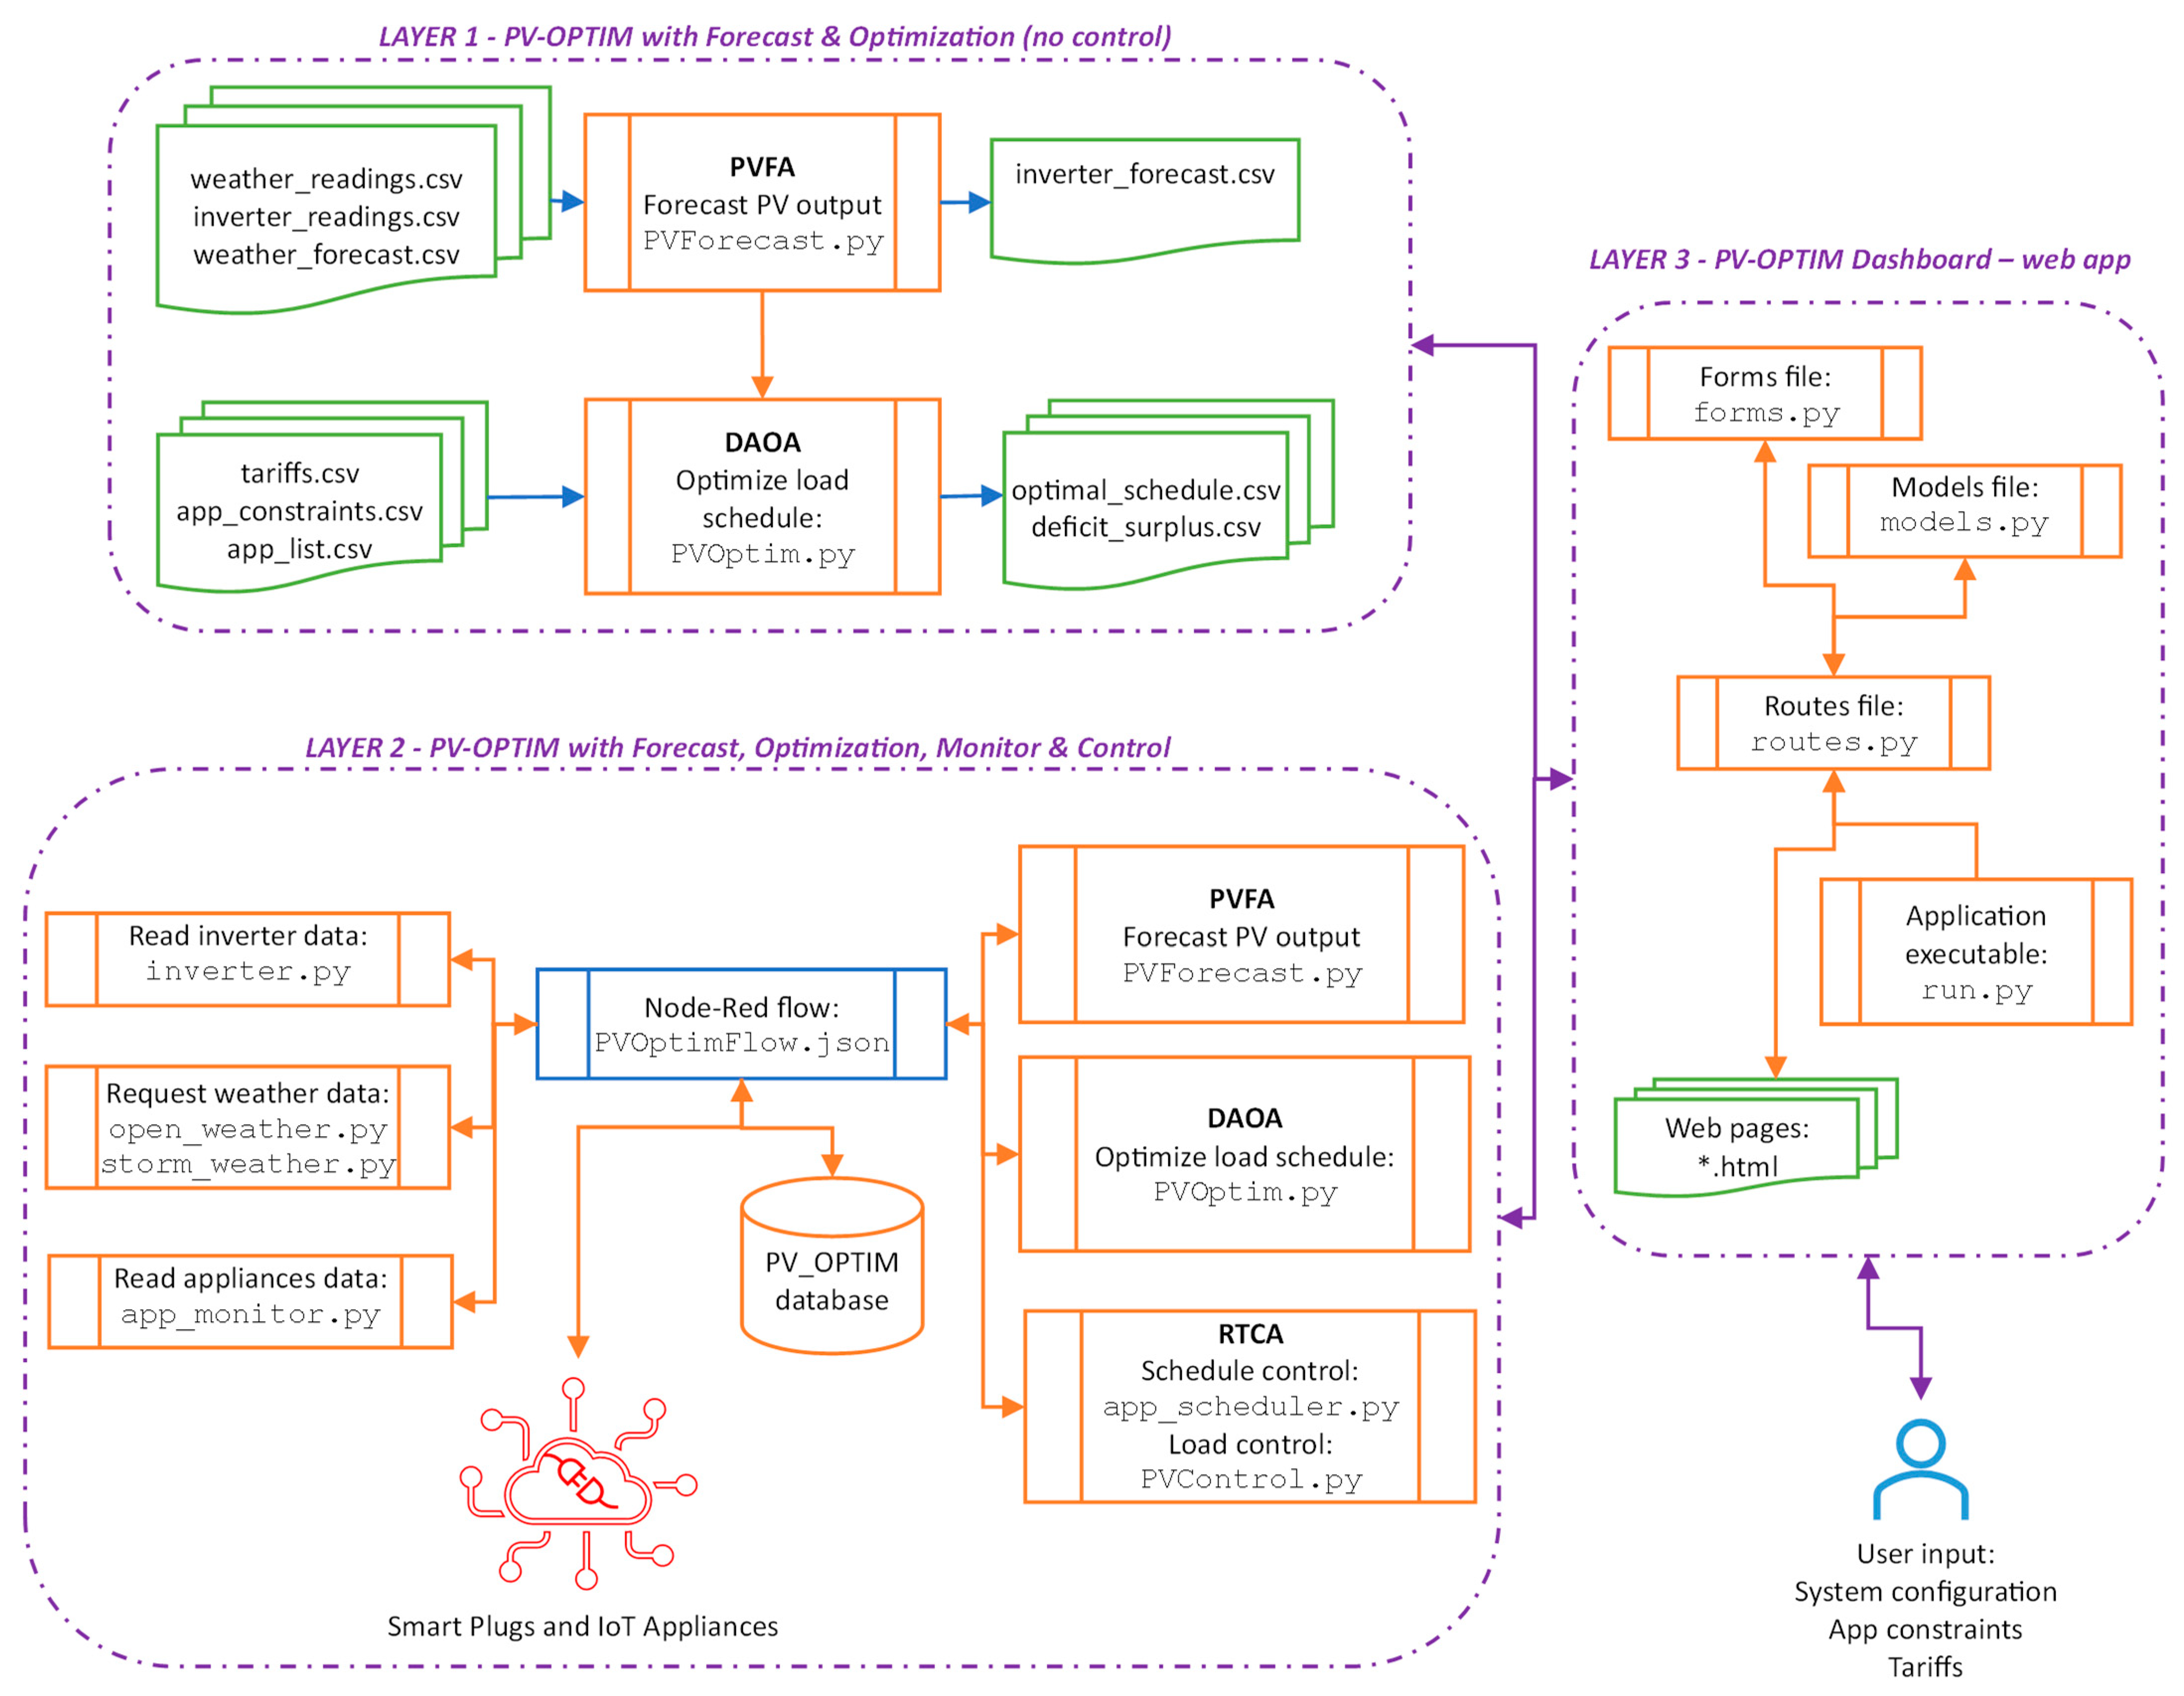
4.1. Software Architecture

PV-OPTIM is developed on two functional layers or modules that can be integrated with a third layer that provides a friendly Graphical User Interface (GUI), allowing users to configure their appliances, set up control options, analyze the optimal schedule, the PV generation, and the surplus or deficit for trading (as in Figure 2). Layer 1 contains the implementation of the PVFA and DAOA algorithms PV-OPTIM software is licensed to use under the Apache 2.0 license and is uploaded on the GitHub repository (https://github.com/AdelaBara/PV-OPTIM, accessed on 1 November 2023).
Layer 1—PV-OPTIM Forecast & Optimization aims to optimally schedule the electricity consumption for the day ahead by considering the PV generation forecast, tariff rates, and the user constraints regarding the operation of the appliances. Layer 1 is developed based on the following algorithms, already described in [23]: the PV Forecast algorithm (PVFA), which uses ML models to forecast the day-ahead PV generation based on the previous 30 days records, and the Day Ahead Optimization Algorithm (DAOA), which uses PVFA output, tariff rates, and the operation constraints of the appliances to optimally schedules the day-ahead consumption. Layer 1, located in the GitHub repository, can be used independently of Layer 2 and 3. The current configuration consists of four input files (.csv) and two monolithic Python files, PVForecast.py and PVOptim.py that implement PVFA and DAOA algorithms. The input data of the PVForecast.py can be provided as .csv files containing the following data:
-
Time series data of the weather records in proximity of the PV system: temperature (°C), humidity, cloud cover (%), UV index (file weather_readings.csv).
-
Time series data of the PV generation corresponding to the generated power (kW) and, if available, the status or operation code of the inverter to validate the output (file inverter_readings.csv). The data sets contained by these two csv files should contain records for at least 30 days before the forecasting period with the same time resolution.
-
Estimation of the weather parameters (temperature, humidity, cloud cover, UV index) for at least 24 h ahead using the same parameters and metrics as in file weather_readings.csv. The forecasting data should be included in the file weather_forecast.csv.
The output of the PVForecast.py is the prediction of the PV output for the next period that corresponds to the period of the weather forecast or maximum 10 days in case weather_forecast.csv contains a larger set. The values are stored in inverter_forecast.csv. PVOptim.py uses, as input, the PV forecast and two more .csv files containing the following data:
-
Tariff rates applied by the electricity supplier for the next 24 h (tariffs.csv).
-
The list of the appliances that will be scheduled, their characteristics (capacity, required operation time), and the operation constraints for the next 24 h (app_list.csv and app_constraints.csv).
The output of the PVOptim.py is the optimal load schedule for the next 24 h stored in optimal_schedule.csv. The file contains rows for each scheduled appliance with the following attributes: ID appliance, optimal start time, optimal end time, and capacity. As a result of the optimization process, the deficit or surplus for each interval is also calculated as the difference between the predicted PV generation and the total optimal load (including non-programmable consumption). These values are saved in the deficit_surplus.csv file.
Samples of the input and output files are uploaded on the GitHub repository.
Layer 2—PV-OPTIM Monitor & Control enables real-time monitoring of the consumption and PV generation, including SOC of the battery system in case it is connected to the inverter. For Layer 2, a more complex architecture is involved, including components to access the inverter’s data, to control appliances (via smart plugs or other actuators), and to store data into a local database (MySQL or MariaDB). In the current version, PV-OPTIM Control is connected to Growatt inverters and TP-Link smart plugs, and the connectivity flows are modelled in Node-Red using Python functions and Kasa nodes. The flows can be easily updated or extended for other inverters and smart plugs. The database schema, the script, and the details regarding the connection are provided in the full documentation of the software (https://github.com/AdelaBara/PV-OPTIM, accessed on 1 November 2023). Layer 2 contains several Python scripts that collect weather data (open_weather.py and storm_weather.py), inverter’s records (inverter.py), and appliances’ data (app_monitor.py), as well as two Python scripts (app_scheduler.py and PVControl.py) that control the operation of the appliances and implement the Real Time Control algorithm (RTCA) described in the authors’ previous work, “Mind the Gap between PV Generation and Residential Load Curves” [23]. To automatically collect the weather data (current and forecast), the user needs to provide the API keys and location (latitude and longitude) to weather.py for two weather data providers: OpenWeather (https://openweathermap.org/api, accessed on 15 October 2023) and StormGlass (https://stormglass.io/, accessed on 15 October 2023). The accounts can be easily created using free access plans. The weather data are requested every 60 min using urllib.request Python package and then the received .json file is saved into two database tables (T_WEATHER_READINGS and T_STORM_WEATHER).
For access to the inverter’s data, in the current version, PV-OPTIM is connected directly to the Growatt server using growattServer Python package (https://github.com/indykoning/PyPi_GrowattServer, accessed on 15 October 2023; https://github.com/Sjord/growatt_api_client, accessed on 15 October 2023). The user needs to supply the username and password to connect to the Growatt server and inverter.py automatically retrieves the PV generated power, total load power, SOC, power imported from grid, battery power, and the status of the inverter at 5-min intervals. The records are stored into table T_METER_READINGS.
The load control is enabled by integrating, into the PV-OPTIM, several smart plugs that measure the consumption power and allow switching on/off operations. The smart plugs can act as meters and actuators for several appliances, including boilers, AC, heating devices (radiators, convectors), water pumps, lights, and charging devices. To configure the smart plugs, users should install Node-Red, open the orchestration flow (PVOptimFlow.json), and set up the nodes corresponding to the smart plugs. The current version of the flow uses Kasa nodes that enables the connection to the TP-Link smart plugs (models HS100, HS110, and KP115), but the flow can be easily modified to add/remove nodes for other providers such as D-Link, Orvibo, Xiaomi, or other plugs that have npm nodes for connectivity. A complete configuration guide for modifying the orchestration flow in Node-Red is provided in the software documentation available on the GitHub repository. The readings from the smart plugs nodes are collected every 30 s, joined, and sent to the Python script app_monitor.py that validates and saves the records into the database table T_APPLIANCE_READINGS. The time intervals for collecting data can be easily changed in the orchestration flow by modifying the intervals of the input nodes.
The appliances are controlled in real time by the RTCA algorithm implemented as two Python scripts: (i) app_schedule.py—runs every 30 s and checks if there is any appliance scheduled for operation or interruption. It queries the table T_APPLIANCE_OPTIMAL_SCHEDULE to retrieve the list of appliances that are scheduled by DAOA algorithm. In case the list contains actionable appliances, it switches off the appliances that need to end their operation and calls PVControl.py to switch on or delay the schedule of the appliances that need to start their operation; (ii) PVControl.py implements the operation rules of RTCA regarding the load control depending on the availability of the PV generation, SOC and battery power. Thus, it runs every 5 min after reading the inverter data by inverter.py and decides whether to switch-on the scheduled appliances or delay their operation at convenient hours. In case the load already exceeds the PV generation, RTCA interrupts the current operation of one or more appliances, depending on the control rules set up by the user. By default, the parameters of the control rules are set as follows:
-
loadRate = 1000 W representing the maximum allowed difference between generation and consumption. If the load exceeds the PV generation with more than 1000 W then the interruptible appliances are switched off or delayed.
-
SOCcharged = 60% representing the minimum battery charge level (%). If the battery is below this level, the scheduled appliances are delayed until the SOC is 60%.
-
SOCdischarged = 80% representing the maximum battery discharge level (%). If the battery is discharging and is below 80% then the interruptible appliances are switched off to protect the battery state and to allow its use during the night.
-
PBATdischarge = 400 W represents the maximum allowed discharging power. If the battery discharges more than 400 W, it may indicate that there is a high consumption that will lead to the rapid discharge of the battery. Thus, RTCA can stop some interruptible appliances in order to reduce the discharging power.
The parameters of the battery power and SOC are considered only if the battery system is connected to the inverter. The parameters are stored in table T_SASM_PARAMS and can be updated using the GUI detailed in the following section.
Layer 3—PV-OPTIM Dashboard enables user interaction with Layer 1 and Layer 2, and it is developed using Flask development framework, Jinja template engine, and Bootstrap 4.5. The GUI is developed as a web interface with Bootstrap responsive components for the front-end. The main components of Layer 3 are presented in Figure 3. The user interacts with the web application and accesses the data regarding the PV generation, status of the battery, total load, and monitors and configures appliances (capacity, required operation time, type), plans their operation and sets up constraints, runs the optimizer to optimally schedule the consumption, views the PV forecast, and configures the RTCA parameters. The routing process between the http requests (GET, POST), URLs, and Python functions is implemented in routes.py using [@app.route](‘/’) decorator. The controls of the user interface (input, drop-down lists, calendar, submit buttons) are defined in forms.py and are used by Jinja template engine to render them into the html pages. The database connection and the classes of the data model are defined in the models.py using SQL Alchemy, an Object Relational Mapper for Python. It maps each database table to a corresponding class, defining data types, constraints, primary keys, and relationships between the data objects.

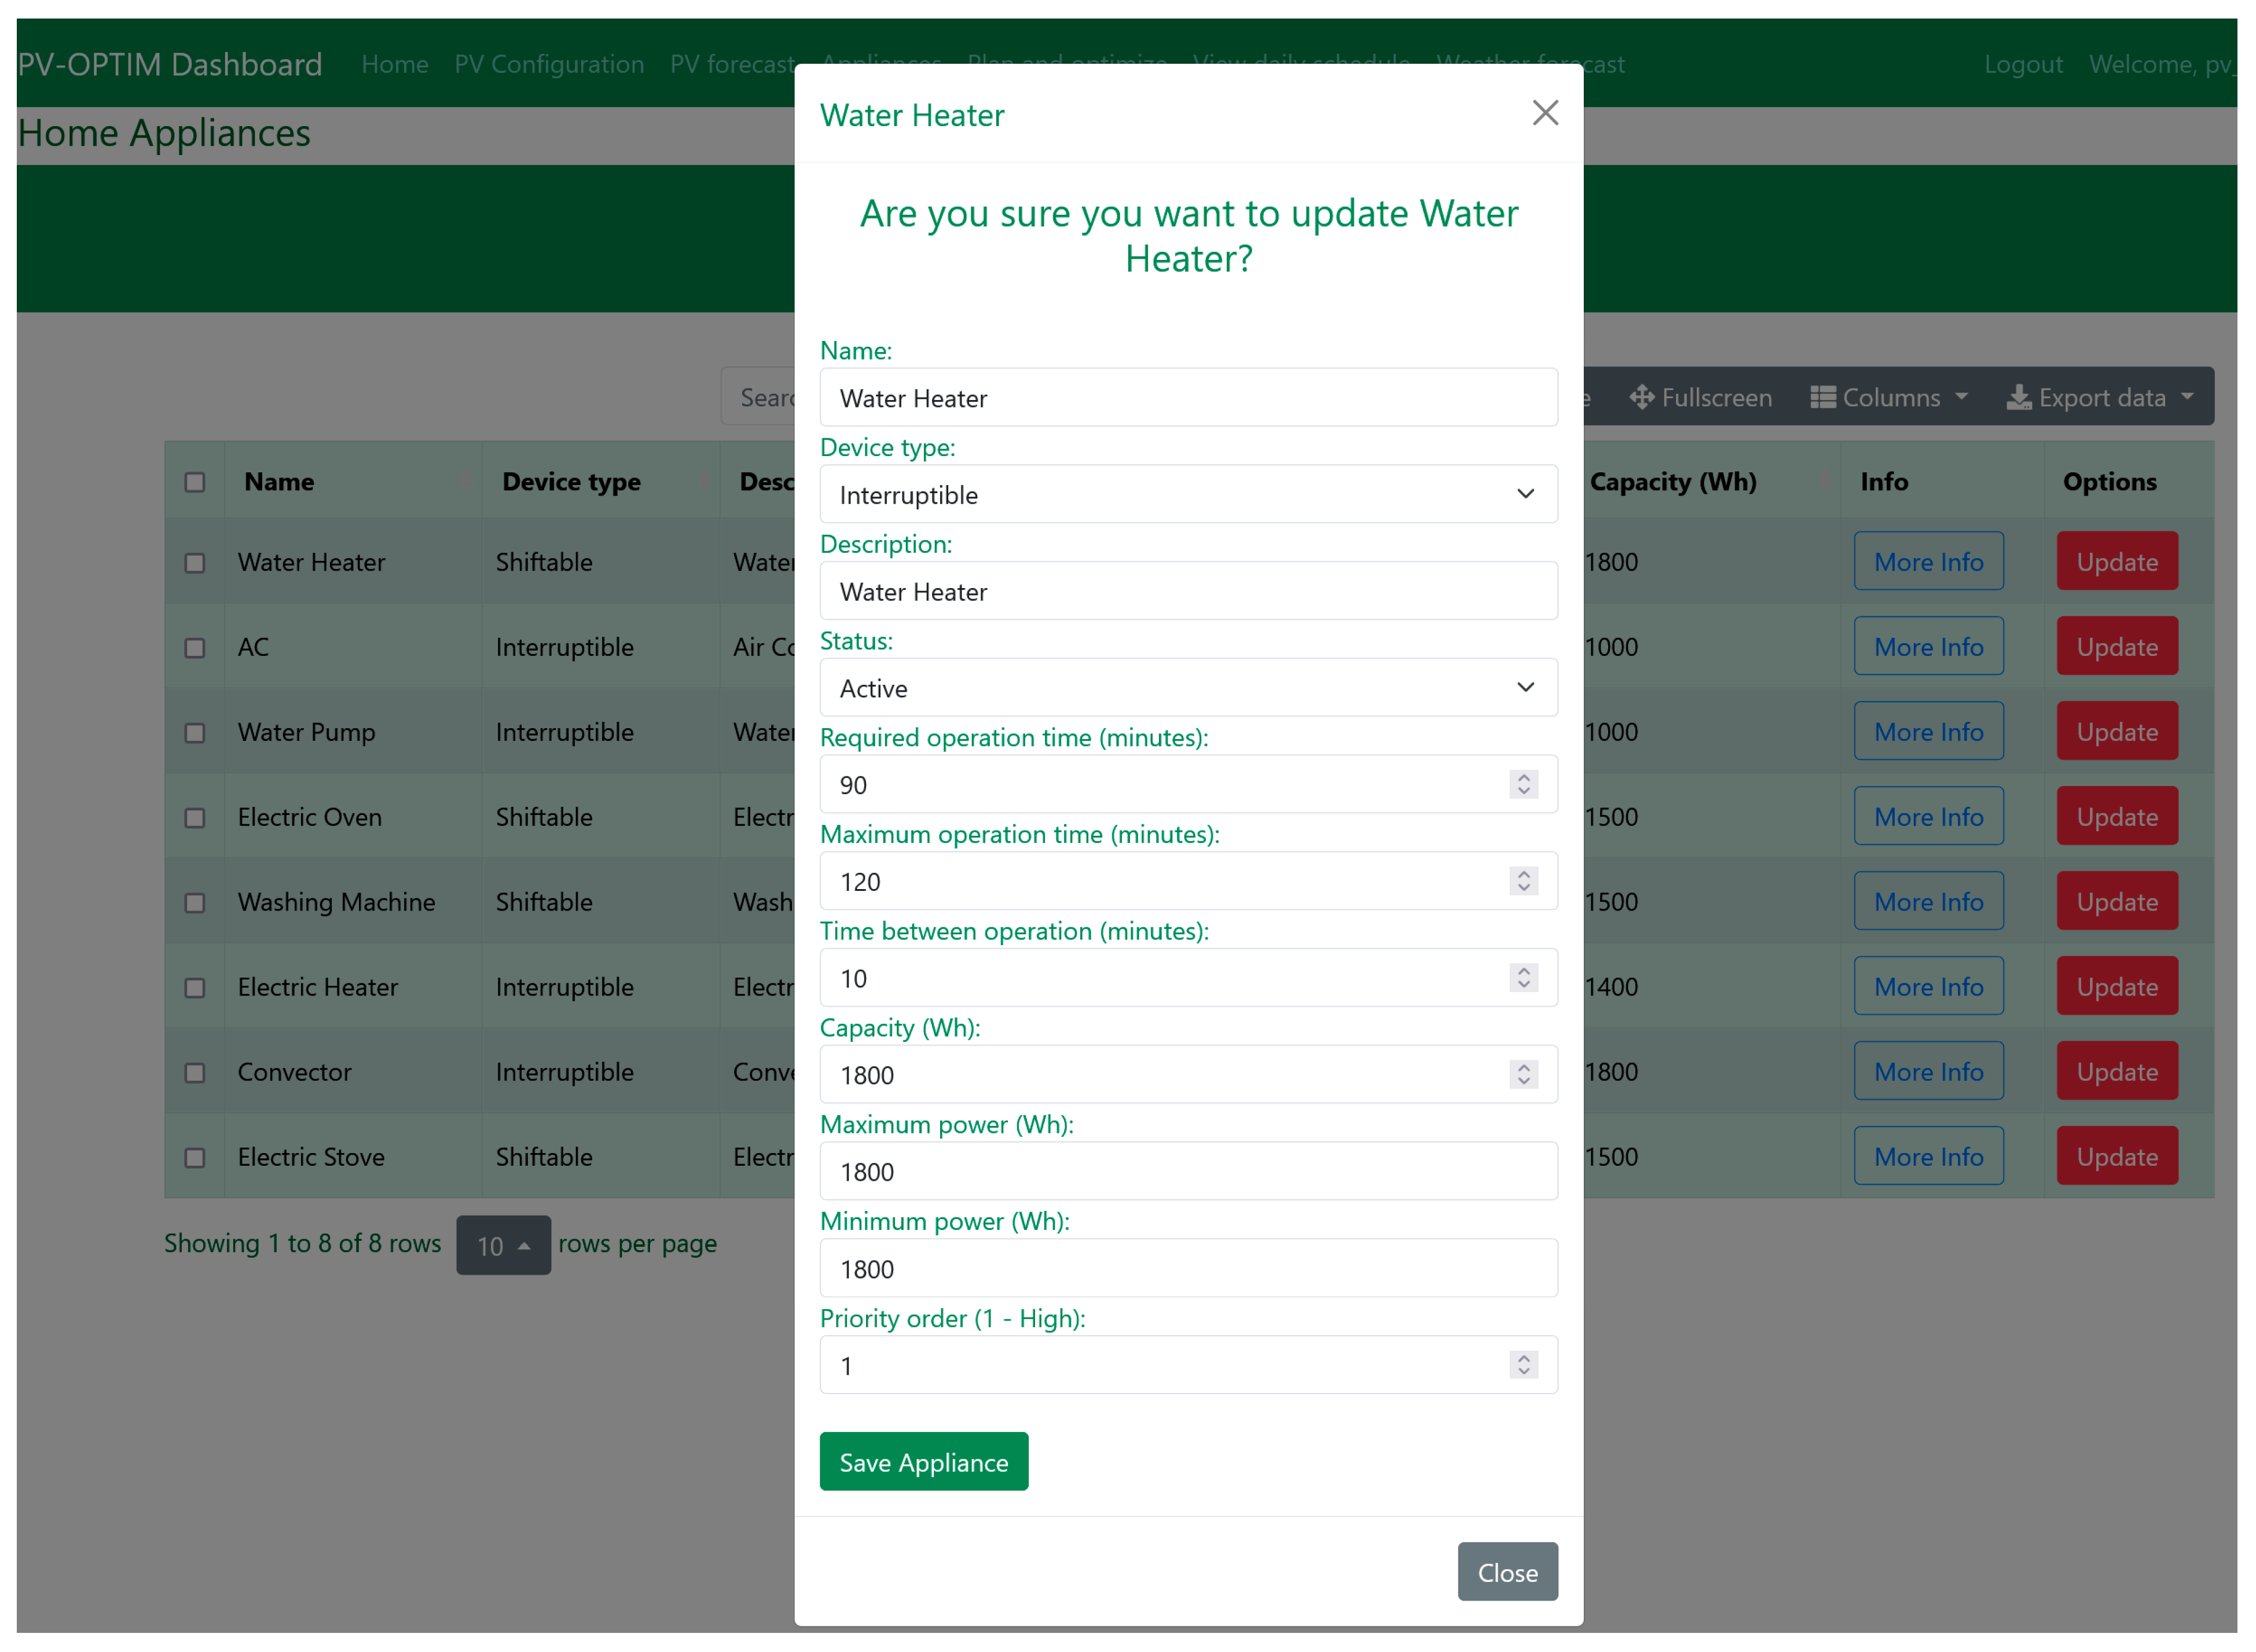
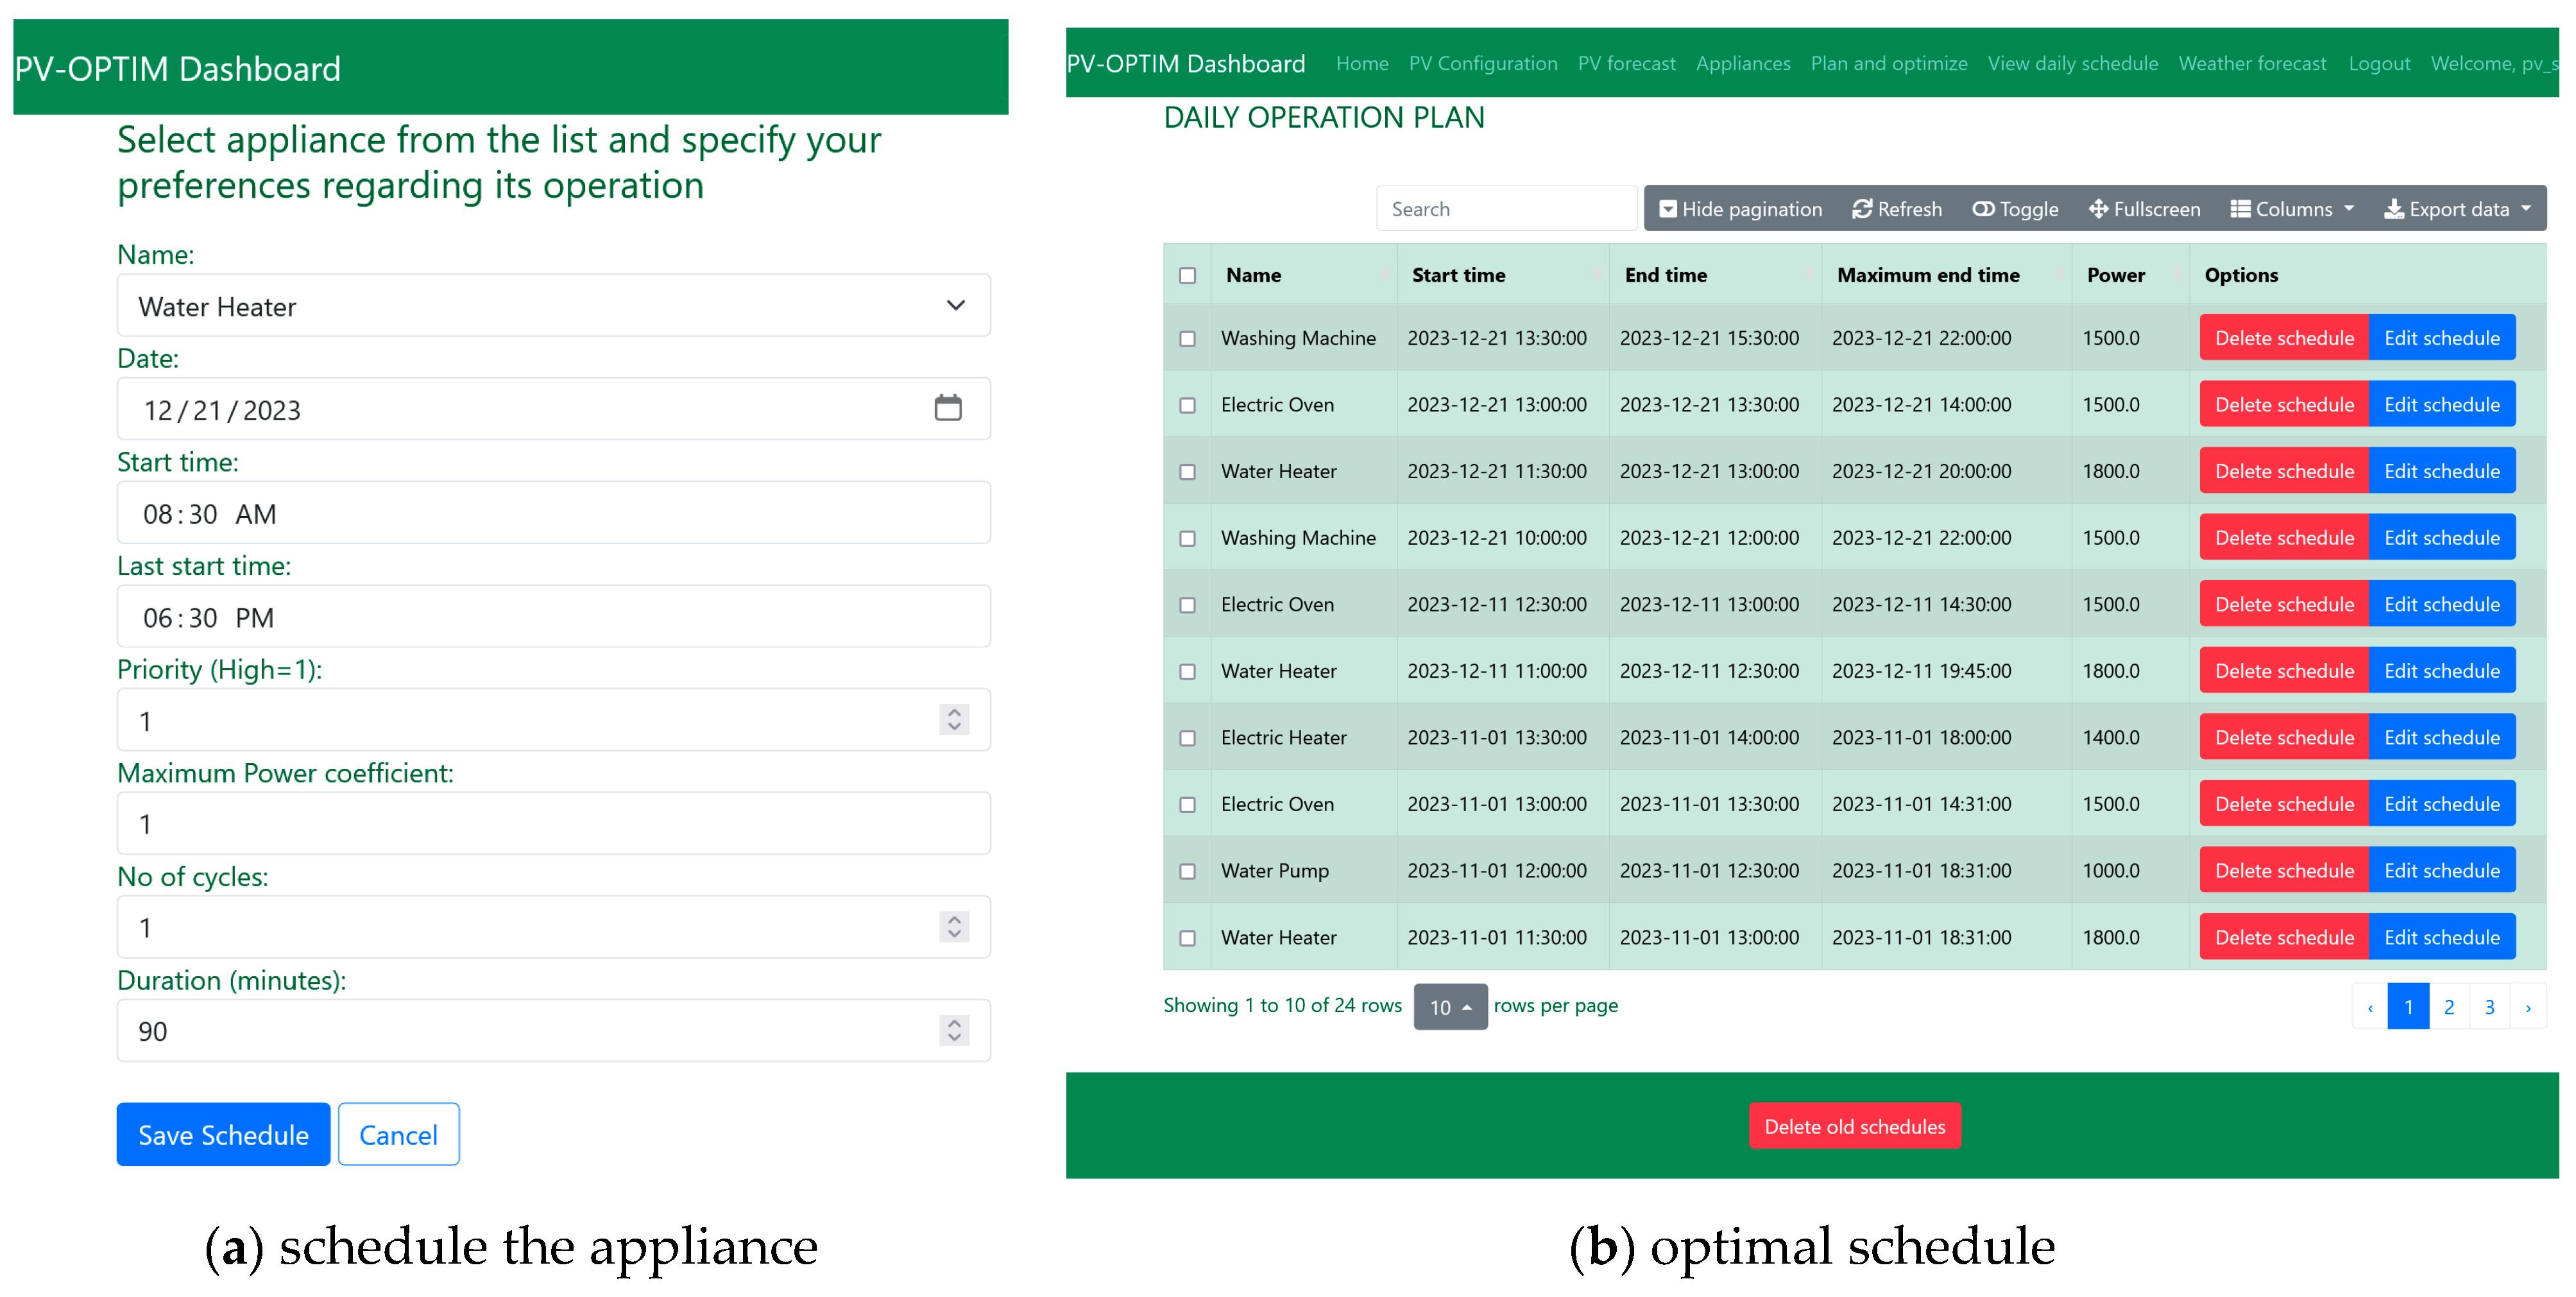
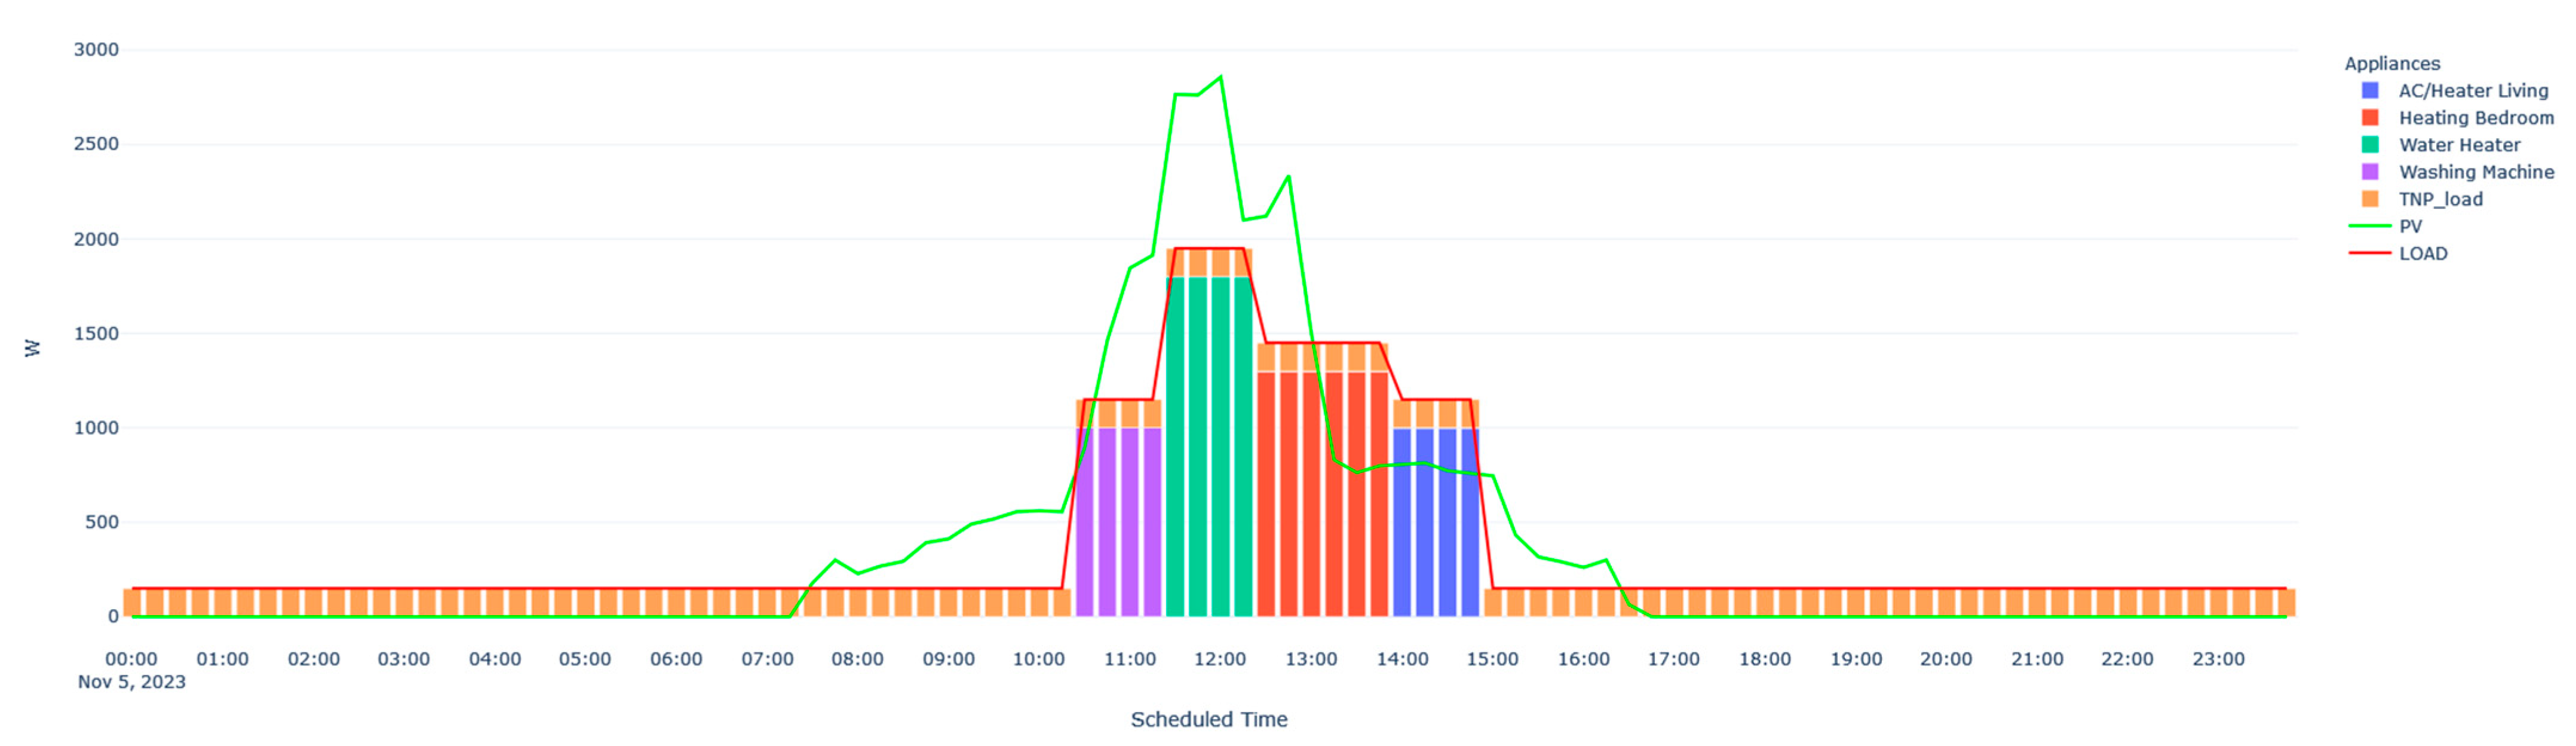
4.2. Software Functionalities

PV-OPTIM aims to maximize the consumption from the available PV generation, reduces the exchanges with the main grid, diminishes the electricity costs, and increases prosumers’ independence regarding grid supply. These goals are transposed into the functionalities of the software providing methods and tools for the prosumers to properly configure the appliances, run the optimizer to schedule their operation, monitor the PV generation and the battery system, and control the load. PV-OPTIM automates the data collection and processing flow from weather APIs, smart plugs, and inverters, therefore the users only need to initially configure the connection to these sources and the time interval for the requests. The PV forecast and the load control in real time are automatically performed by the PV-OPTIM using the control rules provided by the prosumer.
By automating these tasks, the user intervention is reduced and the interaction with the application becomes facile. After configuring the orchestration flow in Node-Red, the prosumer runs the web application and accesses it through a web browser. Then he adds and configures the appliances that will be used for monitoring and control providing the following data in the web form (as in Figure 4): name and description, device type (Interruptible, Shiftable, Battery), required operation time, maximum operation time, time between operation, actionable (Yes/No), capacity, and maximum and minimum consumption power.
The prosumer plans the operation of the appliances by specifying the constraints regarding their start time, end time, number of cycles, and duration in the web form (as in Figure 5a), then runs the optimizer to receive the optimal schedule of the load, using the PV forecast for the selected day (as in Figure 5b).
The optimal schedule can be updated by modifying the start and end time of the appliances or by deleting or adding new appliances that the user will use. The optimizer can be run again to re-schedule, or the user’s plan can be saved without running the optimization, but it will be controlled by the RTCA algorithm in real time to minimize the deficit between the PV availability and total load. In real time, the prosumer can monitor the appliances or the total load, PV generation, and SOC of the battery (Figure 6) and compare the PV forecast with the actual output (Figure 7).
For the control rules regarding the loadRate, SOCcharged, SOCdischarged, and PBATdischarge parameters, the user can adjust them in the Parameters Configuration page. In case a controllable appliance is scheduled to start, the RTCA checks if the total load including the consumption of the appliance will not exceed the PV generation plus the loadRate parameter. If there is a deficit, then the appliance is re-scheduled to start after 10 min, but without exceeding its maximum start time provided by the user. Furthermore, in case the total load exceeds the generated power plus loadRate, then RTCA switches off some appliances that are currently operating and re-schedules them. The batteries connected to the inverter are protected by the RTCA, which does not start an appliance if the SOC is below SOCcharged parameter. It also interrupts some appliances if the battery is discharging below SOCdischarged or if the power discharged from the battery is greater than PBATdischarge. Therefore, the battery system is protected and kept within certain charging limits set by the user. The daily operation schedule is automatically updated by RTCA in case an appliance is rescheduled or interrupted.

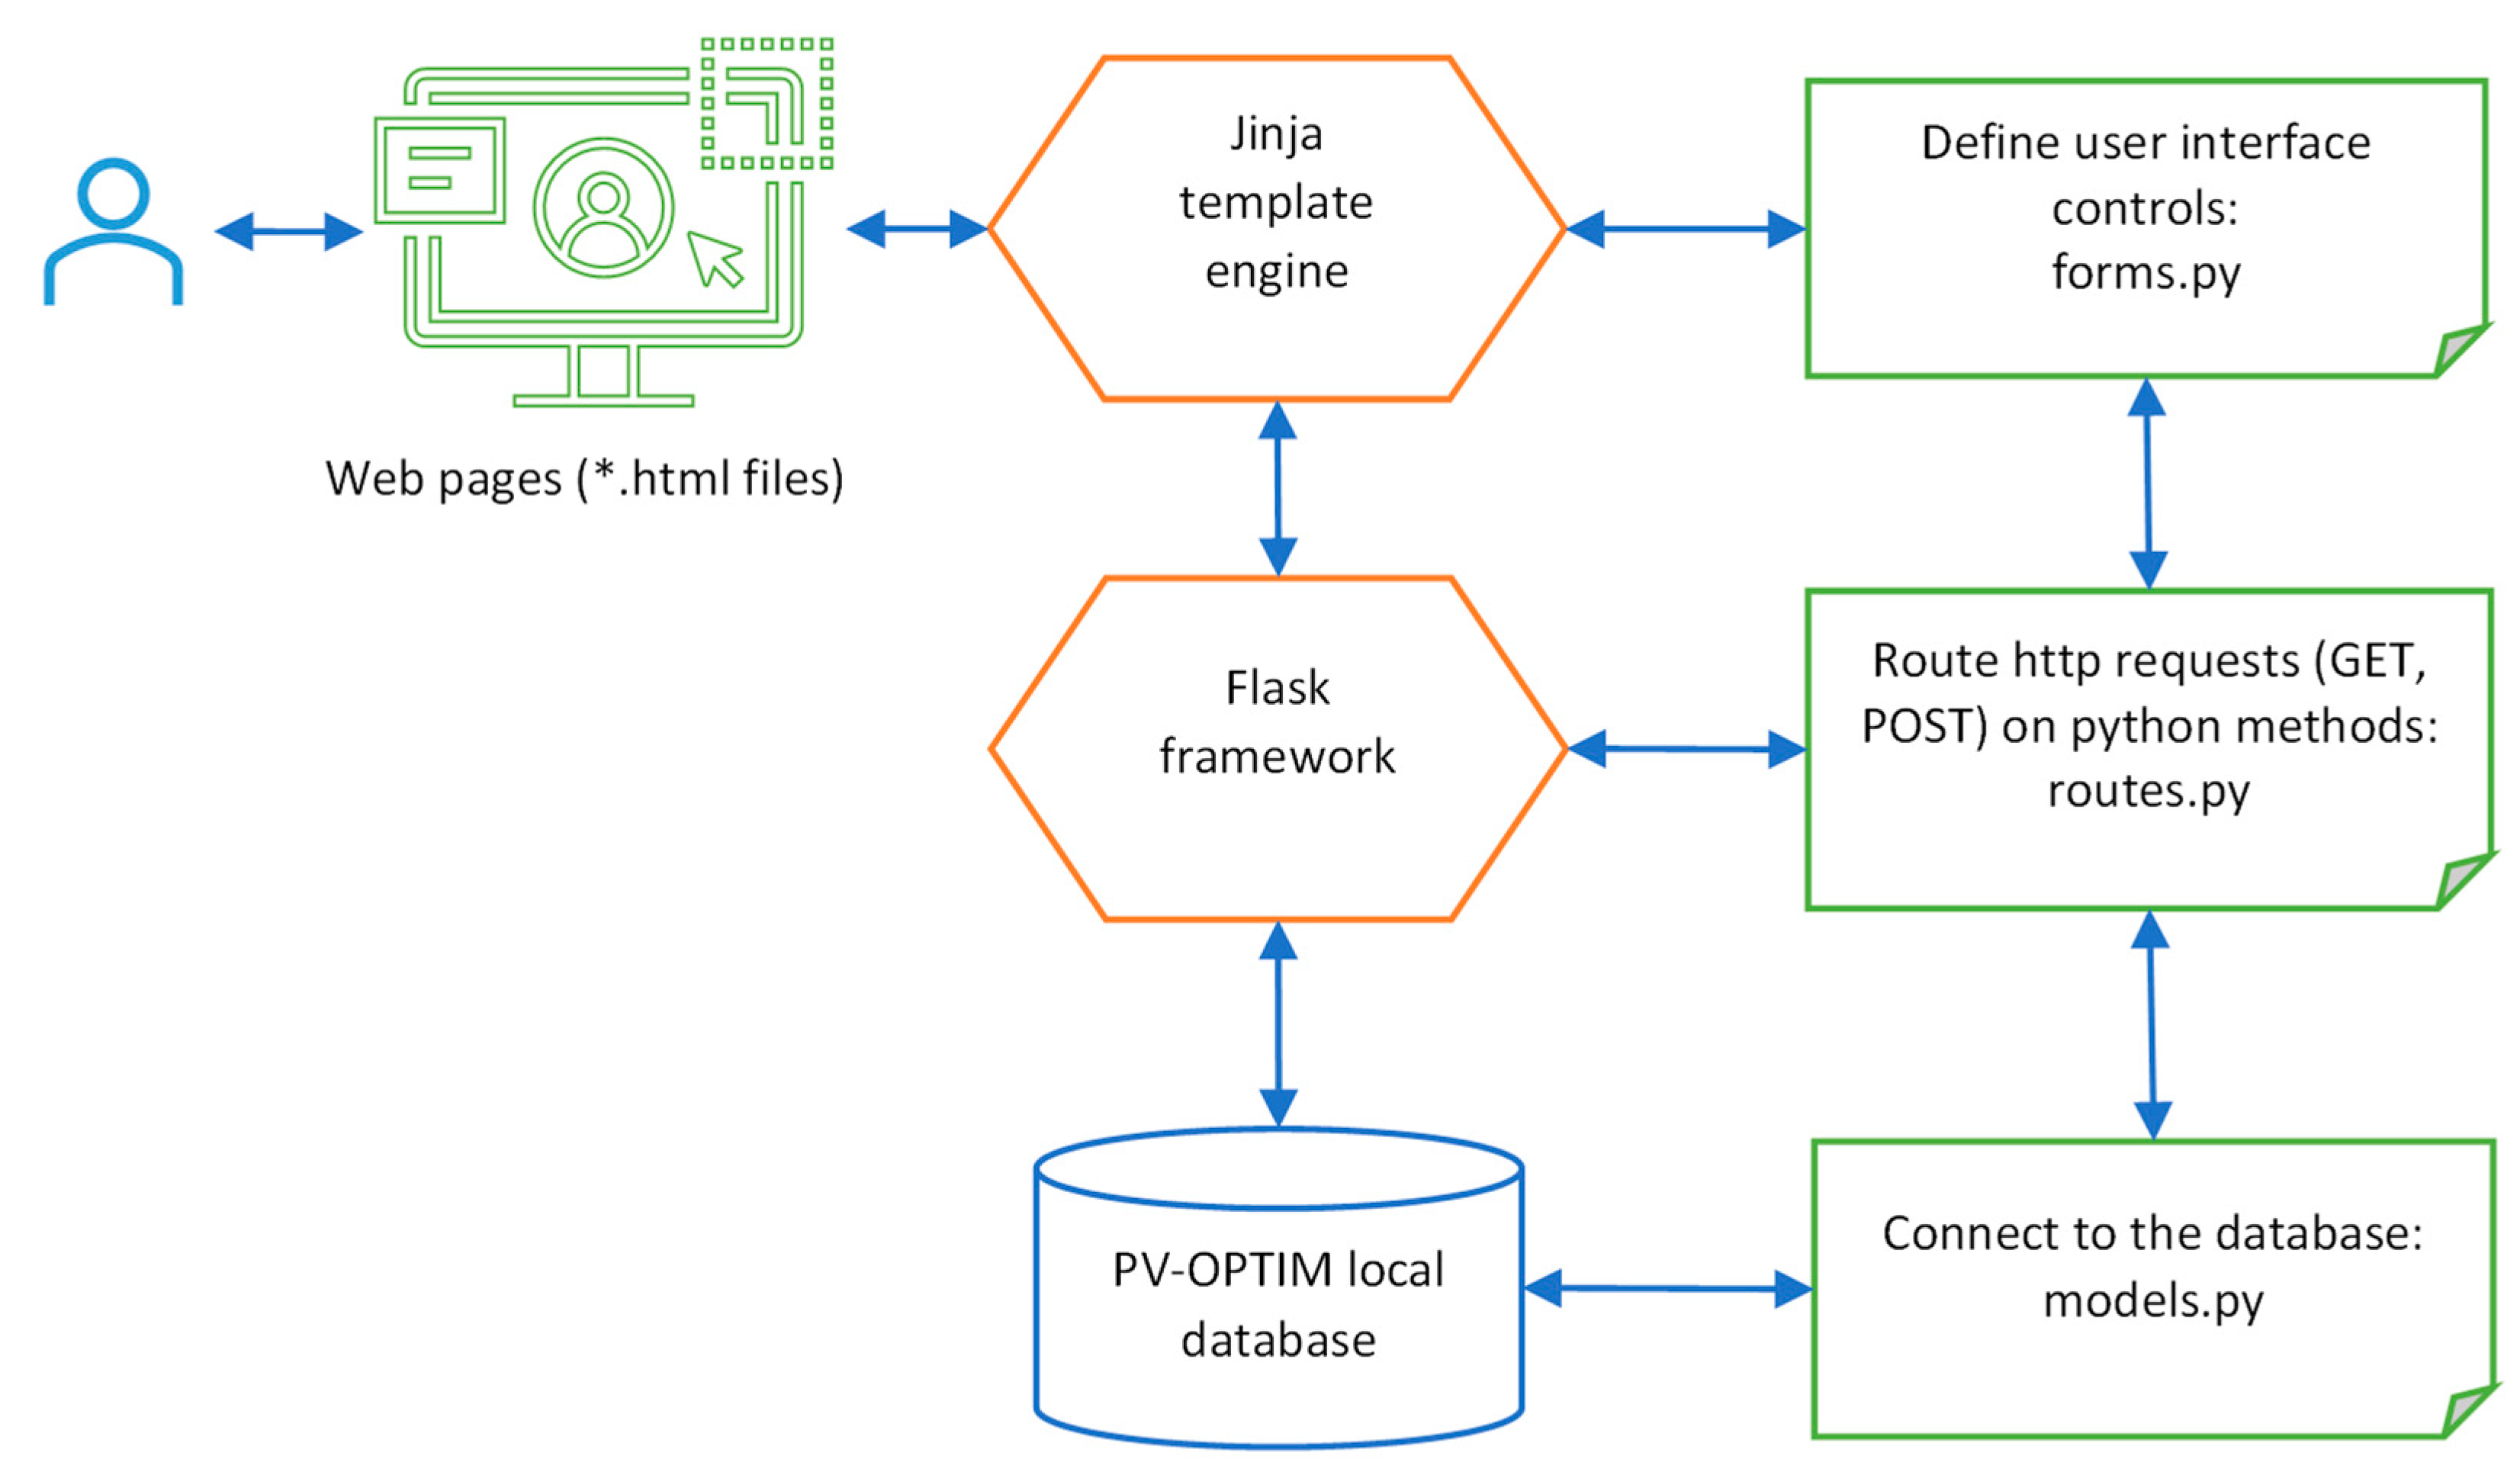
4.3. Deployment and Dependencies
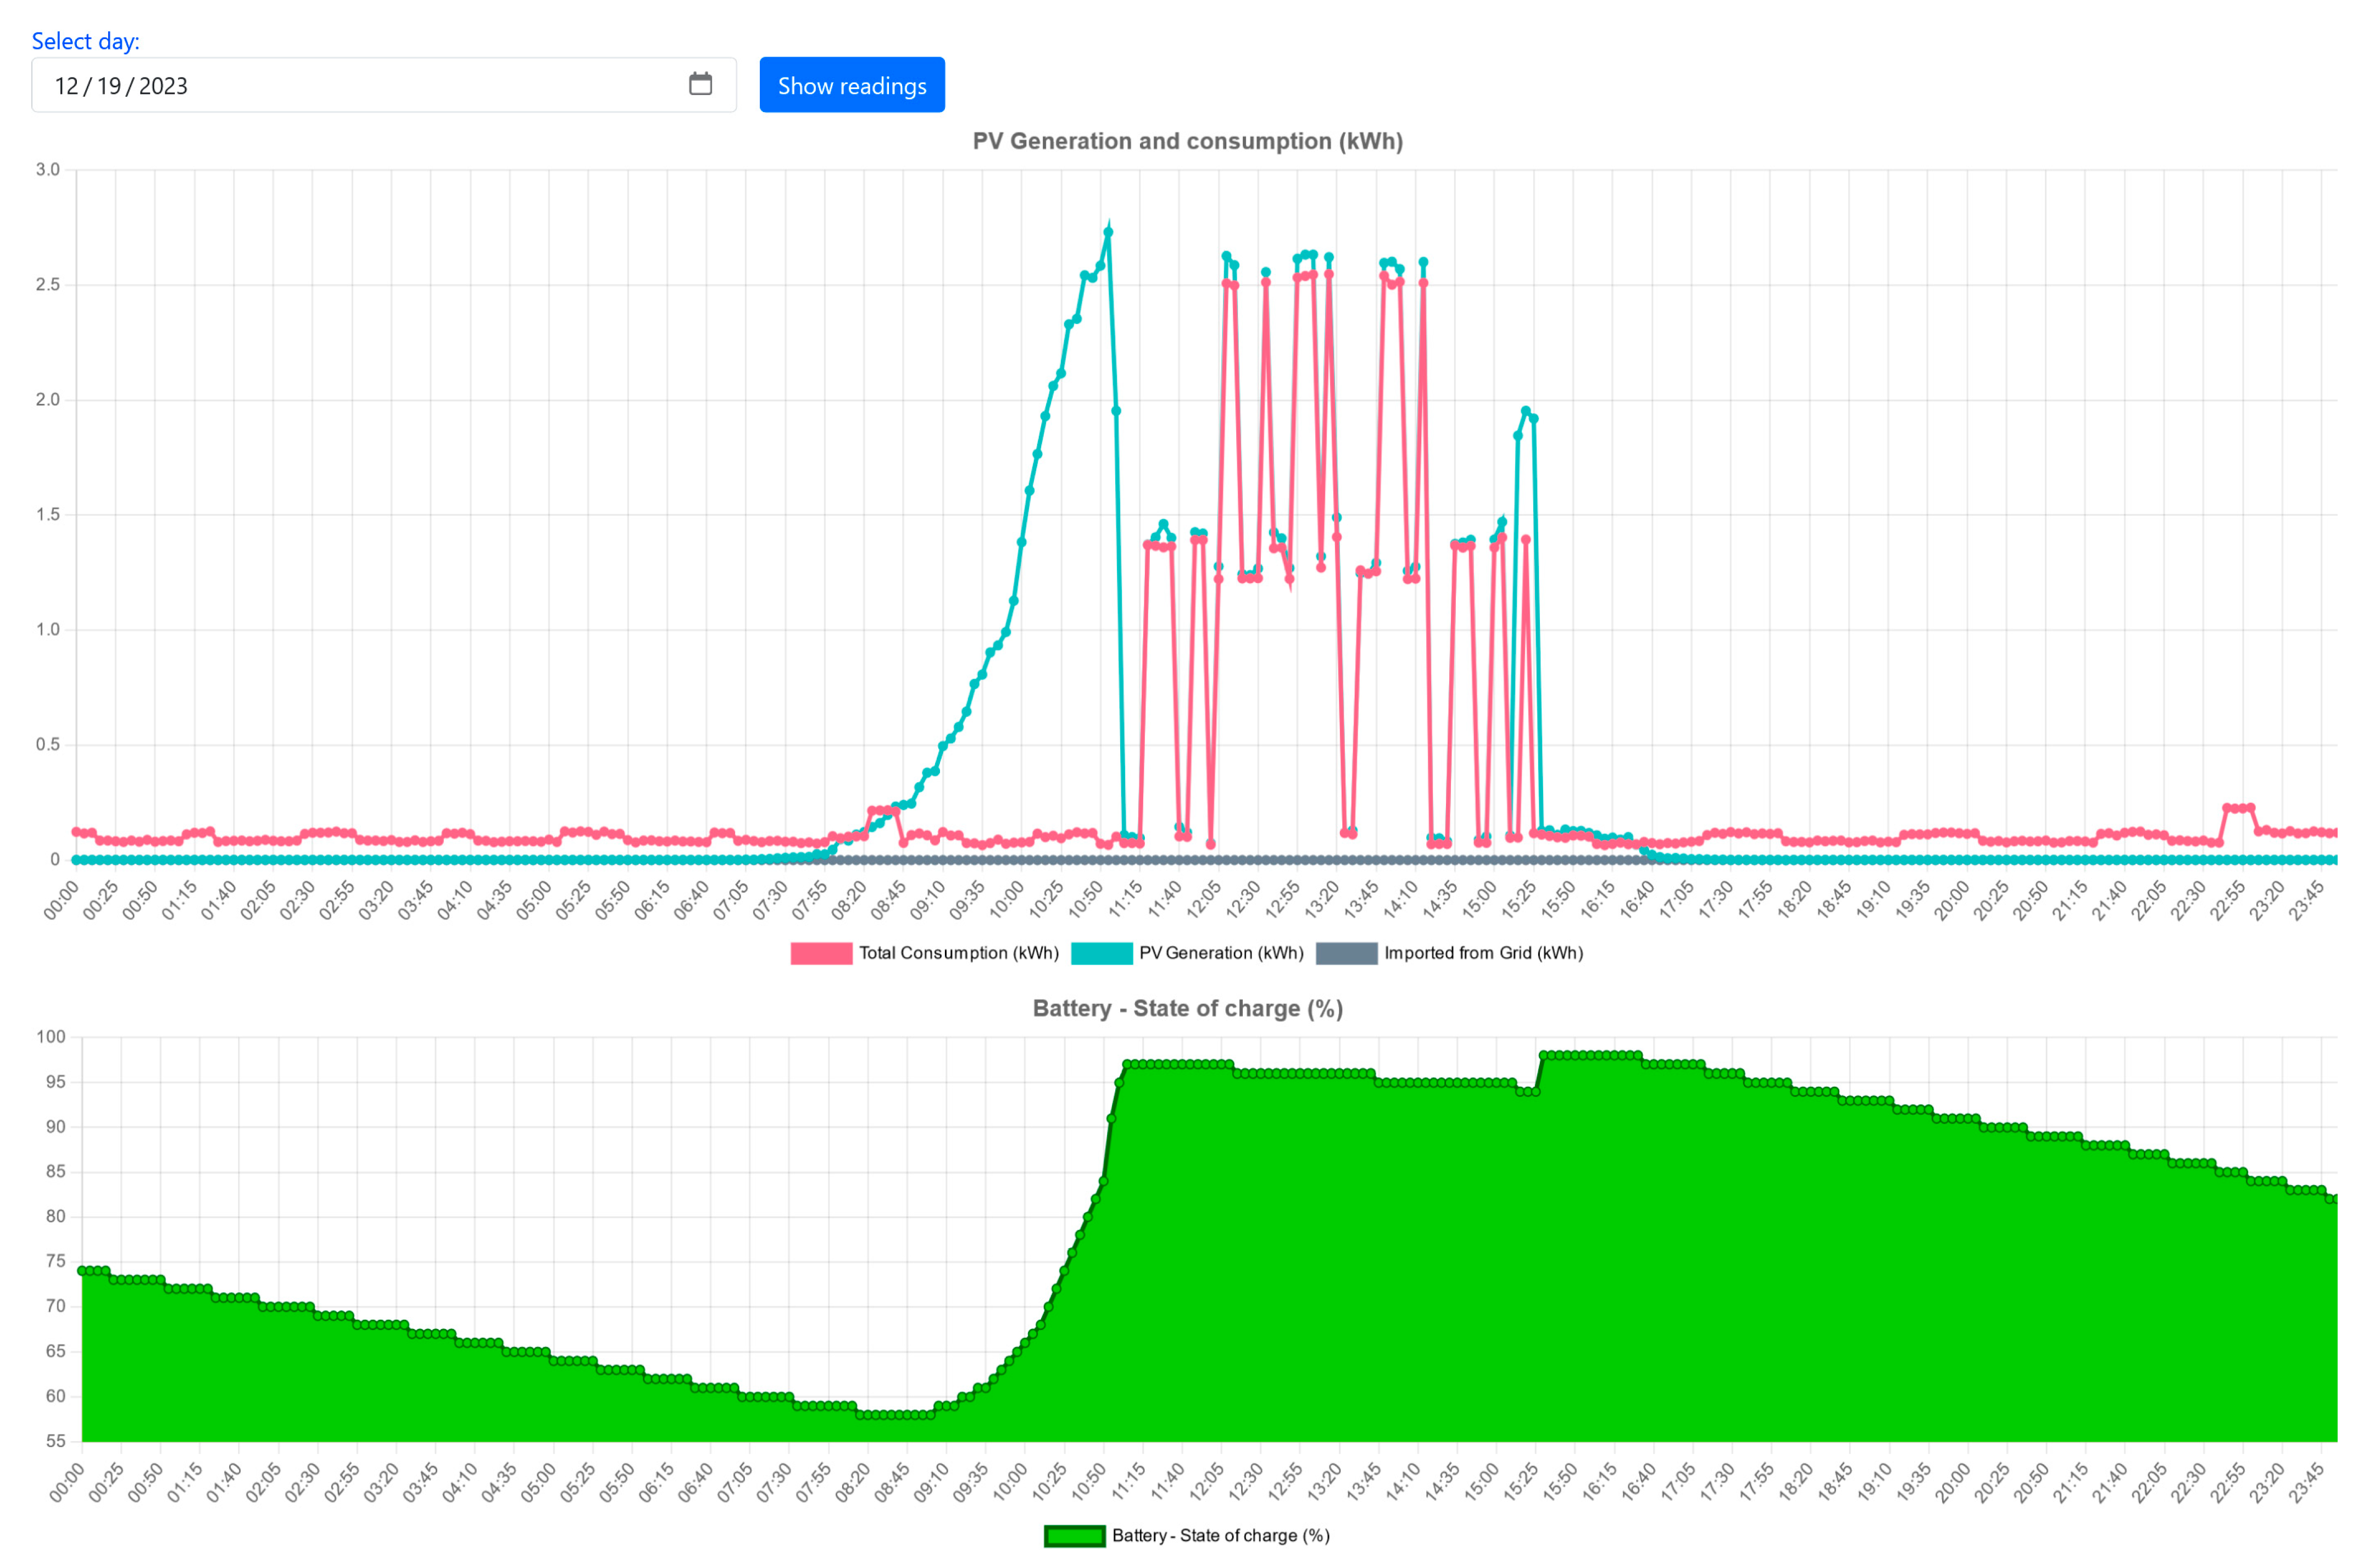
PV-OPTIM is developed in Python and uses the following dependencies for the implementation of the algorithms: (i) pandas and numpy for data manipulation; (ii) mysql-connector-python for data storage; (iii) scikit-learn and xgboost for ML algorithms; and (iv) plotly for data visualization.
Layer 2 requires a database management system installation. MySQL or MariaDB should be configured locally by setting the user account and creating the database schema and tables. The database script is provided in the GitHub repository. In Layer 2, to request weather data from the APIs, the urllib.request library is used. To retrieve data from Growatt inverters, growattServer library can be used to allow easy access based on the API provided by the Growatt server (https://server-api.growatt.com/, accessed on 15 October 2023). The orchestration flow that automates the data collection and connectivity between inverter/smart plugs requires Node-RED installation and configuration. Furthermore, for the connection to TP-Link smart plugs, Kasa node should be downloaded and installed using Manage Pallete in Node-RED.
Layer 3 requires the following libraries of the Flask web framework: flask, flask_sqlalchemy, flask_wtf, wtforms, WTForms-Alchemy, pymysql, flask_login, flask-bcrypt.
The deployment of the PV-OPTIM can be achieved on a Raspberry Pi device with a minimum of 1 Gb RAM, 1.2 GHz CPU, and Wi-Fi connectivity. Raspberry Pi devices are suitable for the deployment since they are powerful computers and are low-cost (35$) with low-energy consumption (only 15 W). Any computer can be used for the deployment, but the electricity consumption will be much higher than that of Raspberry Pi.

5. Results

To test the prototype and to extend the simulations detailed in the authors’ previous work, “Mind the Gap between PV Generation and Residential Load Curves” [23], PV-OPTIM has been deployed on real environments provided by two prosumers located in Romania in different locations in the South-Est of the country: P1 of 5.4 kW installed power with an on-grid inverter; P2 of 5.9 kW installed power with a battery system of 8.3 kW capacity connected to a hybrid inverter without grid injection. Both prosumers use the same hardware configuration (including TP-Link smart plugs for control) as described in Section 4.3. The prototype was tested for almost 18 months between 1st of July 2022 and 20th of December 2023 and the results were evaluated using the following metrics: RMSE, MAPE, R2, electricity cost, income, SSR, PV generation, and total load. The first three metrics are used to evaluate the forecast accuracy. To calculate the cost and income, the following rates are used: (i) a Time of Use (ToU) tariff: 0.6 EUR/kW during the night (11 PM–7 AM), 0.8 EUR/kW during the day (7 AM–5 PM) and 1 EUR/kW during the peak hours (5 PM–11 PM); (ii) a feed-in tariff with a constant rate of 0.5 EUR/kW.
To assess the results, two illustrative examples are provided for each prosumer to cover the seasonal influence of weather on PV generation. Thus, for P1 one summer day and one autumn day in 2022 are considered, while for P2 one summer day and one winter day in 2023 are considered.
Results obtained in the case of prosumer P1.
For exemplification, one typical day of summer (29 July 2022) and another typical day of autumn (09 November 2022) are depicted in this case. For the summer day, the PV forecast indicates a good yield with 70% power generation availability during the day, reaching its maximum of 3.8 kW at noon (as in Figure 7a). Since the weather predictions are extracted from the web APIs, their predicted values influence the PV forecast, as can be noticed from Figure 7b. In this case, the two weather APIs provide predictions (represented by PV Min and PV Max Forecast) with relatively small differences that are easily mediated by the PVFA algorithm. In Appendix A, in Figure A1, greater differences can be observed especially between the values of the cloud cover. These values are used to calculate the solar irradiance and then to forecast the PV output (Figure A2).
For the summer day, prosumer P1 plans to use the following appliances: water heater (WH) between 10:00 AM–7:00 PM, AC between 11:00 AM–4:00 PM, washing machine (WM) between 11:00 AM–2:30 PM, electric oven (EO) between 12:00–1:00 PM, and water pump (WP1) between 9:30–11:30 AM. Then the optimizer is run to obtain the optimal schedule (as in Figure 8).
The generation exceeds the load during the day (as in Figure 8) and prosumer P1 can sell the remaining quantities to the grid and obtains an income of 7.5 EUR. Since P1 does not have a battery system, during the night for the load consumption (lights, refrigerator, surveillance systems, TV, and other non-programable appliances), the electricity cost is 0.48 EUR. Considering the surplus of the generation during the summer day, the RTCA acts only as an automation system that starts and stops the programable appliances at the scheduled hours, without interrupting or rescheduling them.
In case of the autumn day, the PV generation availability decreases to 43% of the installed power, but still, on a sunny day, P1 plans to operate the following appliances: water heater between 10:00 AM–6:30 PM, washing machine between 10:00 AM–3:00 PM, and two heating devices: one between 11:00 AM–7:00 PM for 2 h and the other between 11:00 AM–7:00 PM for 90 min. The optimizer schedules the appliances during the hours with maximum PV availability (as in Figure 9).
In real-time, the RTCA implements the optimal schedule and follows the PV generation curve. For the control rules, if P1 sets the loadRate = 600 W then the RTCA does not interrupt the appliances after 3:30 PM, but the cost is 1.1 EUR. If the loadRate = 200 W, then the RTCA interrupts the heater and the cost decreases to 0.91 EUR. The income of the day is 1.95 EUR since only 3.89 kW is injected into the grid.
The results for the summer and autumn days and the aggregated values for the entire evaluation interval are centralized in Table 1 for prosumer P1.
Results obtained in the case of prosumer P2.
Similar scenarios are applied in the case of P2, but with more appliances. For the control rules, P2 sets the configuration parameters as follows: loadRate = 1000 W, SOCcharged = 85%, SOCdischarged = 85%, and PBATdischarge = 700 W. Two cases are analyzed for P2: a summer day and a winter day of 2023. In the summer day (Figure 10a), P2 schedules multiple appliances: water pumps, electric oven, AC in several cycles, and a water heater. Since the generation power exceeds 3 kW during 10:30 and 14:30, these appliances are operating without interruption. After 15:00, the generation curve has multiple spikes that causes the battery to supply the load. When SOC is below 85%, RTCA interrupts the appliances and allows the battery to charge with the available PV power. It charges up to 90% to cover the load during the night.
During a winter day (Figure 10b), P2 schedules the electric oven between 12:00–14:00 and two heating devices. Since it is a winter day and the PV system starts to generate later than in summer and the battery is discharged much more in the morning, the RTCA delays the operation of the appliances until the battery is 85% charged (after 11:15). It also interrupts the operation of the heating devices when loadRate is greater than 1000 W. It reschedules the heaters during 2:30 and 4:00 PM, but interrupts them without re-scheduling after 4:00 PM when the battery is less than 85% and the discharged power is greater than 700 W. Thus, at the end of the PV generation interval, the battery has a SOC of 90% that supplies the non-programable load during the night.
As can be noticed from Figure 10, in both cases the power imported from grid is 0 kW, so the RTCA maintains the battery charge to cover the load and to provide a SSR of 100% for the prosumer. By setting high values for SOCcharged and SOCdischarged, the number of discharging cycles is reduced, and the battery life is protected.
In the case of prosumer P2, the results regarding the forecast metrics (RMSE, R2, and MAPE) are similar to the results provided in Table 1. Analyzing the SSR for P2, on average, it is 99%. In only 15 days, in December 2022 and during the last week of November 2023, P2 switched to grid due to high degree of cloud cover, snow, or rain. For multiple consecutive months in the analyzed interval (July–November 2022 and January–October 2023), the SSR is 100% and the total electricity cost is zero although the electric cooling/heating devices, water pumps, and water heater were energized without scarcity to assure the prosumer’s comfort. Therefore, we can conclude that by integrating the PV forecast with load optimization and adaptive real time control PV-OPTIM supports prosumers to increase their independence from the main grid and to reduce the electricity costs.
The functionalities implemented in PV-OPTIM and its results indicate that the software can be considered an advanced HEM system. Currently, there are multiple open-source HEM systems implementations like Home Assistant (https://home-assistant.io/, accessed on 15 October 2023), BEMOSS (http://www.bemoss.org, accessed on 15 October 2023), Open Energy Monitor (https://openenergymonitor.org, accessed on 15 October 2023), and GroHome (https://www.ginverter.com/solutions/grohome-system, accessed on 15 October 2023). These offer numerous benefits due to their open-source nature, allowing widespread use at minimal cost. These solutions enable various providers to develop compatible interfaces and offer the flexibility for enhancements by developers and researchers. However, a potential downside is their complexity for non-technical users. BEMOSS, specifically, is a Python-based energy management platform designed for small and medium-sized commercial buildings, facilitating energy efficiency and optimal electricity usage. It integrates with cloud services for enhanced functionality. Home Assistant and Open Energy Monitor focus on home automation and energy consumption monitoring, respectively, without integrating the forecast component. GroHome offers an advanced system integrating solar, storage, and smart devices for efficient energy use, but without optimization or forecast. Overall, these systems are designed to monitor and control smart devices, offering user-friendly applications and automated features tailored to user preferences, including energy usage monitoring and recommendations. In comparison, the PV-OPTIM software offers several key benefits for users interested in solar energy management and optimization:
(i)
Ease of use: PV-OPTIM is designed to be user-friendly, allowing users to manage and monitor their PV systems without needing extensive technical knowledge. This accessibility makes it suitable for a wide range of users, from residential to commercial.
(ii)
Integration with IoT appliances and smart plugs: through Node-RED, the software is capable of seamlessly connecting with a variety of IoT devices and smart plugs. This integration means that PV-OPTIM can control and monitor energy consumption from multiple sources and devices, providing a comprehensive HEM solution.
(iii)
Integration of the models for PV power forecast, load optimization, and adaptive, automatic control of smart appliances in such a way as to closely follow the generation curve to increase the SSR and reduce the electricity costs.
(iv)
Protection of battery life: by intelligently managing charging and discharging cycles based on the control rules, PV-OPTIM ensures that batteries are not overused or underutilized, thus extending their usable life.

6. Conclusions

Bearing in mind that the practical integration of RES is essential for our sustainable development, this paper presents the architecture, functionalities, and deployment of the PV-OPTIM software—developed as an open-source modular application for prosumers. Therefore, in this paper, we described how to implement and replicate PV-OPTIM software that is based on methods and algorithms previously published by the authors in “Mind the Gap between PV Generation and Residential Load Curves”. The three-layer architecture of the PV-OPTIM allows users to customize the implementation and independently configure the components. Thus, they may choose to use only Layer 1 to obtain the PV forecast and optimally schedule their load for the next day. Moreover, after optimization, the surplus and deficit are provided, allowing users to eventually set up bids for LEM. Layers 2 and 3 provide more advanced monitoring and controlling functionalities, but they require more experience and skills regarding software configuration.
Furthermore, the PV-OPTIM layers can be easily integrated into more complex Energy Management Systems or Smart Home applications, representing an advanced management solution for prosumers with PV panels and storage systems. They can be extended to integrate with the LEM where prosumers and consumers could sell surplus or cover deficit at lower prices, mitigating energy poverty and extracting benefits from both RES and IoT assets.
Thus, the use of PV-OPTIM will contribute significantly to the reduction of prosumers’ expenses by maximizing consumption from their PV systems in order to increase the degree of independence and to support trading activities on the LEM.

Author Contributions

A.B.: Conceptualization, Methodology, Validation, Formal analysis, Investigation, Resources, Data Curation, Writing—Original Draft, Writing—Review and Editing, Visualization, Supervision. S.-V.O.: Conceptualization, Validation, Formal analysis, Investigation, Writing—Original Draft, Writing—Review and Editing, Visualization, Project administration. All authors have read and agreed to the published version of the manuscript.

Funding

This work was supported by a grant of the Romanian Ministry of Research and Innovation, CCCDI-UEFISCDI, project number 462PED/28.10.2020, project code PN-III-P2-2.1-PED-2019-1198, within PNCDI III.

Institutional Review Board Statement

Not applicable.

Informed Consent Statement

Not applicable.

Data Availability Statement

PV-OPTIM and datasets are available at: https://github.com/AdelaBara/PV-OPTIM (accessed on 1 November 2023).

Acknowledgments

This work was supported by a grant of the Ministry of Research, Innovation and Digitization, CNCS-UEFISCDI, project number PN-III-P4-PCE-2021-0334, within PNCDI III. This work was supported by a grant of the Romanian Ministry of Research and Innovation, CCCDI-UEFISCDI, project number 462PED/28.10.2020, project code PN-III-P2-2.1-PED-2019-1198, within PNCDI III.

Conflicts of Interest

The authors declare that they have no known competing financial interests or personal relationships that could have appeared to influence the work reported in this paper.

Appendix A

Figure A1. The differences between the weather predictions extracted from the two weather APIs.
Electronics 13 00161 g0a1
Figure A2. The differences between the forecasted values in case of the weather predictions depicted in Figure A1.
Electronics 13 00161 g0a2

References

  1. Kartal, G. The effects of positive and negative shocks in energy security on economic growth: Evidence from asymmetric causality analysis for turkey. Econ. Comput. Econ. Cybern. Stud. Res. 2022, 56, 223–239. [Google Scholar] [CrossRef]
  2. Trebbien, J.; Rydin Gorjão, L.; Praktiknjo, A.; Schäfer, B.; Witthaut, D. Understanding Electricity Prices beyond the Merit Order Principle Using Explainable AI. Energy AI 2023, 13, 100250. [Google Scholar] [CrossRef]
  3. Hernández, J.C.; Sanchez-Sutil, F.; Muñoz-Rodríguez, F.J.; Baier, C.R. Optimal Sizing and Management Strategy for PV Household-Prosumers with Self-Consumption/Sufficiency Enhancement and Provision of Frequency Containment Reserve. Appl. Energy 2020, 277, 115529. [Google Scholar] [CrossRef]
  4. El Hammoumi, A.; Chtita, S.; Motahhir, S.; El Ghzizal, A. Solar PV Energy: From Material to Use, and the Most Commonly Used Techniques to Maximize the Power Output of PV Systems: A Focus on Solar Trackers and Floating Solar Panels. Energy Rep. 2022, 8, 11992–12010. [Google Scholar] [CrossRef]
  5. Weniger, J.; Tjaden, T.; Quaschning, V. Sizing of Residential PV Battery Systems. Energy Procedia 2014, 46, 78–87. [Google Scholar] [CrossRef]
  6. Usmani, M.J.; Haque, A. Power Management of Solar PV Systems for PEER Load. IEEE Trans. Ind. Appl. 2021, 57, 6327–6338. [Google Scholar] [CrossRef]
  7. Cho, D.; Valenzuela, J. Optimization of Residential Off-Grid PV-Battery Systems. Sol. Energy 2020, 208, 766–777. [Google Scholar] [CrossRef]
  8. Liu, L. Big Data Analytics for PV Systems Real-Time Monitoring. Master’s Thesis, University of OSLO, Oslo, Norway, 2018. [Google Scholar]
  9. Al-Addous, M.; Dalala, Z.; Class, C.B.; Alawneh, F.; Al-Taani, H. Performance Analysis of Off-Grid PV Systems in the Jordan Valley. Renew. Energy 2017, 113, 930–941. [Google Scholar] [CrossRef]
  10. El-Baz, W.; Tzscheutschler, P.; Wagner, U. Day-Ahead Probabilistic PV Generation Forecast for Buildings Energy Management Systems. Sol. Energy 2018, 171, 478–490. [Google Scholar] [CrossRef]
  11. Rodríguez-Gallegos, C.D.; Vinayagam, L.; Gandhi, O.; Yagli, G.M.; Alvarez-Alvarado, M.S.; Srinivasan, D.; Reindl, T.; Panda, S.K. Novel Forecast-Based Dispatch Strategy Optimization for PV Hybrid Systems in Real Time. Energy 2021, 222, 119918. [Google Scholar] [CrossRef]
  12. Soudan, B.; Darya, A. Autonomous Smart Switching Control for Off-Grid Hybrid PV/Battery/Diesel Power System. Energy 2020, 211, 118567. [Google Scholar] [CrossRef]
  13. Lujano-Rojas, J.M.; Zubi, G.; Dufo-López, R.; Bernal-Agustín, J.L.; García-Paricio, E.; Catalão, J.P.S. Contract Design of Direct-Load Control Programs and Their Optimal Management by Genetic Algorithm. Energy 2019, 186, 115807. [Google Scholar] [CrossRef]
  14. Luo, F.; Zhao, J.; Dong, Z.Y.; Tong, X.; Chen, Y.; Yang, H.; Zhang, H. Optimal Dispatch of Air Conditioner Loads in Southern China Region by Direct Load Control. IEEE Trans. Smart Grid 2016, 7, 439–450. [Google Scholar] [CrossRef]
  15. Mortaji, H.; Hock, O.S.; Moghavvemi, M.; Almurib, H.A.F. Smart Grid Demand Response Management Using Internet of Things for Load Shedding and Smart-Direct Load Control. In Proceedings of the IEEE Industry Application Society, 52nd Annual Meeting: IAS 2016, Portland, OR, USA, 2–6 October 2016. [Google Scholar]
  16. Mortaji, H.; Ow, S.H.; Moghavvemi, M.; Almurib, H.A.F. Load Shedding and Smart-Direct Load Control Using Internet of Things in Smart Grid Demand Response Management. IEEE Trans. Ind. Appl. 2017, 53, 5155–5163. [Google Scholar] [CrossRef]
  17. Hsu, Y.Y.; Su, C.C. Dispatch of Direct Load Control Using Dynamic Programming. IEEE Trans. Power Syst. 1991, 6, 1056–1061. [Google Scholar] [CrossRef]
  18. Garrido-Zafra, J.; Moreno-Munoz, A.; Gil-De-Castro, A.; Palacios-Garcia, E.J.; Moreno-Moreno, C.D.; Morales-Leal, T. A Novel Direct Load Control Testbed for Smart Appliances. Energies 2019, 12, 3336. [Google Scholar] [CrossRef]
  19. Evora, J.; Hernandez, J.J.; Hernandez, M. A MOPSO Method for Direct Load Control in Smart Grid. Expert. Syst. Appl. 2015, 42, 7456–7465. [Google Scholar] [CrossRef]
  20. Lazaroiu, G.C.; Roscia, M. Fuzzy Logic Strategy for Priority Control of Electric Vehicle Charging. IEEE Trans. Intell. Transp. Syst. 2022, 23, 19236–19245. [Google Scholar] [CrossRef]
  21. Vargas, U.; Lazaroiu, G.C.; Ramirez, A. Stability Assessment of a Stand-Alone Wind-Photovoltaic-Battery System via Floquet Theory. Renew. Energy 2021, 171, 149–158. [Google Scholar] [CrossRef]
  22. Oprea, S.-V.; Bâra, A. An Edge-Fog-Cloud Computing Architecture for IoT and Smart Metering Data. Peer Peer Netw. Appl. 2023, 16, 818–845. [Google Scholar] [CrossRef]
  23. Oprea, S.V.; Bâra, A. Mind the Gap between PV Generation and Residential Load Curves: Maximizing the Roof-Top PV Usage for Prosumers with an IoT-Based Adaptive Optimization and Control Module. Expert. Syst. Appl. 2023, 212, 118828. [Google Scholar] [CrossRef]
  24. Badar, A.Q.H.; Anvari-Moghaddam, A. Smart Home Energy Management System—A Review. Adv. Build. Energy Res. 2022, 16, 118–143. [Google Scholar] [CrossRef]
  25. Leitao, J.; Gil, P.; Ribeiro, B.; Cardoso, A. A Survey on Home Energy Management. IEEE Access 2020, 8, 5699–5722. [Google Scholar] [CrossRef]
  26. Chekired, F.; Mahrane, A.; Samara, Z.; Chikh, M.; Guenounou, A.; Meflah, A. Fuzzy Logic Energy Management for a Photovoltaic Solar Home. Energy Procedia 2017, 134, 723–730. [Google Scholar] [CrossRef]
  27. Koltsaklis, N.; Panapakidis, I.; Christoforidis, G.; Knápek, J. Smart Home Energy Management Processes Support through Machine Learning Algorithms. Energy Rep. 2022, 8, 1–6. [Google Scholar] [CrossRef]
  28. Zafar, U.; Bayhan, S.; Sanfilippo, A. Home Energy Management System Concepts, Configurations, and Technologies for the Smart Grid. IEEE Access 2020, 8, 119271–119286. [Google Scholar] [CrossRef]
  29. Wang, X.; Mao, X.; Khodaei, H. A Multi-Objective Home Energy Management System Based on Internet of Things and Optimization Algorithms. J. Build. Eng. 2021, 33, 101603. [Google Scholar] [CrossRef]
  30. Aliero, M.S.; Qureshi, K.N.; Pasha, M.F.; Jeon, G. Smart Home Energy Management Systems in Internet of Things Networks for Green Cities Demands and Services. Environ. Technol. Innov. 2021, 22, 101443. [Google Scholar] [CrossRef]
  31. Liu, Y.; Zhang, D.; Gooi, H.B. Optimization Strategy Based on Deep Reinforcement Learning for Home Energy Management. CSEE J. Power Energy Syst. 2020, 6, 572–582. [Google Scholar] [CrossRef]
  32. Oprea, S.V.; Bâra, A.; Preda, Ş.; Tor, O.B. A Smart Adaptive Switching Module Architecture Using Fuzzy Logic for an Efficient Integration of Renewable Energy Sources. A Case Study of a RES System Located in Hulubeşti, Romania. Sustainability 2020, 12, 6084. [Google Scholar] [CrossRef]
  33. Hashemipour, N.; Crespo del Granado, P.; Aghaei, J. Dynamic Allocation of Peer-to-Peer Clusters in Virtual Local Electricity Markets: A Marketplace for EV Flexibility. Energy 2021, 236, 121428. [Google Scholar] [CrossRef]
  34. Lezama, F.; Soares, J.; Faia, R.; Vale, Z.; Kilkki, O.; Repo, S.; Segerstam, J. Bidding in Local Electricity Markets with Cascading Wholesale Market Integration. Int. J. Electr. Power Energy Syst. 2021, 131, 107045. [Google Scholar] [CrossRef]
  35. Oprea, S.V.; Bâra, A. Devising a Trading Mechanism with a Joint Price Adjustment for Local Electricity Markets Using Blockchain. Insights for Policy Makers. Energy Policy 2021, 152, 112237. [Google Scholar] [CrossRef]
  36. Nowak, M.; Mierzwiak, R.; Wojciechowski, H.; Delcea, C. Grey Portfolio Analysis Method. Grey Syst. 2020, 10, 439–454. [Google Scholar] [CrossRef]
  37. Kern, T.; Dossow, P.; Morlock, E. Revenue Opportunities by Integrating Combined Vehicle-to-Home and Vehicle-to-Grid Applications in Smart Homes. Appl. Energy 2022, 307, 118187. [Google Scholar] [CrossRef]
  38. Khatib, T.; Mohamed, A.; Sopian, K. Optimization of a PV/Wind Micro-Grid for Rural Housing Electrification Using a Hybrid Iterative/Genetic Algorithm: Case Study of Kuala Terengganu, Malaysia. Energy Build. 2012, 47, 321–331. [Google Scholar] [CrossRef]
  39. Assareh, E.; Jafarian, M.; Nedaei, M.; Firoozzadeh, M.; Lee, M. Performance Evaluation and Optimization of a Photovoltaic/Thermal (PV/T) System According to Climatic Conditions. Energies 2022, 15, 7489. [Google Scholar] [CrossRef]
  40. Shabbir, N.; Kutt, L.; Astapov, V.; Jawad, M.; Allik, A.; Husev, O. Battery Size Optimization with Customer PV Installations and Domestic Load Profile. IEEE Access 2022, 10, 13012–13025. [Google Scholar] [CrossRef]
  41. Thebault, M.; Gaillard, L. Optimization of the Integration of Photovoltaic Systems on Buildings for Self-Consumption—Case Study in France. City Environ. Interact. 2021, 10, 100057. [Google Scholar] [CrossRef]
  42. Liu, C.; Xu, W.; Li, A.; Sun, D.; Huo, H. Analysis and Optimization of Load Matching in Photovoltaic Systems for Zero Energy Buildings in Different Climate Zones of China. J. Clean. Prod. 2019, 238, 117914. [Google Scholar] [CrossRef]
Figure 1. Overview of the AOC module implemented in the PV-OPTIM software.
Electronics 13 00161 g001
Figure 2. Proposed architecture of the PV-OPTIM layers.
Electronics 13 00161 g002
Figure 3. Layer 3 components.
Electronics 13 00161 g003
Figure 4. PV-OPTIM Dashboard: the configuration page for the characteristics of the appliances.
Electronics 13 00161 g004
Figure 5. PV-OPTIM Dashboard: scheduling and optimization.
Electronics 13 00161 g005
Figure 6. PV-OPTIM Dashboard: monitor the load, PV and battery.
Electronics 13 00161 g006
Figure 7. PV forecast for P1 on the summer day: (a) comparison between the PV forecast and the PV generation; (b) influences of the weather predictions on the PV forecast.
Electronics 13 00161 g007aElectronics 13 00161 g007b
Figure 8. Optimal schedule of the appliances on the summer day for P1.
Electronics 13 00161 g008
Figure 9. Optimal schedule of the appliances on the autumn day for P1.
Electronics 13 00161 g009
Figure 10. Real-time monitoring and control during two days for P1: (a) summer day 2023; (b) winter day 2023.
Electronics 13 00161 g010
Table 1. Evaluation metrics for P1.
Evaluation MetricsDay 1 (29.07.2022)Day 2 (06.11.2022)01.07.2022–31.12.2022
RMSE0.260.340.31
MAPE0.150.210.18
R20.960.920.94
Electricity Cost (EUR)0.480.91Daily average: 0.79 Total: 118
Income (EUR)7.51.91Daily average: 4.8 Total: 866
Self-sustainable ratio (%)98%94%87%
PV generation (kW)23.213.6Daily average: 13.8 Total: 2372
Load (kW)8.810.4Daily average: 9.2 Total: 1639
Disclaimer/Publisher’s Note: The statements, opinions and data contained in all publications are solely those of the individual author(s) and contributor(s) and not of MDPI and/or the editor(s). MDPI and/or the editor(s) disclaim responsibility for any injury to people or property resulting from any ideas, methods, instructions or products referred to in the content.

