Article

Robotic Cell Reliability Optimization Based on Digital Twin and Predictive Maintenance

Laboratory for Manufacturing Systems and Automation, Department of Mechanical Engineering and Aeronautics, University of Patras, 26504 Rio Patras, Greece
*
Author to whom correspondence should be addressed.
Electronics 2023, 12(9), 1999; https://doi.org/10.3390/electronics12091999
Submission received: 6 March 2023 / Revised: 22 April 2023 / Accepted: 24 April 2023 / Published: 25 April 2023

Abstract

:
Robotic systems have become a standard tool in modern manufacturing due to their unique characteristics, such as repeatability, precision, and speed, among others. One of the main challenges of robotic manipulators is the low degree of reliability. Low reliability increases the probability of disruption in manufacturing processes, minimizing in this way the productivity and by extension the profit of the company. To address the abovementioned challenges, this research work proposes a robotic cell reliability optimization method based on digital twin and predictive maintenance. Concretely, the simulation of the robot is provided, and emphasis is given to the reliability optimization of the robotic cell’s critical component. A supervised machine learning model is trained, aiming to detect and classify the faulty behavior of the critical component. Furthermore, a framework is proposed for the remaining useful life prediction with the aim to improve the reliability of the robotic cell. Thus, following the results of the current research work, appropriate maintenance tasks can be applied, preventing the robotic cell from serious failures and ensuring high reliability.

1. Introduction

With the advent of the Industry 4.0 revolution, conventional manufacturing systems have transformed into smart factories. Companies are attempting to integrate Industry 4.0 technologies into their production lines to remain competitive in demanding market needs [1,2]. Robotic systems are essential parts of smart factories since they can perform a wide range of different tasks in volatile environments [3]. Robotic systems are capable of executing multiple tasks, relieving humans from repetitive, tiring, boring, and dangerous work. In the manufacturing domain, robots are used for pick and place applications, materials handling, drilling, palletizing, welding, painting, assembly processes, and more [4]. Since robotic systems are integral parts of industries, high reliability is a prerequisite. However, robot reliability remains a popular topic in the industry since robotic systems are complex and consist of several components. Nowadays, the need for reliable and safe robots is more important than ever since the current generation of robots is collaborative and coexists with humans. For industries equipped with robots, safety is also a critical issue since several accidents have been reported at workstations with robots, and some of them were deadly. However, it should be pointed out that the major cause of these accidents was human error rather than robot malfunction [5]. Additionally, the author in [5] points out that the topic of robot reliability is strongly related to the reliability of its components. Robots suffer from low reliability because their equipment, such as motors, sensors, wiring, and end-effectors, is prone to wear and tear. The configuration of the robots and the type of connection between the components that constitute a robotic system have a huge impact on its reliability. According to studies, DELTA and SCARA robots are more reliable compared to other articulated robots since they consist of fewer links and joints that are connected serially. In reliability modeling, for systems that consist of components that are serially connected, the failure of a component will cause the failure of the whole system. On the other hand, parallel connections demonstrate redundancy, and the failure of one component will not cause the failure of the whole system. The same research work declares that the lifespan of a typical industrial robot is about 10–15 years due to the deterioration of its main mechanical components. As a result, it becomes apparent that by analyzing, assessing, and seeking ways to optimize the reliability of the robotic components, the reliability of the whole robotic system can be improved.
In scientific research, there are plenty of works around the reliability assessment of robots. In addition, different reliability modeling methods for robots are presented in [6]. Detailed fault tree analysis (FTA) and reliability block diagram (RBD) models of a robotic system are provided to analyze and assess the robot’s reliability. The authors highlight the capabilities of FTA in finding the root causes of failures and the logical failure path that will lead to the system’s failure. The most common traditional reliability assessment techniques are discussed along with their key differences, and a network reduction method of a spot-welding robotic cell’s RBD is provided. RBD has widely been used in the literature to analyze and assess the reliability of systems [7].
Engineers are always concerned about the reliability of their machines and are constantly seeking ways to optimize them. This concern has become more significant in recent years due to the high complexity of modern manufacturing systems, which results in an increase in failure modes. Reliability is considered a significant performance indicator of manufacturing systems [
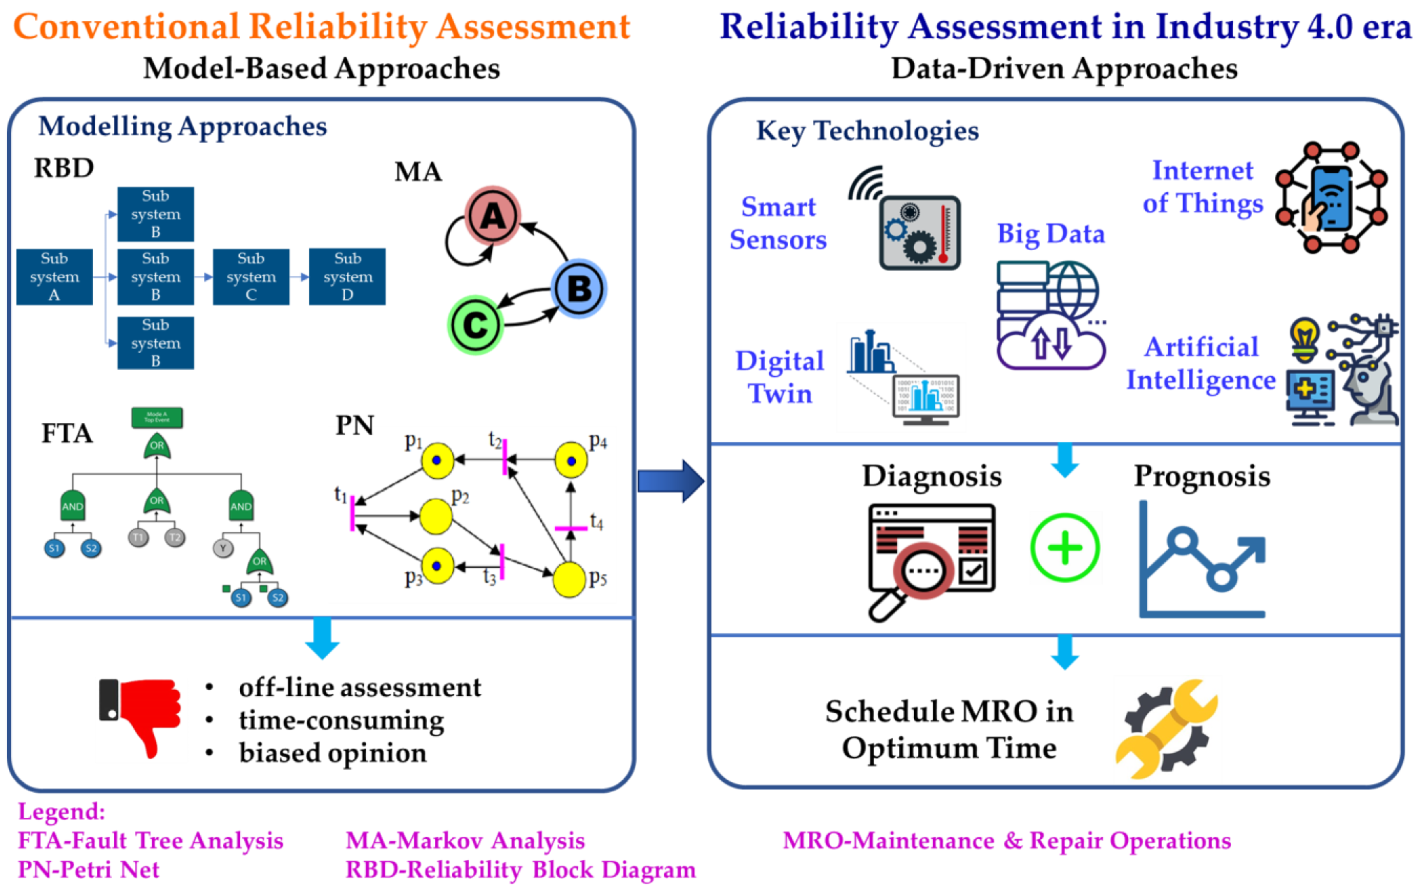
8]. The emergence of cutting-edge technologies such as the industrial internet of things (IIoT), smart sensors, big data, digital twin (DT), cyber-physical systems (CPS), cloud computing (CC), artificial intelligence (AI), and so on, has changed the way reliability is assessed. With the DT concept, a twin of the physical system can be constructed, and its condition can be monitored and assessed. DT is considered an optimization tool for the reliability of manufacturing systems. The reliability modeling approaches that have been widely used so far are considered obsolete and ineffective for capturing and analyzing the complexity of today’s manufacturing systems. Traditional reliability assessment methods are based on probabilistic theory and expert opinions, which make the reliability assessment less accurate. For complex systems like robotic systems, which consist of several interdependent components with different failure modes, it is challenging to comprehend and extract reliable mathematical models. Additionally, these methods are conducted offline, which does not give the ability to assess the reliability of robots in real time. For this reason, engineers are moving toward data-driven approaches and artificial intelligence (AI) techniques for reliability assessment, leveraging the huge amount of condition monitoring data produced every day [9].
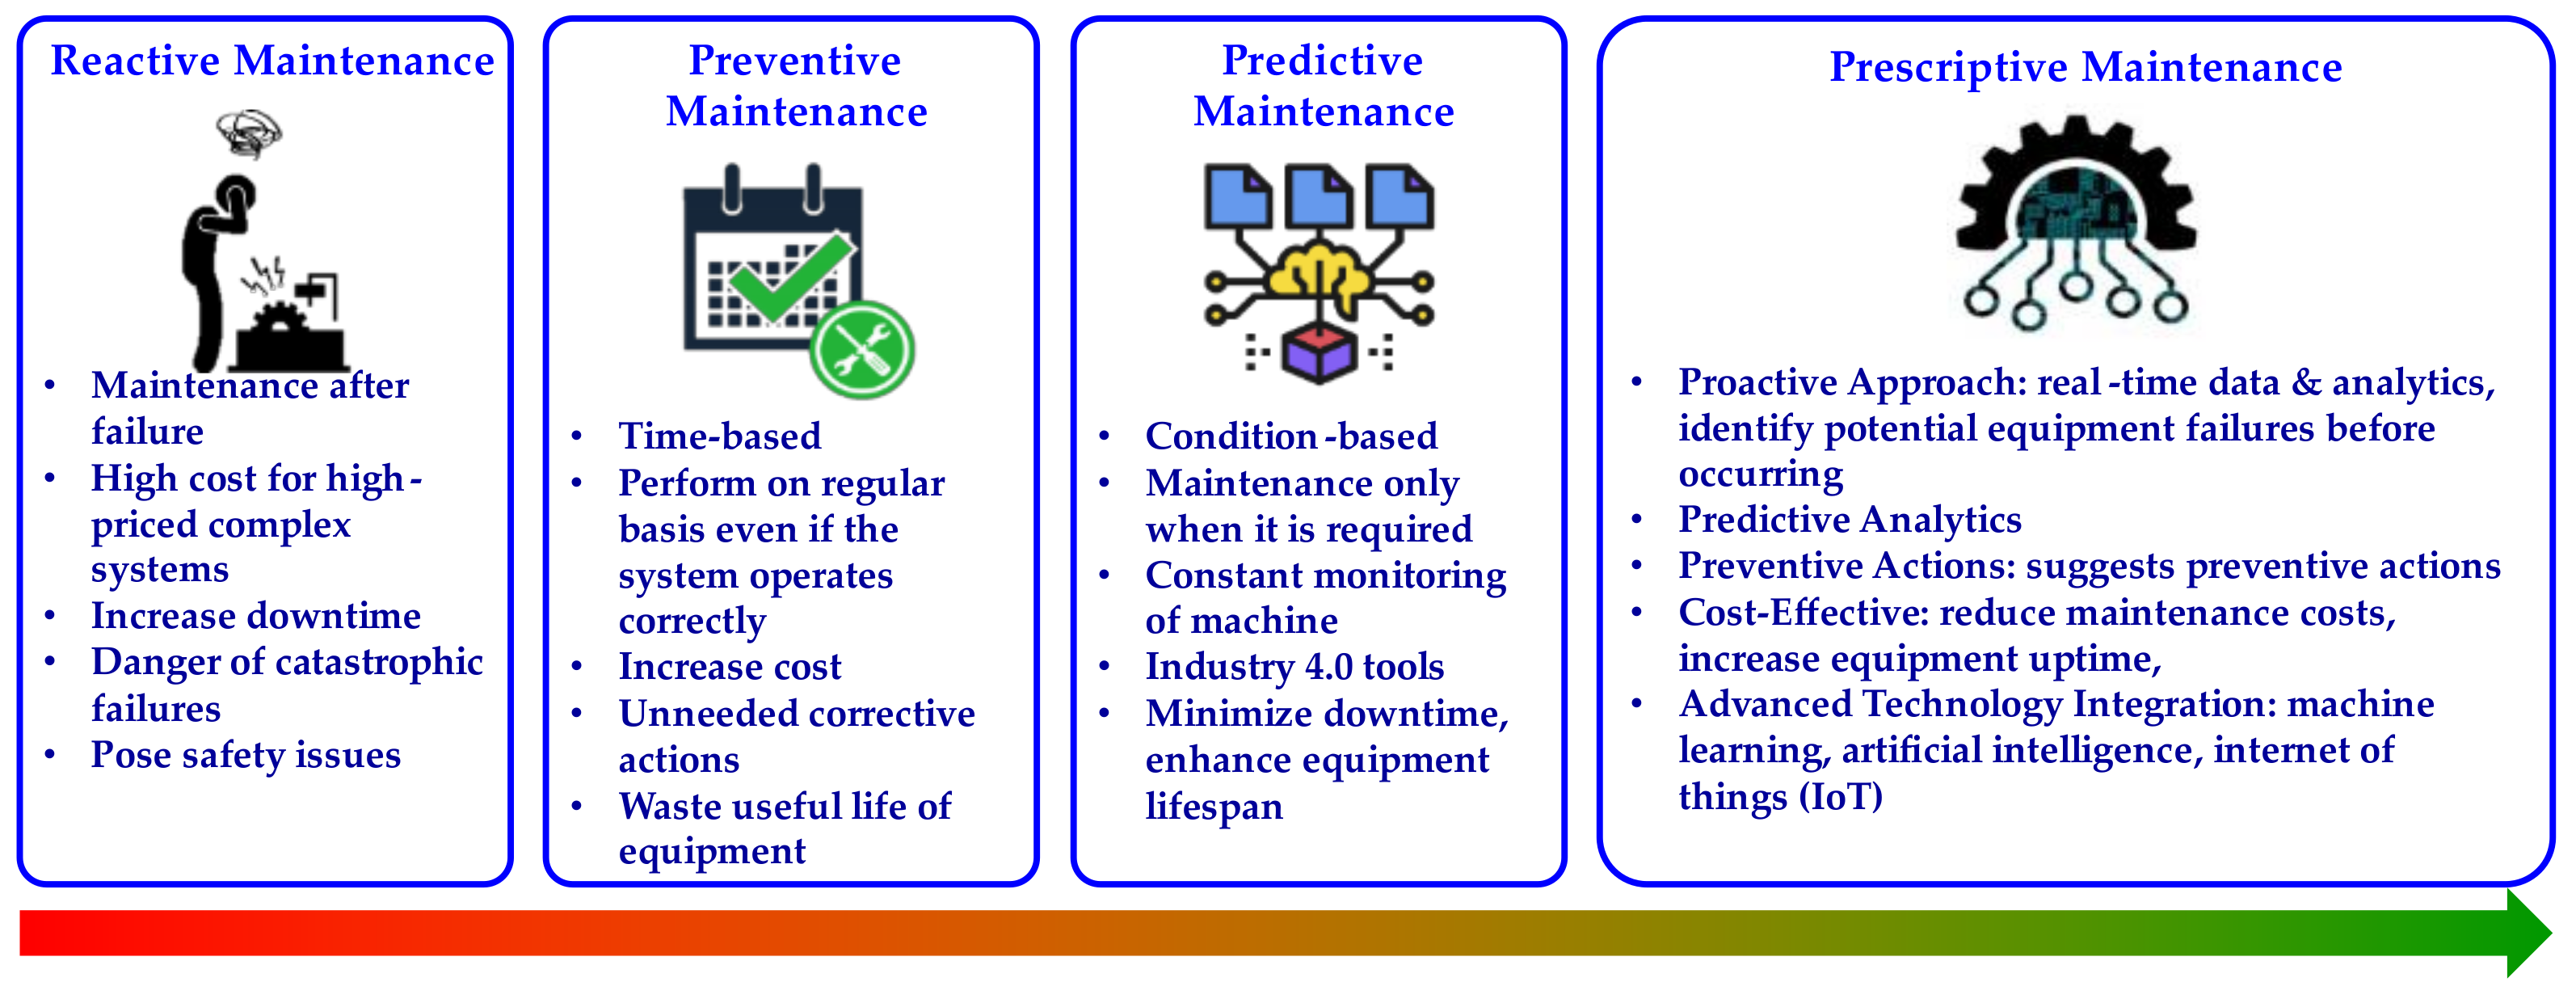
The term “reliability” is highly associated with “maintainability”. Proper maintenance will result in higher machine reliability. In an effort to become smarter, engineers are now shifting their focus from failure prevention to failure prediction [
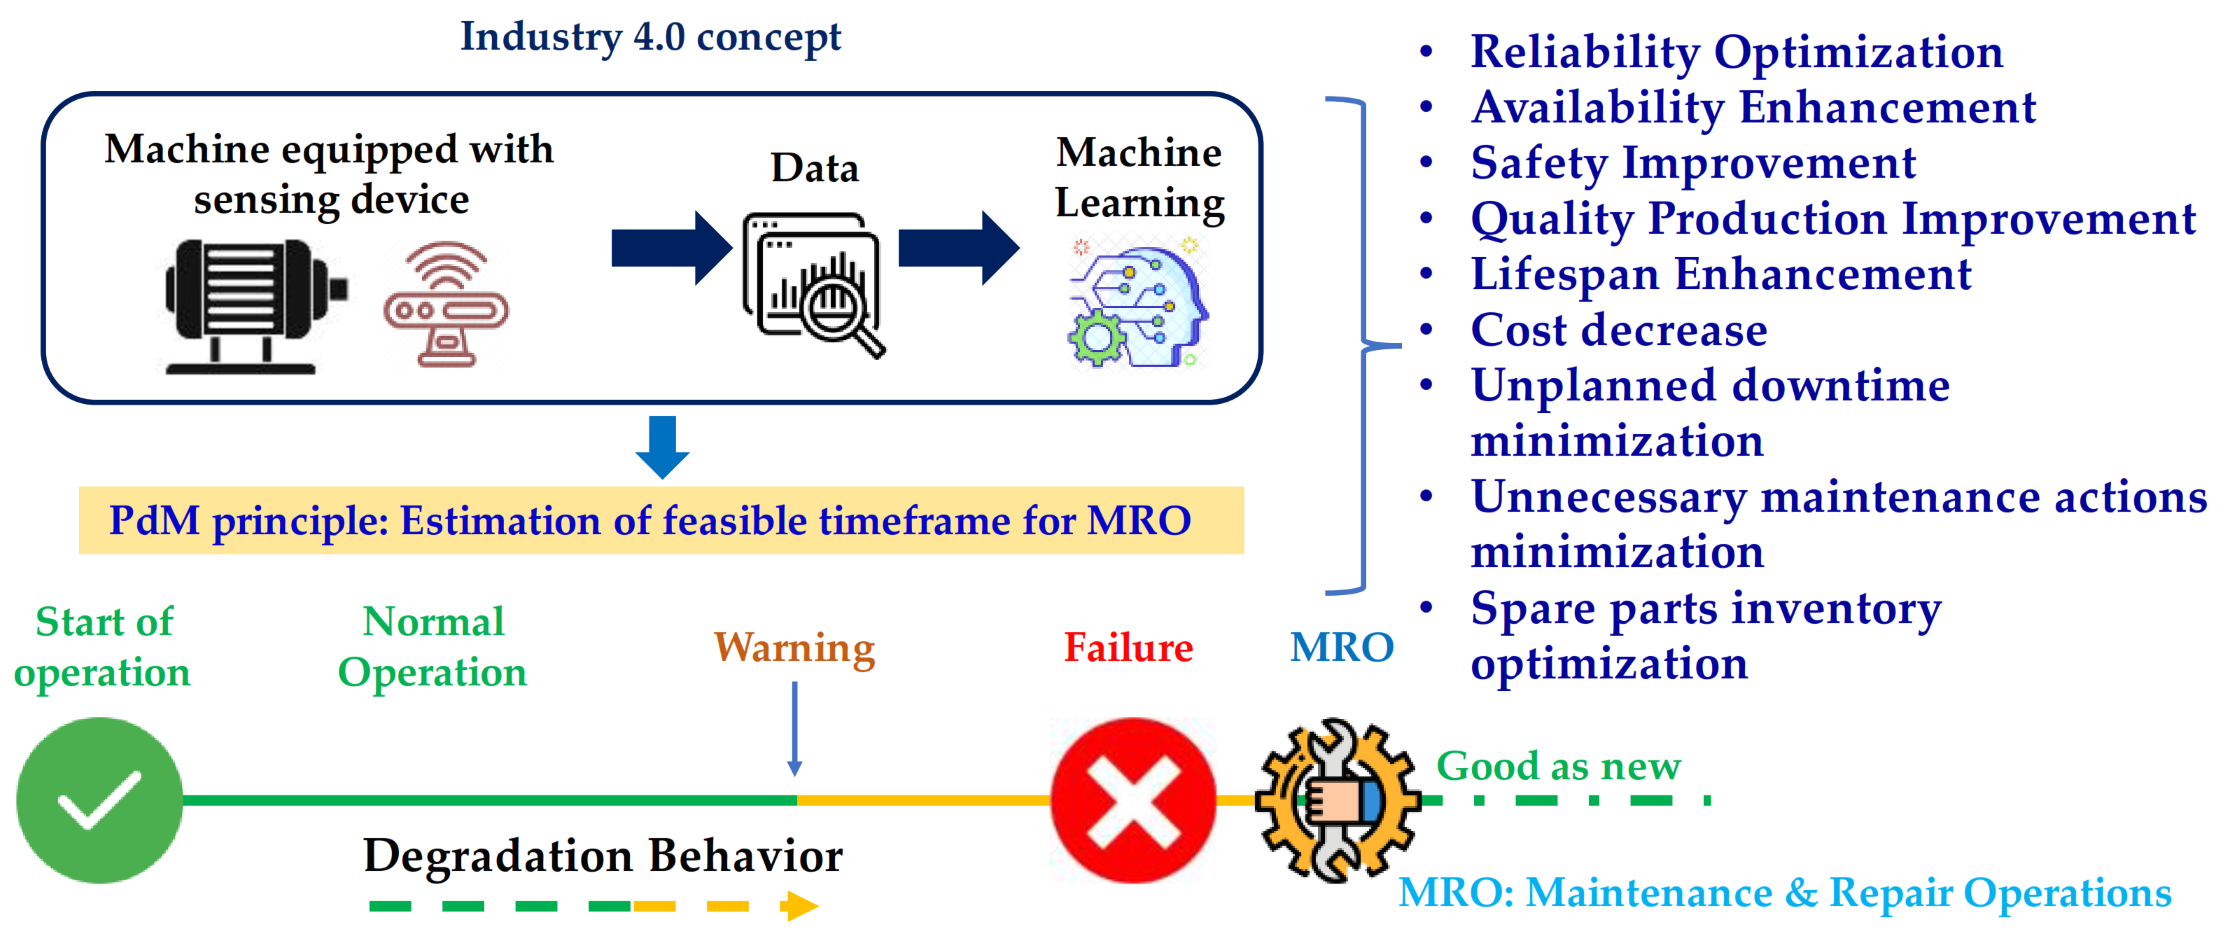
10]. PdM is a promising approach that leverages Industry 4.0 tools and technologies with the aim of predicting failures before they occur [11]. The PdM domain is gaining a lot of attention from industries since, according to Reference [12], applying PdM can increase production by 25–35%, reduce maintenance costs by 25–35%, eliminate breakdowns by 70–75%, and reduce breakdown time by 35–45%. Similarly, the author in [5] suggests periodic maintenance to prevent robotic failures and achieve higher reliability of robotic systems. In Reference [13], the authors highlight the importance of PdM since it offers the longest life and highest reliability of equipment. Next, the authors in [14] suggest a data-driven PdM approach for reliability assessment and improvement due to simplifications and assumptions taken into account during the modeling of the robotic cell, such as the selection of the exponential distribution as the reliability function and the constant failure rate.

1.1. Aim of Research Work

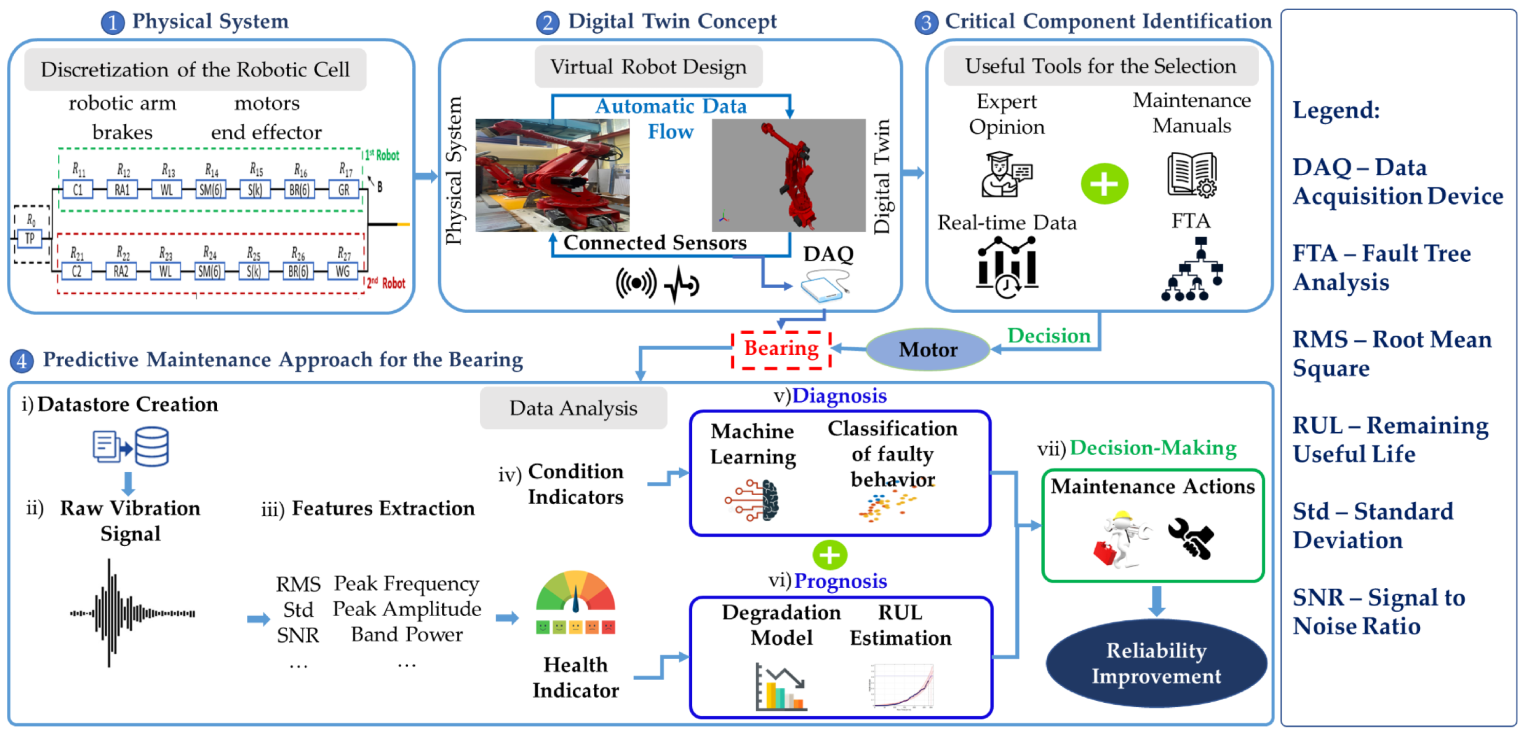
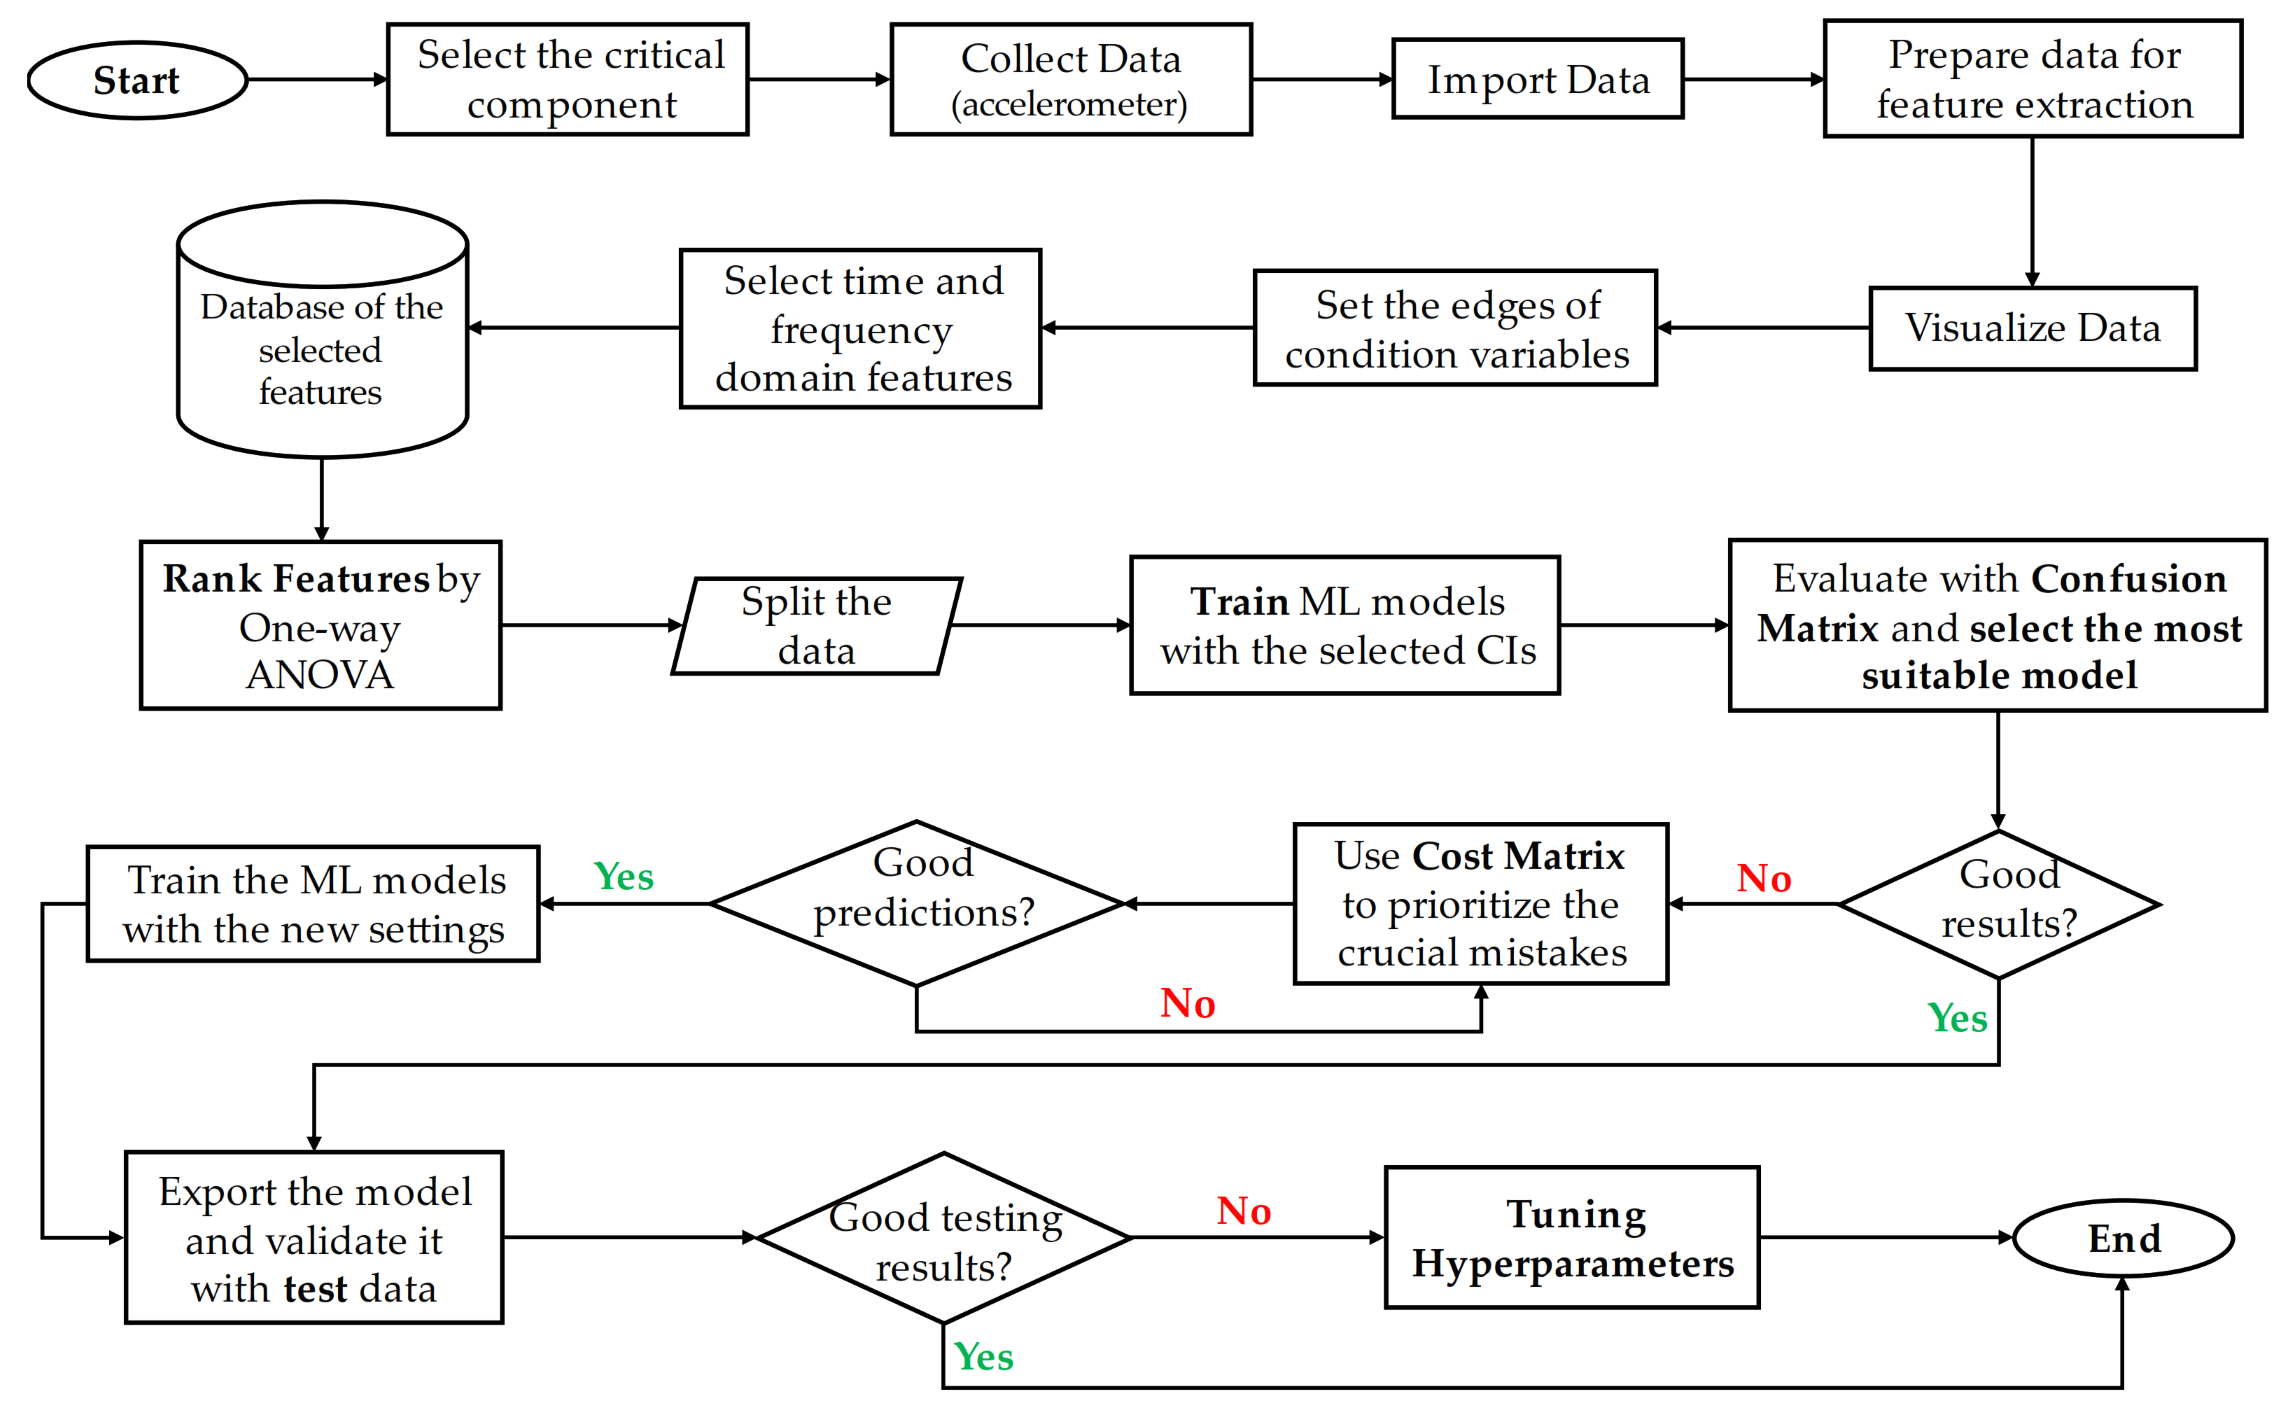
The aim of this research work is to improve the reliability of a robot by improving firstly the reliability of its critical component. The bearings of stepper motors are selected as the critical components. This paper presents the predictive maintenance approach that is based on a supervised machine learning algorithm with the aim to detect and classify the faulty behavior of the bearing. The steps that are conducted during a predictive maintenance approach are specific and should be executed with the right sequence. However, most of the steps are executed considering the kind of data in which we are interested. In order to conduct a reliable predictive maintenance approach, the data should be prepared and preprocessed suitably in order to be able to extract features from them. This preparation of data is different every time and depends on the kind of data. After, the feature selection should be performed, which is a challenging issue. It is difficult to know which features are capable of adequately differentiating the data. Time-domain or/and frequency domain features can be used. The feature that will be used is not the same every time, and it depends on the system that is under study and the type of data that has been collected from it. For instance, according to the literature, the selection of the proper ML model is a difficult process. By the time current robotic systems are complex and composed of multiple components with different failure rates, one way to improve the reliability of the whole system is to first improve the reliability of its critical components. This can be accomplished by studying the reliability parameters of the critical components. Specifically, reliability can be optimized by increasing the mean time between failures (MTBF) and/or decreasing the mean time to repair (MTTR) of the critical component. Therefore, it becomes apparent that detecting faulty behavior and predicting the time to failure of the critical component is crucial.

1.2. Contribution of Research Work

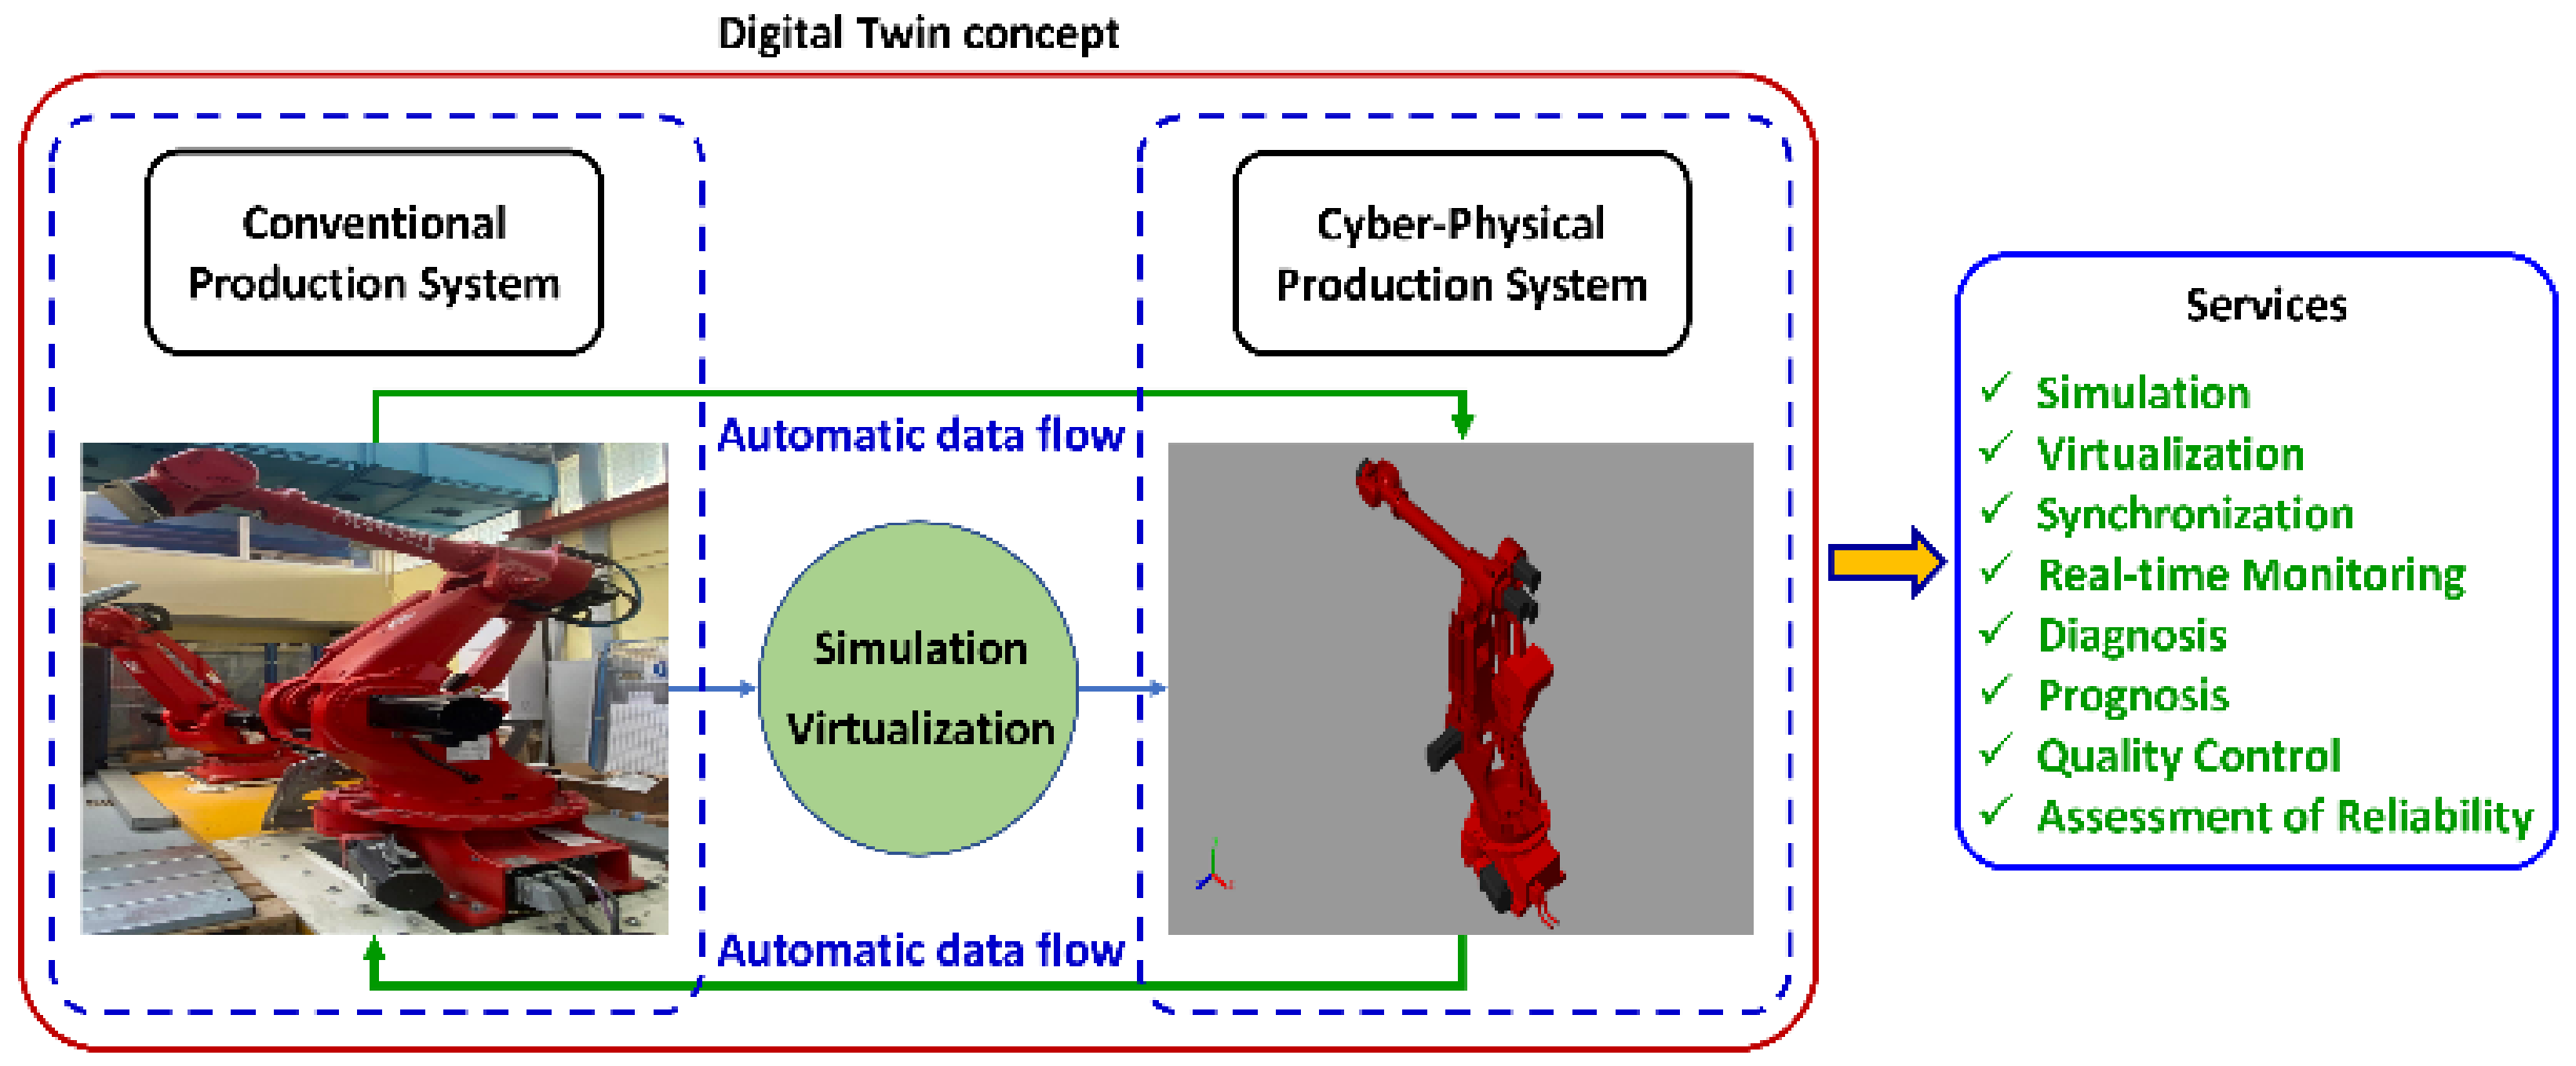
The contribution of this research is to present a novel approach based on Industry 4.0 technologies in order to optimize the reliability of industrial robotic manipulators, based on the combination of digital twin (DT), and predictive maintenance (PdM) is presented. Concretely, the DT is proposed as a method to optimize the reliability of a robotic cell by the real-time monitoring of the robot due to embedded sensors and IoT. The starter steps for constructing a DT of the robot are provided. The digital model of the robot is modeled and simulated in MATLAB. This research is based on the principle that the reliability of the robot is based on the reliability of its components. Thus, a PdM approach is presented to detect and classify the faulty behavior of the critical component, and a framework for estimating its remaining useful life (RUL) is presented. With PdM, the right time to conduct maintenance can be determined, saving the company unnecessary maintenance costs. The digital twin (DT) of the robotic cell will be used for monitoring the status of the cell and its components. When coupled with the developed machine learning algorithms, more accurate predictions of the remaining useful life (RUL) of the robots’ components are feasible. Concretely, the implementation of the digital twin creates added value for the existing robotic cell in several ways, as explained in the following paragraphs. The digital twin of the robotic cell is accessible remotely, thus enabling engineers to monitor and make any adjustments to the robotic arms’ operation remotely. Specifically, the robotic arms, which have been modeled in the case study presented in this manuscript, are installed in a caged robotic cell, which handles heavy and bulky automotive components. Consequently, remote monitoring and control are safer for human operators/engineers. By monitoring the digital twin, it is possible to detect when the robotic arm requires maintenance before it breaks down. This can help to reduce repair costs and minimize unnecessary downtime.
Beyond the key contributions of the digital twin presented in the previous paragraph, additional functionalities are foreseen, such as virtual testing, for simulating and testing changes in the operation of the robotic cell. This can facilitate the identification of potential malfunctions and by extension optimize the cell’s performance before making any alterations to the physical installation. In the context of virtual experimentation, the proposed digital twin framework can be utilized for training purposes. Concretely, new human operators and engineers can be trained in a plethora of scenarios, which by extension helps in reducing the risk of accidents. In Figure 1, the primary services of the DT are depicted.
The remainder of the paper is organized as follows. In Section 2, the state of the art is presented. In Section 3, the system architecture and the predictive maintenance flowchart are provided, and in Section 4, the case study is presented. In Section 5, the implementation is made, and in Section 6, the results are discussed. Finally, in Section 7, the research work is concluded, and future work is pinpointed.

2. State of the Art

2.1. Robotic Systems

Today’s industries are highly automated and equipped with robots. Industries are widely integrating robotic systems into their production lines with the aim to leverage the benefits of robots and increase their productivity. Industrial revolutions have affected the robotic domain [1]. Indeed, since the first utilization of the industrial robot in the 1960s, considerable advancements in the robotic industry have been made [15]. In the Robotics 1.0 era, which took place between the 1960s and 1980s, the primary role of robots was to relieve humans from monotonous, repetitive, and dangerous tasks. In this era, robots were dangerous, and since they did not have any sense of their environment, they were bounded by fences. During the second generation of robots (Robotics 2.0 era), which occurred between the 1990s and 2000s, collaborative and sensitive robots were introduced, but they were slow when interacting with humans. In 2008, Universal Robotics released the first collaborative (combot) robot in the market. Due to advancements in sensing devices, robots were equipped with sensors where feedback was provided. Currently, we are experiencing the Industry 4.0 and Robotics 3.0 era. This is called the Digital Robotic era, where the robotic industry is leveraging Industry 4.0 technologies such as internet of things (IoT), digital twin (DT), and cyber-physical systems (CPS), to name a few. Furthermore, predictive maintenance on flexible mobile robots [16] or robots with flexible elements [17] involves using data analysis and machine learning algorithms to anticipate potential issues and failures in robots before they occur. This approach can help increase the lifespan of the robot, minimize downtime, and reduce maintenance costs [18]. Path planning and obstacle avoidance are major concerns for mobile robots. In this era, robotic systems are connected to the Internet and can exchange a huge amount of data in real time, ensuring machine-to-machine (M2M) communication. The integration of artificial intelligence (AI) into robots has made them smarter machines. The Robotics 4.0 era is expected to begin in the 2020s and will be characterized by more cognitive, perceptive, and intelligent robots. The human–machine interaction will be more friendly and natural, integrating the artificial intelligence of things (AIoT) [19,20]. Cutting-edge technologies such as 5G, deep learning, reinforcement learning, cloud computing, and big data will give rise to smart robotic systems being capable of adapting to complex unstructured environments and performing intricate manufacturing processes [21]. In Figure 2, the four robotic revolutions are illustrated.

2.2. Reliability in Manufacturing Systems

The aim of each industry is to ensure that its equipment will perform its intended tasks in a predefined time and under certain conditions. From an engineering perspective, reliability is defined as the ability of a system or a component to serve its required functions in a determined period and under certain conditions. Considering the constant failure rate (λ), the reliability of a component is calculated by the following equation:
R t = e λ t
The exponential distribution function is used commonly in reliability formulas due to its efficiency in dealing with constant failure rates. The assumption of the constant failure rate is widely applied in reliability modeling approaches due to the fact that most of the components exhibit a constant failure rate during their useful time [22]. Reliability analysis is an important process in order to ensure that the performance of the equipment is effective when construed in meeting deadlines, satisfying customers, and maintaining the good reputation of the company [6]. The reliability of a system depends on its structure, the flow of materials into it, and the reliability of the machines and components that constitute the system [23], and it can be determined by analyzing and studying its failures [24]. Reliability is closely related to the terms of availability, maintainability, and safety. By improving a system’s reliability and maintainability, its availability can be increased [24]. Maintainability is a system’s crucial characteristic that indicates how easy and costly it is for a system or a component to be restored to a condition in which it can perform its required functions when maintenance is performed [25]. Today’s manufacturing systems should be highly safe since there is a lot of cooperation with humans [26]. However, increased safety in a system can sometimes cause a decline in its reliability.
In practice, the reliability assessment is made by studying the reliability parameters, namely mean time to failure (MTTF), mean time between failures (MTBF), and mean time to repair (MTTR). Reliability assessment is carried out throughout the lifecycle of a component or a system. The traditional reliability assessment includes the reliability modeling of the system, reliability data collection (λ, MTTF, MTBF, MTTR), component reliability assessment, and at the last stage system reliability assessment. The aim of reliability modeling is to extract mathematical models that represent the failure logic relationships between the different system components. From the reliability engineering viewpoint, a complex system is one that consists of many interdependent components with various failure modes, and it is challenging to decompose this into series or/and parallel connections or to recognize the type of connections. The most common reliability modeling approaches are RBD, FTA, failure mode and effect analysis (FMEA), Petri nets (PNs), and Markov analysis (MA). Each reliability modeling approach examines from a different perspective the reliability of the system that is under study [6]. For instance, RBD is a more representative approach that analyzes the structure of the system and the relationships between its components (series/parallel), while the aim of FTA is to find the root causes of failures and the failure logical paths [22]. The FTA method has been extensively used in industries such as the automotive and aircraft domains [27].
The reliability of complex systems has been thoroughly investigated in recent decades. In our research work, we presented and explicitly discussed the conventional methods. More specifically, traditional reliability modeling approaches such as reliability block diagram (RBD), fault tree analysis (FTA), Petri nets (PNs), and Markov analysis (MA) have been used extensively in the past to study and model the reliability of manufacturing systems. However, these methods present some limitations, which constitute them ineffective for today’s complex systems. Firstly, these methods are conducted offline, thus near-real-time health assessment is not feasible. Moreover, these methods are based on modeling the structure of the system seeking the type of connection between the numerous components, which is a challenging process for today’s complex systems. On the contrary, modern approaches are mostly based on the acquisition and analysis of data from discrete components (e.g., motors, bearings, etc.), which is an easy and financially viable way of monitoring the health of complex systems. However, such approaches appear to have limited performance in practical complex situations due to various working conditions of the system (i.e., the working environment) and low fault signature signal to noise ratio.
Above all, in this research work, a novel method for the assessment and optimization of robotic manipulators based on the DT and PdM is presented. Concretely, the technology of DT is proposed for the simulation and near-real-time data exchange, which ensures the near-real-time monitoring of the robot along with PdM approaches, aiming at the detection and classification of critical component malfunctions. By using a combinatory method of the DT and PdM approaches, a good estimation of the appropriate time to conduct maintenance can be calculated. By extension, the reliability and performance of the robotic cell can be improved.
Since the maintenance of manufacturing systems has a huge impact on their reliability, the reliability can be assessed by constructing a DT of the investigated system, leveraging the huge amount of operating data that is captured due to sensors. In this way, the faulty behavior of the system can be diagnosed, and the time of failure can be estimated. In Figure 3, the evolution of reliability assessment is presented. Through the synchronization made possible by sensors, data can be updated from the physical system in real time, enhancing in this way the decision making for the maintenance procedures.
Hardware, software reliability, and the impact of human interaction on reliability constitute factors that all should be considered for the assessment of the overall reliability of manufacturing systems. These factors should first be examined separately and after being combined in order to extract a single overall indicator for the reliability of manufacturing systems. The reliability of the hardware components is time-dependent; the failures occur during the operation phase, and the last phase in the bathtub curve is the wear out. RBD, FTA, and MA are some examples of hardware reliability modeling approaches. On the other hand, software reliability is time-independent; most errors occur during the design phase, and the last phase in the bathtub curve is obsolescence where there are no more upgrades that can be performed. Finally, an important factor that should be considered for the reliability of production and manufacturing systems is human interaction. Manual systems are highly affected by human operators’ actions. On the contrary, automated systems are less susceptible. Since today’s systems are designed in such a way to cooperate and interact with humans, human reliability should be studied. Despite that there is a lot of research regarding hardware and software reliability when it comes to the impact of the human factor in the reliability of manufacturing systems, there is a lack of publications. Primarily, it happens because it is difficult to model and predict human behavior. Humans may be stressed, get tired, make false estimations, and as a result may cause a decline in the reliability of manufacturing systems [8,9,27]. The topic of the impact of humans on the reliability of manufacturing systems should be studied extensively, especially for Industry 5.0 systems, where the core of this era will be the symbiosis and coexistence of humans and machines. In Figure 4, the factors that affect the reliability of manufacturing systems are illustrated.
In this research, we are focused on hardware reliability and particularly on the assessment and improvement of a robotic cell’s reliability. In complex systems, such as robotic cells, the different components that make up the system present different failure rates (λ). All these components should operate correctly in order to achieve high performance of the robotic cell. The failure of a single component may lead to the failure of the whole system. As a result, the failure probability of each component should be studied in order to assess the overall failure probability of the whole system [6]. To gain more knowledge about the failure probability of the main mechanical components of a robotic cell, a literature review was conducted, and their failure rates are presented in Table 1.

2.3. Digital Twin

The industrial sector has been affected by digitalization. Today’s systems are composed of interconnected intelligent components. Digital twin (DT) is one of the main technologies of the fourth Industrial Revolution [34]. The first definition of DT was provided by Michael Grieves in 2002 during a presentation about product lifecycle management (PLM) [35]. The first deployment of DT was in the aerospace industry. Later in 2011, DT was first defined in relation to Industry 4.0, and in 2013, the first studies of DT in the manufacturing domain emerged [36]. In Reference [35], an analytical definition of the DT in the manufacturing domain is provided. More specifically, it is mentioned that: “The DT consists of a virtual representation of a production system that is able to run on different simulation disciplines that are characterized by the synchronization between the virtual and real system, thanks to sensed data and connected smart devices, mathematical models, and real-time data elaboration. The topical role within Industry 4.0 manufacturing systems is to exploit these features to forecast and optimize the behavior of the production system at each life cycle phase in real time.” Thus, it becomes apparent that we are experiencing an era where everything can be digitalized. DT is a virtual or digital representation of physical entities. Physical entities can range from sensors to machines, people, processes, and even whole factories [37]. So, the technology of DTs is not limited to focusing on just one entity but can also be applied to entire systems, creating the idea of digitalized factories [38].
In Reference [35], the key areas of the DT applications in the manufacturing domain are presented, which are the following: (i) Production Planning and Control, (ii) Maintenance, and (iii) Layout Planning. DT can contribute to the maintenance domain. More specifically, the term DT is highly associated with the term predictive maintenance (PdM). By constructing a DT of the physical system, its health status can be monitored, and the best time to arrange maintenance can be found. A topic that is under discussion is the connection between the DT and simulation [39]. Although traditional simulations, such as CAD, are helpful for product design, they are static. Practically, it means that the traditional simulation cannot be simulated for what is currently happening in the under-study system. This challenge can be overcome with the DT. DT is regarded as the most advanced simulation method for modeling, optimization, and simulation. The simulation domain has evolved by leveraging digital technologies. Indeed, with the integration of the industrial internet of things (IIoT), the simulation techniques became more dynamic and more accurate. The key difference is in the real-time data that are captured by embedded smart sensors, enabling engineers to determine if the system is being operated properly or if modifications should be made [39]. Thus, it becomes apparent that the DT technology combines a lot of technologies and tools, such as sensors, historical databases, cloud storage, and so on to achieve real-time monitoring of the production systems [38].

2.4. Maintenance in Manufacturing Systems—Predictive Maintenance in Industry 4.0

Equipment maintenance is a vital process in industries since 60–70% of the total production costs account for industrial equipment maintenance [40]. Maintenance is defined as the repair or replacement of equipment with the aim to increase its original expected operating time. Ineffective maintenance strategies can cause several problems such as unplanned downtime, decreased productivity, and high maintenance costs, minimizing in this way the reliability and the availability of the equipment [41]. In particular, according to [42], ineffective maintenance strategies can reduce a plant’s productivity by between 5 and 20%, and unplanned downtime may cost USD 50 billion annually for global producers. The aforementioned results highlight the need for the effective deployment of maintenance strategies in manufacturing systems. In the literature, there are several maintenance strategies, and the most prevailing are Reactive or corrective or run to failure (R2F) maintenance, preventive maintenance (PvM), and predictive maintenance (PdM). In the Industry 4.0 era, the R2F and PvM strategies are considered ineffective. In Figure 5, the evolution of the industrial maintenance strategies is illustrated, highlighting the key differences between them.
In R2F maintenance, repair, and replacements are conducted only after the machine fails. R2F maintenance may make sense for low-cost systems, i.e., for systems that the repair or replacement will be short and not costly [41]. PvM often known as scheduled maintenance is a type of maintenance that is conducted on a regular basis in order to avoid failures by performing frequent checks on the equipment. This maintenance strategy is applied regularly even if the system operates correctly, and its goal is to maintain the equipment in optimal condition maximizing in this way its availability. However, applying maintenance based on a schedule will lead to repairing or replacing components that still have a significant remaining useful life. Concretely, too early maintenance may lead to a waste of spare parts and resources, and too late maintenance may lead to catastrophic failures [11,41,43]. It becomes apparent that the main challenge of PvM is to find the right time to conduct maintenance. This challenge can be overcome by applying a smart maintenance approach, named predictive maintenance (PdM).
Industry 4.0 gave rise to several concepts and one of them is PdM. PdM is one of the main pillars of Industry 4.0, and it is regarded as the digital type of machine maintenance [13]. PdM utilizes predictive tools such as artificial intelligence algorithms to determine when maintenance is truly necessary to be conducted [11]. In Figure 6, the PdM framework is illustrated. As depicted, PdM is based on the constant monitoring of the equipment, which is achieved by the integrated sensors in the under-study machine. The core of the PdM approach is the data. With the use of sensors and the integration of the IIoT, a huge amount of operation data are produced, which are used to assess the condition and health of the monitored machine. These data may contain alarms and warnings about the abnormal condition of the equipment. Machine learning (ML) methods are widely used in the PdM domain due to their ability to handle high dimensional and multivariate data. ML techniques can be used to detect and classify the faulty behavior of the equipment, as well as predict the time to failure based on intelligent predictive algorithms. The prediction of RUL has become increasingly significant in machine health monitoring. By predicting the RUL of a component, the time of failure can be estimated, and MRO can be arranged at the optimum time. The utilization of historical data is also essential in order to produce more accurate results from a PdM strategy. Consequently, the R2F and PvM strategies must have been already implemented in order to collect data for PdM modeling [11,41,42].

2.5. Novelty of Proposed Framework

The key issue identified is that robotic manipulators suffer from low reliability as a consequence of the wearing out of the individual mechanical components. Therefore, based on the principle that the reliability of the robot depends on the reliability of its components, in this manuscript, a framework for the reliability optimization of a robotic cell’s critical component is proposed. This framework is based on the predictive maintenance domain, and the aim is to conduct diagnosis and prognosis in the critical component in order to find the optimum time to arrange maintenance. A predictive maintenance approach is proposed with the aim to detect and classify the faulty behavior of the robotic cell’s critical component based on a supervised machine learning technique. A PdM approach, which is based on ML techniques, is composed of multiple steps that should be implemented with the right sequence to have a reliable result. The most challenging tasks when conducting machine learning are the selection of the suitable features, as well as the selection of the suitable ML model. The features are the inputs to the ML model. Only useful and distinctive features should be used for faulty behavior classification. For this reason, a supervised ranking technique, named analysis of variance (ANOVA), was used with the aim to use only the useful features, i.e., features that can adequately differentiate the faulty behavior. The selection of the ML model that will be trained is a difficult process. For this reason, we leveraged the capabilities of the Classification Learner App of MATLAB, which gives us the ability to train a variety of well-known supervised ML models, and the ML model with the highest accuracy, i.e., the model that makes the minimum misclassifications, was selected.

3. Proposed System Architecture

3.1. General System Architecture

In the Industry 4.0 era, the interest is focused on data-driven approaches with the aim to assess and optimize the reliability of complex systems, such as robots. In Figure 7, a system architecture for the assessment and optimization of the reliability of a spot-welding robotic cell is presented. Concretely, the system architecture is divided into three steps. In the first step, the robotic cell is discretized into its main modules, and the DT concept of the robot that constitutes the robotic cell is presented; in the second step, the selection of the critical component is made; and in the third step, the component-oriented PdM approach that utilizes an available dataset is implemented. The scope of the PdM is to conduct a diagnosis and prognosis on the monitored equipment in order to determine the optimum time to arrange maintenance.
The discretization of the robotic cell is necessary in order to define the main components of the cell as well as to proceed with the identification of the critical components. The robotic cell that is under study is composed of two robots. A way to improve the reliability of a system is tο make a digital counterpart of the real system. The DT concept is proposed in this study as a tool that ensures automatic data flow between the physical and the simulated system. By integrating sensors, automated data flow is achieved between the physical and digital robot. By using expert opinions, publicly available reliability databases, maintenance manuals, and FTA, the selection of the critical component of the robotic cell is made. Depending on the aforementioned tools, the stepper motors of the robotic cell are selected as the critical components. Moreover, the utilization of the failure mode and effect (FMEA) analysis is proposed. The risk criticality assessment in FMEA is made by calculating the risk priority number (RPN) of each component. The procedure for selecting the critical component is depicted in Figure 8. Additionally, this research proposes a component-oriented predictive maintenance approach since the reliability of a robot depends on the reliability of its components. However, the main focus of this paper is the selection of the critical component. The digital twin (DT) technology is proposed as a method to optimize the reliability of a robot due to its ability to capture and monitor the health status of the robot in real time. In order to construct a digital twin, three main parts are needed: (i) physical system, (ii) virtual system, and (iii) type of communication between them. In this research, a start for the development of a digital twin was made. The physical system, SMART NJ-370-3.0 robot, is located in the laboratory, the virtual system is made in the Simulink environment of MATLAB, and our future work will be focused on the connection between the two systems in order to ensure the automated dataflow in real time.
The operation of robots depends to a large extent on the operation of actuators as they are the equipment that feeds the robot with motion. According to studies, a lot of failures of motors are a result of bearing failure. As a result, the bearing is selected as the critical component. Since the selection of the critical component is made, a DAQ is used to gather data from the real robot. Vibration measurements are used as they are representative of the bearing’s degradation. The data are stored in a cloud database through IoT devices. After, a PdM algorithm retrieves vibration data from the bearing that has been stored in the cloud database. The data should be preprocessed in order to extract useful and distinctive features from the raw vibration signal. The raw vibration signals are usually noisy and include outliers and zeros, so time and frequency-domain features are extracted from them. This predictive approach is separated into two main parts, diagnosis, and prognosis. Diagnosis is used to identify patterns in processing data in order to diagnose unanticipated machine malfunctions and classify faulty behavior. The features that are used for faulty detection and classification are named condition indicators (CIs). ML models are fed with CIs with the aim to classify the data. Prognosis is used to estimate the RUL. Health indicators (HI) will be used to train a degradation model. HIs are the features that present a deterioration similar to the deterioration of the raw signal. The decision making is the last step of the PdM. After the implementation of the diagnosis and prognosis approaches, the maintenance staff should be informed in order to implement appropriate maintenance tasks. In this way, the reliability of the bearing can be improved, which will lead to the whole robotic cell’s reliability improvement.

3.2. Predictive Maintenance Framework

In complex systems, such as robotic cells, the failure of a single component may lead to the abnormal functionality of the whole system or worse to its breakdown. Therefore, a PdM component-oriented flowchart is presented with the aim to assess and improve the reliability of the critical component and by extension the reliability of the robotic cell. More specifically, in Figure 9, a data-based PdM approach is presented for the detection and classification of the bearing’s faulty behavior utilizing a supervised ML algorithm.
Vibration analysis is the most widely used condition monitoring technology in the industry for rotating components, and it is an effective tool for detecting bearing faults [43]. As a result, a large amount of data from an accelerometer, which is located in the bearing, is gathered. Firstly, the data are imported into the workspace. Data preprocessing is necessary in order to prepare the data for feature extraction. Once the data is prepared, we visualize the data to gain more knowledge about the raw vibration signal. Depending on the signal’s visualization, edges can be set to label the data. Thus, a supervised ML problem will be developed. Feature extraction is necessary because most of the raw vibration signals have random noise and uncertain interferences. The features that are used to distinguish healthy from faulty conditions are called CIs. CIs can be derived from the raw data by using time domain, frequency domain, and time–frequency domain features. The effectiveness of CIs is quantified with the one way ANOVA (analysis of variance) ranking technique. Feature selection is the process that involves the reduction of the input variables for training ML models in the context of PdM. In some cases, reducing the number of input variables can enhance the performance of the model as the useless features that may harm the model are excluded and also in this way the computational cost of modeling can be minimized [44]. A partition of data is necessary to train the ML algorithm and after to test it. The data split into train (75%) and test (25%) data. Testing of the ML model is needed to see how the model performs in data that has not been “seen” again. To interpret the results of the ML training models, the confusion matrix is used in order to assess the results. The cost matrix can be used as an optimization tool in order to optimize the ML model, setting with high cost the most serious mistakes. If the testing results are inadequate, the performance of the model can be further optimized by fine tuning the hyperparameters. If after the fine tuning of hyperparameters, the testing results are still inadequate, the process should be restarted from the features’ selection.

4. Industrial Case Study

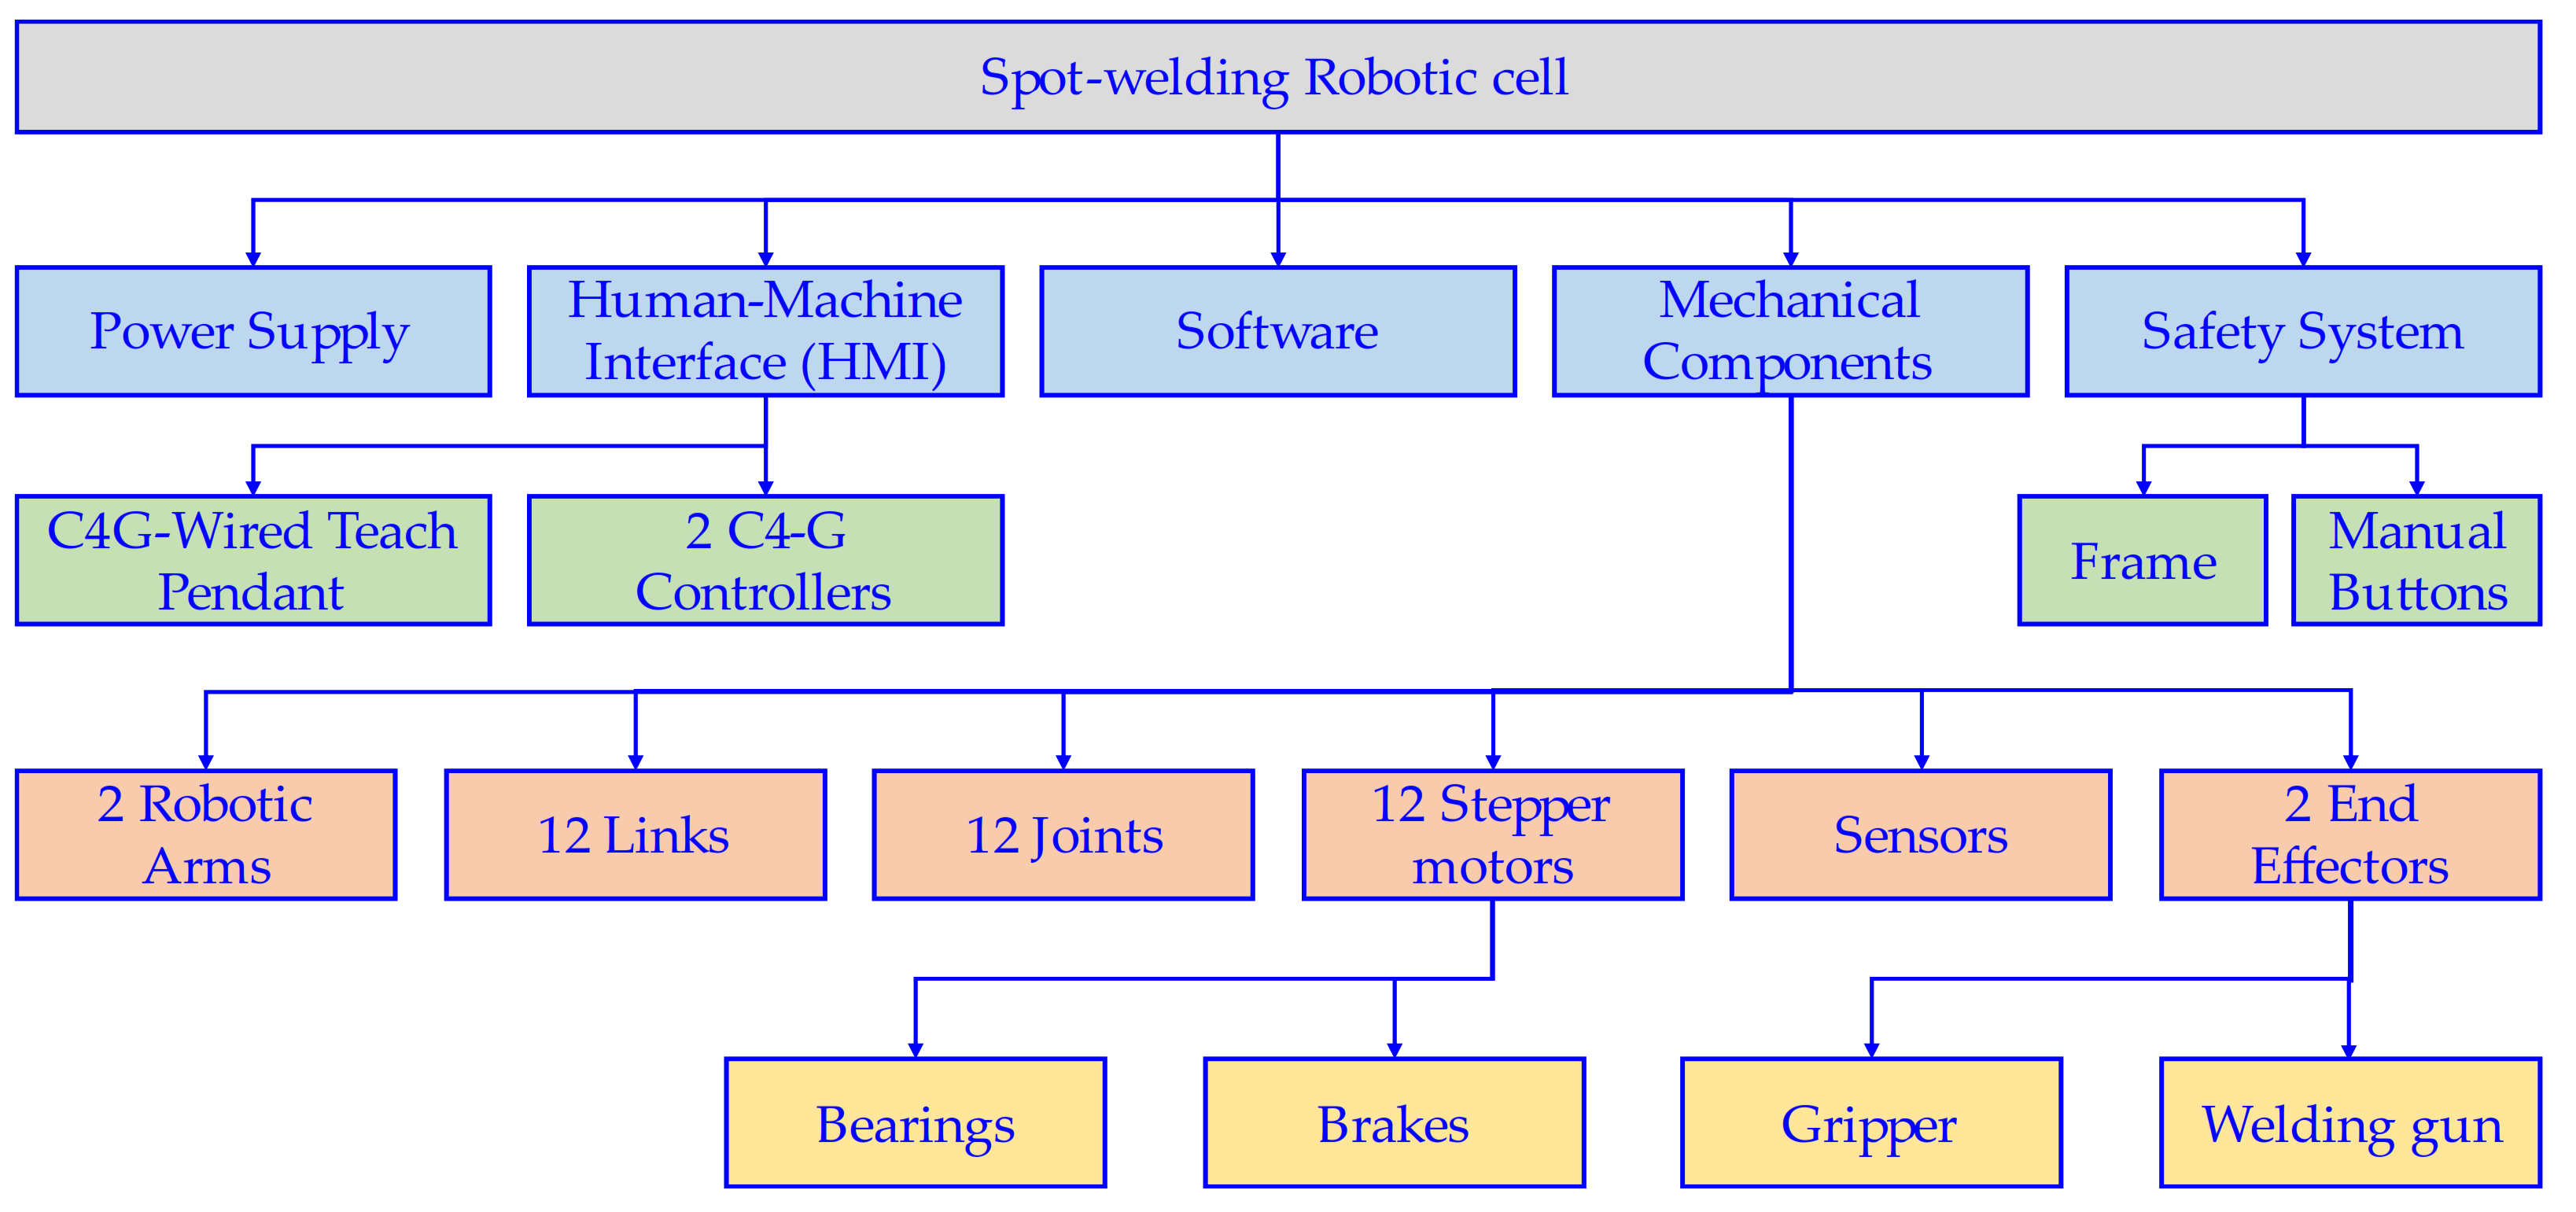
The spot-welding robotic cell was discretized into its main modules, and a network reduction method of its RBD is made in order to transform the original complex system into a simple equivalent one and to extract the generalized mathematical equation that describes the reliability of the entire robotic cell. However, assumptions and simplifications in the construction of the robotic cell’s RBD make the reliability assessment less accurate. Consequently, a DT concept is proposed along with a component-oriented PdM framework aiming to assess and improve the reliability of the robotic cell. The investigated robotic cell performs spot welding in metal sheets for the automotive industry. Robots are widely used for welding processes due to their accuracy and repeatability. Furthermore, welding operations require more strict security and safety precautions for human welders, thus constituting robotic welders more suitable. The failure of one component may lead to the collapse of an entire system. Therefore, in Figure 10, the discretization of the spot-welding robotic cell is illustrated.
Power supply, human–machine interface (HMI), software, mechanical components, and safety systems are the main modules comprising the robotic cell. The operator interacts with the robotic cell via the wired C4G teach pendant that communicates the commands to the robots’ controllers. The robotic cell consists of 2 identical COMAU NJ-370-3.0 robots. One robot serves as a handler, and the second robot performs the welding operation. The two robots should operate and communicate correctly together in order to perform the welding operation efficiently and up to the quality standard set by the manufacturer. Each robot consists of 6 links, 6 joints, 6 stepper motors, sensors, 1 end effector, and 1 dedicated controller. The robotic cell is bounded by fences, and it is equipped with manual safety buttons for terminating the welding operation. In reliability modeling, the reliability of a system that consists of several components being connected serially or parallel is described by the following generalized reliability equations for series and parallel connections, respectively:
R t o t a l , 1 t = i = 1 n R i
R t o t a l , 2 t = 1 i = 1 n ( 1 R i )
The development of the FTA of the robotic cell is performed in order to identify the causes of failures and the failure logical paths. Concretely, the factors that may cause a failure event can be examined with the FTA method. Combinations of faults are represented at each tree level with the utilization of logical operators such as “AND”, “OR”, and “EVENT” [22]. The generalized equations for the FTA modeling for “AND” and “OR” gates, respectively, are as follows:
P A N D X = i = 1 n P X i
P O R X = 1 i = 1 n 1 P X i
where P A N D X is the occurrence of the “AND” gates output fault event X, n is the number of independent input-fault events, and P( X i ) is the probability of the event X i . Similarly, P O R X is the occurrence of the “OR” gates output fault event X. In 
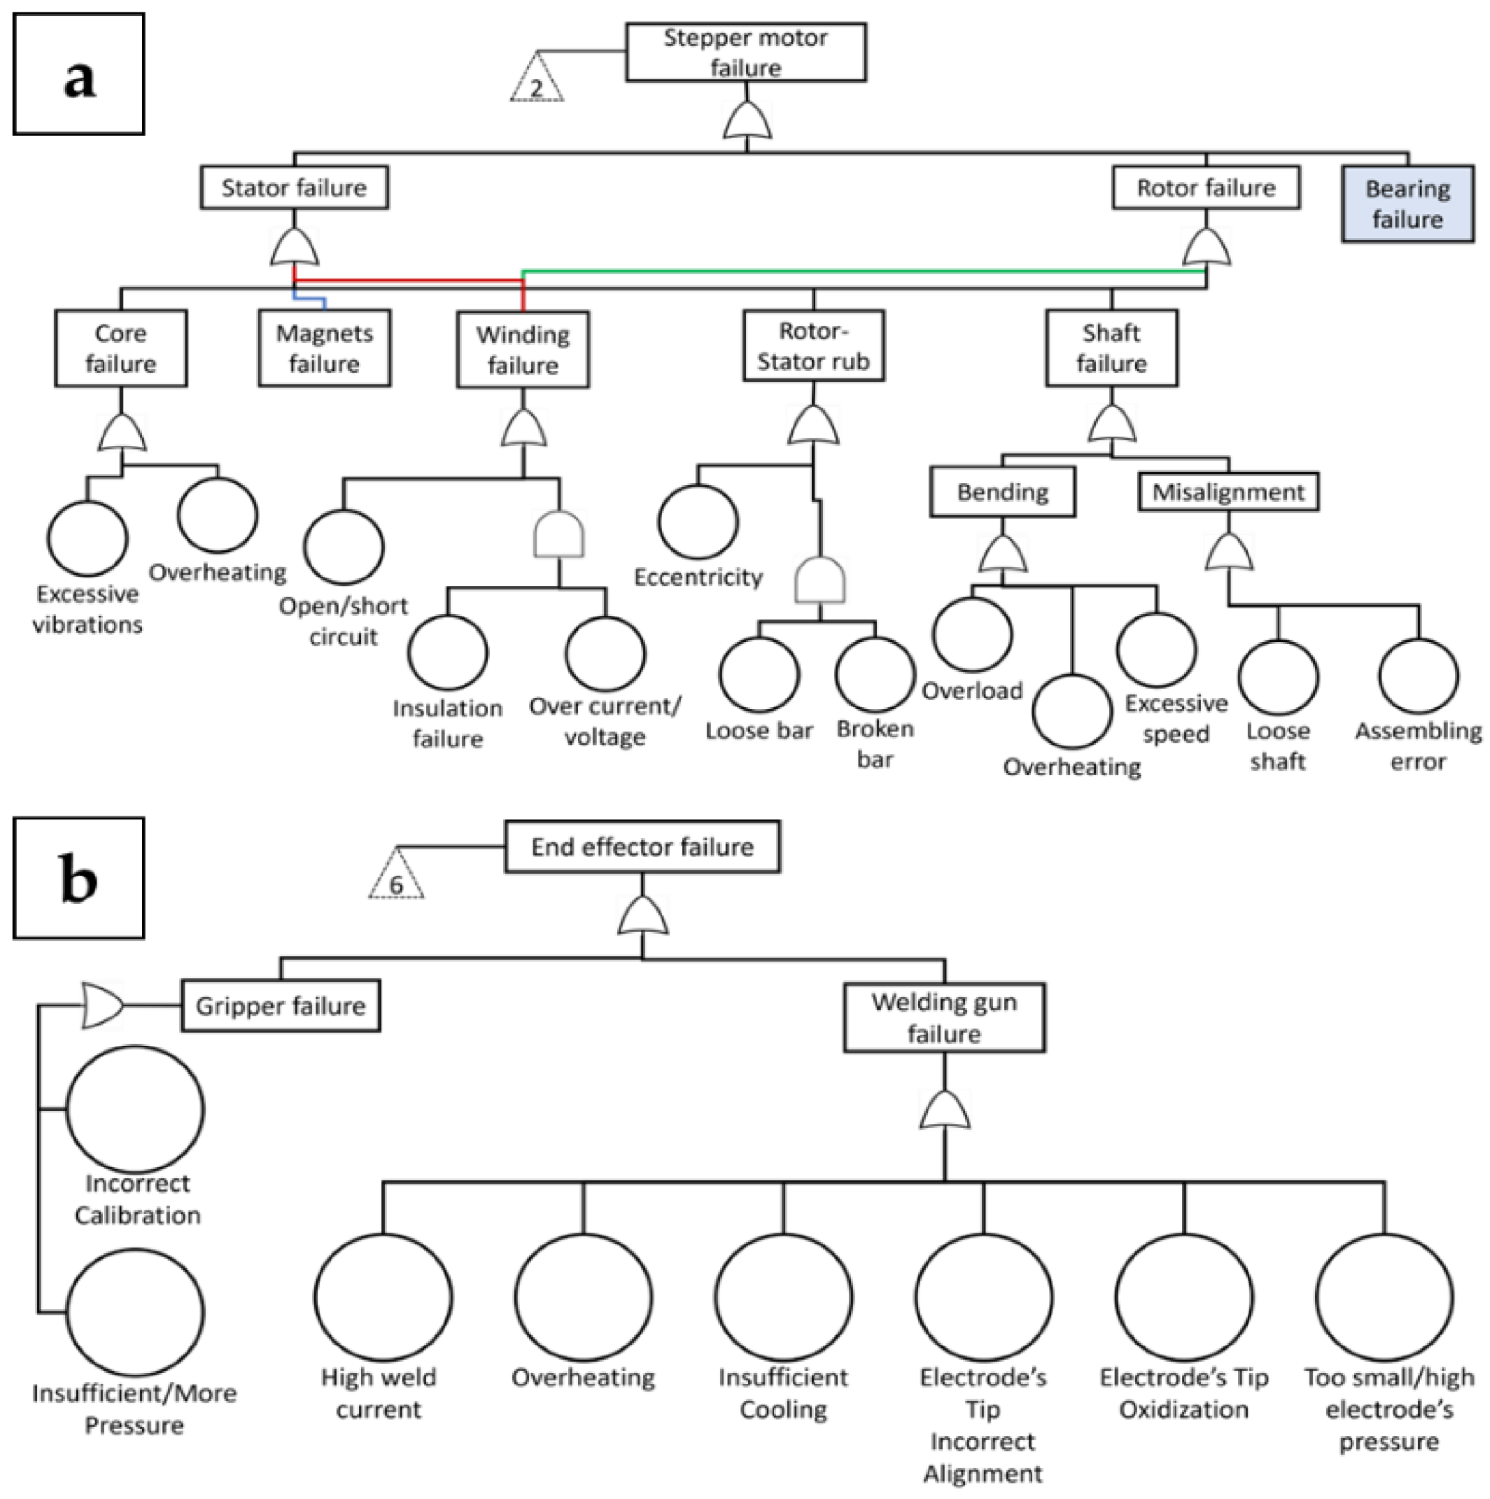
Figure 11, the FTA of the spot-welding robotic cell is illustrated.
The top event of the FTA is the failure in welding. The basic fault event corresponds to a fault that does not require any further development, and an intermediate event corresponds to a fault that occurred because of the logical combinations of other events further down the tree [45]. However, FTA is an ineffective reliability modeling approach for modern systems. More specifically, the FTA method is based on domain experts’ opinions and on the domain knowledge of the system, which creates a bottleneck as it is challenging to comprehend the root causes of the system’s failure. Therefore the robotic cell’s digital twin and predictive maintenance framework is implemented in conjunction with the FTA.
One way to improve the reliability of a robotic cell is to constantly monitor and control its health status. This can be accomplished by constructing a digital counterpart of the robotic cell’s main module, which is the robot. For this reason, the modeling and simulation of the SMART NJ-370-3.0 robot is made. With simulation, what-if scenarios can be tested without disturbing the physical system.
In order to improve the reliability of the robotic system, we are based on the principle that the reliability of a robot is based on the reliability of its components. Concretely, each robotic arm is considered. For this reason, a component-oriented predictive maintenance approach is developed with the scope to firstly improve the reliability of the critical component and by extension the reliability of the whole robotic system. As mentioned before, we are currently working on the establishment of a connection platform between the physical and the virtual robot. For this reason, a publicly available dataset was used for this paper.
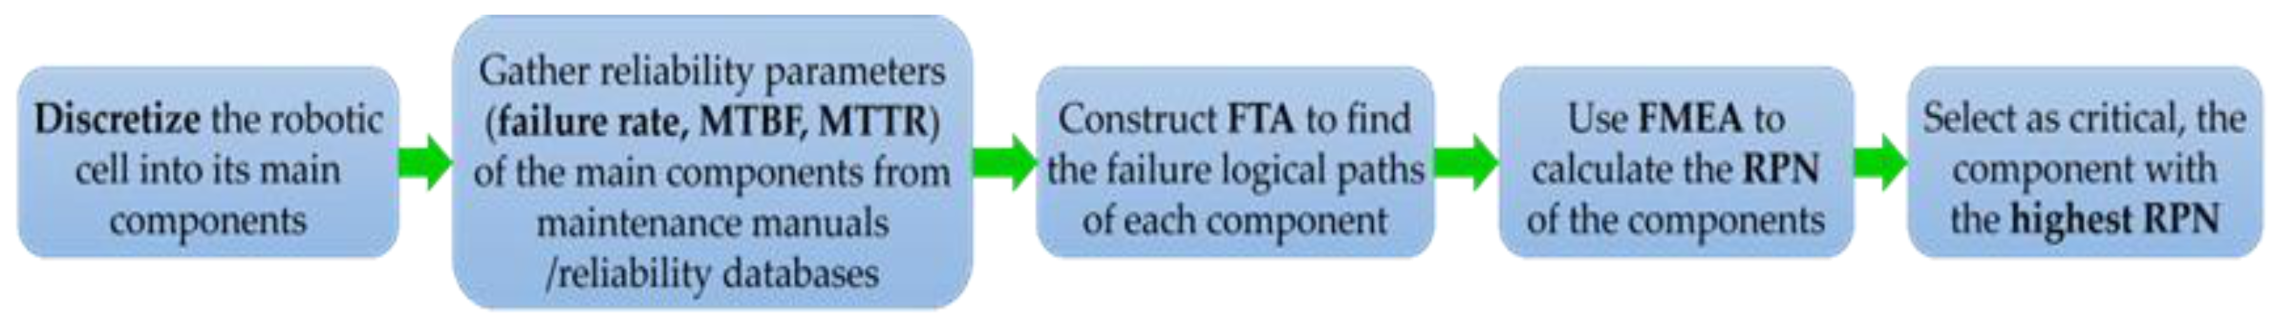
In order to select the critical component, the discretization of the robotic system was made, and the main parts were found. A robotic system is composed of several components that should operate correctly in order to ensure a reliable robotic process. The main mechanical components of a robotic system are the controller, the robotic manipulator, the motors, the sensors, the brakes, and the end-effectors. The motors are essential parts of the robotic systems since they are the equipment that feed with power the joints. For this reason, in order to develop a predictive maintenance approach, the stepper motors are selected as the critical components, and since a lot of malfunctions of the motors are a result of bearings’ malfunctions, a publicly available R2F (run-to-failure) experiment of bearings was used. In Figure 12, the construction of the FTA (fault tree analysis) for the main components of the robotic system is presented with the aim to justify the selection of the stepper motors as critical components.
As depicted, the FTA of the motor is more complicated with different interdependent failure modes. For this reason, the stepper motor is selected as the critical component
From the above figure, it becomes apparent that a motor may fail due to stator failure or rotor failure, or bearing failure. Several publications found that their main focus was the condition monitoring of bearings as they are representative components of any rotating machine, such as motors. For instance, Yang et al. in 2022 [46] highlighted that rolling bearings constitute components that are used extensively in rotating machines, and they are one of the most fault-prone components. In the research work of Lessmeier et al. in 2016 [47], it is mentioned that 40–70% of motor failures are a result of bearing failures that caused increased downtime and financial losses. Similarly, Toma et al. in 2020 [48] highlighted that motor failures can be categorized into four groups: stator, rotor, bearing faults, and other faults. According to research that was conducted by the General Electric Co. and IEEE-IGA, the most common cause of motor failures is bearing failures (more than 40%).
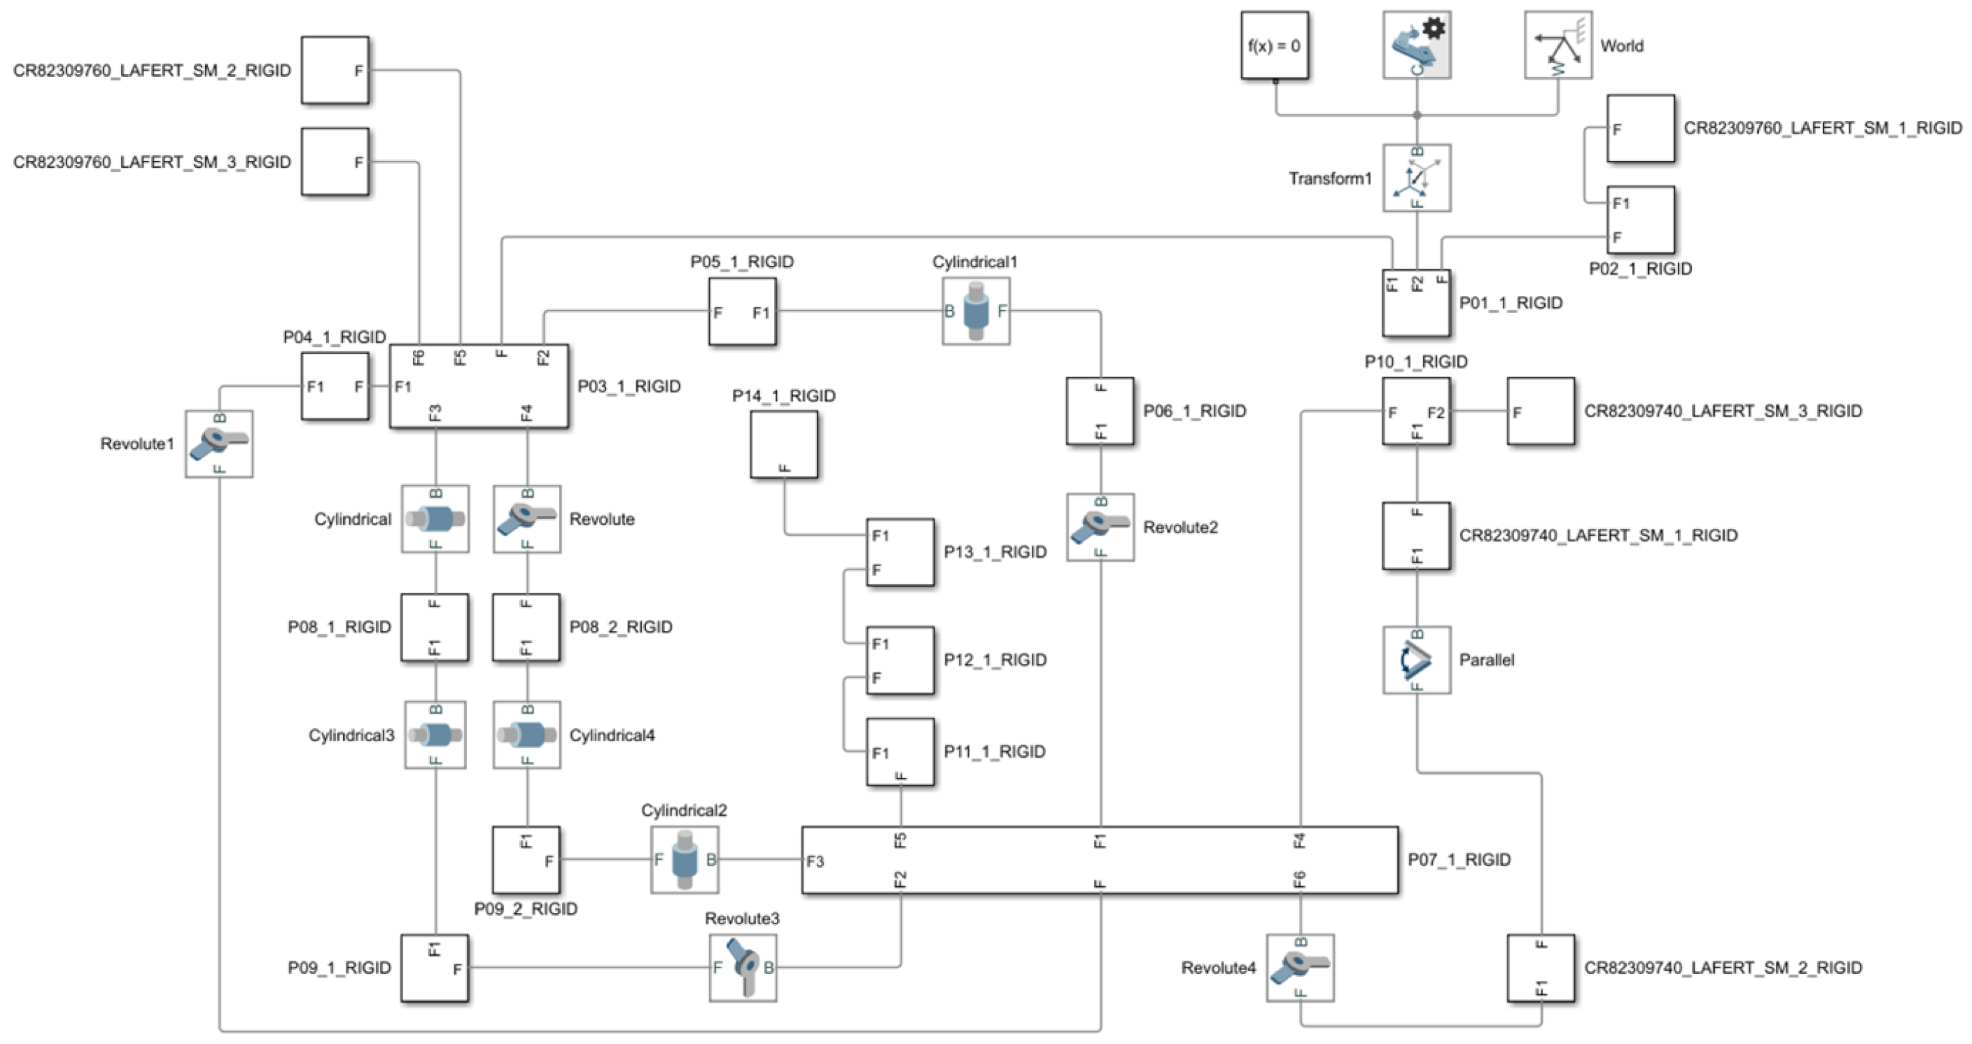
In Figure 13, the blocks of the simulated SMART NJ-370-3.0 robot in the Simscape Multibody environment are depicted. The Simscape Multibody software uses function blocks for the representation of the robot’s components. The blocks represent rigid bodies, joints, and transform. The transform block defines a fixed 3-D rigid transformation between two frames. The blocks of the rigid bodies consist of several sub-blocks. Different types of joints are depicted such as cylindrical, revolute, and parallel, which determine the connection and motion between the rigid bodies.
The next step is to process the dataset that will be used for the component-oriented PdM approach. The NASA Bearing Dataset will be used, which was generated by the NSF I/UCR Center for Intelligent Maintenance Systems. This dataset comprises three sub-datasets with R2F experiments. The dataset includes data for four force-lubricated bearings. The dataset consists of 984 CSV (comma-separated value) files that include vibration signal measurements. The file recording interval was set to 10 min. Each file consists of 20,480 data entries, which corresponds to a sampling rate of 20 kHz. Data were recorded for a time horizon of 7 days. In order to collect the required data, an experimental setup including an AC motor coupled to a shaft via a ribbed belt was used. The AC motor was adjusted to run at a constant angular speed of 2000 RPM (revolutions per minute). Furthermore, a spring mechanism was used in order to apply a radial load of 27 kN to the shaft and bearing. Regarding the sensing equipment, a PCB 353B33 High Sensitivity Quartz ICP accelerometer was installed on the bearing housing in conjunction with a NI DAQCard 6062E.

5. System Implementation

A component-oriented PdM approach focusing on the detection and classification of faulty behavior of the critical components of the robotic cell as presented in the previous paragraphs has been designed and developed. In order to complete the development of the proposed method, the training of an ML algorithm is required. Thus, a supervised ML model will be developed. MATLAB is used for the analysis of the data and for the training of the ML model. In this research work, the Diagnostic Feature Designer and the Classification Learner Apps are used. The corresponding pseudocode for the supervised ML problem is as follows:
  • SUPERVISED MACHINE LEARNING PSEUDOCODE
START
IMPORT VIBRATION DATA
CREATE tabular datastore ds
IMPORT CSV files to ds
ReadSize ds.ReadSize = ‘file’
NbrFiles = 984
PREPROCESS AND PREPARE DATA
    Load dataset into a pandas dataframe
    Drop columns not relevant to vibration data
    Create new column and combine X and Y accelerometer readings
    Resample the data at a fixed frequency of 100 ms
    Calculate the rolling_mean = sum(values[-window_size:])/window_size
    Calculate standard deviation rolling_std = values[-window_size:].std()
    Remove rows with missing values
    Export new dataset as a CSV file
END
CALL datetime
Time = datetime(FileNames, “day/month/year hour:minutes:seconds”)
CREATE timetable
timetable(Time, dataBearing1)
PLOT (timetable)
FUNCTION Data_Labeling
    SET label edges
    Edges = [“2004.02.12.10.32.39”, “2004.02.17.00.00.00”, “2004.02.19.00.00.00”, “2004.02.19.06.22.39”]
    CALL datetime
    EdgesDateTime = datetime(Edges, “day/month/year hour:minutes:seconds”)
    SET data labels LABELS = {‘Good’, ‘Alert’, ‘Urgent’}
    CREATE new column in timetable
    newTimetable = timetable(Time, dataBearing1, HealthStatus)
END
FUNCTION Feature_Extraction
    INPUT data to Diagnostic Designer App
    SELECT time and frequency-domain features
    RANK features with one-way ANOVA
    IMPORT features in datastore
    Features = readall(Features)
END
FUNCTION Data_Split
SPLIT 75% of data TO train & 25% TO test
Float percentageTest = 0.25
CALL randperm
RandomNbrFiles = randperm(984)
GET trainData & testData
ML TRAINING AND TESTING
    Import trainData
    Train all the available ML models
    Select ML model with highest accuracy
    Evaluate the performance of the model with the confusion matrix
    IF training process is adequate THEN
      Export the model and validate it with the test data
    ELSE
      use cost matrix to prioritize the serious mistakes
    END_IF
IF (training adequate) THEN
    EXPORT the model and validate it with test data
ELSE
      use cost matrix with new settings
END
IF testing results are adequate THEN
    END Training process
ELSE
    RETRAIN model with new hyperparameters
END
IF testing results are adequate THEN
    Finish the process
ELSE
    Select new features and REPEAT training
END
END
In order to model the virtual robotic cell, the CAD files of the robot have been processed via the educational version of Solidworks 2022 [49]. Further to that, the Simscape Multibody Link Plugin has been enabled within the Solidworks environment, which enables the export of the robot’s assembly directly to the Simscape Multibody. Simscape Multibody is a useful tool of MATLAB for modeling multi-object systems [50].
Since there are 984 CSV files of vibration records, the construction of a tabular datastore is necessary to read and process the vibration data that are located on different files on the disk. Each time, specified data files can be retrieved from the datastore. The next step of the PdM approach is the preprocessing and preparation of data for feature extraction. In this step, all the data points of each file, i.e., the 20,480 data points of each file, are positioned into a cell. This process is applied to all 984 files.
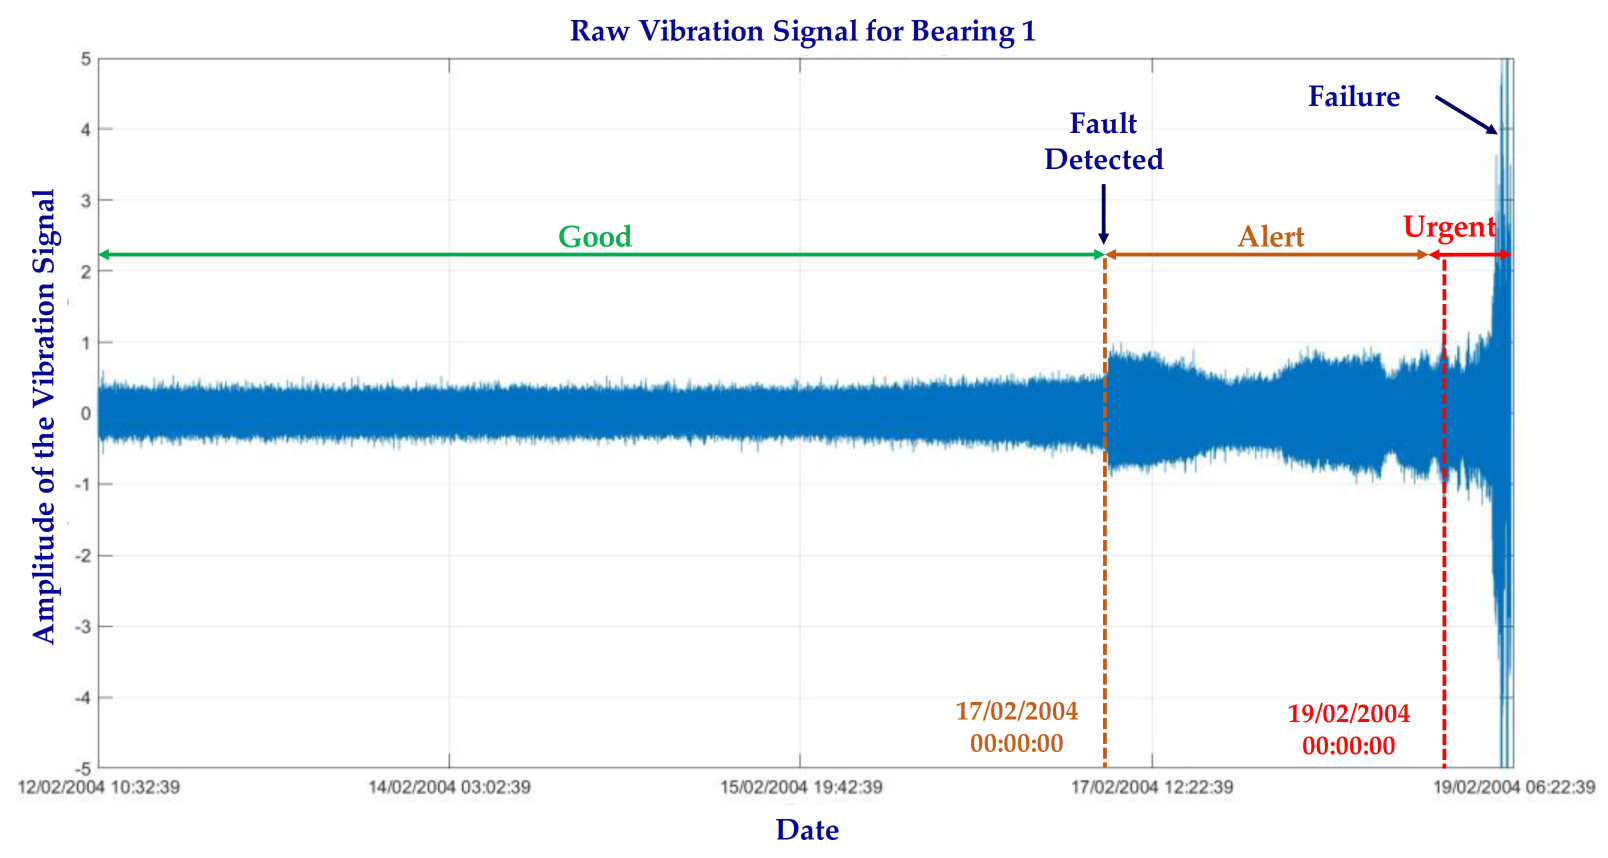
The plot of the raw vibration signal is necessary as the visualization of the signal enables the determination of the edges in order to classify the data. The vibration signal was recorded from 12 February 2004 10:32:39 until 19 February 2004 06:22:39, and it includes run-to-failure data. As depicted in Figure 14, a deterioration trend is presented in the vibration data as the bearing reaches close to the failure. Considering the visualization of the signal, the data are classified into three categories: (i) Good data, (ii) Alert data, and (iii) Urgent data. “Good data” are represented with green color, “Alert data” with yellow color, and “Urgent data” with red color.
Depending on the visualization of the signal, a new timetable is constructed with an additional column that represents the components’ health status based on the classification of the data. Since the vibration data has been preprocessed, the next step of the PdM approach is the feature extraction. The Diagnostic Feature Designer App is used for this scope. This app provides the necessary automated functionalities for feature extraction from datasets based on three key domains, namely (i) time domain, (ii) frequency domain, and (iii) time/frequency domain. Because the selected critical component is a rotating component and its data are periodic, it is necessary to also extract frequency domain features to give us more insight. In Table 2, the time-domain, and frequency domain features, which are available from this app, are presented.
Only useful and distinctive features should be used as inputs to the ML algorithms. For this reason, the features should be ranked, and only these features that adequately differentiate the data should be used. In this research, a supervised ranking technique, the one way ANOVA (analysis of variance) will be used as a ranking method for determining which features are suitable for predicting better condition variables. One way ANOVA determines whether the dependent variable, which is the vibration data, changes in relation to the level of the independent variable (time). CIs are the features that can be extracted from the system’s data whose behavior changes in a predictable way as the system degrades or operates in different operating modes. A useful CI groups similar data points together and separates those that have different behavior. In Table 3, the ranking process of the time domain and frequency domain features is presented.
There are 984 CSV files of data: 75% of them are used for training and 25% for testing. In addition, to ensure that the data will be selected randomly, the randperm command of MATLAB is utilized. The selection of features is a challenging issue, and it is not an answer to the question of how many features are adequate for ML training. Generally speaking, the more you feed the ML model with features, the more accurate the result will be. However, useless features may harm the response of the model. Considering the results of the one way ANOVA, the best five ranked features will be used. However, because the features SINAD and SNR display similar behavior, only one of them is selected. The same is observed for the RMS and Std features. Selecting features that have similar behavior may harm the ML model. Thus, the selected features that will be the inputs to the ML models are the following: SNR, RMS, Peak Frequency 1, Shape Factor, and Band Power. The Classification Learner app will be used for ML training, and various classifiers will be used as it is impossible to know in advance which model is suitable to classify the data. After the training of the ML models, the medium Gaussian SVM is selected as the best model, since it presents the highest accuracy (98.24%).
The confusion matrix is a visual evaluation tool that is used in supervised ML problems to assess the performance of classifiers [50]. It displays the various ways in which the classification model is confused when making predictions. A confusion matrix has two dimensions: the vertical represents the actual class of the data, and the horizontal represents the class that the classifier predicts [51]. In the main diagonal cells, the percentages of how many times the ML model correctly predicts the class of data are illustrated, whereas in the other cells, the percentages of how many times the ML model makes mistakes when it comes to predicting the class of data are presented. In 
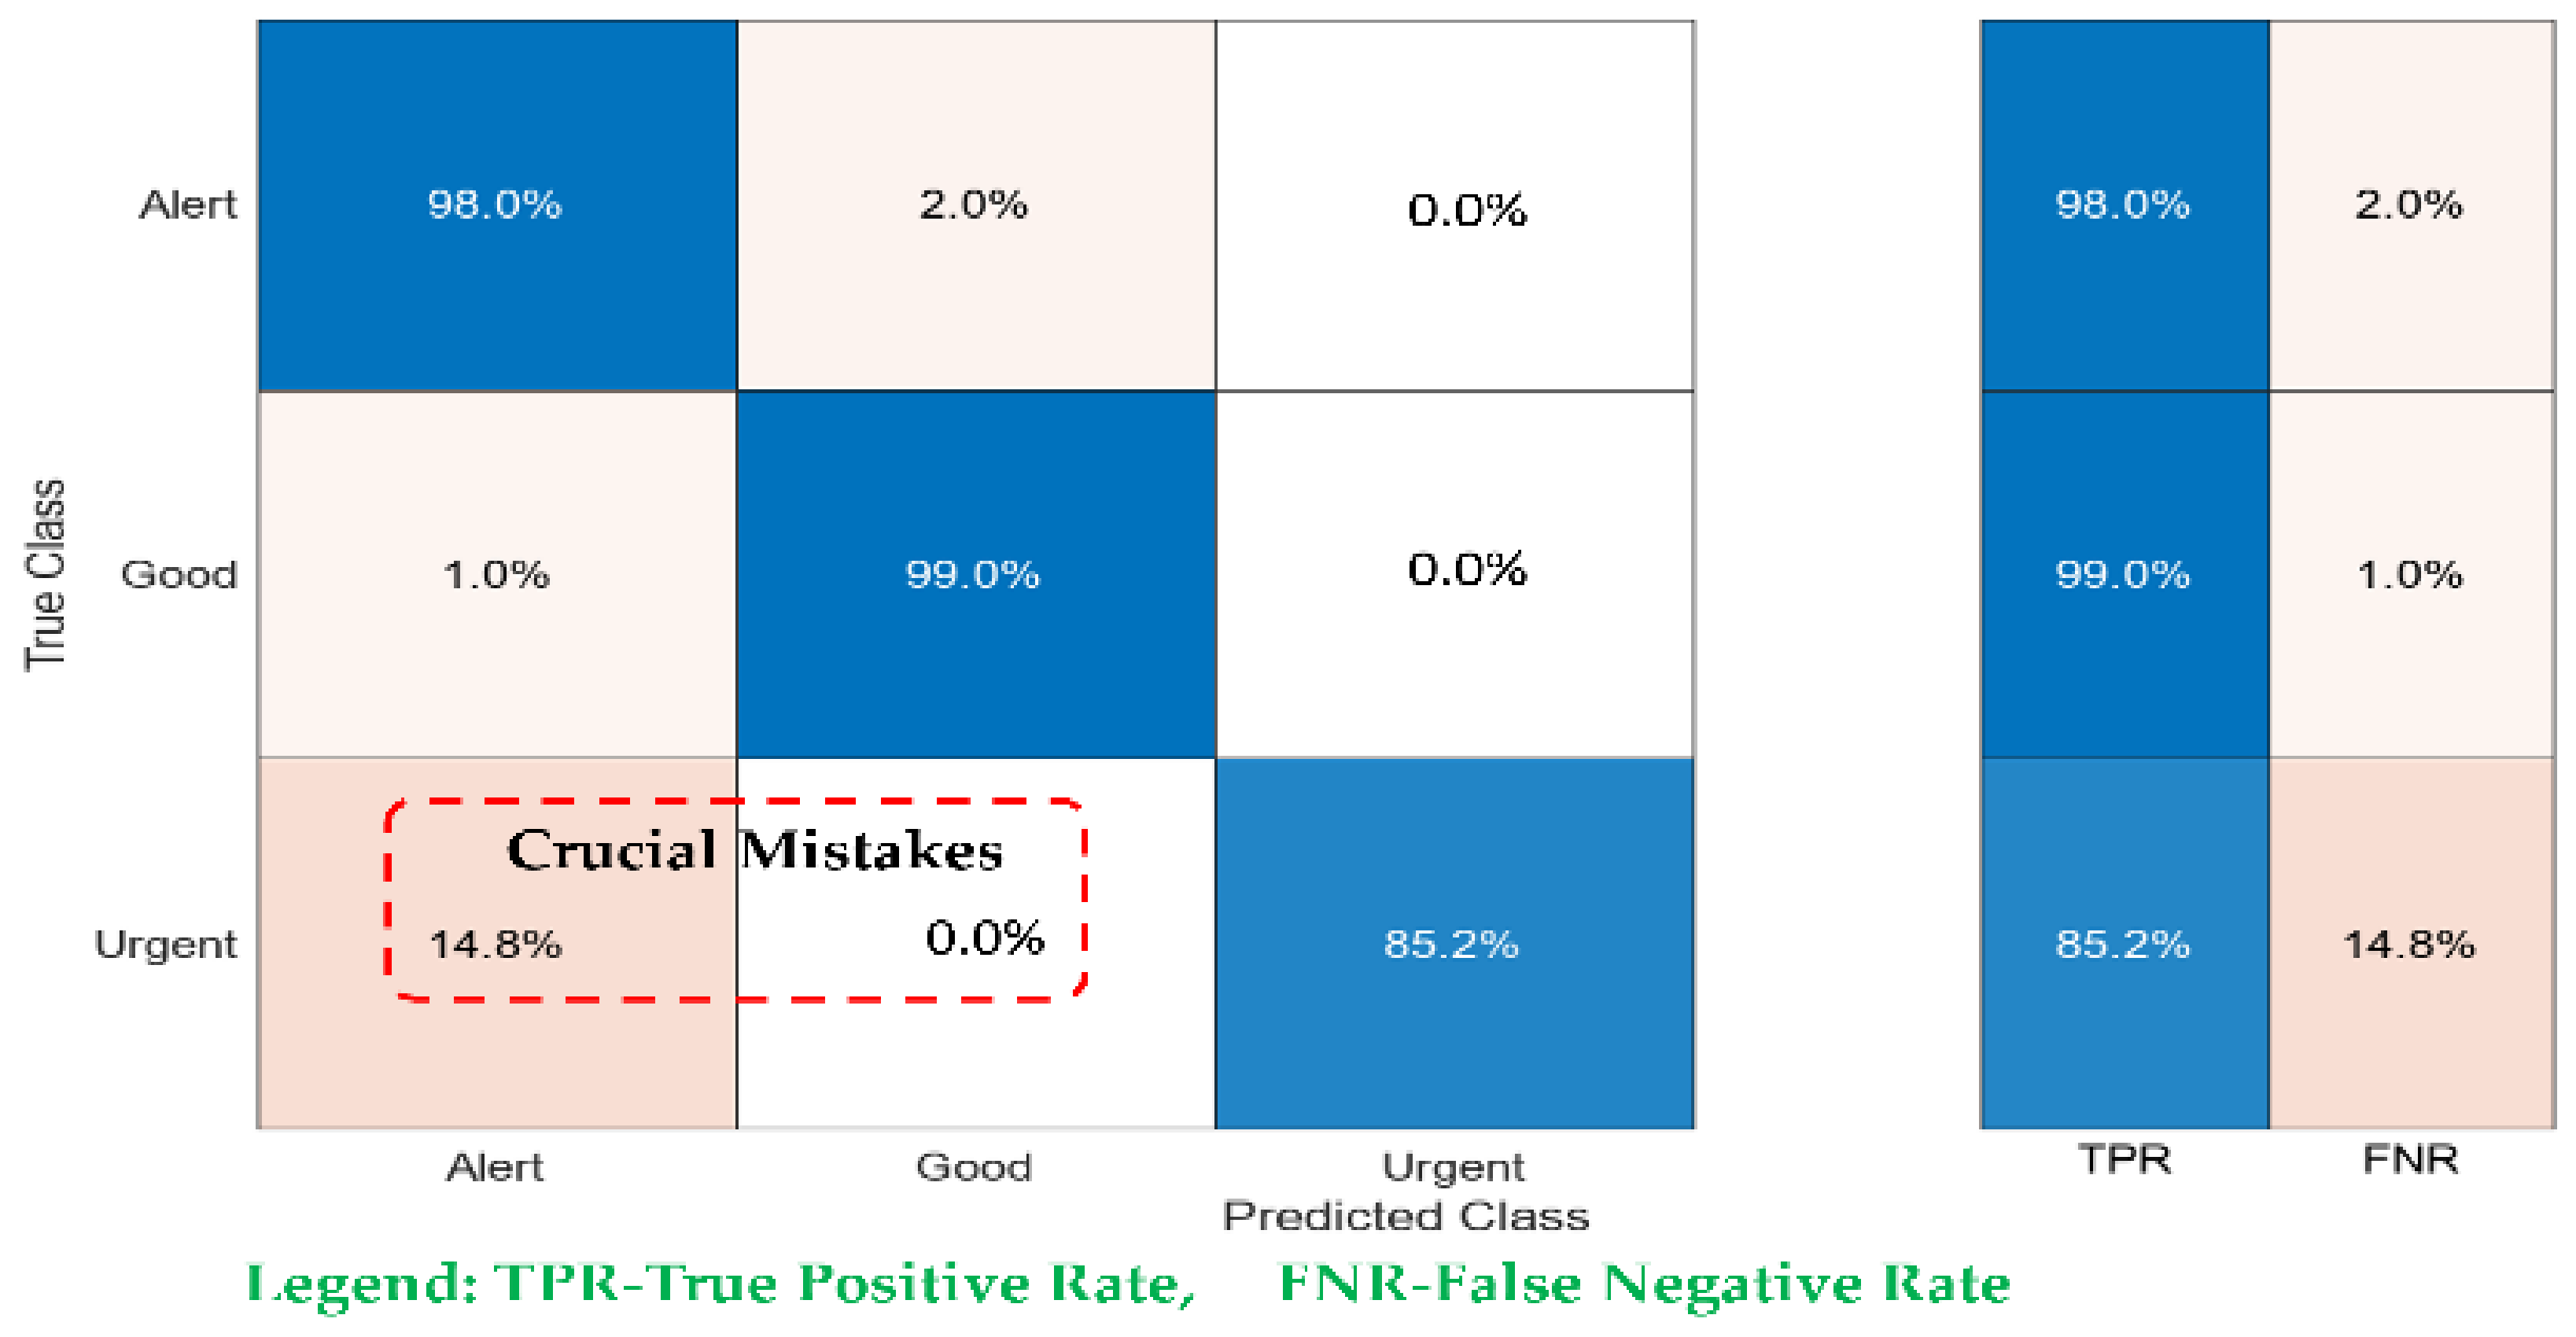
Figure 15, the confusion matrix of the medium Gaussian SVM model is illustrated along with the statistical measures.
It can be observed that the SVM model is capable of correctly predicting “good” data at a rate of 99%, “alert” data at a rate of 98%, and “urgent” data at a rate of 85.2%. Consequently, the rates of wrong predictions are 1.0%, 2.0%, and 14.8%, respectively. The percentages of correct predictions of “good” and “alert” data are adequate. On the other hand, the percentage of the correct prediction of “urgent” data is considered inadequate. It is important to mention that when conducting PdM techniques, some mistakes are more crucial and important than others. The two cells that are highlighted are defined as the most crucial mistakes that the model makes. The most crucial mistake is when the response of the model is that “urgent” data are considered “good” data. It can be observed also that the probability of the SVM predicting “urgent” data as “good” is zero, which is as desired. However, 14.8 times SVM considers “urgent” data as “alert” data. This mistake should be minimized, and the probability that the SVM correctly predicts “urgent” data should be maximized. So, the selected model needs optimization. The cost matrix will be used as an optimization tool. It is a tool for reallocating the mistakes and minimizing specific types of classification errors in ML classification problems. Cost matrices are employed to selectively reduce classification errors that are associated with detrimental consequences for the system [
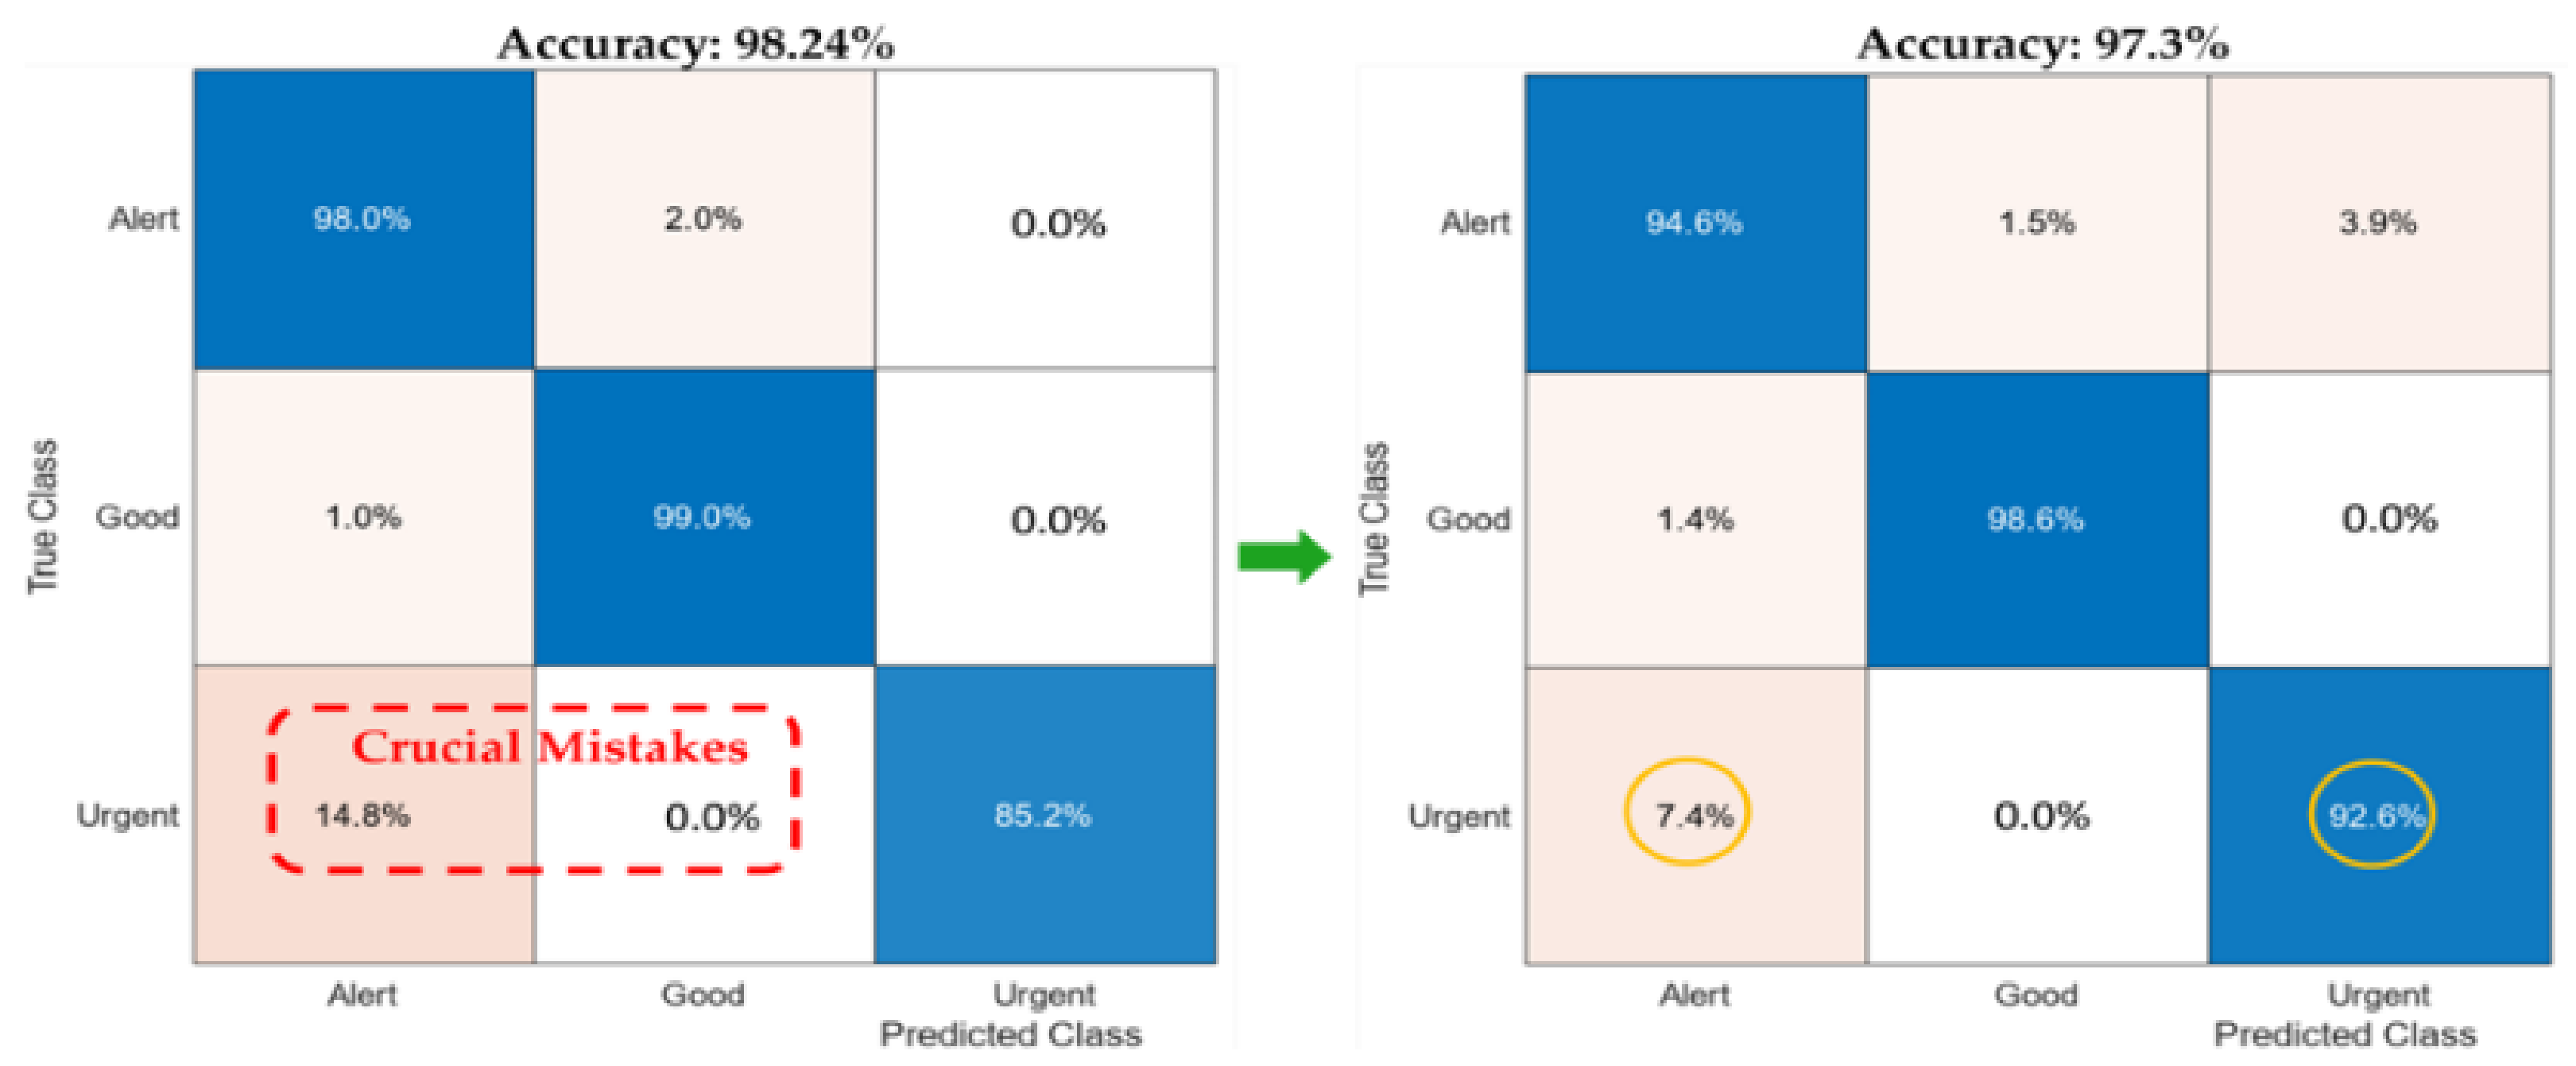
51]. The confusion matrix considers that all the different mistakes are equally important, which is not true for most manufacturing systems. It has default settings that determine that all misclassifications have the same cost. In our case, it is extremely important to correctly detect “urgent” data in order to ensure that the robotic cell will not stop operating. The probability that “urgent” data will be correctly predicted should be prioritized against the probability that “alert” and “good” data will be correctly predicted. A trial and error method is applied in order to find the suitable costs of the pinpointed cells. Since the suitable costs are found, this new model is retrained. In Figure 16, the confusion matrix of the modified SVM model (right confusion matrix) is illustrated side by side with the SVM model without modifications in the settings of the cost matrix (left confusion matrix) in order to make the comparison.
From Figure 17, it can be observed that the accuracy of the modified SVM model is 97.3%. It is still a good accuracy as it is a little less than before, which was 98.2%. In the left confusion matrix, the important mistakes are circled. The modified model predicts 92.6 of times correctly “urgent” and only 7.4 of times predict “urgent” data as “alert” data. With the new settings, the percentage of predicting “urgent” data as “alert” decreased to half.
However, there is a trade off, as the probability of predicting “alert” data as “urgent” data is now 3.9% compared to previously when it was 0%. However, this mistake does not affect the reliability of our model much. In case we want to further optimize the performance of our model, this can be achieved by fine tuning the model’s hyperparameters.
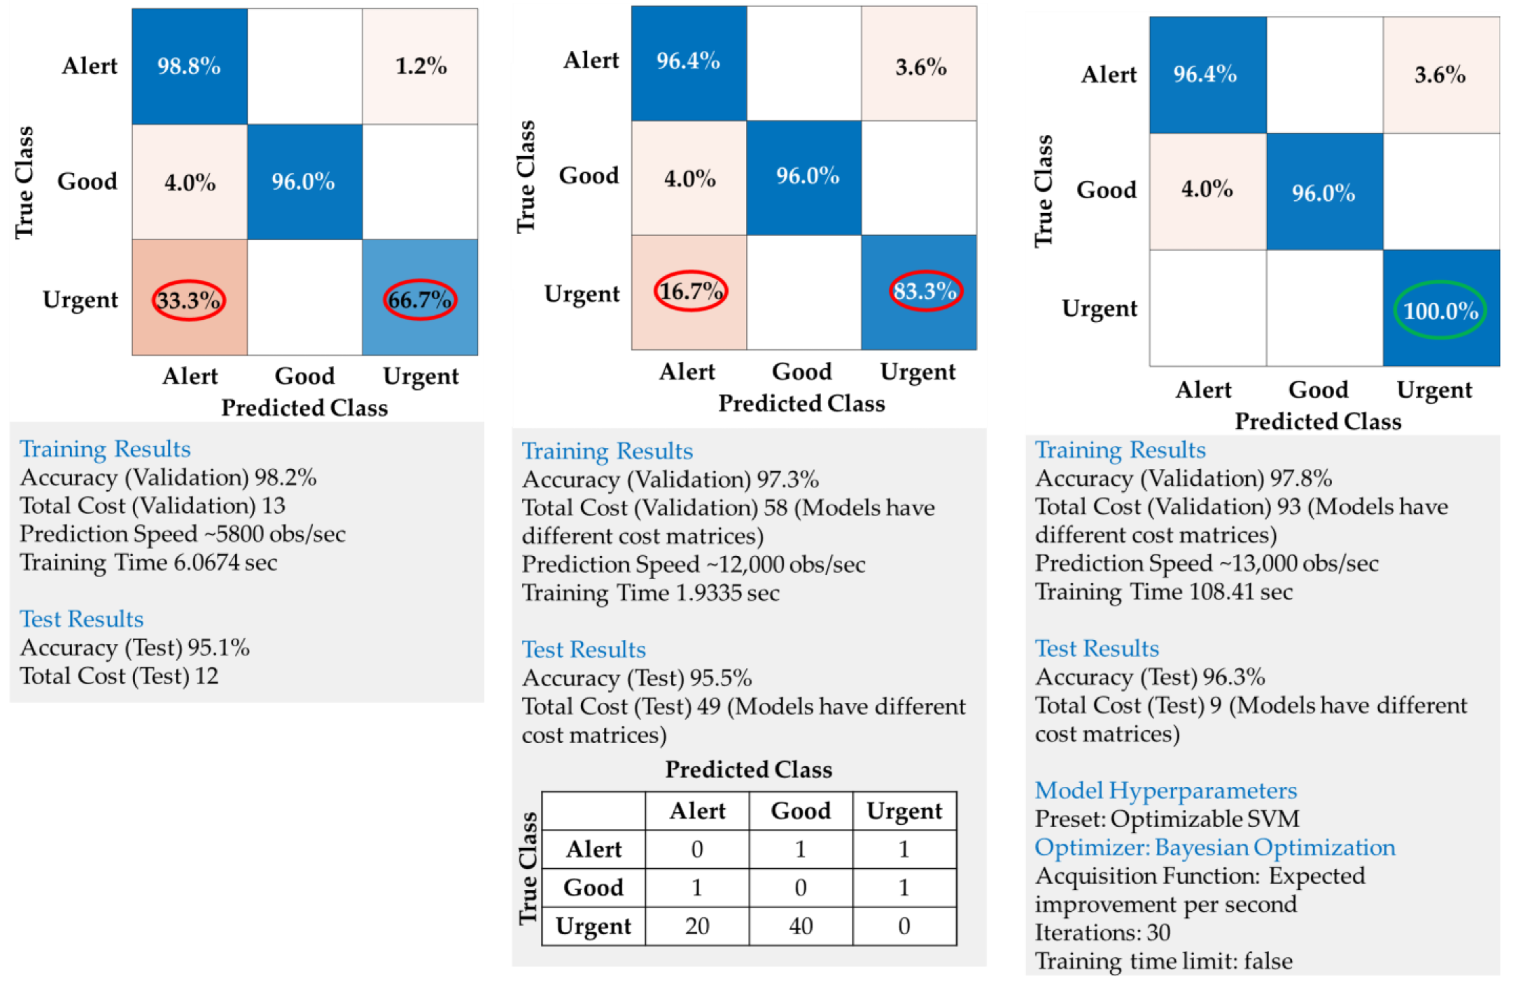
Hyperparameters can strongly affect the performance of ML algorithms. Instead of manually selecting hyperparameter options, the Classification Learner app automates this process by trying different combinations of hyperparameter values for a given ML model type. The goal of optimization is to find the set of hyperparameter values that minimize the classification error. The app offers three different optimization methods to perform hyperparameter tuning, and the Bayesian optimization method is used for this research. More specifically, in the left confusion matrix, the original testing results are illustrated; in the middle confusion matrix, the training results after the deployment of the cost matrix is presented; and in the right confusion matrix, the testing results after the deployment of the cost matrix and the fine tuning of hyperparameters are depicted. The optimizable hyperparameters of this ML model are the following: (i) Kernel function, (ii) Box constraint level, (iii) Kernel scale, (iv) Multiclass method, and (v) Standardize data.
Therefore, it can be observed that the goal of the PdM approach has been achieved. Concretely, the tested ML model correctly predicts (100%) “urgent” data and 96% and 96.4% of the time correctly predicts “good” and “alert” data, respectively. The classification of “urgent” data has been optimized, and the results for the classification for “good” and “alert” data are adequate.

6. Discussion and Results

The implementation of a PdM for the detection and classification of the critical component of a robotic cell was presented analytically. Key performance indicators (KPIs) will be presented to assess the performance of the previous implementation. The KPIs of the ML classification problems are accuracy, recall, precision, and F1 score. The statistical parameters that are used in the equations of the KPIs are the following: TP = True Positive, TN = True Negative, FP = False Positive, FN = False Negative, TPR = True Positive Rate, FNR = False Negative Rate, and PPV = Positive Predictive Values. The accuracy is a metric that represents the percentage of the correct observations of the algorithm, and it is calculated by the following equation:
Accuracy = Total   No . of   Correct   Observations Total   No . of   Observations = TP + TN TP + FP + TN + FN
It is stressed that accuracy is ineffective in the case of imbalanced datasets and by extension can lead to wrong data interpretation. On the other hand, the recall and precision metrics are mostly used when we are concerned more about predicting a specific class, and the F1 score is the harmonic mean of precision and recall. Recall basically tells us what percentage of all the points that are actually positive are correctly predicted as positive. Precision basically tells us what percentage of all points predicted to be positive by our model were actually positive, it represents a relation between them. In this research, the misclassification of “urgent” data will greatly affect the performance of the ML model and extend the performance of the bearing and the whole robotic cell. Thus, we are more concerned about the recall metric since we want data that are actually “urgent” to be predicted/classified correctly, i.e., as urgent data. The recall metric is estimated by the following equation:
Recall = TP TP + FN = TPR
In Table 4, the accuracy and recall metrics are presented in order to assess the results of ML.
The results demonstrate that the original testing results are satisfactory for the classifications of “good” and “alert” data, but they are not sufficient for “urgent” data. Therefore, the ML model requires further optimization of the hyperparameters. The optimization process has been performed in two levels. Firstly, by using the cost matrix, the correct classification of “urgent” data is regarded as the most important. Secondly, by fine tuning the hyperparameters, the recall metric has been further optimized until it reaches 100% for the classification of “urgent” data. After the two optimizations, it can be observed that the proposed methodology can improve the reliability of the robotic cell by successfully training an ML algorithm to classify the run to failure vibration data of its critical component. The most challenging tasks in a PdM approach are the selection of the features and ML models. Preprocessing and preparation of data are vital issues that are unique each time and depend on the available data and the application. The most time consuming step, accounting for 70–90% of the total PdM approach, is data preparation, but it is highly important as it has the greatest impact on the results. It has to be stressed that the generalization of methods is an important issue. Although the presented approach is focused on Comau SMART NJ-370-3.0 robots, the model can be altered so that it corresponds to other similar robotic manipulators. Regarding the training of the machine learning model, the applied method is adequately generalized, so that it can be followed for training other predictive models either for the same robotic arm (e.g., for other critical components such as electric motors) or for other robotic cells/manipulators. In any case, minor modifications are still required since there is no method that fits all systems.

7. Conclusions and Future Work

In this research work, the reliability of manufacturing systems and especially in the robotic domain was studied. The scope of companies is to ensure reliable components and processes that will offer reliable products to the customers replying to the increasing demands of society. Each process should be implemented considering the safety measures to protect human life and the quality of the equipment. Model based approaches such as the RBD and FTA can be considered initial and important methods for the reliability assessment of manufacturing systems. The type of connection between the several components that comprise the whole robotic system has a huge impact on the reliability of the system. Parallel connections are proposed for critical components in order to ensure that the breakdown of a component will not cause the overall breakdown of the robotic cell. A comprehensive FTA of the robotic cell was developed, and its limitations were discussed. For this reason, the interest is focused on digital technologies to improve the reliability and productivity of manufacturing systems. The DT along with PdM approaches are promising approaches for industries in order to simulate, control, and monitor their equipment, ensuring high reliability of their equipment.
For future work, it becomes apparent that the impact of the human factor on the reliability of manufacturing systems is an issue that should be further investigated. The core of the Industry 5.0 revolution will be the symbiosis and the coexistence of humans and machines, highlighting the importance of reliable communication and cooperation between them. This research work will be further elaborated in the future toward making the predictive maintenance approach online by integrating the digital twin. In this way, synchronous communication between the virtual model and the physical equipment will be feasible. Furthermore, as part of future research, the authors plan different configurations of robots, such as collaborative robotic arms and hybrid cells, which involve the coexistence of human operators within the cell. Regarding the experimentation with different failures, currently, we are in the process of collecting additional data from the robotic arms in order to expand the training of the predictive models to other components. More specifically, this process involves the execution of R2F (run to failure) experiments. With regard to data management, due to the vast amount of data produced daily, edge computing will be integrated in order to minimize the computational load on the cloud layer and fully utilize the inherent intelligence of the embedded systems at the shop-floor level.

Author Contributions

Conceptualization, D.M. and J.A.; investigation, S.T.; resources, S.T.; writing—review and editing, J.A.; supervision, D.M. All authors have read and agreed to the published version of the manuscript.

Funding

This research received no external funding.

Data Availability Statement

Not applicable.

Conflicts of Interest

The authors declare no conflict of interest.

References

  1. Ghodsian, N.; Benfriha, K.; Olabi, A.; Gopinath, V.; Arnou, A.; el Zant, C.; Charrier, Q.; el Helou, M. Toward designing an integration architecture for a mobile manipulator in production systems: Industry 4.0. Procedia CIRP 2022, 109, 443–448. [Google Scholar] [CrossRef]
  2. Mourtzis, D. Design and Operation of Production Networks for Mass Personalization in the Era of Cloud Technology; Elsevier: Amsterdam, The Netherlands, 2021; pp. 1–393. [Google Scholar] [CrossRef]
  3. Mourtzis, D.; Synodinos, G.; Angelopoulos, J.; Panopoulos, M. An augmented reality application for robotic cell customization. Procedia CIRP 2020, 90, 654–659. [Google Scholar] [CrossRef]
  4. Niku, S.B. Introduction to Robotics: Analysis, Control, Applications; John Wiley & Sons: Hoboken, NJ, USA, 2020. [Google Scholar]
  5. Kampa, A. The Review of Reliability Factors Related to Industrial Robo. Robot. Autom. Eng. J. 2018, 3, 624. [Google Scholar] [CrossRef]
  6. Fazlollahtabar, H.; Niaki, S.T.A. Reliability Models of Complex Systems for Robots and Automation; CRC Press: Boca Raton, FL, USA, 2017. [Google Scholar] [CrossRef]
  7. Mourtzis, D.; Tsoubou, S.; Angelopoulos, J. A conceptual framework for the improvement of robotic cell reliability through Industry 4.0. In Proceedings of the 32nd International Conference on Flexible Automation and Intelligent Manufacturing (FAIM 2023), Porto, Portugal, 18–22 June 2023. [Google Scholar]
  8. Lazarova-Molnar, S.; Mohamed, N. Reliability Assessment in the Context of Industry 4.0: Data as a Game Changer. Procedia Comput. Sci. 2019, 151, 691–698. [Google Scholar] [CrossRef]
  9. Friederich, J.; Lazarova-Molnar, S. Towards Data-Driven Reliability Modeling for Cyber-Physical Production Systems. Procedia Comput. Sci. 2021, 184, 589–596. [Google Scholar] [CrossRef]
  10. Deloitte. Predictive Maintenance. Taking Pro-Active Measures Based on Advanced Data Analytics to Predict and Avoid Machine Failure. Analytics Institute. 2017. Available online: https://www2.deloitte.com/content/dam/Deloitte/de/Documents/deloitte-analytics/Deloitte_Predictive-Maintenance_PositionPaper.pdf (accessed on 20 June 2020).
  11. Carvalho, T.P.; Soares, F.A.A.M.N.; Vita, R.; da Francisco, R.; Basto, J.P.; Alcalá, S.G.S. A systematic literature review of machine learning methods applied to predictive maintenance. Comput. Ind. Eng. 2019, 137, 106024. [Google Scholar] [CrossRef]
  12. Sullivan, G.; Pugh, R.; Melendez, A.P.; Hunt, W.D. Operations & Maintenance Best Practices—A Guide to Achieving Operational Efficiency; Pacific Northwest National Laboratory (PNNL): Richland, WA, USA, 2010. [Google Scholar]
  13. Achouch, M.; Dimitrova, M.; Ziane, K.; Sattarpanah Karganroudi, S.; Dhouib, R.; Ibrahim, H.; Adda, M. On Predictive Maintenance in Industry 4.0: Overview, Models, and Challenges. Appl. Sci. 2022, 12, 8081. [Google Scholar] [CrossRef]
  14. Bi, Z.M.; Miao, Z.; Zhang, B.; Zhang, C.W.J. The state of the art of testing standards for integrated robotic systems. Robot. Comput. Integr. Manuf. 2020, 63, 101893. [Google Scholar] [CrossRef]
  15. Garcia, E.; Jimenez, M.A.; De Santos, P.G.; Armada, M. The evolution of robotics research. IEEE Robot. Autom. Mag. 2007, 14, 90–103. [Google Scholar] [CrossRef]
  16. Ma, Y. Design of flexible maintenance robot based on Gas Insulated Substation. J. Phys. Conf. Ser. 2021, 1865, 022052. [Google Scholar] [CrossRef]
  17. De Luca, A.; Book, W.J. Robots with Flexible Elements. In Springer Handbook of Robotics; Siciliano, B., Khatib, O., Eds.; Springer: Cham, Switzerland, 2016. [Google Scholar] [CrossRef]
  18. Wei, X.; Ye, J.; Xu, J.; Tang, Z. Adaptive Dynamic Programming-Based Cross-Scale Control of a Hydraulic-Driven Flexible Robotic Manipulator. Appl. Sci. 2023, 13, 2890. [Google Scholar] [CrossRef]
  19. Gao, Z.; Wanyama, T.; Singh, I.; Gadhrri, A.; Schmidt, R. From Industry 4.0 to Robotics 4.0—A Conceptual Framework for Collaborative and Intelligent Robotic Systems. Procedia Manuf. 2020, 46, 591–599. [Google Scholar] [CrossRef]
  20. Frisk, J. Robot Development towards Flexibility—The Four Robot Revolutions—OpiFlex. 2020. Available online: https://www.opiflex.se/en/publicity/four-robot-revolutions-flexible-robots/ (accessed on 20 October 2022).
  21. Liu, Y.; Wang, L.; Makris, S.; Krüger, J. Smart robotics for manufacturing. Robot. Comput. Integr. Manuf. 2023, 2023, 102535. [Google Scholar] [CrossRef]
  22. Marina, K. Reliability Management of Manufacturing Processes in Machinery Enterprises; Tallin University of Technology: Tallin, Estonia, 2012; Available online: https://digikogu.taltech.ee/en/Item/e17f1928-f8e7-4a2e-81ab-585bd19ccef4 (accessed on 20 October 2022).
  23. Chryssolouris, G. Manufacturing Systems: Theory and Practice; Springer Science & Business Media: Cham, Switzerland, 2019. [Google Scholar]
  24. Kumar, S.; Singh, R. Rank order clustering and imperialist competitive optimization based cost and RAM analysis on different industrial sectors. J. Manuf. Syst. 2020, 56, 514–524. [Google Scholar] [CrossRef]
  25. Gu, X. The impact of maintainability on the manufacturing system architecture. Int. J. Prod. Res. 2017, 55, 4392–4410. [Google Scholar] [CrossRef]
  26. Birolini, A. Reliability Engineering; Springer: Berlin/Heidelberg, Germany, 2017. [Google Scholar] [CrossRef]
  27. Lazarova-Molnar, S.; Mohamed, N.; Shaker, H.R. Reliability modeling of cyber-physical systems: A holistic overview and challenges. In Proceedings of the 2017 Workshop on Modeling and Simulation of Cyber-Physical Energy Systems (MSCPES), Pittsburgh, PA, USA, 21 April 2017; pp. 1–6. [Google Scholar] [CrossRef]
  28. Bai, B.; Xie, C.; Liu, X.; Li, W.; Zhong, W. Application of integrated factor evaluation–analytic hierarchy process–T-S fuzzy fault tree analysis in reliability allocation of industrial robot systems. Appl. Soft. Comput. 2022, 115, 108248. [Google Scholar] [CrossRef]
  29. Michał, G. Industrial Robots and Cobots: Everything You Need to Know about Your Future Co-Worker; INKPAD: Carmel, IN, USA, 2018. [Google Scholar]
  30. Sharma, S.P.; Sukavanam, N.; Kumar, N.; Kumar, A. Reliability analysis of complex robotic system using Petri nets and fuzzy lambda-tau methodology. Eng. Comput. 2010, 27, 354–364. [Google Scholar] [CrossRef]
  31. Kumar, N.; Borm, J.-H.; Kumar, A. Reliability analysis of waste clean-up manipulator using genetic algorithms and fuzzy methodology. Comput. Oper. Res. 2012, 39, 310–319. [Google Scholar] [CrossRef]
  32. Khodabandehloo, K. Analyses of robot systems using fault and event trees: Case studies. Reliab. Eng. Syst. Saf. 1996, 53, 247–264. [Google Scholar] [CrossRef]
  33. Catelani, M.; Ciani, L.; Venzi, M. Sensitivity analysis with MC simulation for the failure rate evaluation and reliability assessment. Measurement 2015, 74, 150–158. [Google Scholar] [CrossRef]
  34. Stavropoulos, P.; Mourtzis, D. Digital twins in Industry 4.0. In Design and Operation of Production Networks for Mass Personalization in the Era of Cloud Technology; Elsevier: Amsterdam, The Netherlands, 2022; pp. 277–316. [Google Scholar] [CrossRef]
  35. Kritzinger, W.; Karner, M.; Traar, G.; Henjes, J.; Sihn, W. Digital Twin in manufacturing: A categorical literature review and classification. IFAC Pap. 2018, 51, 1016–1022. [Google Scholar] [CrossRef]
  36. Negri, E.; Fumagalli, L.; Macchi, M. A Review of the Roles of Digital Twin in CPS-based Production Systems. Procedia Manuf. 2017, 11, 939–948. [Google Scholar] [CrossRef]
  37. Saracco, R. Digital twins: Bridging physical space and cyberspace. Computer 2019, 52, 58–64. [Google Scholar] [CrossRef]
  38. Mourtzis, D. Simulation in the design and operation of manufacturing systems: State of the art and new trends. Int. J. Prod. Res. 2020, 58, 1927–1949. [Google Scholar] [CrossRef]
  39. Phanden, R.K.; Sharma, P.; Dubey, A. A review on simulation in digital twin for aerospace, manufacturing and robotics. Mater. Today Proc. 2021, 38, 174–178. [Google Scholar] [CrossRef]
  40. Mourtzis, D.; Vlachou, E.; Milas, N.; Xanthopoulos, N. A cloud-based approach for maintenance of machine tools and equipment based on shop-floor monitoring. Procedia CIRP 2022, 41, 655–660. [Google Scholar] [CrossRef]
  41. Wang, J.; Gao, R.X. Innovative smart scheduling and predictive maintenance techniques. In Design and Operation of Production Networks for Mass Personalization in the Era of Cloud Technology; Elsevier: Amsterdam, The Netherlands, 2022; pp. 181–207. [Google Scholar] [CrossRef]
  42. Wang, Y.; Zhao, Y.; Addepalli, S. Remaining Useful Life Prediction using Deep Learning Approaches: A Review. Procedia Manuf. 2020, 49, 81–88. [Google Scholar] [CrossRef]
  43. Saidi, L.; ben Ali, J.; Bechhoefer, E.; Benbouzid, M. Wind turbine high-speed shaft bearings health prognosis through a spectral Kurtosis-derived indices and SVR. Appl. Acoust. 2017, 120, 1–8. [Google Scholar] [CrossRef]
  44. Brownlee, J. How to choose a feature selection method for machine learning. Mach. Learn. Mastery 2019, 10. [Google Scholar]
  45. Kabir, S. An overview of fault tree analysis and its application in model based dependability analysis. Expert Syst. Appl. 2017, 77, 114–135. [Google Scholar] [CrossRef]
  46. Yang, C.; Ma, J.; Wang, X.; Li, X.; Li, Z.; Luo, T. A novel based-performance degradation indicator RUL prediction model and its application in rolling bearing. ISA Trans. 2022, 121, 349–364. [Google Scholar] [CrossRef] [PubMed]
  47. Lessmeier, C.; Kimotho, J.K.; Zimmer, D.; Sextro, W. Condition monitoring of bearing damage in electromechanical drive systems by using motor current signals of electric motors: A benchmark data set for data-driven classification. In Proceedings of the PHM Society European Conference, Bilbao, Spain, 5–8 July 2016; Volume 3. [Google Scholar]
  48. Toma, R.N.; Prosvirin, A.E.; Kim, J.M. Bearing fault diagnosis of induction motors using a genetic algorithm and machine learning classifiers. Sensors 2020, 20, 1884. [Google Scholar] [CrossRef]
  49. Community Download|SOLIDWORKS. Available online: https://www.solidworks.com/support/community-download#no-back (accessed on 8 April 2023).
  50. Xu, J.; Zhang, Y.; Miao, D. Three-way confusion matrix for classification: A measure driven view. Inf. Sci. 2020, 507, 772–794. [Google Scholar] [CrossRef]
  51. Gutzwiller, K.J.; Chaudhary, A. Machine-learning models, cost matrices, and conservation-based reduction of selected landscape classification errors. Landsc. Ecol. 2020, 35, 249–255. [Google Scholar] [CrossRef]
Figure 1. Digital twin services (developed by the authors).
Electronics 12 01999 g001
Figure 2. Robotic evolutions from 1960 up to today and key milestones (developed by the authors).
Electronics 12 01999 g002
Figure 3. The evolution of reliability assessment in Industry 4.0 era (developed by the authors).
Electronics 12 01999 g003
Figure 4. Hardware, software, and human: factors that affect the overall reliability of manufacturing systems (developed by the authors).
Electronics 12 01999 g004
Figure 5. The evolution of industrial maintenance strategies (developed by the authors).
Electronics 12 01999 g005
Figure 6. The predictive maintenance framework in Industry 4.0 era (developed by the authors).
Electronics 12 01999 g006
Figure 7. General system architecture (developed by the authors).
Electronics 12 01999 g007
Figure 8. FMEA steps to calculate the risk priority number (developed by the authors).
Electronics 12 01999 g008
Figure 9. Flowchart for the detection and classification of components’ faulty behavior (developed by the authors).
Electronics 12 01999 g009
Figure 10. Discretization of the spot-welding robotic cell (developed by the authors).
Electronics 12 01999 g010
Figure 11. The FTA of the robotic cell along with the modeling equations (developed by the authors).
Electronics 12 01999 g011
Figure 12. Fault tree analysis: (a) stepper motor; (b) end effector (developed by the authors).
Electronics 12 01999 g012
Figure 13. Simscape Multibody block diagram of the robotic cell (developed by the authors).
Electronics 12 01999 g013
Figure 14. The plot of the vibration signal and the determination of edges for the data classification (developed by the authors).
Electronics 12 01999 g014
Figure 15. The confusion matrix of the Medium Gaussian SVM ML model (developed by the authors).
Electronics 12 01999 g015
Figure 16. The retrained SVM model side by side with the unmodified SVM (developed by the authors).
Electronics 12 01999 g016
Figure 17. The testing results (developed by the authors).
Electronics 12 01999 g017
Table 1. Failure rates of robotic components in the literature.
ComponentsFailure Rate λ (Failure/hour)References
Teach Pendant 4.72 × 10 5 [28]
Controller 3.79 × 10 5 [28]
Robotic Manipulator 1.56 × 10 5 [28]
Wiring Loom 3 × 10 7 [29]
Motor 1.85 × 10 5 [30]
1.88 × 10 3 [31]
5.01 × 10 5 [28]
2 × 10 6 [32]
Sensor 2.35 × 10 5 [30]
2.41 × 10 3 [33]
3.42 × 10 6 [33]
1.54 × 10 6 [33]
1.76 × 10 6 [33]
Break 4.3 × 10 6 [32]
End Effector 114 × 10 6 [32]
Table 2. The available time domain and frequency domain features.
Time-Domain FeaturesFrequency-Domain Features
Clearance FactorBand Power
Crest FactorPeak Frequency 1
Impulse FactorPeak Frequency 2
KurtosisPeak Frequency 3
MeanPeak Frequency 4
Peak ValuePeak Amplitude 1
RMS (Root Mean Square)Peak Amplitude 2
Shape FactorPeak Amplitude 3
SINADPeak Amplitude 4
Skewness
SNR (Signal to Noise Ratio)
Std (Standard Deviation)
THD (Total Harmonic Distortion)
Table 3. The ranking process by one way ANOVA method.
FeatureOne Way ANOVA
dataBearing1_sigstats/SNR1.1044 × 10³
dataBearing1_sigstats/SINAD1.1688 × 10³
dataBearing1_sigstats/RMS923.7303
dataBearing1_sigstats/Std922.8557
dataBearing1_ps_spec/PeakFreq1712.9482
dataBearing1_sigstats/ShapeFactor594.9398
dataBearing1_ps_spec/BandPower396.9077
dataBearing1_ps_spec/PeakFreq3300.9521
dataBearing1_ps_spec/PeakAmp4491.0052
dataBearing1_ps_spec/PeakFreq2259.8081
dataBearing1_sigstats/PeakValue505.3358
dataBearing1_ps_spec/PeakAmp3508.8478
dataBearing1_sigstats/Mean3.8805
dataBearing1_sigstats/Kurtosis254.5327
dataBearing1_sigstats/THD74.7677
dataBearing1_sigstats/CrestFactor1.7973
dataBearing1_sigstats/Skewness226.9765
dataBearing1_ps_spec/PeakAmp1500.8816
dataBearing1_ps_spec/PeakAmp2511.1558
dataBearing1_sigstats/ImpulseFactor21.0406
dataBearing1_ps_spec/PeakFreq4102.6391
dataBearing1_sigstats/Clearance49.9918
Table 4. ML model training and testing results.
Original
Training
Original
Testing
1st Optimization Training
(Cost Matrix)
Testing after 1st Optimization2nd Optimization Training
(Hyperpar.)
Testing after 2nd Optimization
Accuracy98.24%95.1%97.3%95.5%97.8%96.3%
RecallTPRFNRTPRFNRTPRFNRTPRFNRTPRFNRTPRFNR
“Good” data99%1%96%4%98.6%1.4%96%4%98.8%1.2%96%4%
“Alert” data98%2%98.8%1.2%94.6%5.4%96.4%3.6%96.6%3.4%96.4%3.6%
“Urgent” data85.2%14.8%58.3%41.7%92.6%7.4%83.3%16.7%88.9%11.1%100%0%
Disclaimer/Publisher’s Note: The statements, opinions and data contained in all publications are solely those of the individual author(s) and contributor(s) and not of MDPI and/or the editor(s). MDPI and/or the editor(s) disclaim responsibility for any injury to people or property resulting from any ideas, methods, instructions or products referred to in the content.

