1. Introduction
Artificial intelligence and machine learning are being used for various agricultural operations, such as detecting diseases, soil monitoring, weed control, insect recognition, crop evaluation using drones and machine vision, and weather prediction. Agriculture is the world’s largest business, contributing 18% of the GDP [
1]. Agriculture is the primary source of income for a sizeable portion of the world. Therefore, crop productivity is important in the world.
Corn is a widely grown crop. Corn agriculture plays an important role because of its export potential and the fact that it supplies a lot of farmers with food. Several businesses use corn, including the food and beverage, poultry, and animal feed industries. Its productivity is more than that of wheat and rice put together, and it is a staple food in numerous regions worldwide. However, Saudi Arabia’s grain yields are less than half the world’s average. The fact that corn is prone to several illnesses, and its considerably lower crop output overall, is one factor in the low corn yield. Here are some of the most prevalent corn diseases:
Gray Leaf Spot: This disease is caused by the fungus Cercospora zeae-maydis and results in small, grayish lesions on leaves that can coalesce and lead to leaf blight. Gray leaf spots can reduce yield if left unchecked.
Northern Corn Leaf Blight: This disease, caused by the fungus Exserohilum turcicum, results in cigar-shaped leaf lesions and can cause leaf blight. Severe infections can reduce yield and quality.
Southern Corn Leaf Blight: Also caused by a fungus, this disease (Cochliobolus heterostrophus) causes elliptical lesions on leaves that can expand and merge. It can also cause ear rot and a reduction in yield.
Fusarium Ear Rot: This disease is caused by the fungus Fusarium verticillioides and can cause a range of symptoms, including ear rot and reduced yield. It can also produce mycotoxins, harming humans and livestock if ingested.
Goss’s Wilt: This bacterial disease (Clavibacter michiganensis subsp. nebraskensis) causes “freckles” on leaves and a characteristic “water-soaked” appearance. Severe infections can lead to blight and yield loss.
Existing methods for disease detection include visual inspection, DNA-based tests (such as PCR), and hyperspectral imaging. While these methods can be effective, they each have their limitations. Visual inspection can be time-consuming and subjective, DNA-based tests can be expensive and require specialised equipment, and lighting conditions can limit hyperspectral imaging.
One approach gaining traction is using machine learning algorithms to automatically analyse images of crops and detect disease symptoms. By training these algorithms on large datasets of images, researchers can develop highly accurate tools for detecting diseases in the field. This approach can potentially be faster, more objective, and more scalable than traditional disease detection methods. However, it also requires high-quality image data and careful calibration to ensure accurate results.
In addition to diminishing crop productivity and nutritional quality, some leaf infections remain an issue for agricultural production. Common leaf ailments include leaf rust, grey leaf spot, and leaf blight. Many leaf diseases may look remarkably similar in their early stages, making it challenging to identify them visually. A team of experts and ongoing crop monitoring are required to observe leaf diseases visually [
2]. It is, therefore, exceedingly costly, time-consuming, and unreliable. Detecting and categorising leaf diseases can be performed automatically, quickly, and accurately using deep learning algorithms. Researchers have developed a model predicting whether corn plants will develop leaf diseases.
Plant leaf disease detection is an active area of research, and various methods have been proposed to address this problem; we take a closer look at some of this research in the following section. Inception, VGG16, Resnet50, Resnet101, Resnet152, and Densenet 121 are some of the most widely used deep learning architectures for plant leaf disease detection. Inception is a deep convolutional neural network architecture that uses inception modules to improve the model’s performance. VGG16 is another deep learning architecture that uses a 16-layer convolutional neural network to classify images. Resnet50, Resnet101, and Resnet152 are residual networks that use skip connections to address the vanishing gradient problem in deep neural networks. Densenet 121 is a densely connected convolutional neural network that connects each layer to every other layer in a feed-forward fashion.
Despite the effectiveness of these methods, there is a need for new approaches that can improve the accuracy and efficiency of plant leaf disease detection. This is where the new approach using EfficientNet B0 comes in. EfficientNet B0 is a novel neural network architecture that has achieved state-of-the-art performance on various image classification tasks while being computationally efficient. It uses efficient scaling and compound coefficient optimisation techniques to achieve high accuracy while maintaining a small model size and low computational cost.
Compared to the existing methods, EfficientNet B0 offers a more efficient and accurate solution for plant leaf disease detection, which is essential in developing effective agricultural solutions. Its efficiency in processing large amounts of data and classifying them accurately can help in the early detection and prevention of plant diseases, ultimately leading to increased crop yield and economic growth in the agricultural sector.
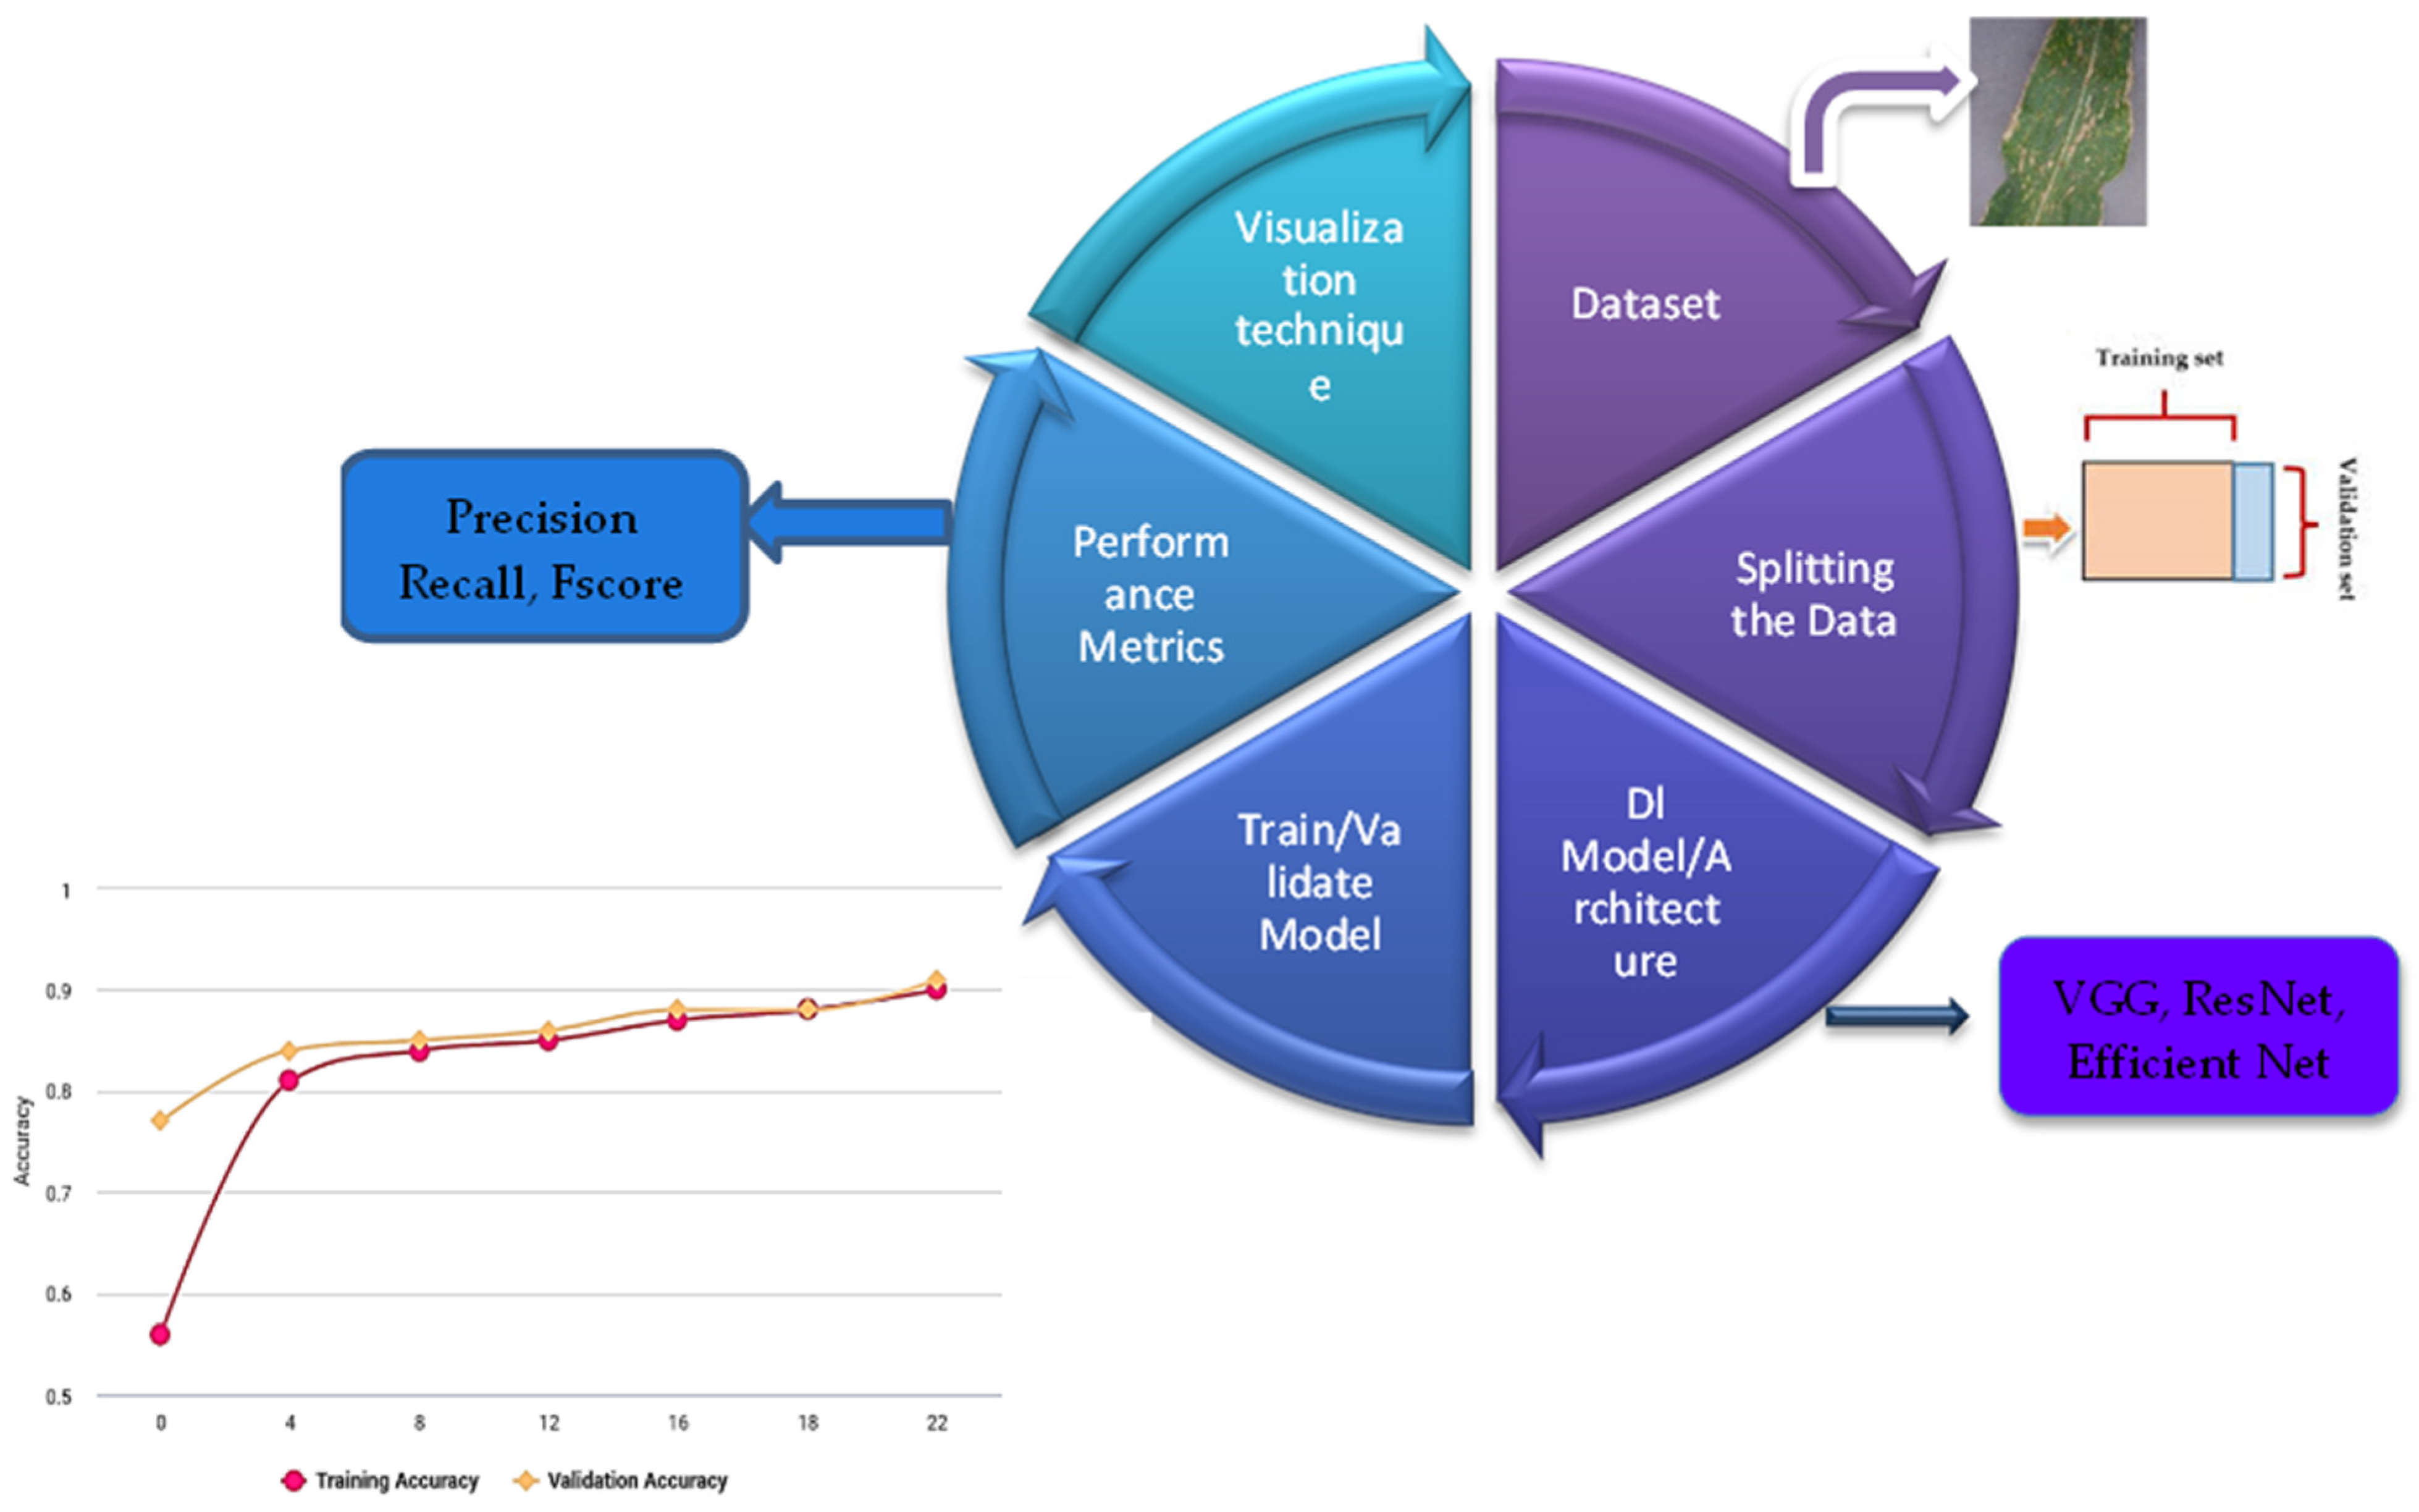
This study proposes an architecture for deep learning to classify plant diseases based on EfficientNet [
3]. Several state-of-the-art CNN structures are compared with the proposed model, including Inception V3, VGG16, Resnet50, Resnet101, and Resnet152 as shown in
Figure 1.
Key Highlights
The study highlights several key contributions to developing an efficient deep-learning model for identifying leaf images in corn plants. First, the study suggests using the EfficientNet structure as a suitable approach for this task. Secondly, the study employs two datasets, PlantVillage and PlantDoc, to train and validate the model. Thirdly, the study compares the performance of the proposed model against other state-of-the-art deep learning techniques, including Inception V3, VGG16, Resnet50, Resnet101, Resnet152, and Densnet121. Fourthly, transfer learning is implemented to train every single model component. Lastly, the study demonstrates that the efficiency of the EfficientNet network is higher than those of the other deep learning methods tested. Overall, the study presents an effective and efficient deep-learning model for identifying leaf images in corn plants, with potential applications in improving crop management and reducing the use of pesticides.
2. Literature Review
Zhang et al. [
4] suggested a new SVM utilising a genetics approach (GA-SVM). Six different types of illnesses affecting corn leaves were acquired by the researchers and classified. The following steps were taken to classify the diseases: JPEG images were converted to BMP format for image processing. To obtain different qualities, the images were also changed from RGB to HSI designs (with average and standard changes of R, G, and B and shape features such as area, circumference, circularity, height, and width). The creation of binary images was then accomplished by division. Lastly, the orthogonal rotation method was employed to find the right genetic optimisation algorithms. Twenty feature values were input into the model. Four kernels were used to evaluate the classification performance of SVM and GA-SVM. After contrasting the two techniques’ performances, the researcher concluded that GA-SVM had a greater classification result (within 88.72% and 92.59% for GA-SVM and between 69.63% and 90.09% for SVM).
Alehegn [
5] classified three distinct forms of corn leaf diseases in plants using the KNN (K-nearest neighbour) and ANN (Artificial Neural Network) approaches of identification (usual rust, leaf blight, and leaf spot). In Ethiopian farming areas, pictures of both healthy and sick corn leaves were taken. For training and testing, at least 800 images were taken into consideration. Textured, morphological, and colour characteristics were extracted from the images. The KNN and ANN classification models each received 22 variables in total. With an accuracy percentage of 94.4% versus 82.5%, the researcher concluded that ANN outperformed KNN.
Zhang et al. [
6] upgraded GoogLeNet, and Cifar 10 algorithms were offered for the identification of eight corn plant pathogens (southern leaf blight, brown spot, rust, round spot, dwarf mosaic, curvularia leaf spot, grey leaf spot, northern leaf blight). Five hundred images were gathered for nine distinct types (8 classes of diseased corn leaves and one for healthy leaves). The classification process was used to incorporate the images. Compared to the VGG and Alexnet frameworks, the suggested GoogLeNet topology has 22 levels and attributes. ReLU was used, and more tiers were added to enhance the Cifar 10 designs. The dataset of corn leaves was used to assess the models’ efficiency.
Kanaka Durga and Anuradha [
7] utilised SVM and ANN algorithms to categorise leaf diseases in tomato and corn plants. The dataset contained 200 images of healthy and sick leaves, including those with tomato mosaic virus, common rust, bacterial spot, and northern leaf blight. They employed the subsequent procedures to determine the diseases: The RGB image was transformed into grayscale, and then the image was divided by figuring out the intensity gradient at each pixel. HOG was the method used for extracting the features (histogram of oriented gradients). The SVM and ANN classifier models received the characteristics that were extracted. SVM provided a 55–65% precision for the corn crop compared to ANN.
To discriminate between diseases that appear to be identical, Bhatt et al. [
8] employed CNN architectures to construct a system for diagnosing corn leaf diseases. This framework incorporates decision-tree-based classifiers and adaptable enhancing techniques. The four visual data categories were frequent rust, regular leaf, leaf blight, and leaf spot. Each class’s images were from the PlantVillage collection. The images were scaled according to the CNN model’s requirements for image processing techniques. The CNN models provided the classifiers with characteristics. It was shown that inception-v2 offered the maximum degree of accuracy for randomised woodlands. The authors acknowledged that it was challenging to distinguish between the leaf blight and leaf spot classifications depending on the extracted features of each categorisation.
Chen et al. [
9] proposed a lightweight network architecture called MobInc-Net for performing crop disease recognition and detection. The proposed architecture enhances the Inception module by replacing the original convolutions with depth-wise and point-wise convolutions. The modified Inception (M-Inception) module is paired with a pre-trained MobileNet to extract high-quality image features. A completely linked Softmax layer is added with the actual number of categories, followed by an SSD block, to classify and detect crop disease types. This architecture seems to be designed specifically for crop disease recognition and detection, and lightweight modules may make it suitable for deployment on resource-constrained devices.
Alatawi et al. [
10] presented a convolutional neural network VGG-16 model to detect plant diseases, allowing farmers to take timely actions regarding treatment without further delay. To carry this out, 19 different classes of plant diseases were chosen, where 15,915 plant leaf images (both diseased and healthy leaves) were acquired from the Plant Village dataset for training and testing.
Mukti et al. [
11] discussed a Transfer-Learning-based CNN model for the identification of plant diseases precisely. Our dataset consists of 70,295 training images and 17,572 validation images holding 38 different plant leaf images. They focused mainly on the ResNet50 network, a popular CNN architecture, as the pre-trained model in Transfer Learning.
Wu et al. [
12] proposed an improved model based on ResNet101 to identify woody fruit plant leaf diseases. The leaf disease dataset of six kinds of fruits was divided into 25 categories based on species, disease type, and severity. The authors used a global average pooling layer to reduce model training parameters and employed layer normalisation, dropout, and L2 regularisation to prevent model overfitting. They also incorporated the Squeeze-and-Excitation Network (SENet) attention mechanism to enhance the model’s feature extraction ability. Transfer learning was utilised to reduce training time and parameters. Experimental results revealed that the proposed model achieved an overall accuracy of 85.90% in recognising woody fruit plant leaf diseases, which is 1.20% higher than the classic ResNet network, while the number of model parameters was reduced by 98.14%. The authors concluded that their proposed model provides a better solution for identifying leaf diseases of woody fruit plants and has a higher accuracy rate. The study demonstrates the effectiveness of incorporating advanced techniques such as SENet attention and transfer learning to improve the accuracy and efficiency of plant disease detection models.
Swaminathan et al. [
13] proposed using a pre-trained neural network model, specifically Densenet-121, which was imported from the Keras library for training. They explained the application of convolution as a simple filter application that leads to activation and a feature map indicating the location and strength of detected features in an input image. The authors employed 35,779 images from the Huges DP Plant-Village dataset available on Kaggle to train the model to classify 29 different diseases for seven plants: potato, tomato, corn, bell pepper, grape, apple, and cherry. The Densenet-121 model achieved an impressive accuracy rate of 97.2% in detecting plant diseases, providing an efficient solution to address issues related to low crop yield and reduced crop quality caused by plant diseases. The authors highlighted the significance of their study in agriculture, emphasising the importance of using advanced technological tools to improve the agricultural sector and ensure food security.
Table 1 summarises the state-of-the-art works in plant leaf disease identification.
3. Methodology
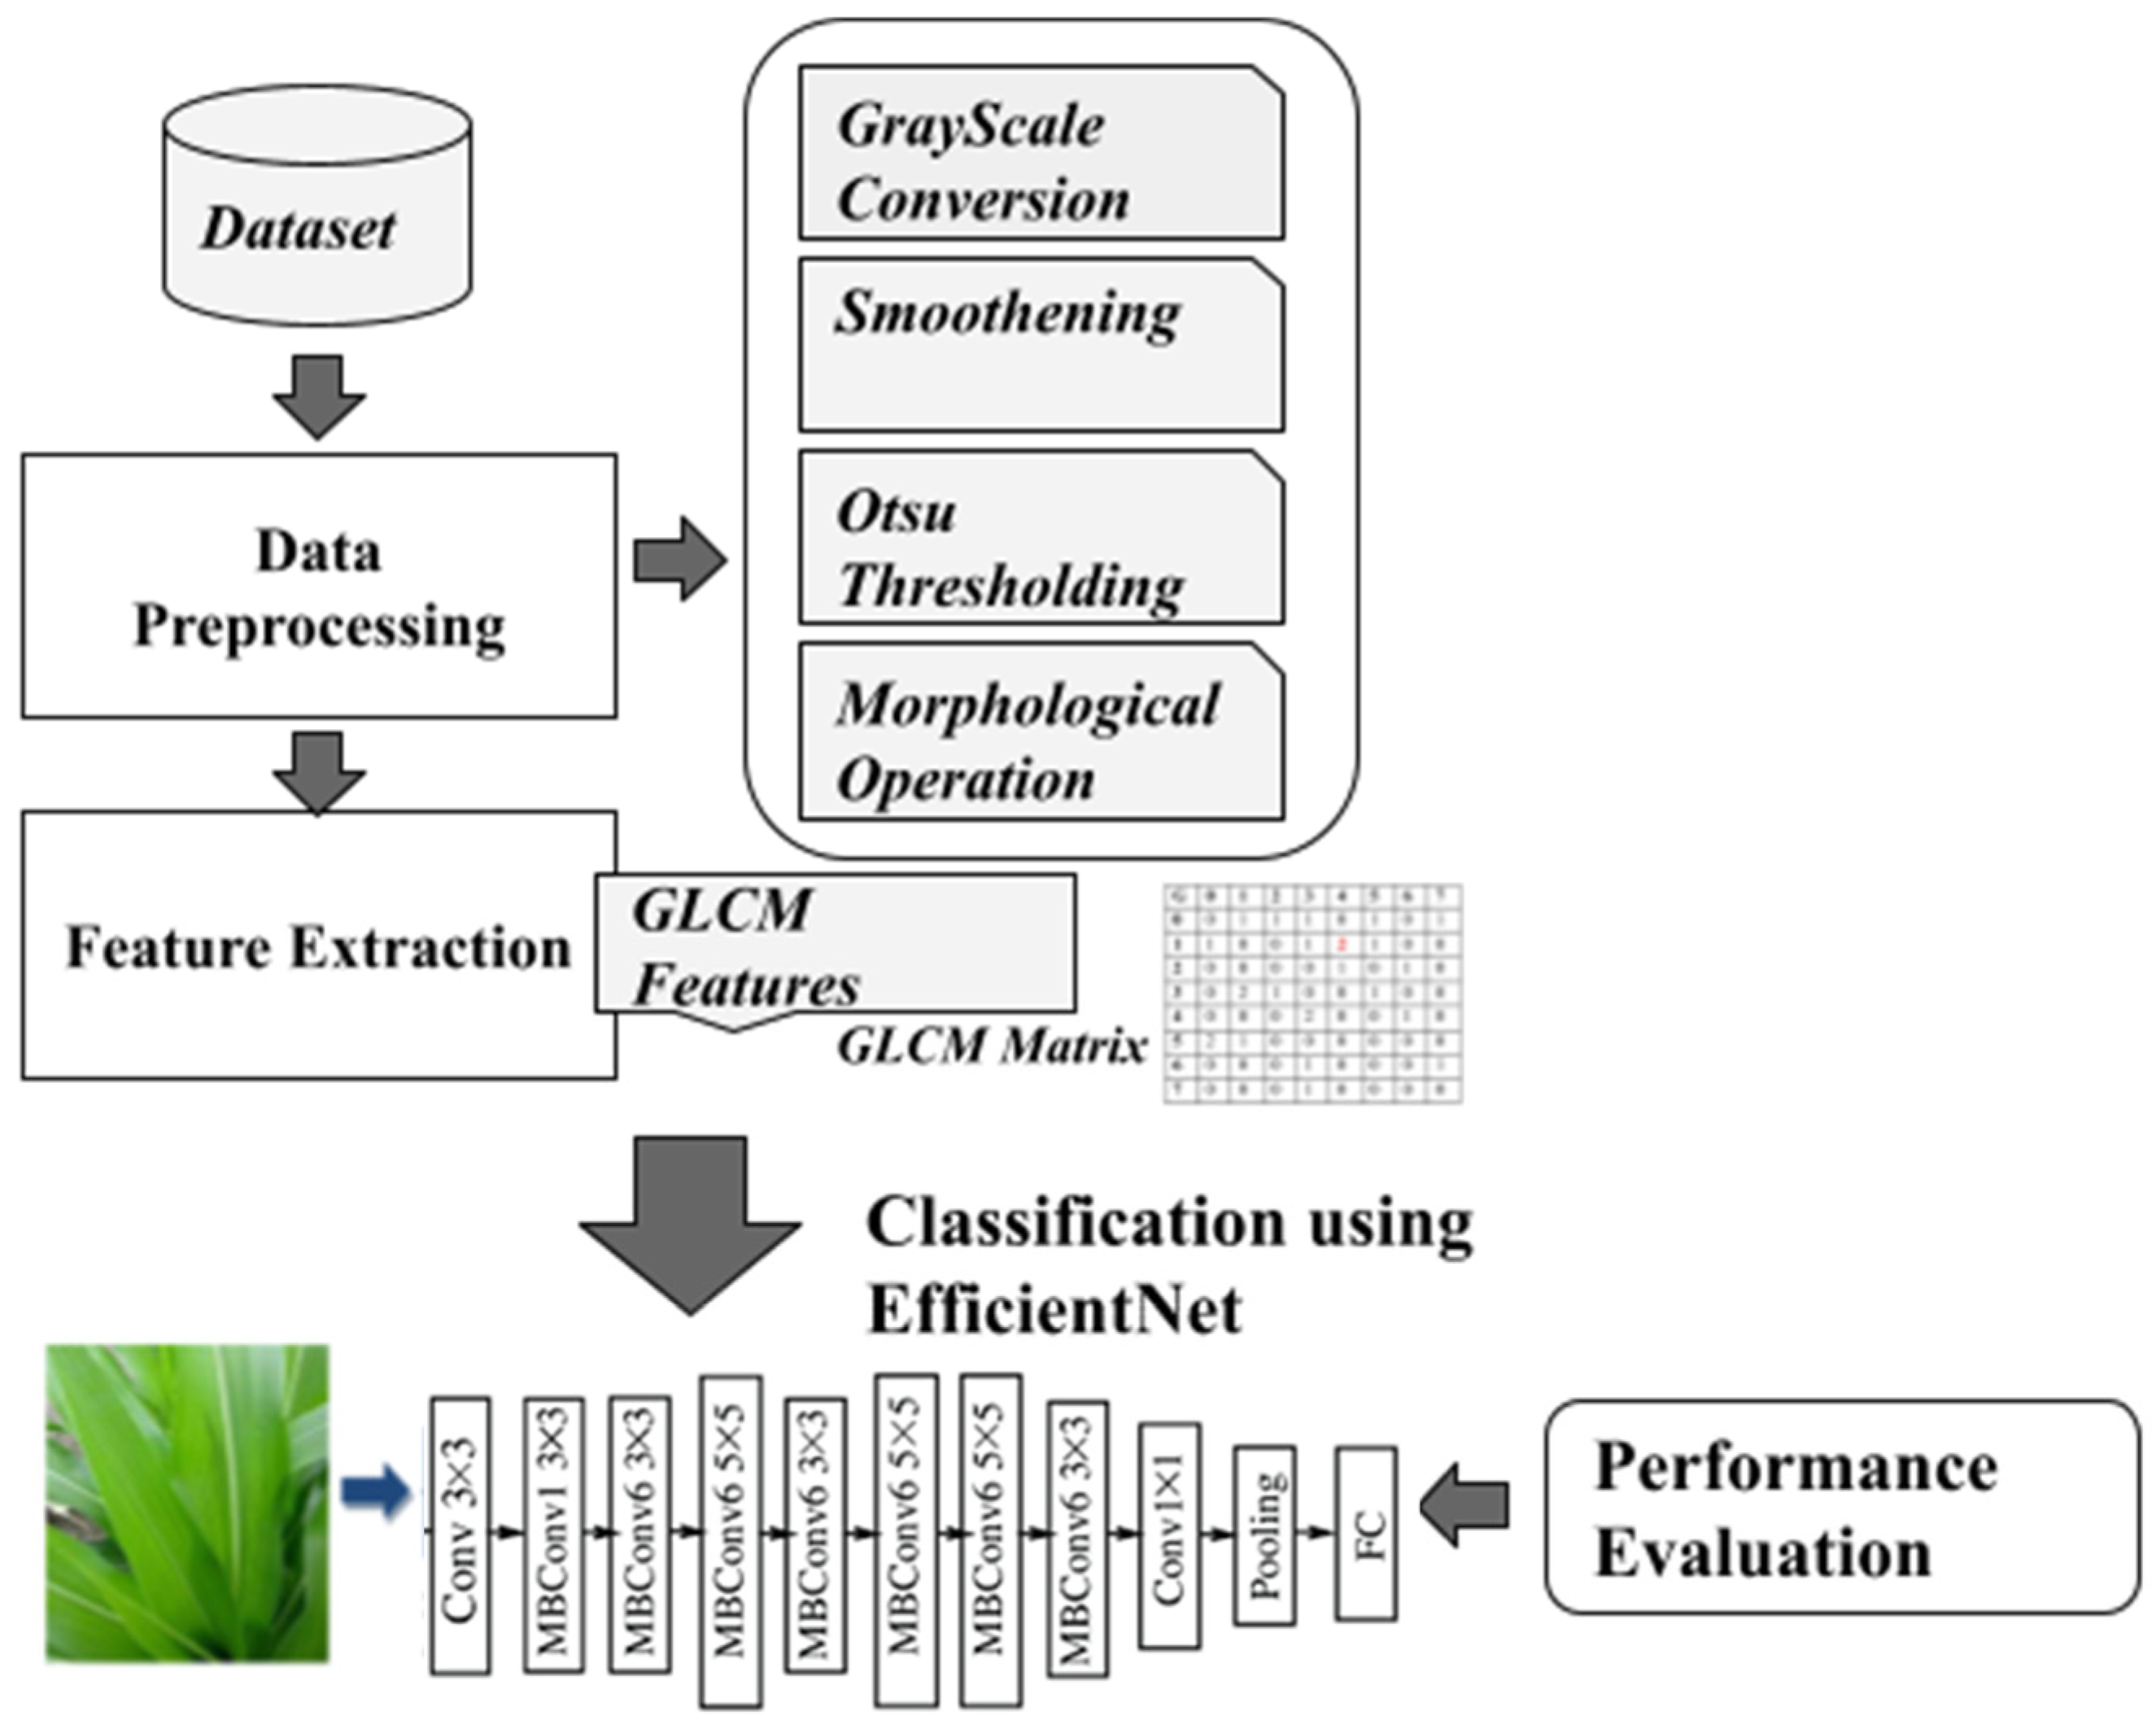
The methods employed in the current investigation are described in this section. The suggested method for identifying corn plant diseases is shown in
Figure 2. An input image from the PlantVillage and PlantDoc dataset is preprocessed using greyscale conversion, Otsu thresholding, and other morphological operations such as smoothing. The preprocessed image is augmented, and the features are extracted using the GLCM feature extraction method. The extracted feature trains the EfficientNet for better classification accuracy. Moreover, EfficientNet helps us to reduce the parameter size and FLOPS by an order of magnitude, thereby providing better precision. Our proposed method is validated by comparing it with other deep learning methods such as VGG and Resnet. The flow diagram is displayed in
Figure 2.
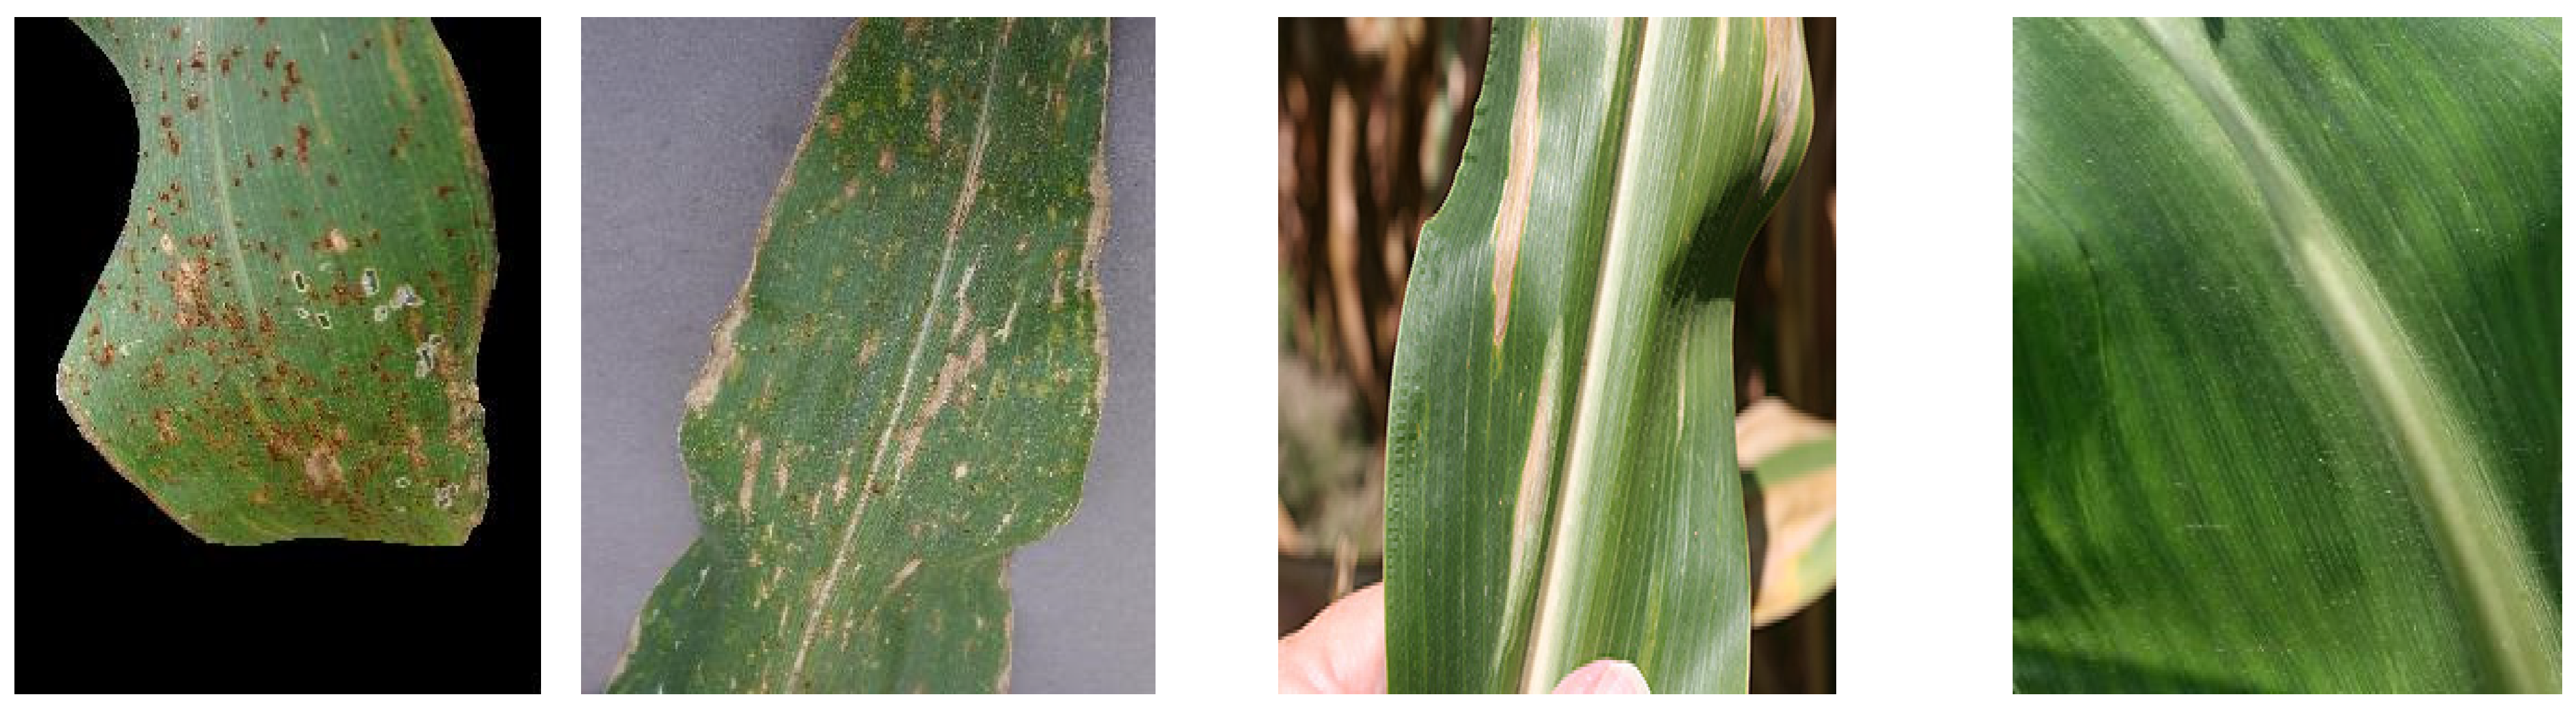
3.1. Dataset
In this investigation, the empirical information is obtained from the well-known PlantVillage and PlantDoc databases [
14,
15], which include 1306 Common Rust images, 574 Gray Leaf Spot images, 1146 Blight images, and 162 Healthy images and are presented in
Figure 3.
3.2. Data Preprocessing and Augmentation
All leaf disease images are resized to 224 × 224 dimensions so that the length and width of the image are the same. These images are preprocessed by suppressing unwanted distortions and enhancing certain image features to improve the data for further processing and analysis. We create grayscale versions of the RGB images of plants and apply a Gaussian filter to calm them out. The image is then divided into blocks with Otsu’s thresholding technique. We finally use a topological change to fill in the minor gaps in the image’s foreground. The segmentation leaf’s RGB image is bitwise, as the binary and original colour images. Shape, structure, and colour attributes are retrieved after segmenting an image. A leaf’s area and perimeter are shown by its contour, which is a line connecting all areas along an object’s edges of the same colour or brightness. An RGB image’s average and standard deviations for every channel are also included. A contour is a line that connects all pixels along an element’s edges. By dividing the total number of pixels by the hue (H) channel intensity between 30 and 70, we calculate the pixel intensity of the image using the HSV colour space. By subtracting one from the image’s green colour part, non-green parts can be calculated.
3.2.1. Greyscale Conversion
For grayscale image preprocessing, the diseased leaves’ image must be converted to grayscale. This matches the grayscale image luminance with the colour image luminance. This linear intensity value is encoded using the gamma expansion, which takes the three primary colours (Red, Green, and Blue) into account [
16]. The gamma expansion is:
An output luminance value is calculated based on a weighted sum of the three linear intensity values, with C
rgb representing RGB primaries and C
linear representing linear intensity values, ranging from 0 to 1. The conversion is performed using the function:
The
f(
x) function uses the weighted sum of the R, G, and B elements of RGB values to convert them to grayscale values.
3.2.2. Smoothening
There is a 2-D convolution operator called Gaussian smoothing that uses a kernel representing the shape of a Gaussian to smooth images by removing details (higher frequencies) and noise. As shown below, the Gaussian filter has a general representation [
17]:
3.2.3. Otsu Thresholding
Segmenting images into functional areas or objects is an important technique in computer vision. In computer vision, image segmentation is a critical and challenging issue. Two characteristics, discontinuity and similarity, are used to classify various image segmentation techniques. An image is divided into comparable groups of connected pixels using a region-based segmentation technique. Thresholding is a crucial technique in image segmentation as it can be applied to many kinds of image segmentation [
18]. The background and object’s gray-level distributions calculate the grey-level threshold value. If
G(
x,
y) is the threshold type of
f(
x,
y), then
T is the overall threshold value:
The definition of a threshold operation is
The equation has three variables: T, which stands for the threshold; f(x, y), which denotes the point’s grey value; p(x, y), which denotes a local feature of the point (x, y).
3.2.4. Morphological Operation
After segmenting the affected region, top hat and bottom hat transformations are carried out to isolate the precise location of the disease using the element disks with size 12. Foreground pixels are removed from the edges of the foreground pixels by erosion followed by dilation [
19].
where I = Original Image and P = Structuring element
Closed pixels enlarge a pixel’s boundary in the image and fill in the blanks in the background region; this is called morphological closing. In the image, closing is just the opposite of opening. It consists of a dilation followed by erosion.
The mathematical function of closing is
where I = Original Image and P = Structuring element.
Table 2 shows the morphological features for leaf disease detection.
3.3. Feature Extraction
An image can be analysed using the GLCM feature, which utilises the distance between two pixels in the image to calculate its value. A fine texture region changes rapidly, whereas a coarse texture region changes more slowly [
20]. Its value is computed as follows:
We build a GLCM matrix as an illustration, with the levels of intensity 1 and 4 being marked in red and based on distance d = 1 and angular orientation 0. This shows that distance d = 1 and intensity values 1 and 4 are at an angle of 0 degrees. The GLCM matrix, which has a value of 2 for row 1 and column 4, is created using the same method.
Table 3 displays the GLCM matrix produced using a similar technique. Using this technique, we build the GLCM matrix for the full image and divide it into non-overlapping blocks of size n × n.
Each block is examined using statistics showing the regular distribution, including the angular second scene, entropy, correlations, energies, contrasting, and homogeneous.
The angular second scene is calculated using Equation (10):
Correlation: An image’s correlation value measures the similarity of its textures across horizontally and vertically perpendicular directions [
20] and can be given as
Contrast: The contrast value is calculated according to the following formula (Equation (12)) and indicates the changes in depth and smoothness of the image:
Entropy: Information content is measured by entropy, which is computed as follows:
Energy: A square of an element equals its energy and is given by
Homogeneity: An image’s homogeneity is determined by its structural similarity [
20]. It is computed as:
There are p non-overlapping blocks and q non-overlapping blocks in each block, so we can create a feature matrix by arranging the extracted features.
3.4. Classification
Since 2012, success has grown in tandem with the complexity of the models used in the ImageNet dataset, yet many are computationally inefficient. When used to solve the ImageNet classification issue, the EfficientNet model, which has 66M characteristics, obtains an 84.4% accuracy [
21]. An RGB picture’s average and standard deviations for every channel are also included. A contour is a line that connects all pixels along an element’s edges.
Through smaller models, deep learning systems aim to find more effective methods. EfficientNet properly adjusts depth, width, and resolution when the network is shrunk, outperforming other cutting-edge algorithms in effectiveness [
22]. Its first stage when applying the compounded scaling method is to choose a grid to investigate how the different scaling parameters of the baseline channels interact with one another while observing specified resource shortages. It thus becomes possible to determine the right transformation function for the sharpness, thickness, and width characteristics. The targeted market networks are then scaled using the parameters to match the initial structure.
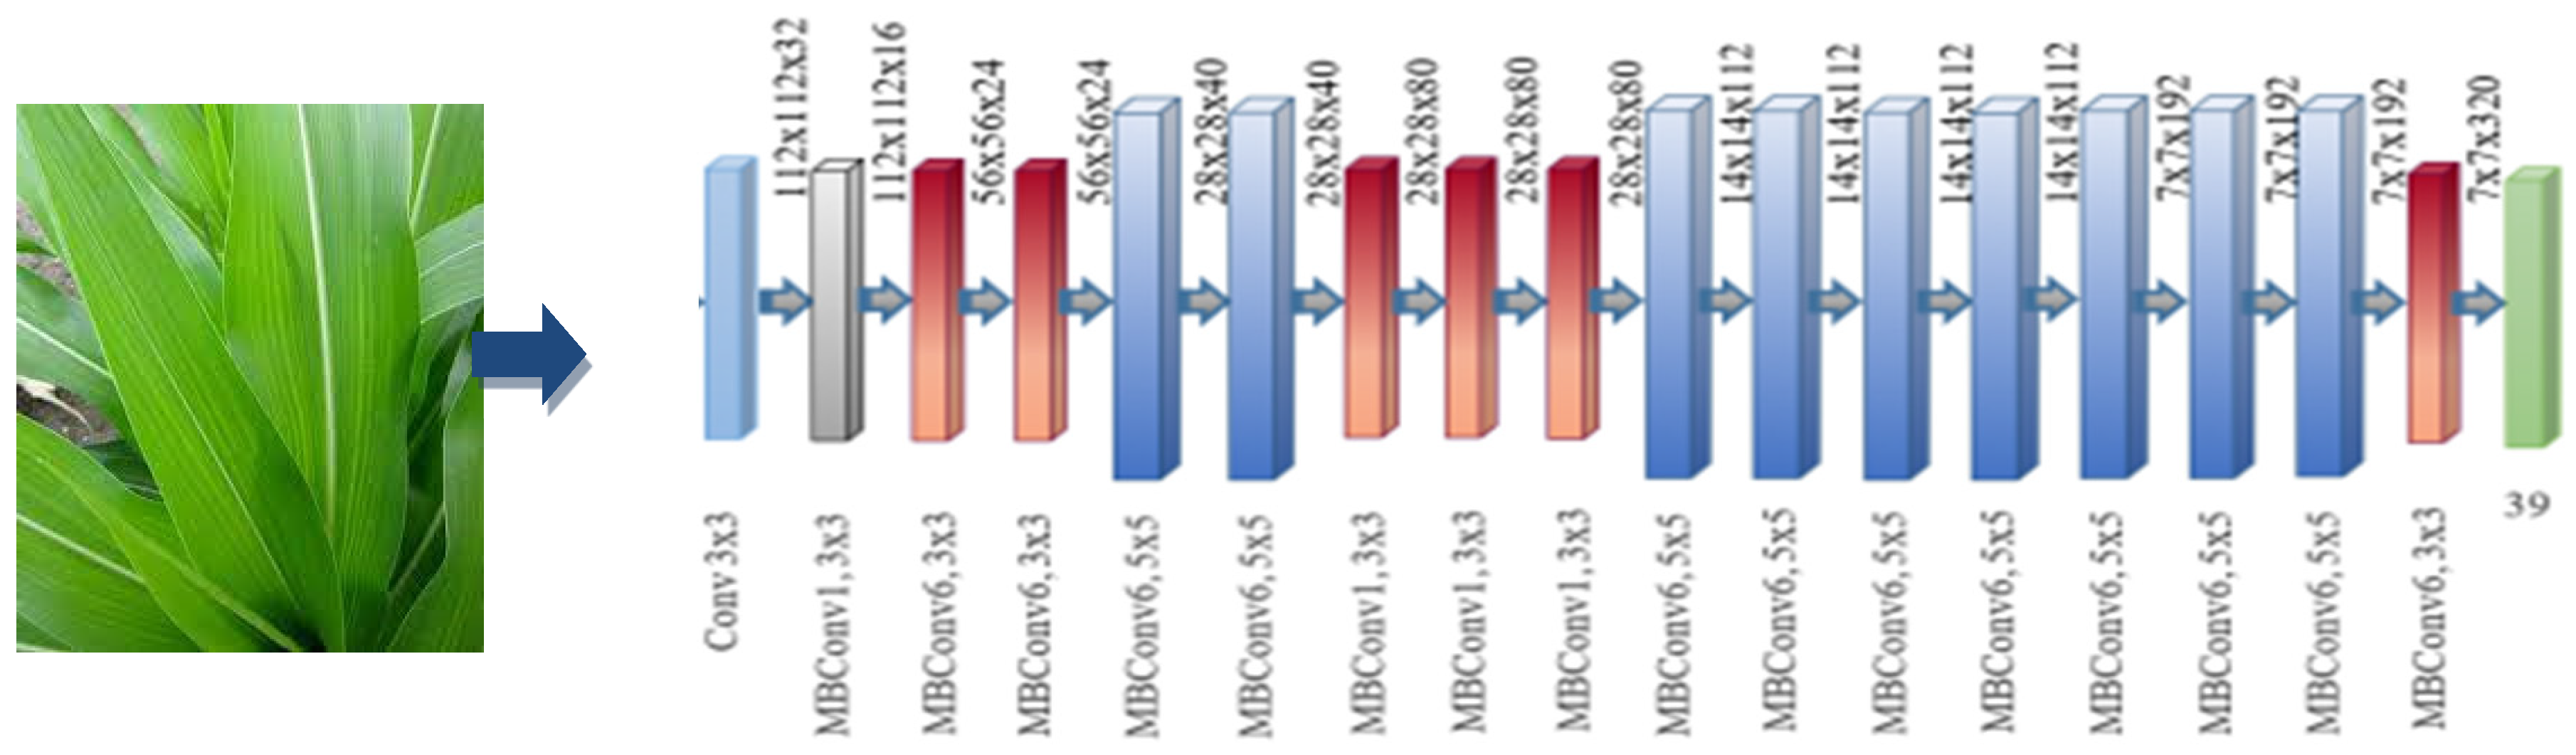
The inversion bottleneck MBConv, initially introduced in MobileNetV2, is the main part of EfficientNet [
23]. However, because of its greater FLOPS (Floating Point Calculations Per Second) budget, it is used slightly more frequently than MobileNetV2. The layers that make-up pieces in MBConv enlarge connections before compression. This results in direct connections between bottlenecks, which connect fewer routes than expansion stages. The calculated duration for this design’s in-depth separated convolutions is significantly decreased compared to traditional levels (approximately by a factor of k 2), where k is the kernel size, establishing the parameters for the 2D convolution window.
Figure 4 depicts the EfficientNet B0 model schematic.
Compound scaling uses the compounding coefficients and the recommendations in Equation (16) to appropriately scale depths, width, and resolution.
where α, β, and γ are the grid search used to determine the constants. The amount of resources that can be used for model scaling is controlled by the φ user-defined coefficients, and the networks’ width, depth, and resolution are allocated to α, β, and γ, respectively. FLOPS are proportional to d, w
2, and r
2 in a typical convolution process. As the cost of computing in convolution networks is largely due to convolution operations, scaling the convolution network as given in Equation (16) increases the FLOPS of the network by approximately (α, β
2, γ
2) φ in total.
Based on Baseline EfficientNet-B0, the model is scaled using the compound scaling method in two steps.
1. The optimum values for α, β, and γ are discovered using a grid search with φ = 1 under the assumption that there are twice as many benefits available.
2. Using the calculated values, α, β, and γ will be considered constants, and the baseline networks are scaled up to produce EfficientNet-B1 through B7 by altering the parameters in Equation (16).
4. Experimental Result
The framework was created in Python and ran on a system with an Nvidia GTX 1070 GPU. We employed the provided method to transfer learning to enhance the recognition and tracking of corn plant leaf disease on the datasets rather than building the model from scratch. We used MS-COCO pre-trained weights for this. A variety of evaluation metrics were applied.
Table 4 displays the overall evaluation of the suggested model.
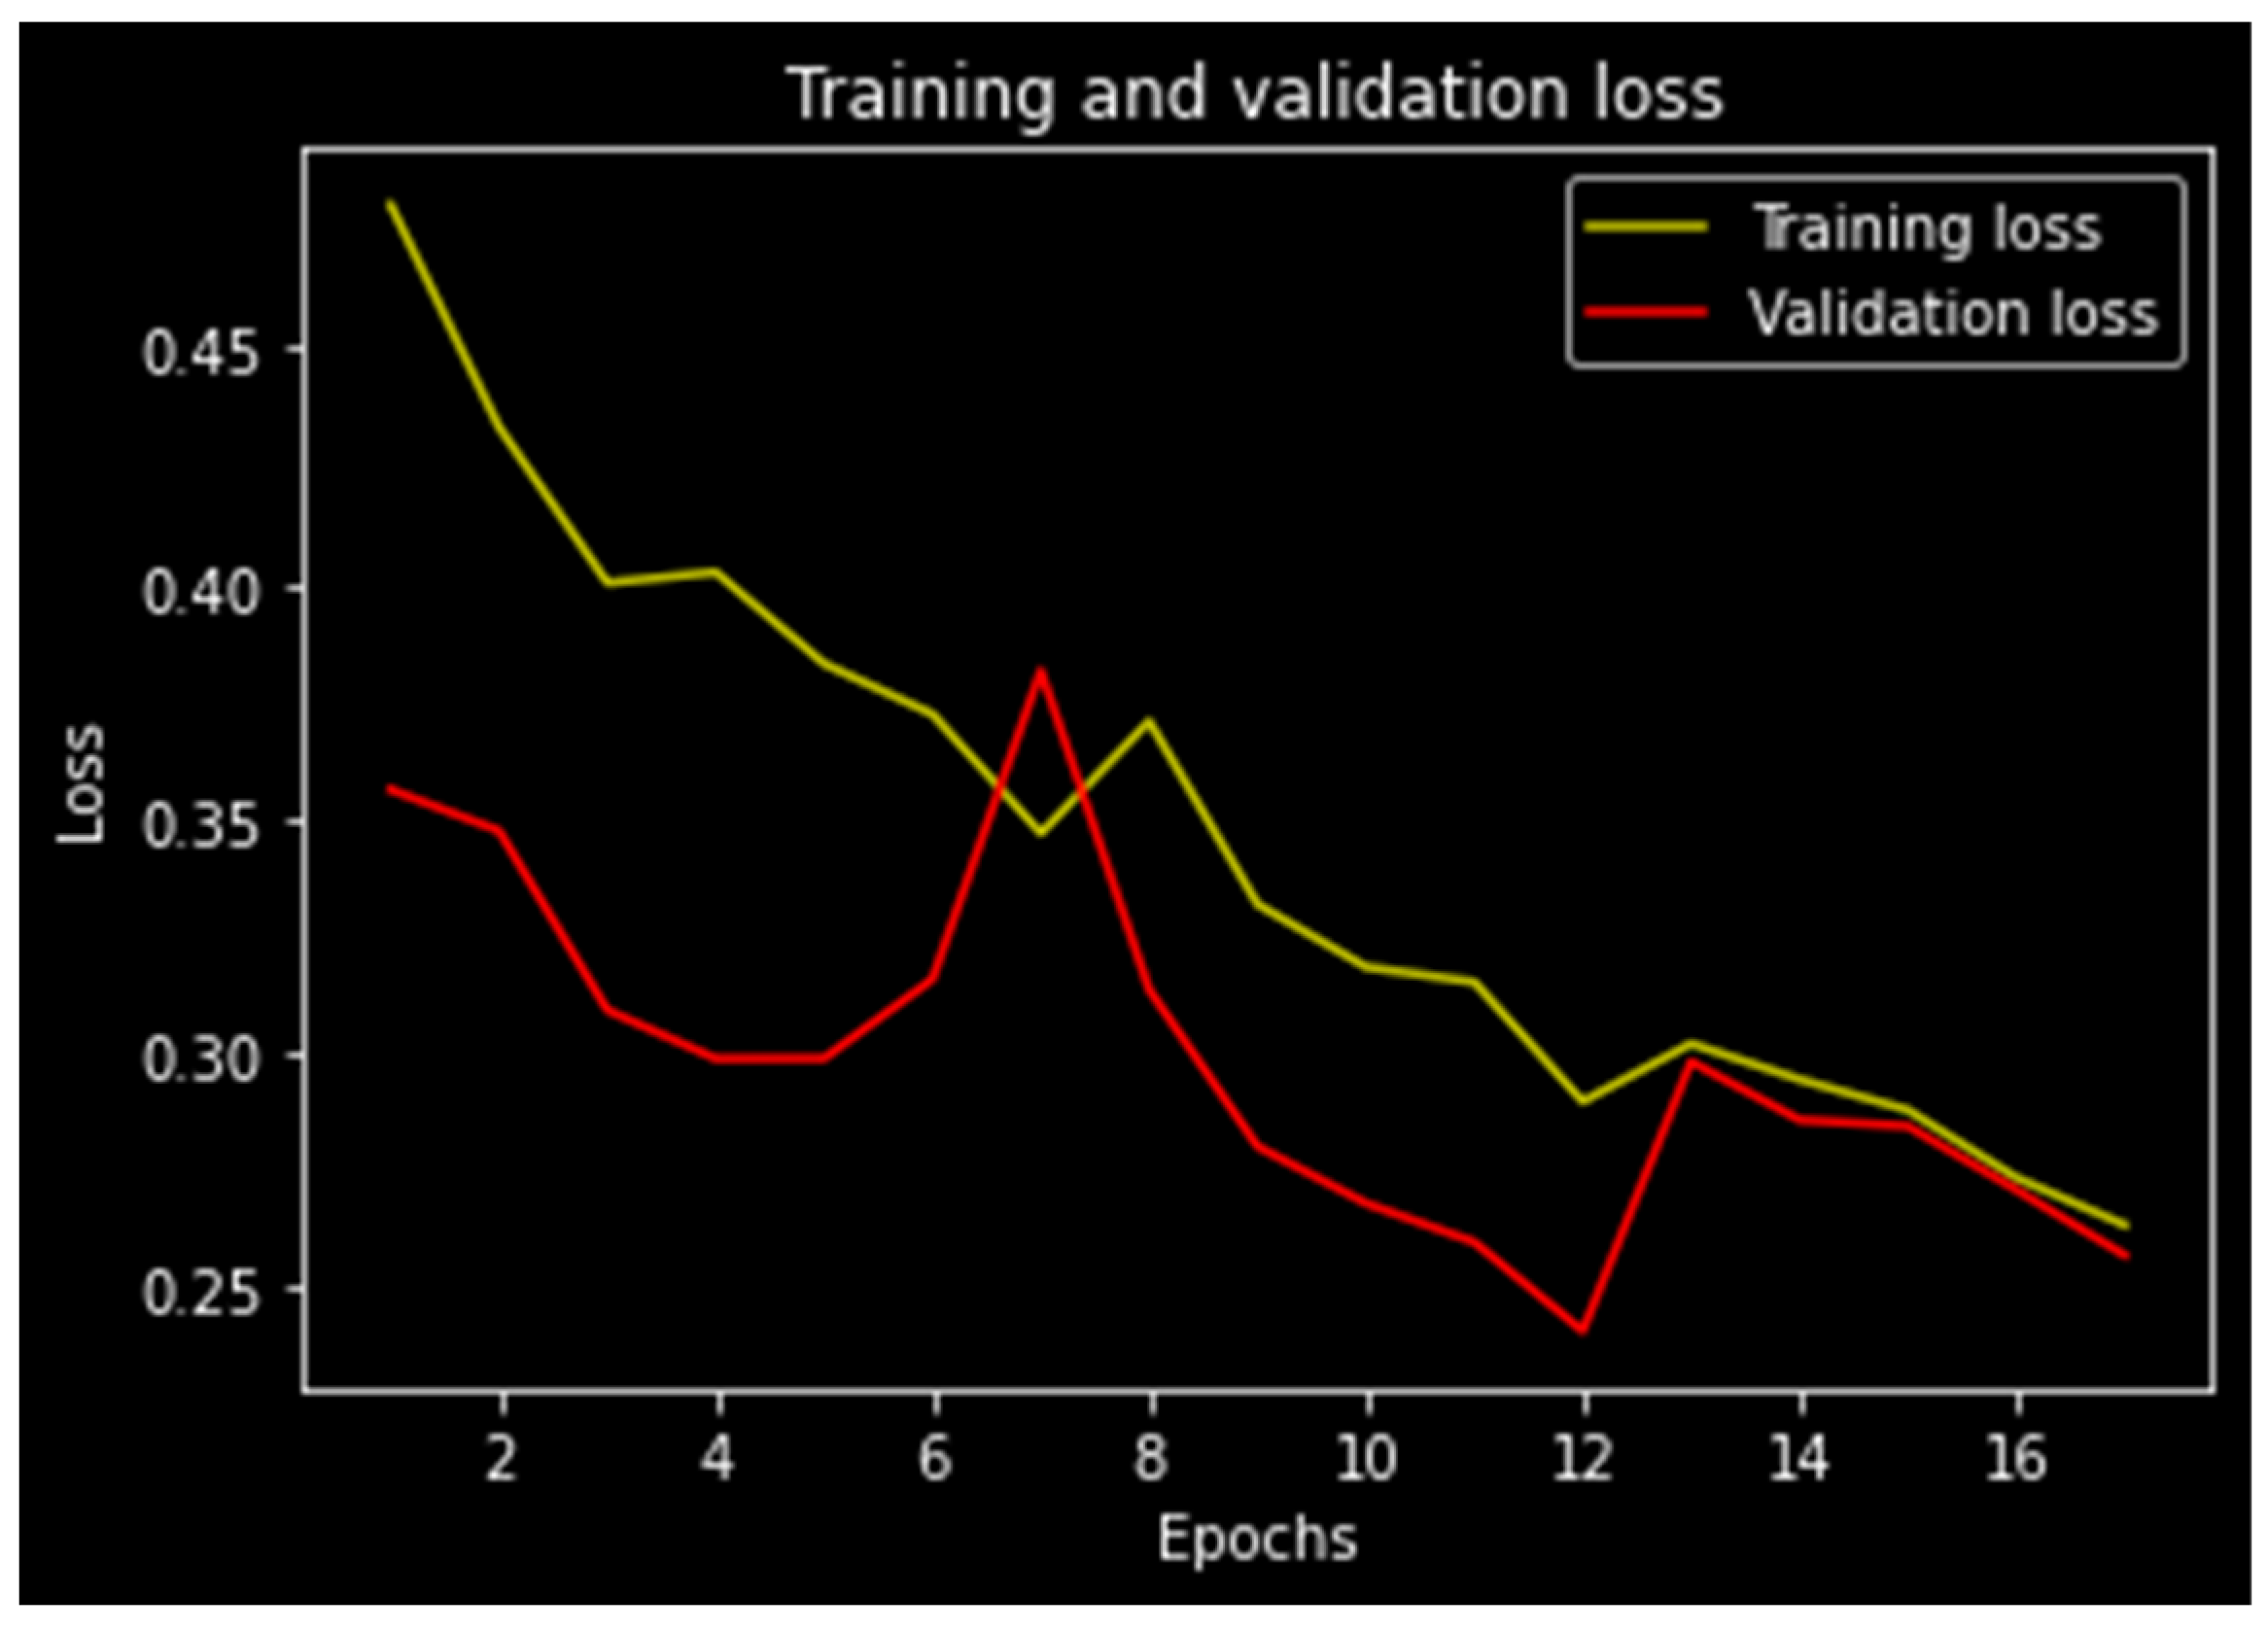
The evaluation of the suggested model is shown in
Figure 5 for various epoch values, and the graphs for the training and validation losses exhibit varied intervals. After period level 2, the training loss does rise, but it later progressively falls to 0.22.
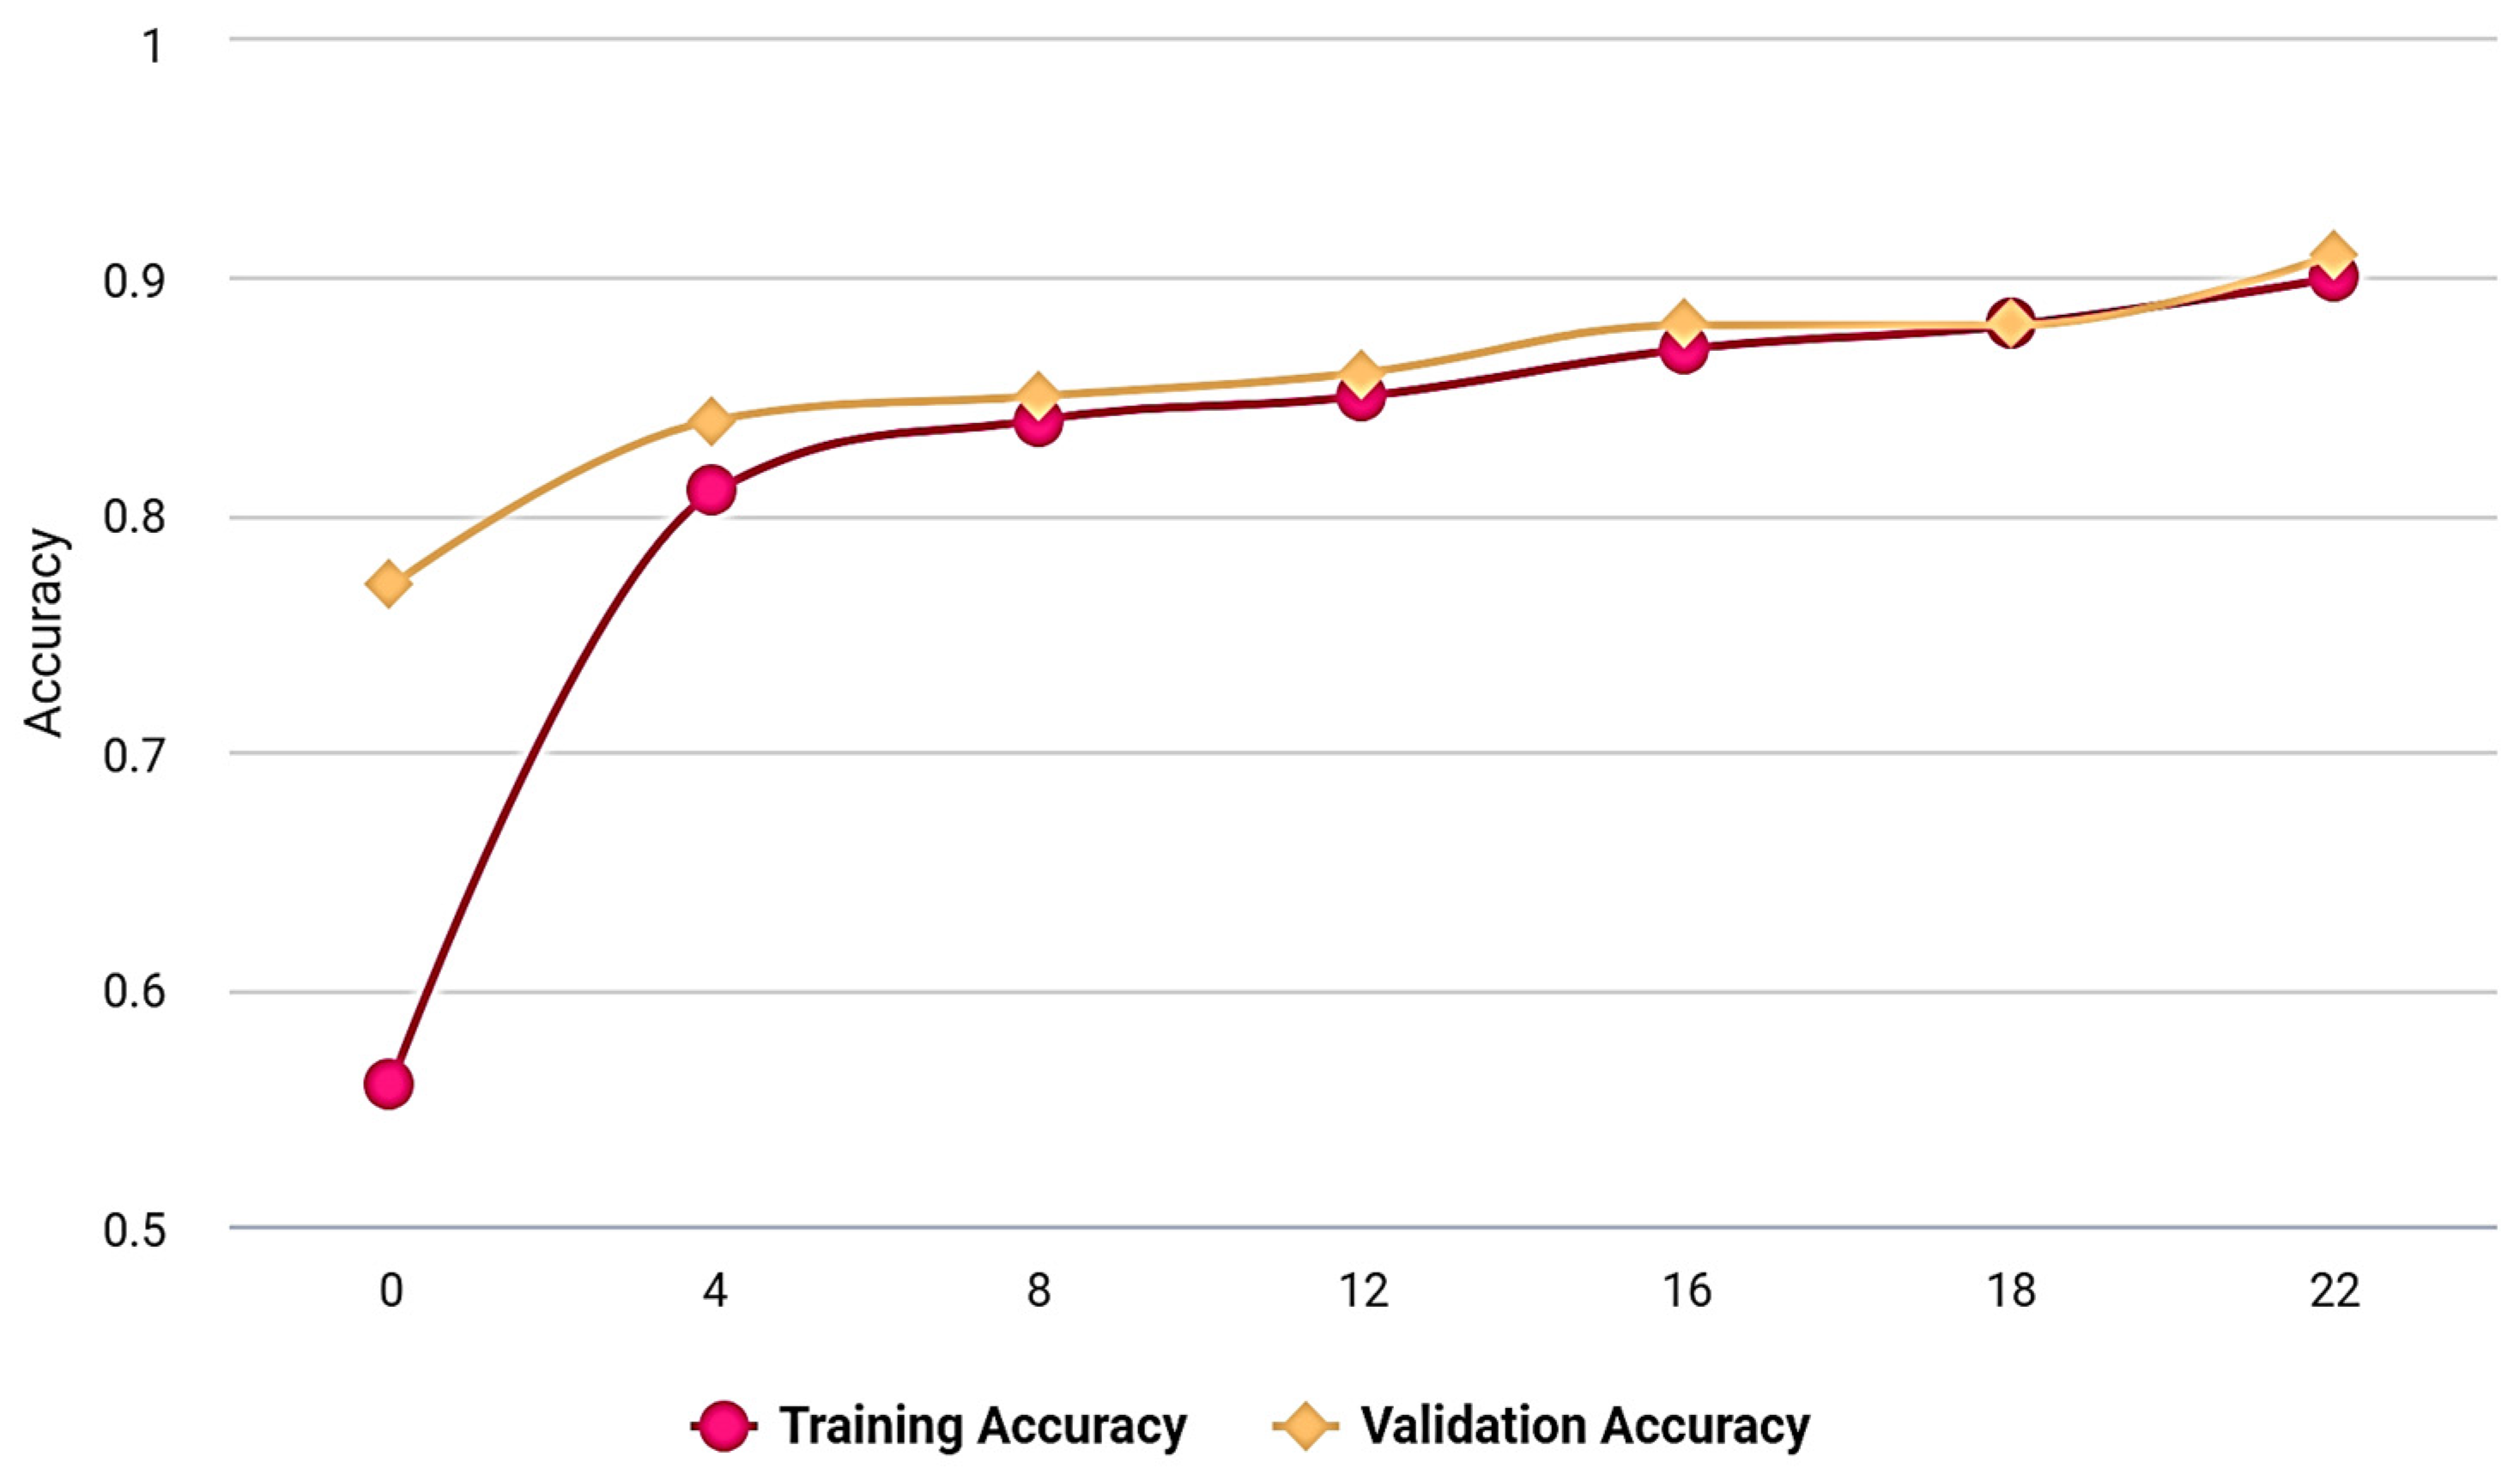
Figure 6 shows that as epoch durations are increased, the training and validation of the performance of the proposed model also rise exponentially.
Figure 5.
Overall training and validation loss of the proposed model.
Figure 5.
Overall training and validation loss of the proposed model.
Figure 6.
Training and Validation accuracy vs. Epoch. A comparison is made between the proposed model that uses EfficientNet and other classification methods commonly used in the discussed literature.
Table 5,
Table 6 and
Table 7 represent the same against different evaluation metrics.
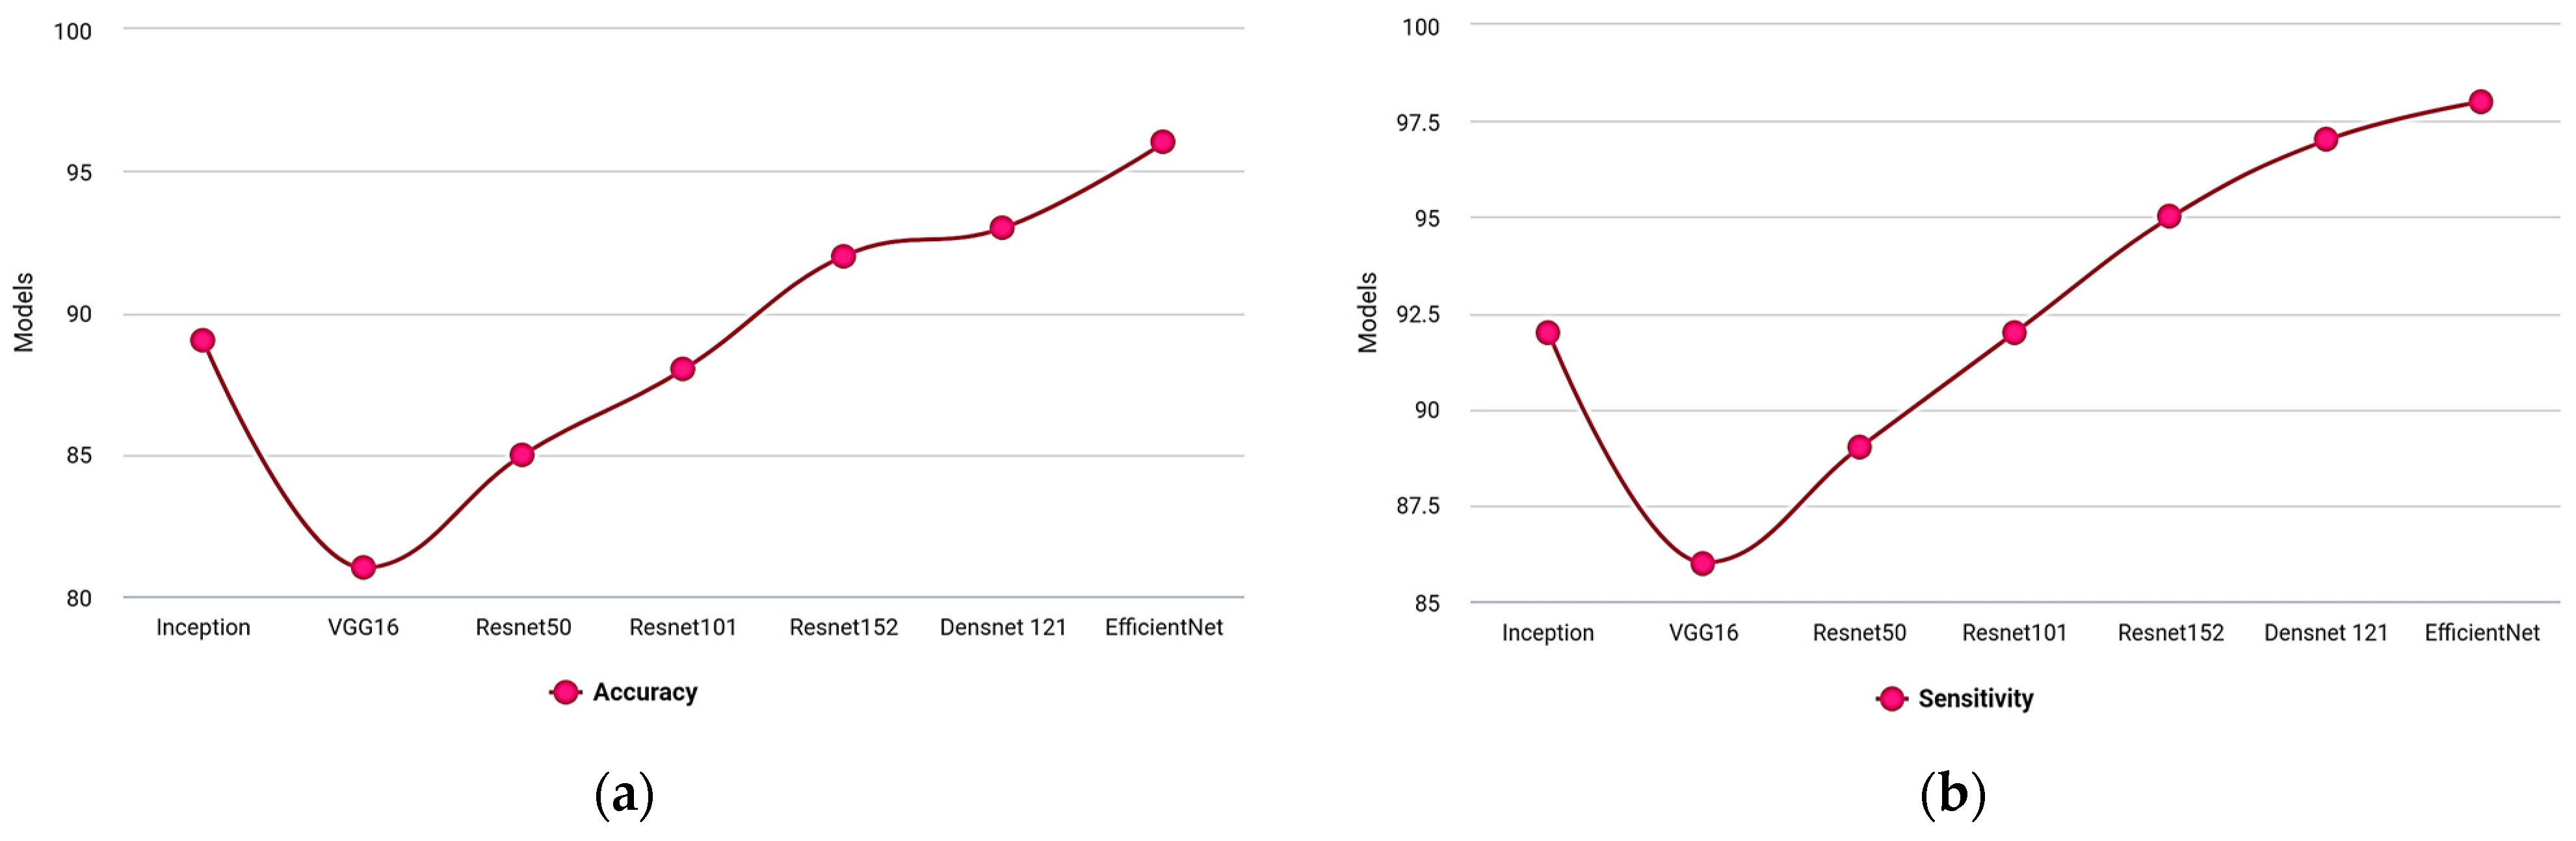
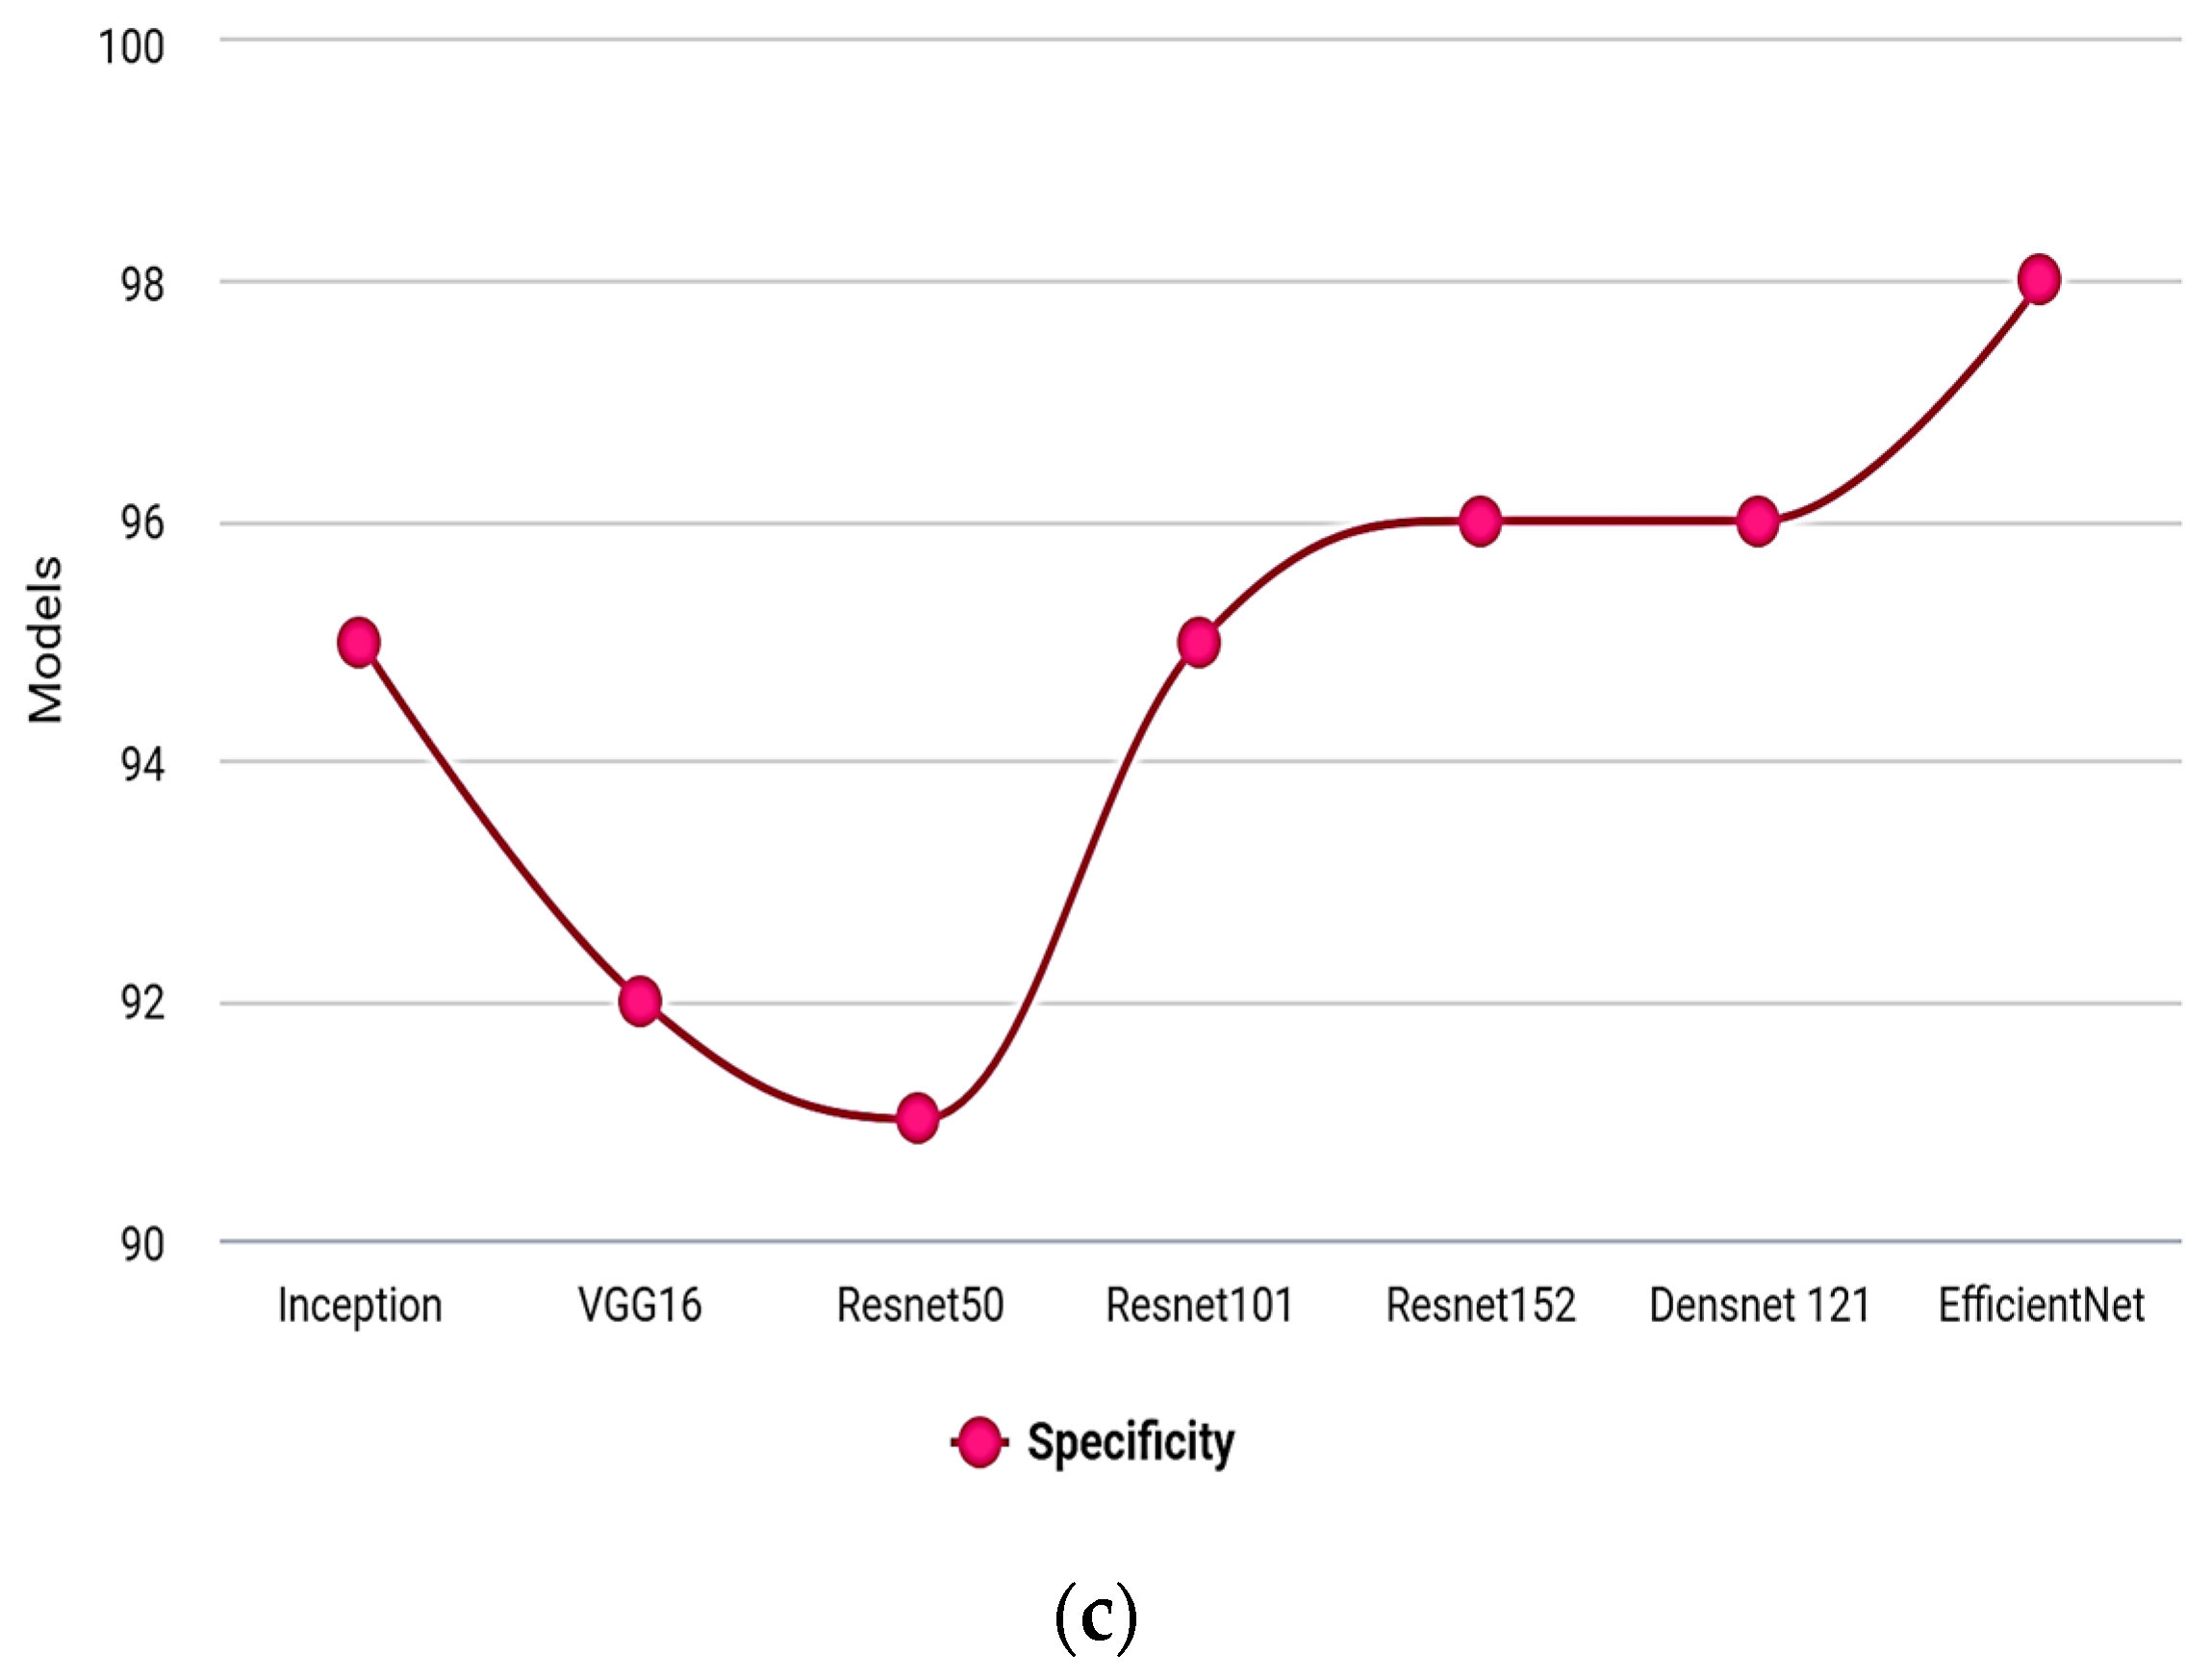
Figure 7a–c illustrate a graphical representation of various designs across precision, sensitivity, and specificity. The recommended model is more effective due to improved dense and transition block effectiveness.
Figure 6.
Training and Validation accuracy vs. Epoch. A comparison is made between the proposed model that uses EfficientNet and other classification methods commonly used in the discussed literature.
Table 5,
Table 6 and
Table 7 represent the same against different evaluation metrics.
Figure 7a–c illustrate a graphical representation of various designs across precision, sensitivity, and specificity. The recommended model is more effective due to improved dense and transition block effectiveness.
Table 5.
Comparison analysis of the proposed model under Accuracy, Sensitivity, and Specificity.
Table 5.
Comparison analysis of the proposed model under Accuracy, Sensitivity, and Specificity.
| Models | Accuracy | Sensitivity | Specificity |
|---|
| Inception | 89 | 92 | 95 |
| VGG16 | 81 | 86 | 92 |
| Resnet50 | 85 | 89 | 91 |
| Resnet101 | 88 | 92 | 95 |
| Resnet152 | 92 | 95 | 96 |
| Densnet 121 | 93 | 97 | 96 |
| EfficientNet B0 | 98.85 | 98 | 98 |
Figure 7.
Models vs. (a) Accuracy, (b) Sensitivity, (c) Specificity.
Figure 7.
Models vs. (a) Accuracy, (b) Sensitivity, (c) Specificity.
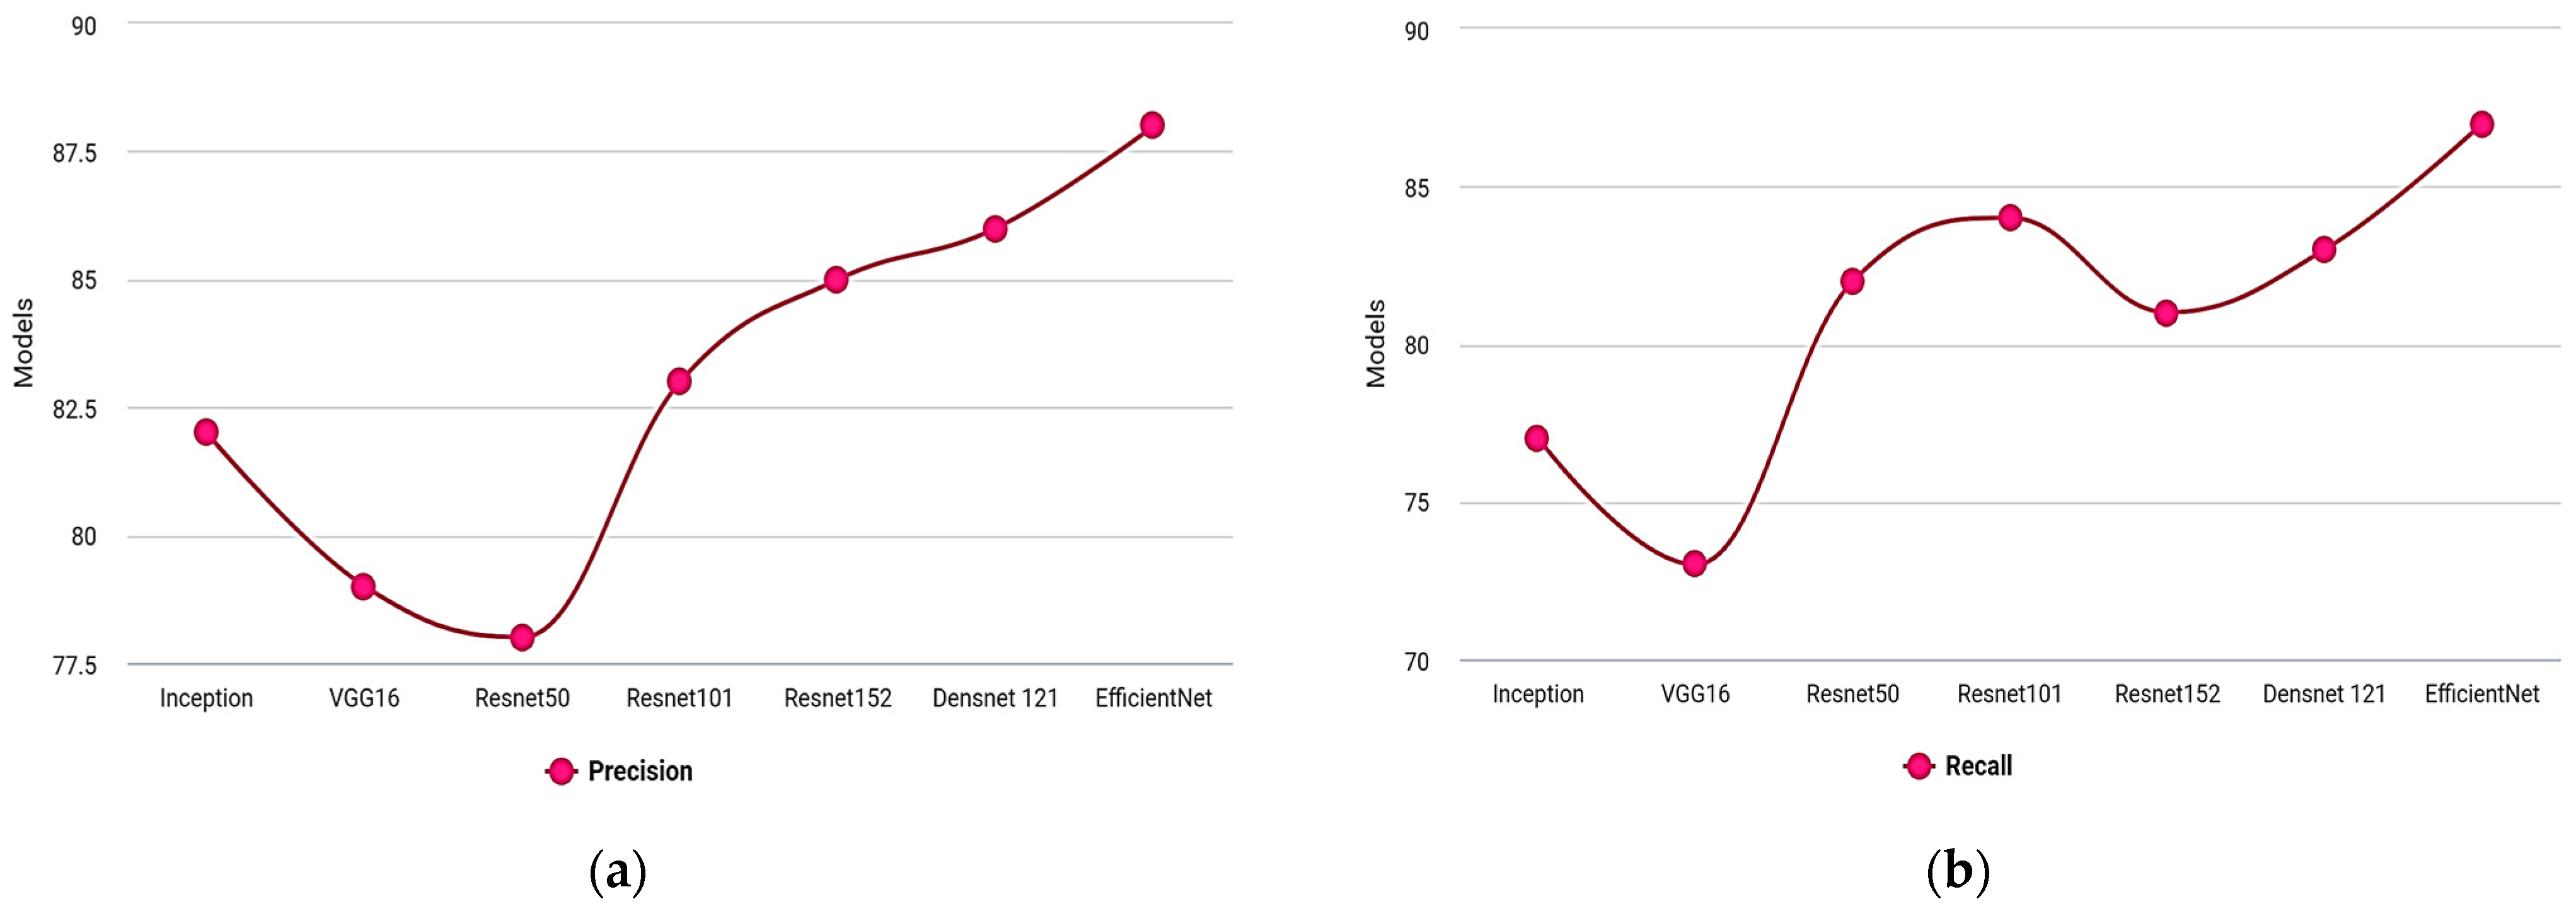
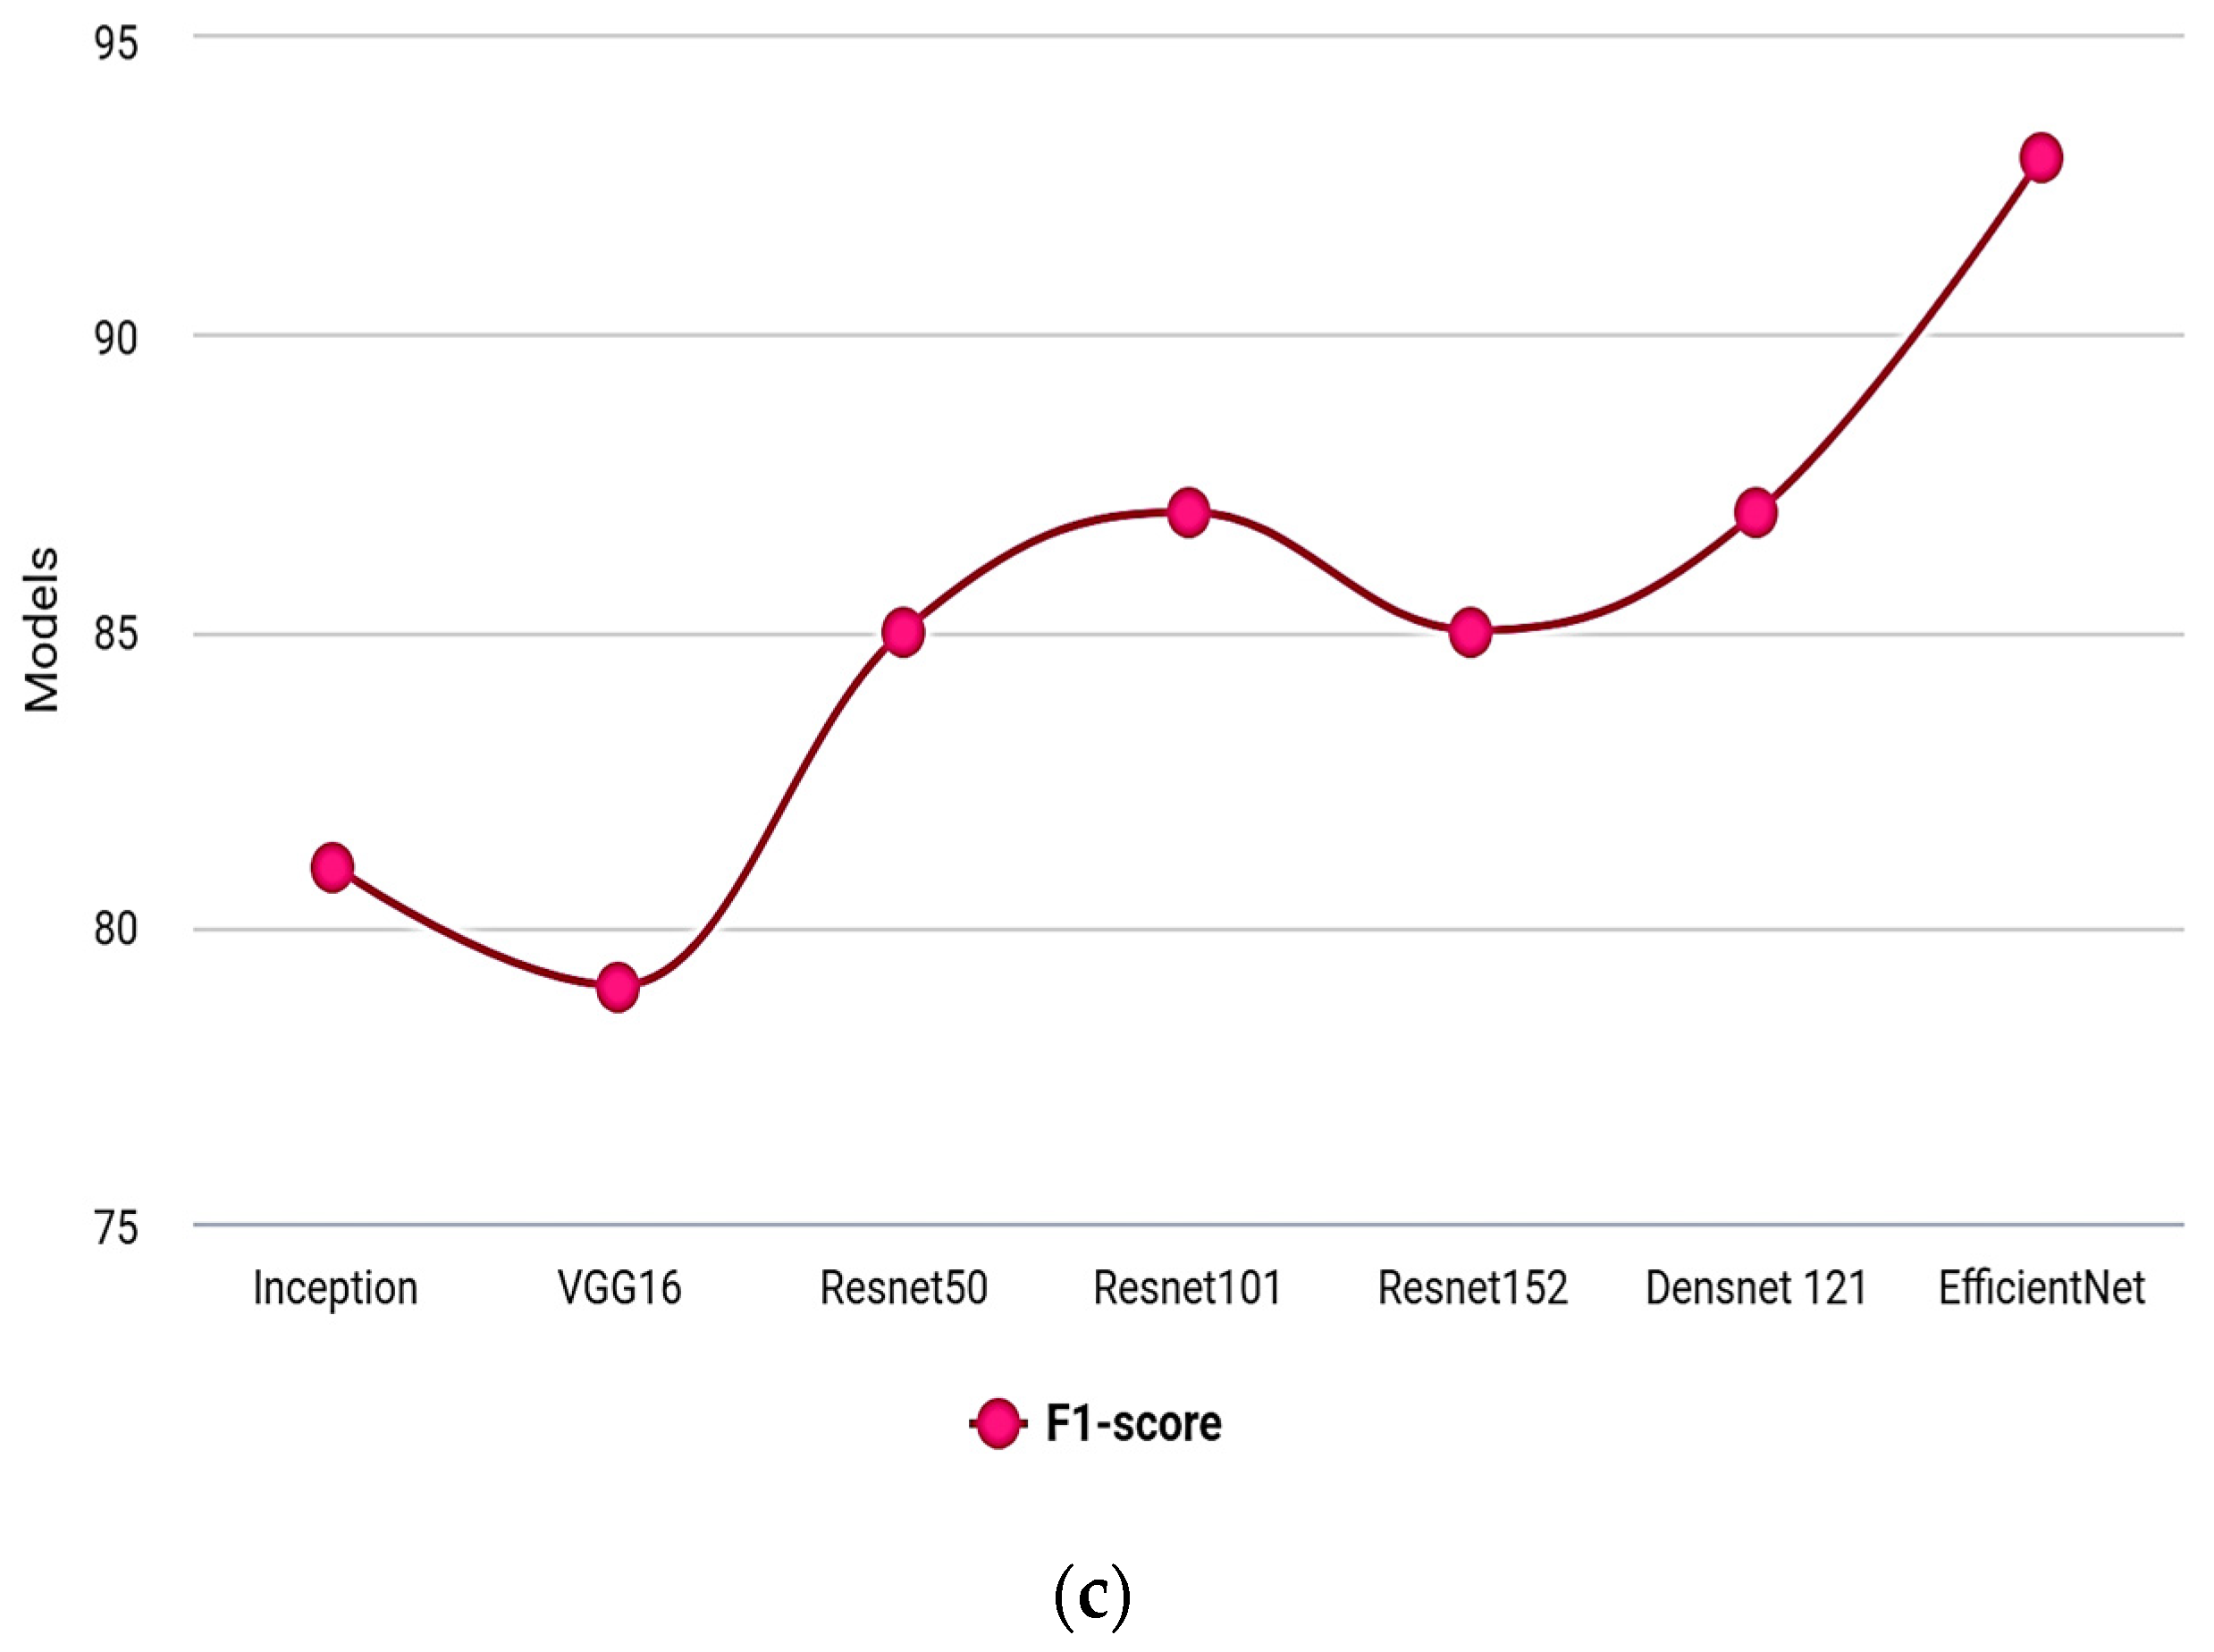
Table 6 shows the evaluation under precision, recall, and F1-score.
Figure 8a–c show the graphical representation in which the proposed model outperforms due to the image’s greater preprocessing efficiency. The feature extraction feature eventually creates an additional dimension for the classifier to analyse the features.
Table 6.
Comparison analysis of the proposed model under Precision, Recall, and F1-score.
Table 6.
Comparison analysis of the proposed model under Precision, Recall, and F1-score.
| Models | Precision | Recall | F1-Score |
|---|
| Inception | 82 | 77 | 81 |
| VGG16 | 79 | 73 | 79 |
| Resnet50 | 78 | 82 | 85 |
| Resnet101 | 83 | 84 | 87 |
| Resnet152 | 85 | 81 | 85 |
| Densnet 121 | 86 | 83 | 87 |
| EfficientNet B0 | 88 | 87 | 93 |
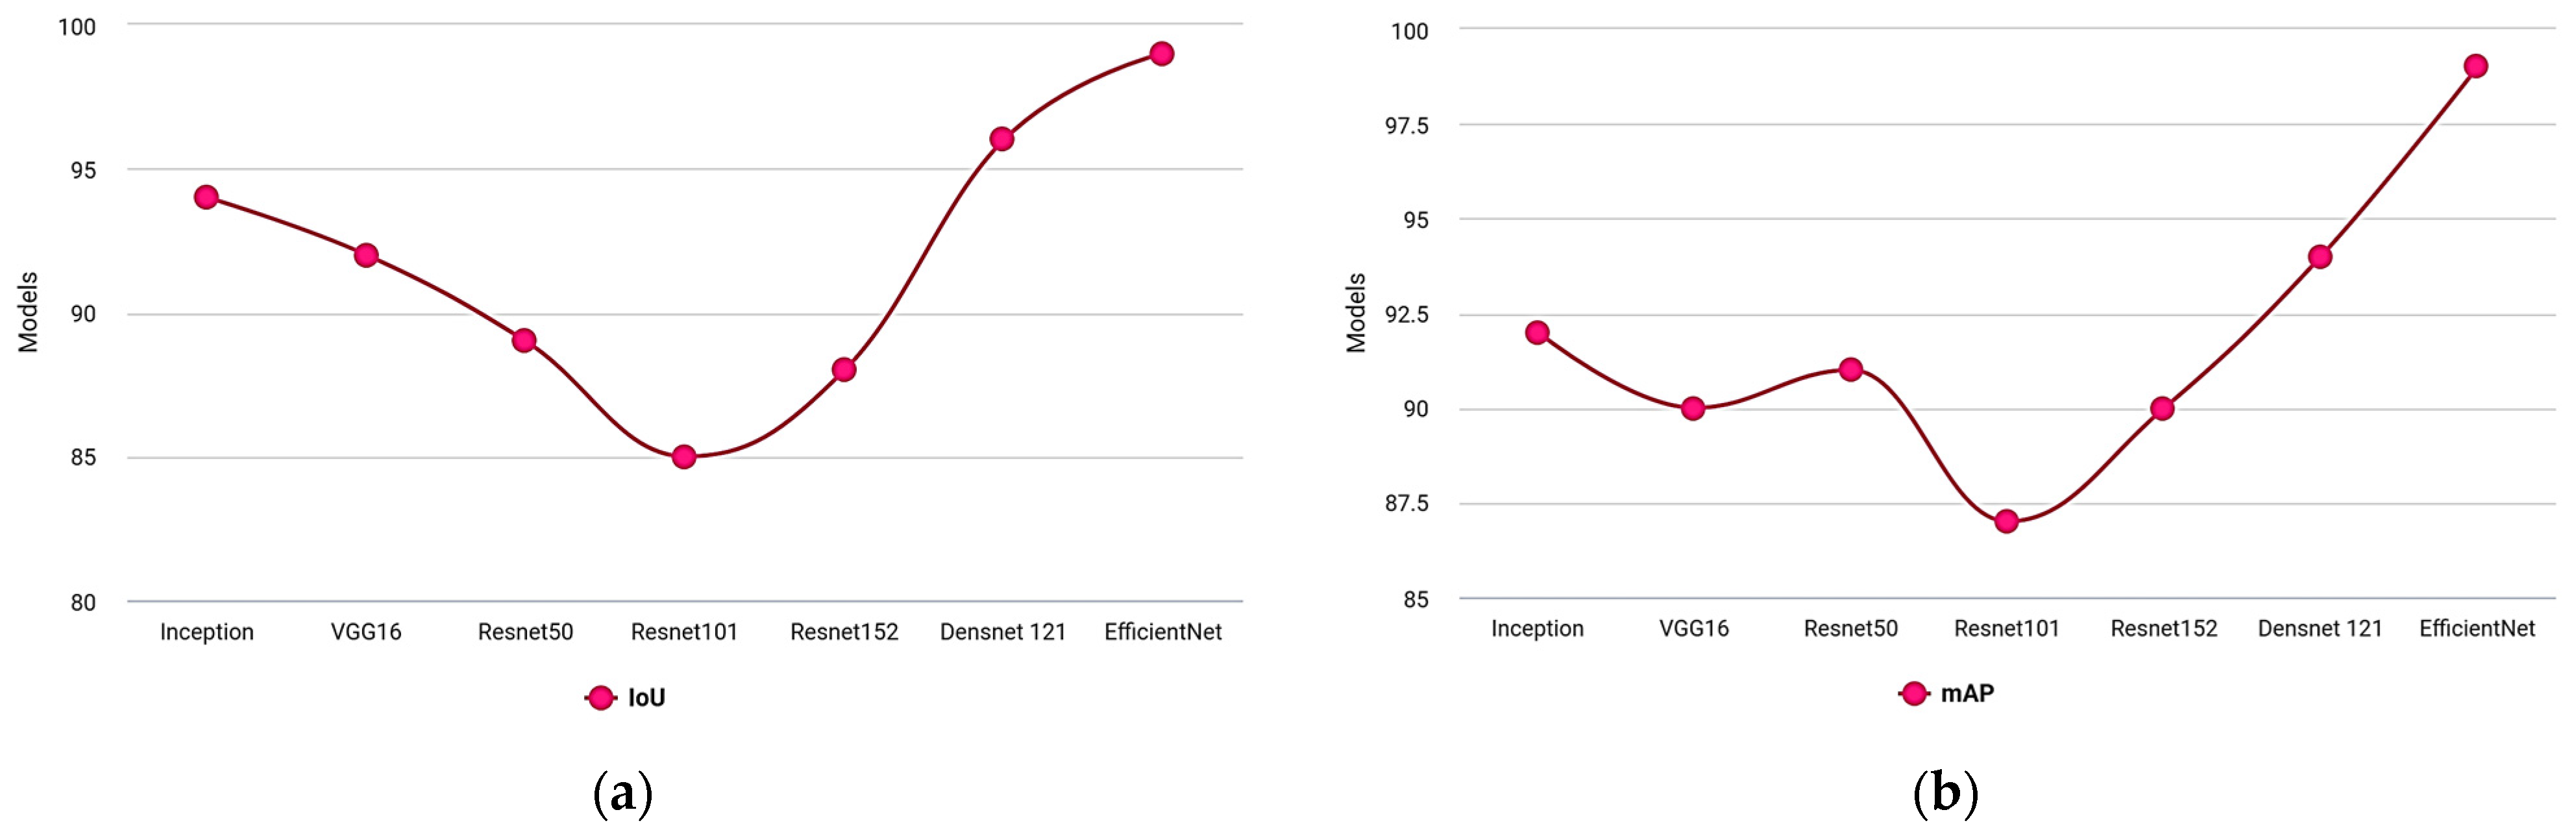
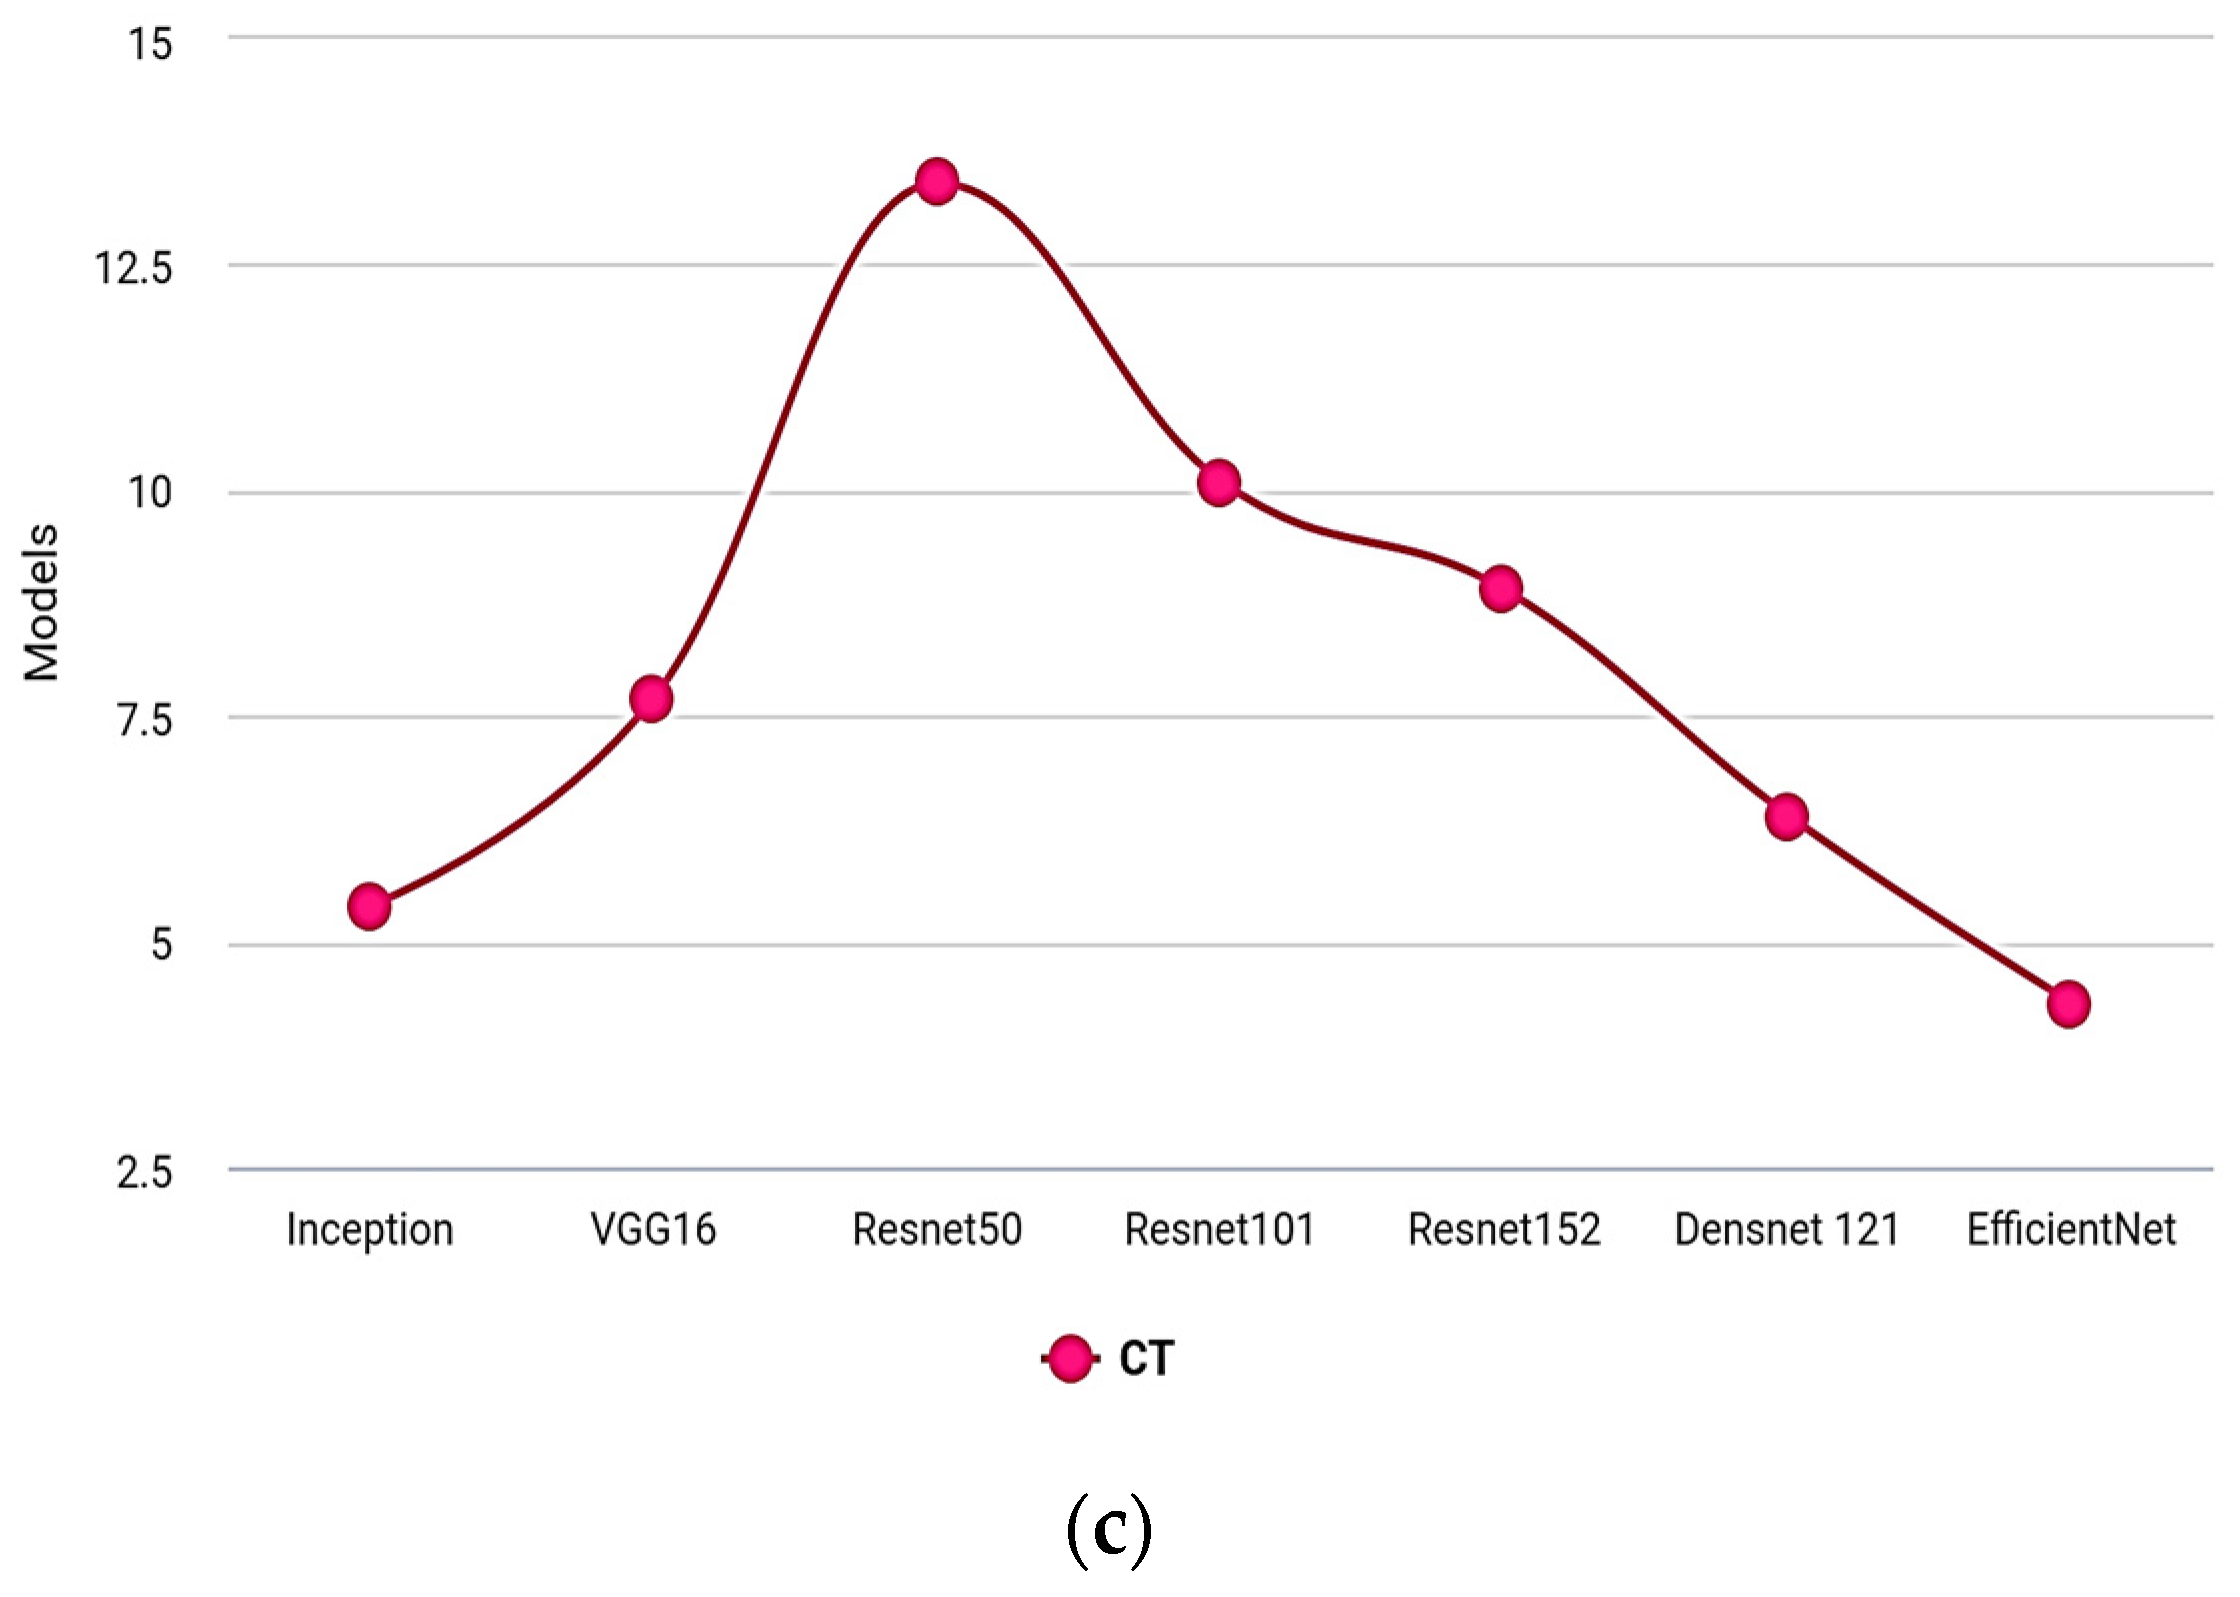
Table 7 shows the evaluation under IoU, mAP, and computation time.
Figure 9a–c show the graphical representation in which the proposed model outperforms due to greater training and testing efficiency and the models’ capability to learn based on the larger datasets.
Table 7.
Comparison analysis of the proposed model under IoU, mAP, and CT.
Table 7.
Comparison analysis of the proposed model under IoU, mAP, and CT.
| Models | IoU | mAP | Computation Time |
|---|
| Inception | 94 | 92 | 5.4 |
| VGG16 | 92 | 90 | 7.7 |
| Resnet50 | 89 | 91 | 13.4 |
| Resnet101 | 85 | 87 | 10.1 |
| Resnet152 | 88 | 90 | 8.9 |
| Densnet 121 | 96 | 94 | 6.4 |
| EfficientNet B0 | 99 | 99 | 4.32 |
We compare the performance of our approach in terms of classification and network parameters with many base models in
Table 7. The values unmistakably demonstrate that the EfficientNet B0 is more resilient than its peer approaches. Furthermore,
Table 6 shows the ResNet-152 [
24] approach, which has the longest processing time, while the VGG-16 [
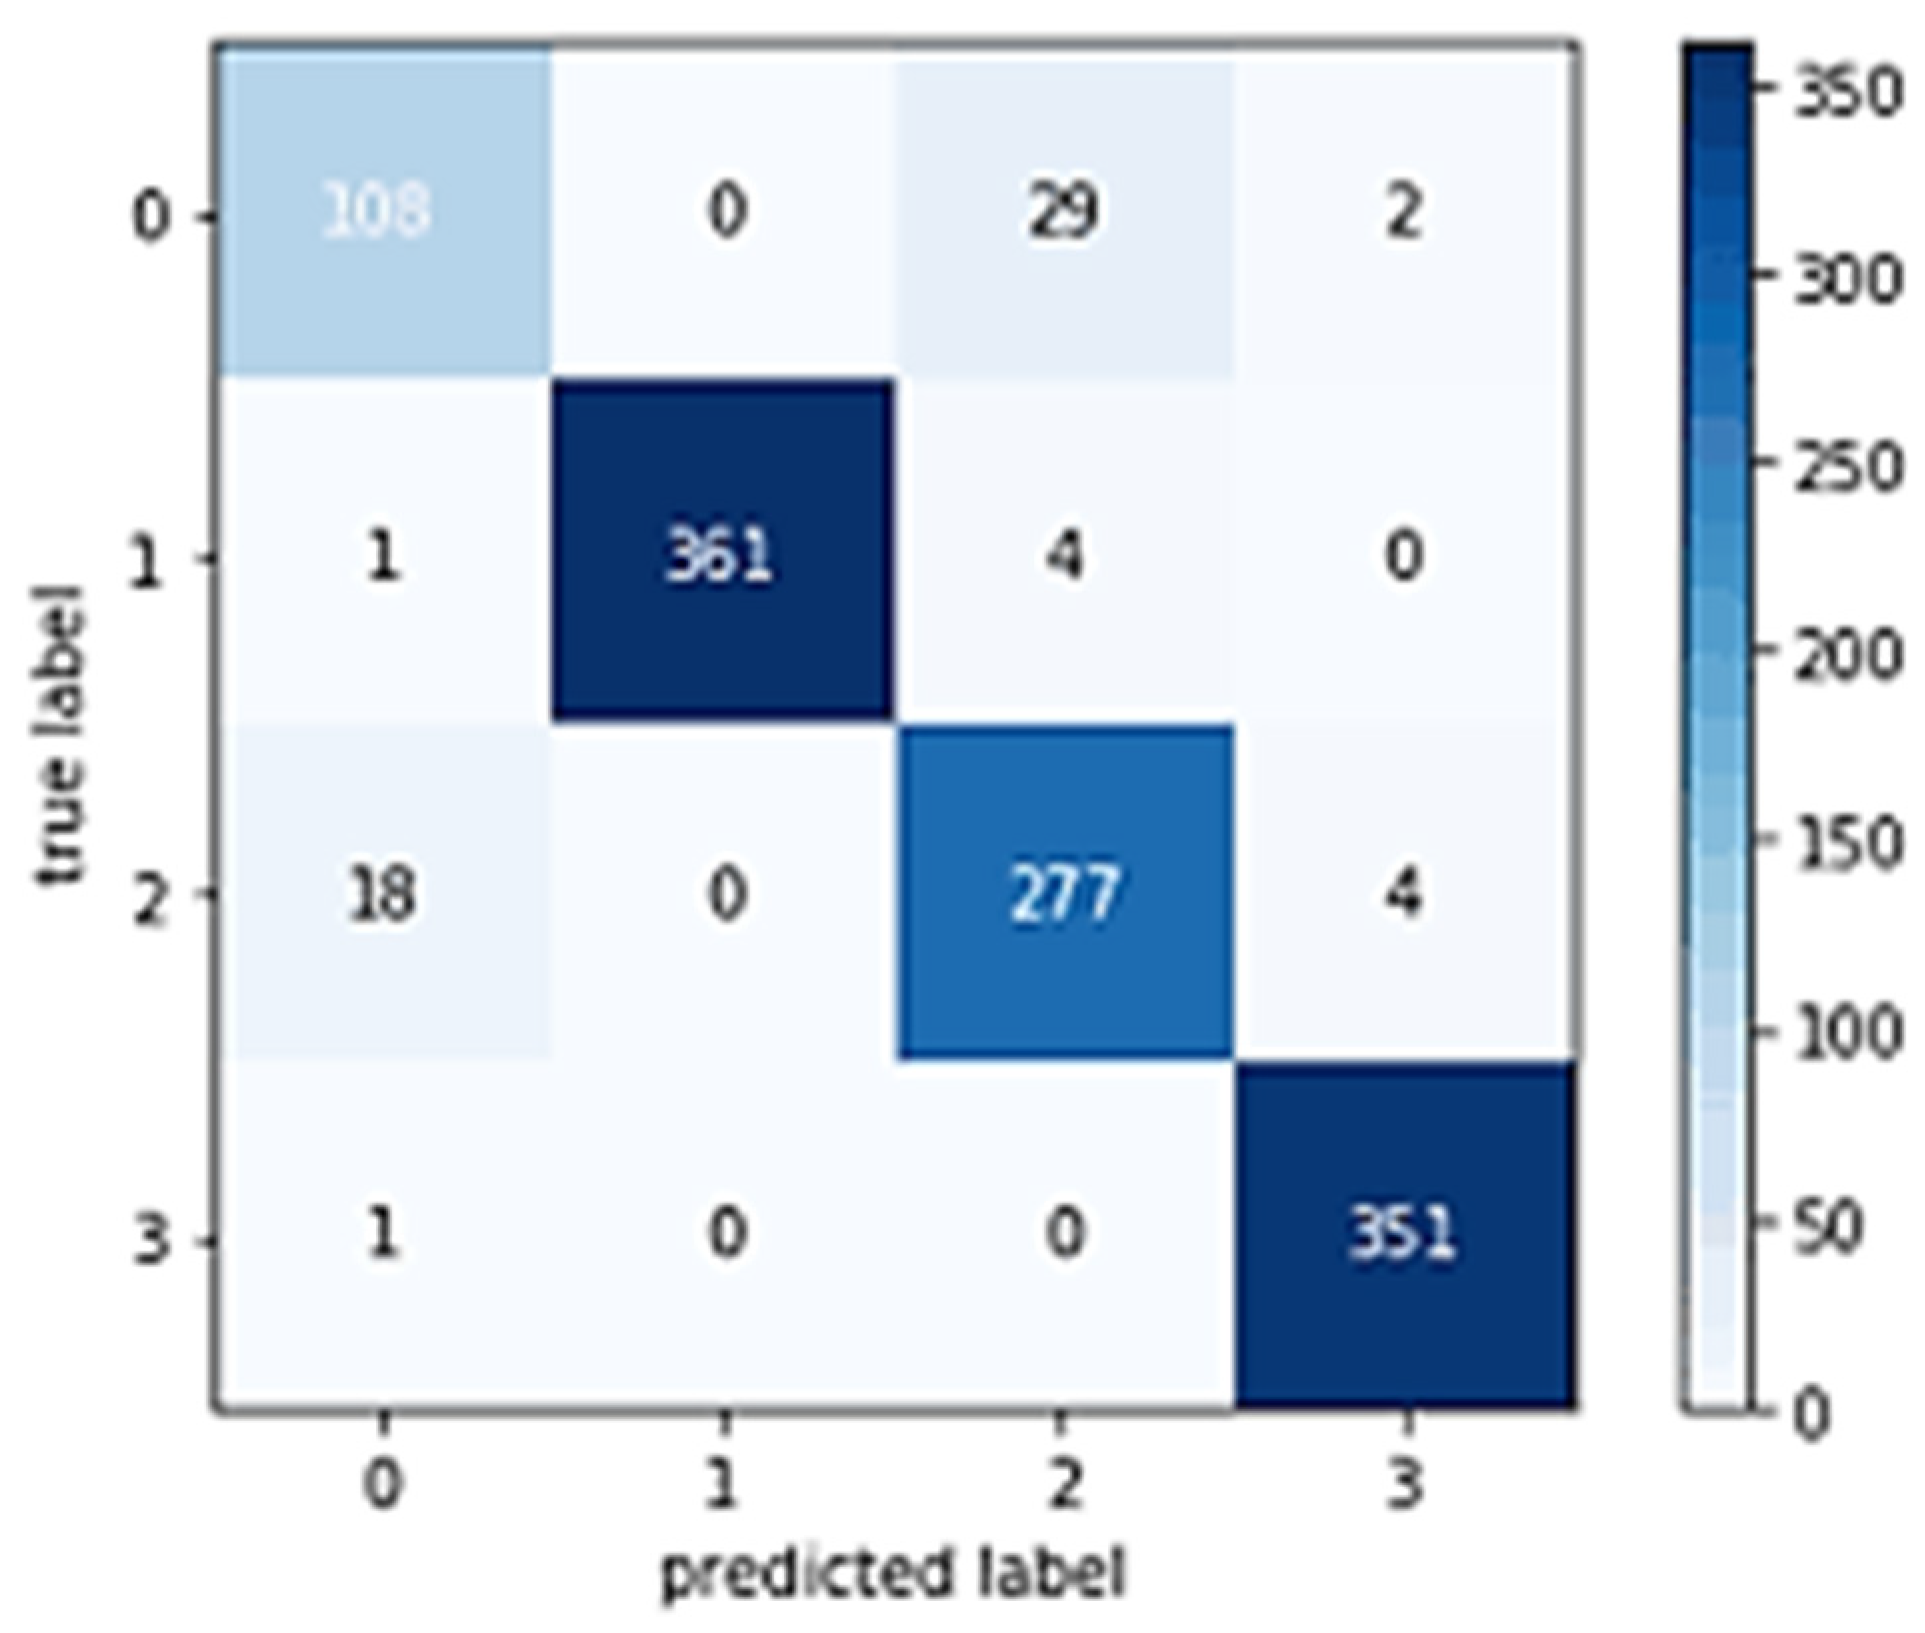
25] approach has the most parameters. Our method, in contrast, is computationally the most reliable because it processes a suspected sample in just 1067 s. The confusion matrix is depicted in
Figure 10.
Compared to comparative base networks, those with higher computational costs are more likely to have sample post-processing problems such as noise, blurring, and light variations. This method offers a more accurate framework for computing key points under varying image distortions and accurately displays complex sample transformations. The results discussed above support the conclusion that our proposed model performs better both at classification performance and execution speed than conventional Deep Learning approaches. As the compared approaches are built based on very deep architectures, which can easily lead to overfitting, the proposed solution outperforms them. This means that, in terms of the classification of plant diseases, our methodology is more efficient and effective than the methods.
5. Conclusions
In recent years, the use of deep learning algorithms for pattern categorisation and image analysis has gained significant attention. Deep learning can help identify plant leaf disease by enabling the development of accurate and efficient automated systems that can classify and diagnose plant diseases. This can help reduce the reliance on manual inspection, which can be time-consuming and prone to errors.
One potential implication of using deep learning for plant disease identification is that it can facilitate early detection and intervention, allowing farmers to take appropriate action to control the spread of diseases. This can help reduce crop losses and minimise the need for excessive pesticide use, thereby improving the sustainability of agriculture and reducing the potential risks associated with pesticide exposure. In this study, we proposed an EfficientNet-based deep learning framework for identifying illnesses in corn leaves. Our approach outperformed cutting-edge deep learning techniques for plant leaf damage identification, achieving an accuracy of 98.85% and a precision of 88% while also being computationally efficient. However, it is important to acknowledge the limited diversity of plant species in our dataset. We aim to expand our dataset to include a broader range of plant leaf diseases to enhance the generalisation capability of our model. In the future, the proposed approach could be further developed for mobile settings, allowing plant pathologists and farmers to quickly and accurately recognise plant pathogens and take necessary precautions to mitigate the impact of plant diseases.
6. Limitations and Future Directions
The limitations of this approach include the limited dataset used in this study, which only focused on corn leaves, and the need to expand to other plant species to validate its effectiveness in identifying other plant diseases. The dataset used was relatively small, which may affect the model’s generalisation capabilities and limit its use in the real world when presented with a diverse range of environmental and plant conditions. Additionally, the proposed method may not detect new or unknown diseases not included in the dataset.
In terms of future directions, the model can be improved by increasing the size of the dataset and introducing more plant species to the model to make it more versatile. Another area of improvement is the development of a mobile application that farmers and plant pathologists can use in the field to recognise and identify diseases in real time, making it more accessible and user-friendly. Finally, the model’s performance can be further improved by incorporating additional features, such as environmental data, in the training process. This would enable the model to consider different factors that may affect the plant’s health and provide a more comprehensive analysis of the plant’s health status.


