

Electromagnetic Vibration Characteristics of Inter-Turn Short Circuits in High Frequency Transformer

Abstract
:1. Introduction
2. Electromagnetic Vibration Noise Mechanism of High Frequency Transformer under Inter-Turn Short Circuits
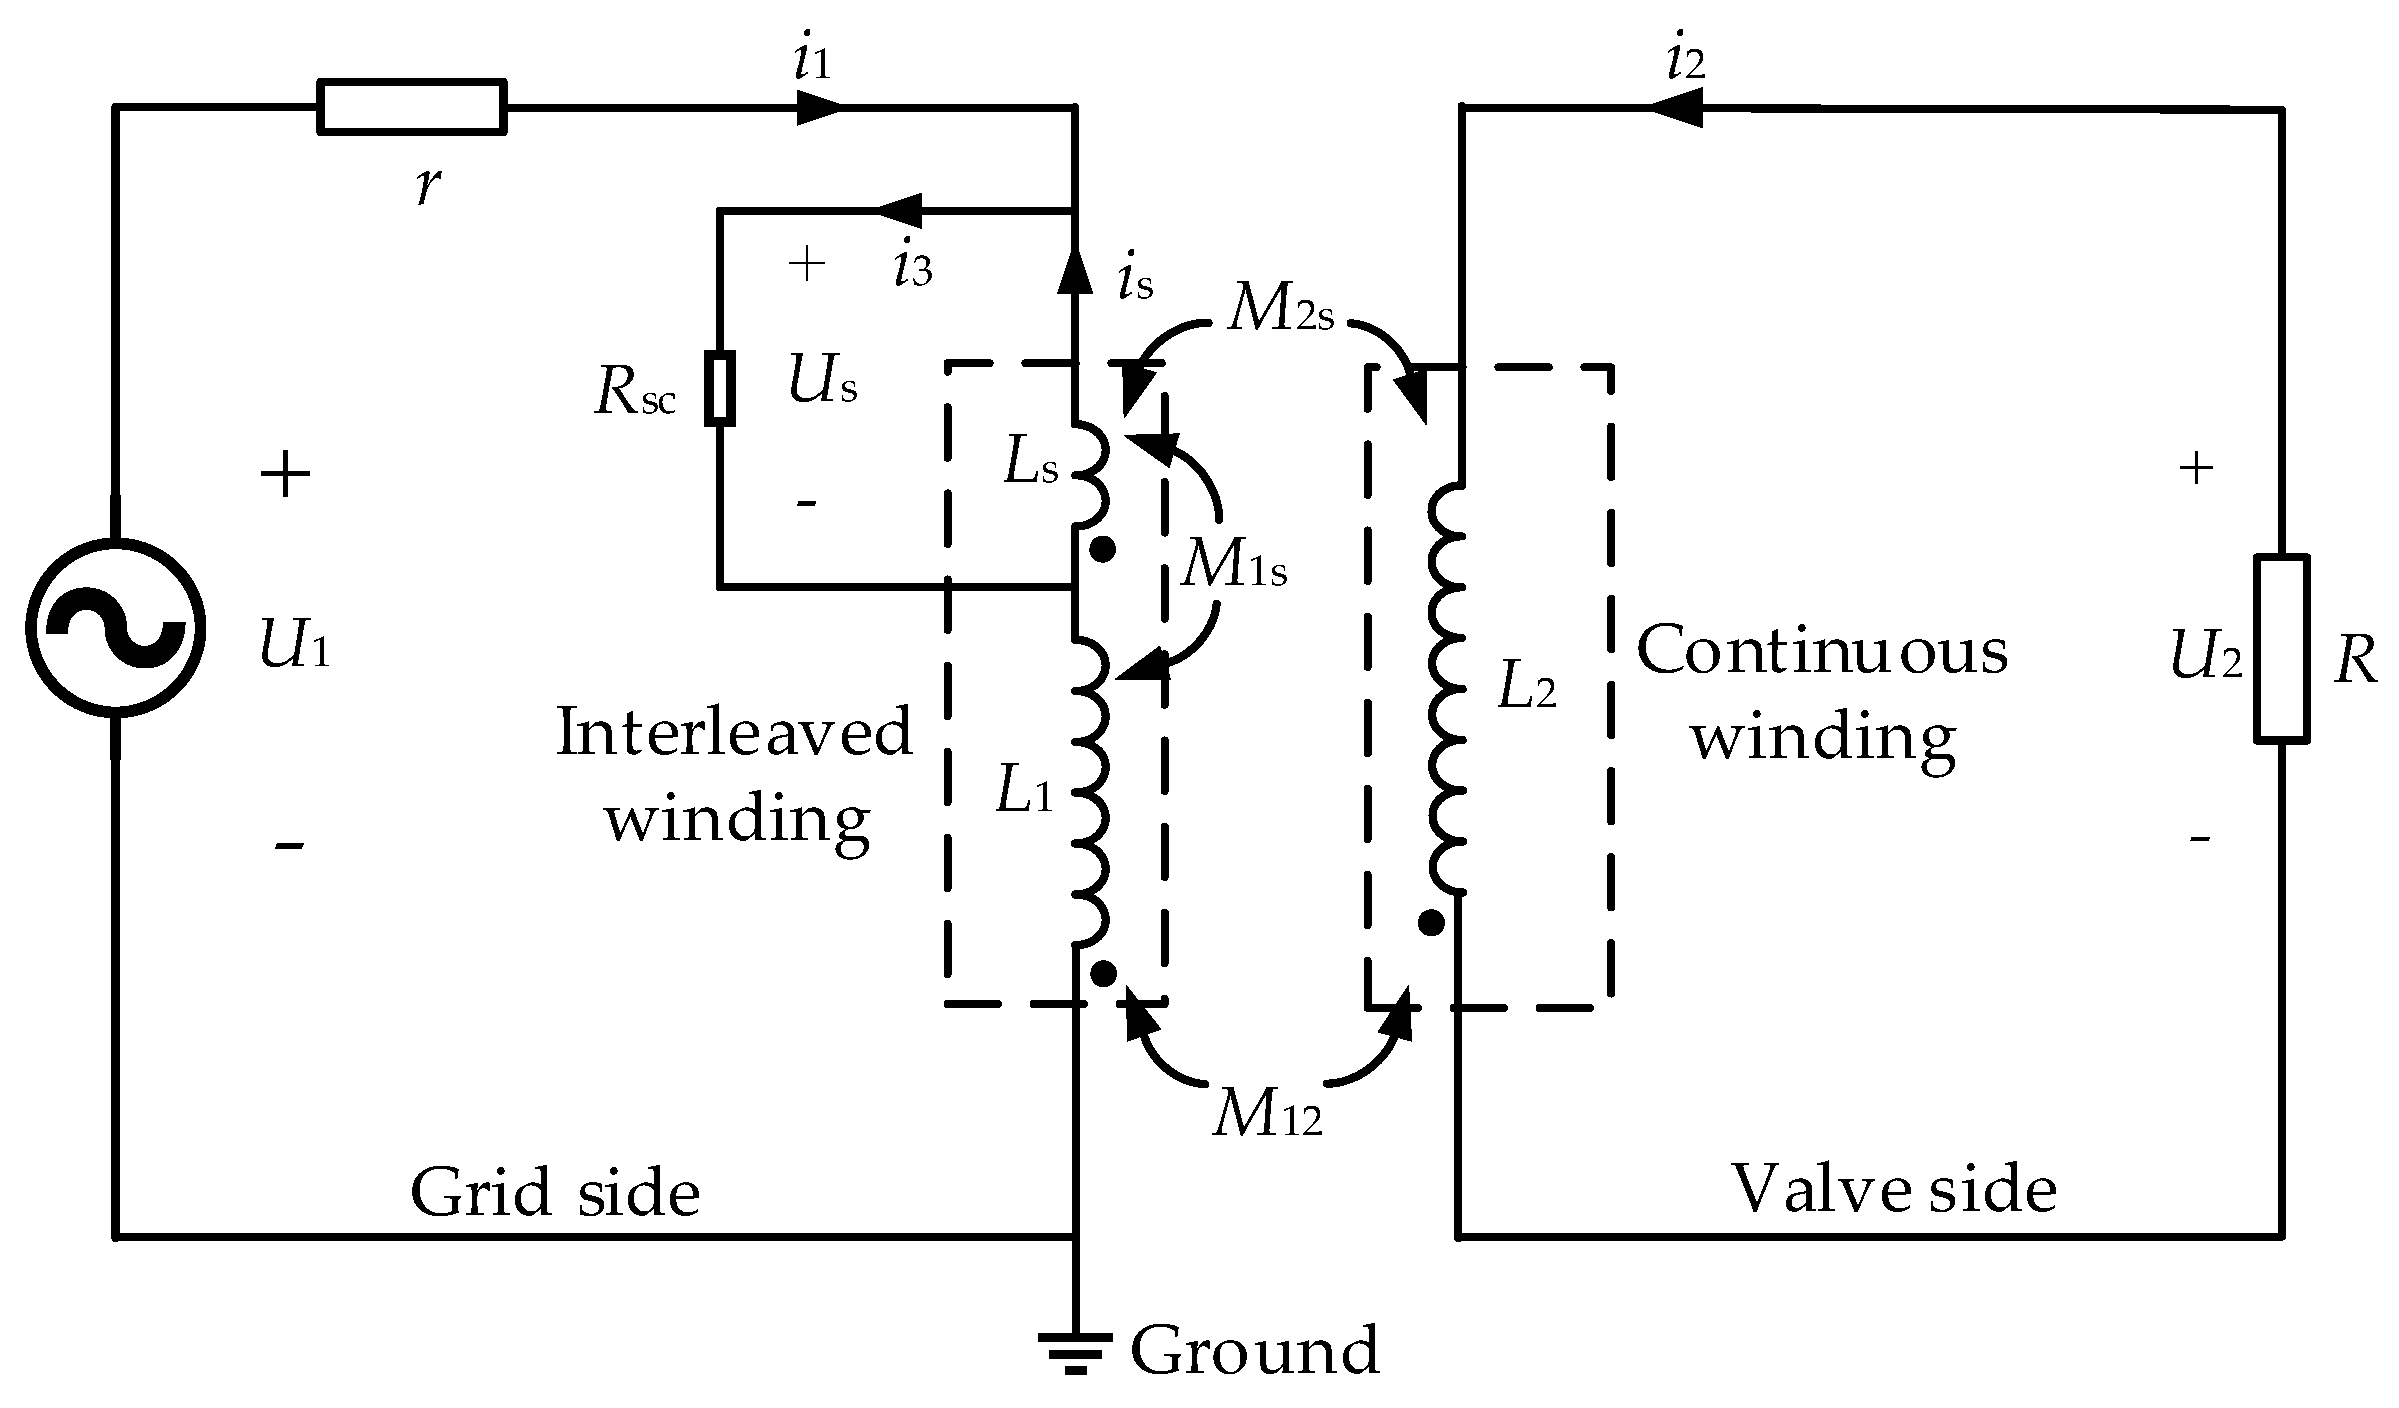
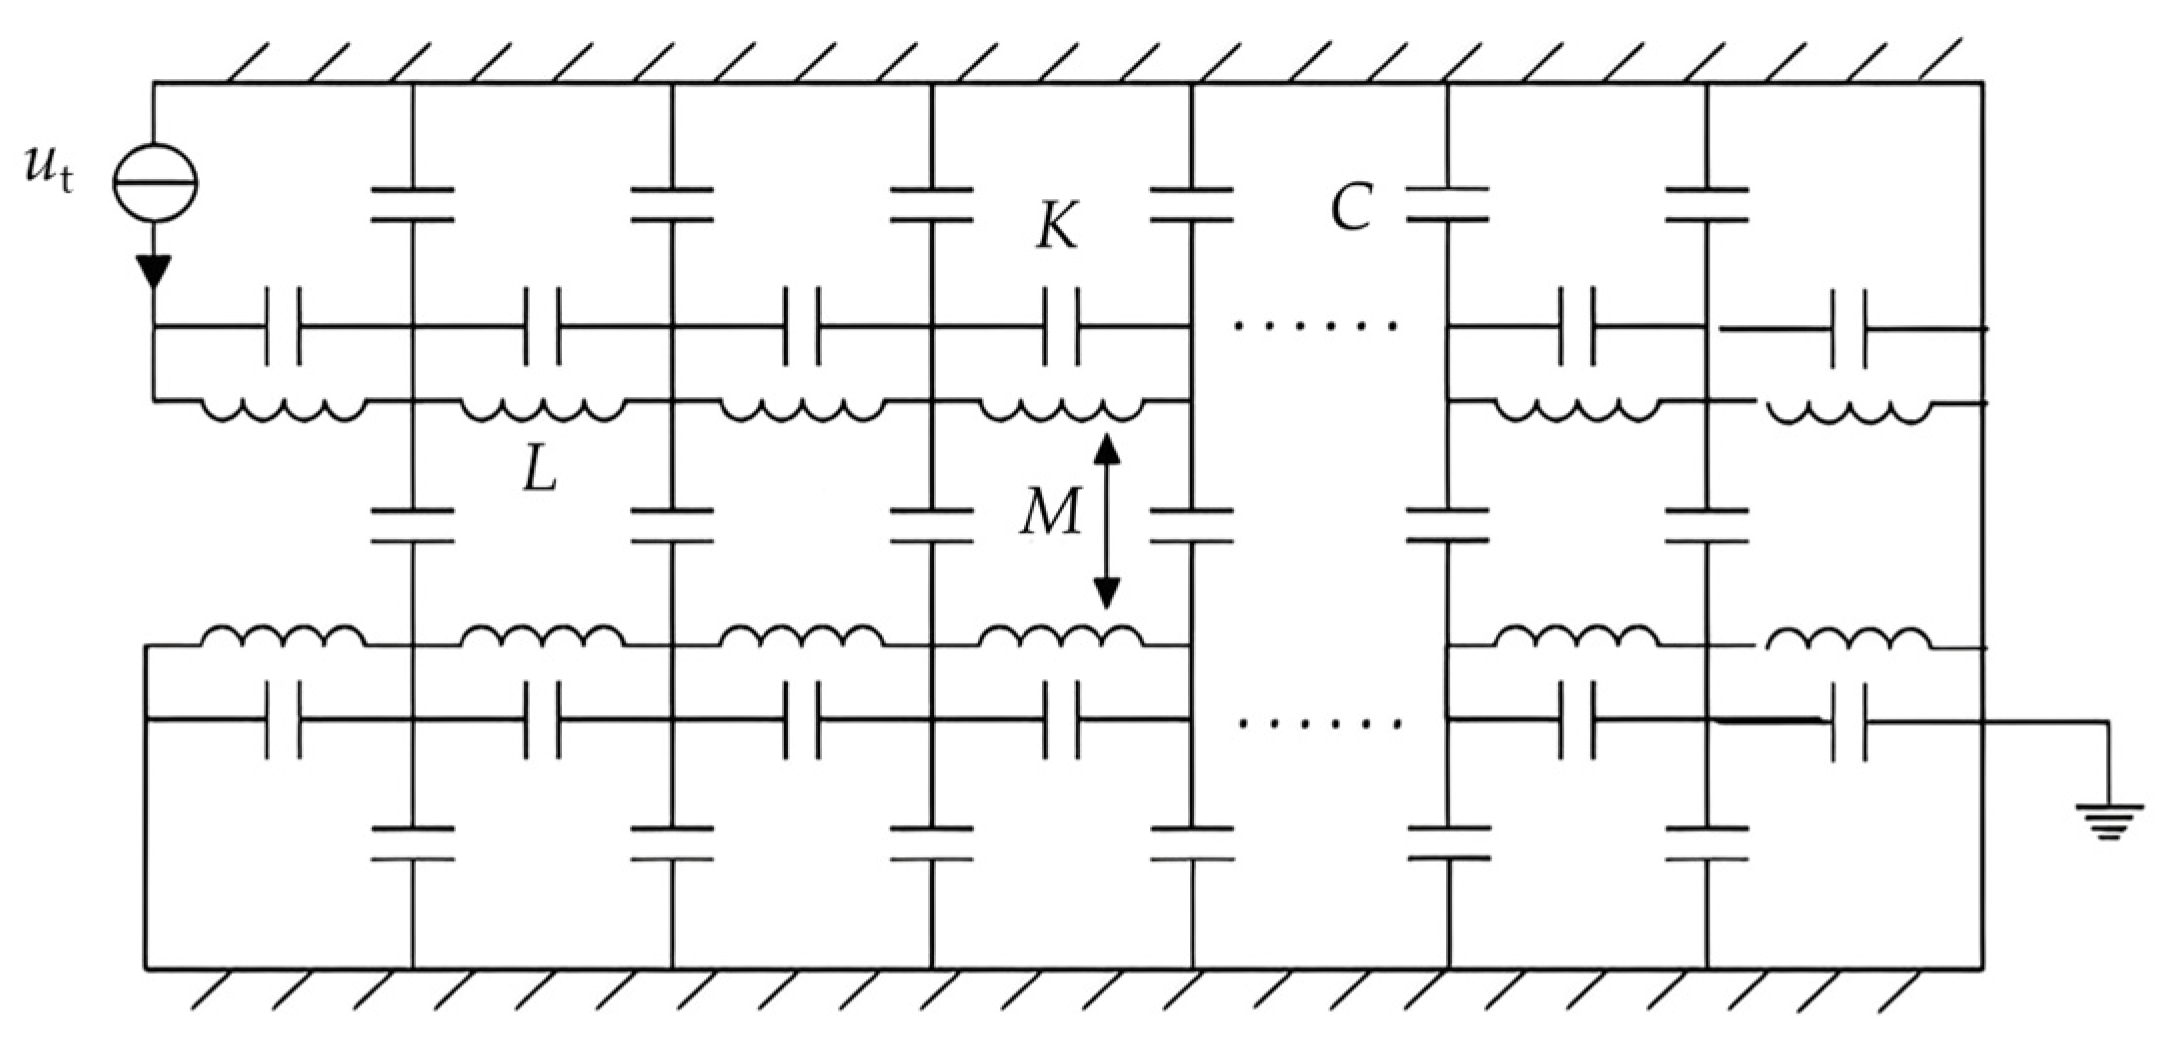
2.1. Equivalent Electromagnetic Coupling Model under Inter-Turn Short Circuit
2.2. Stress Calculation of Transformer Iron Core and Winding
2.3. Analysis of Acoustic Field
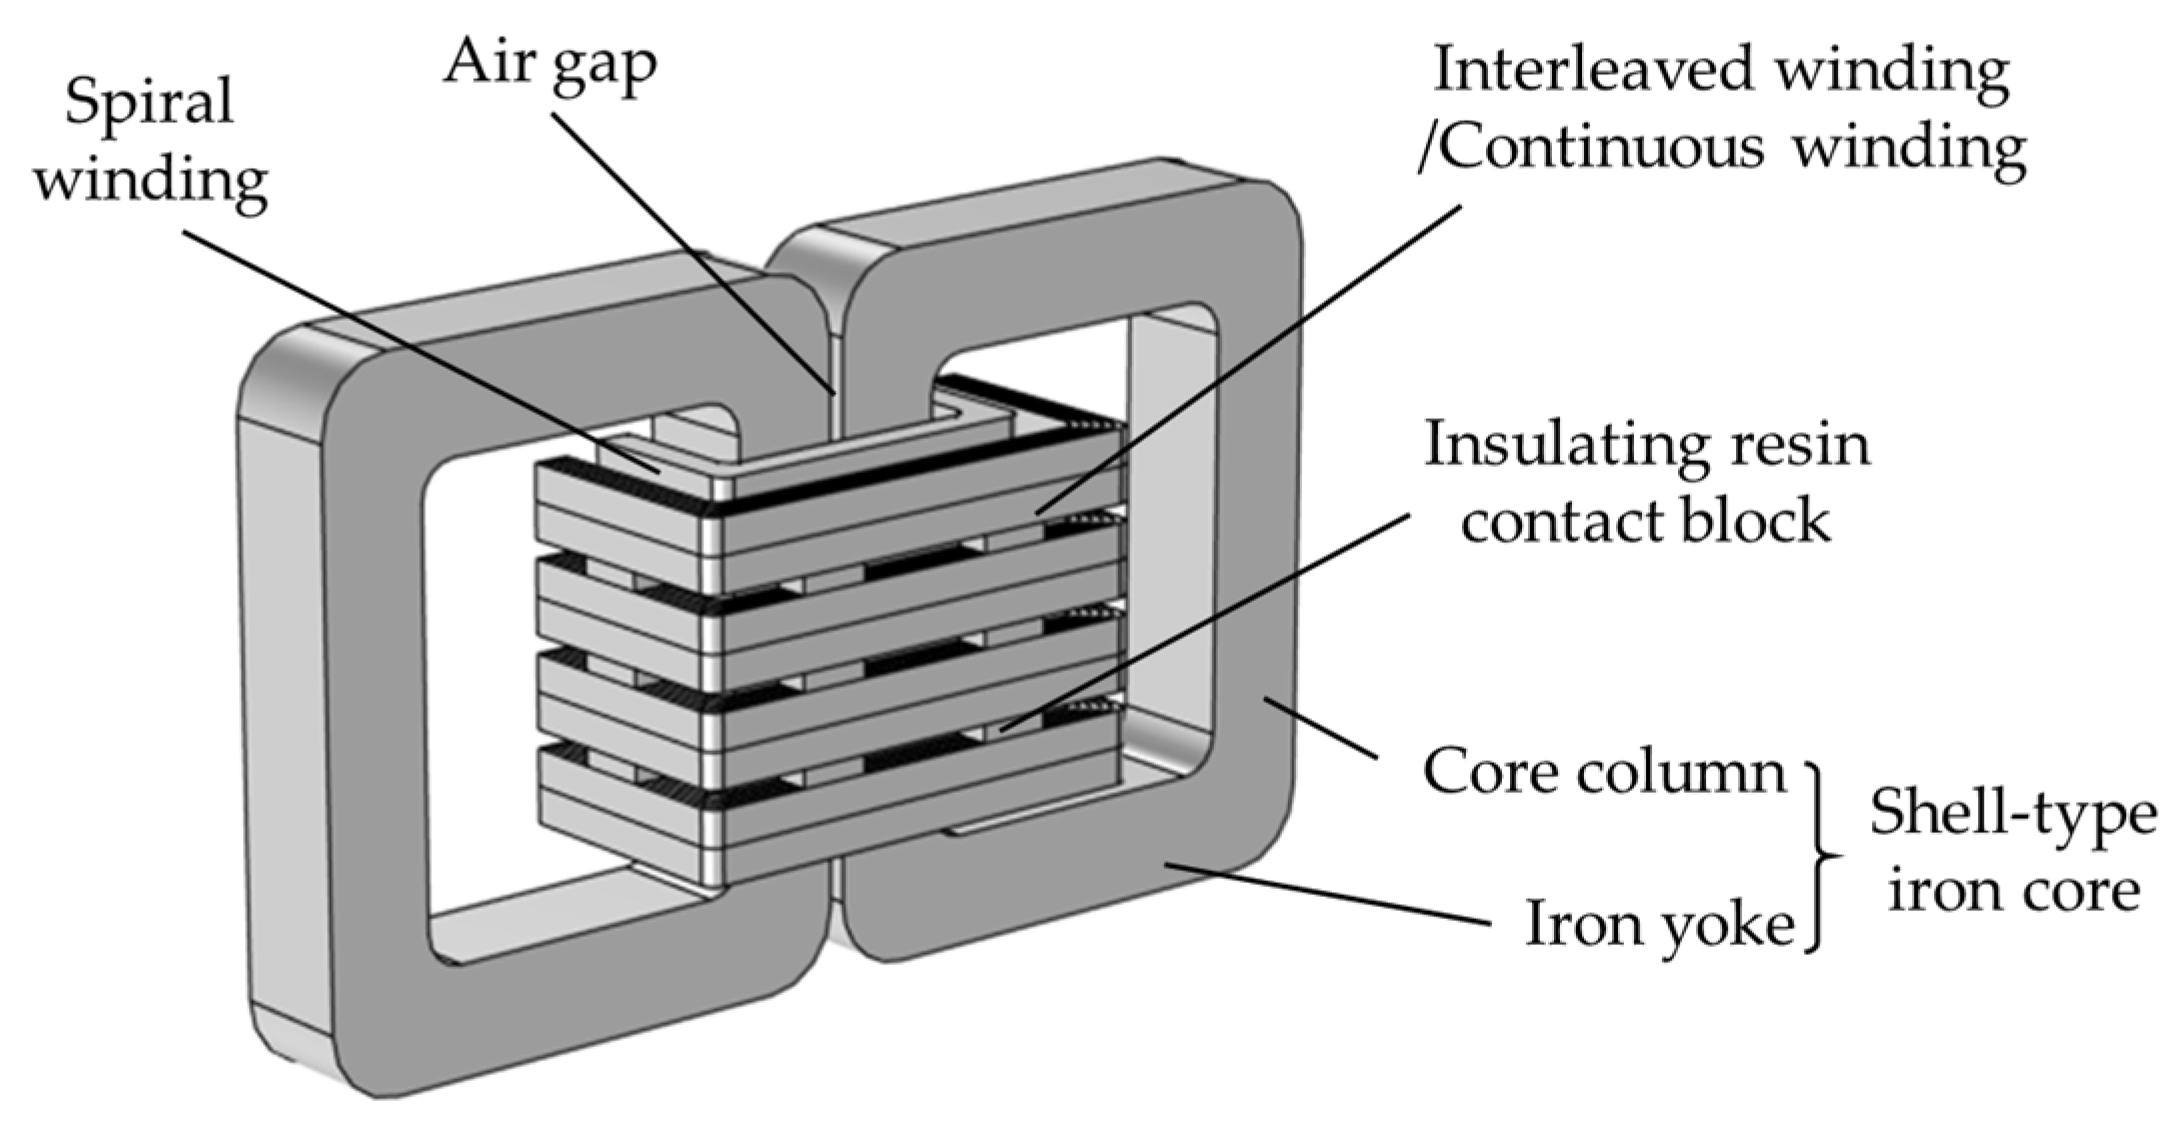
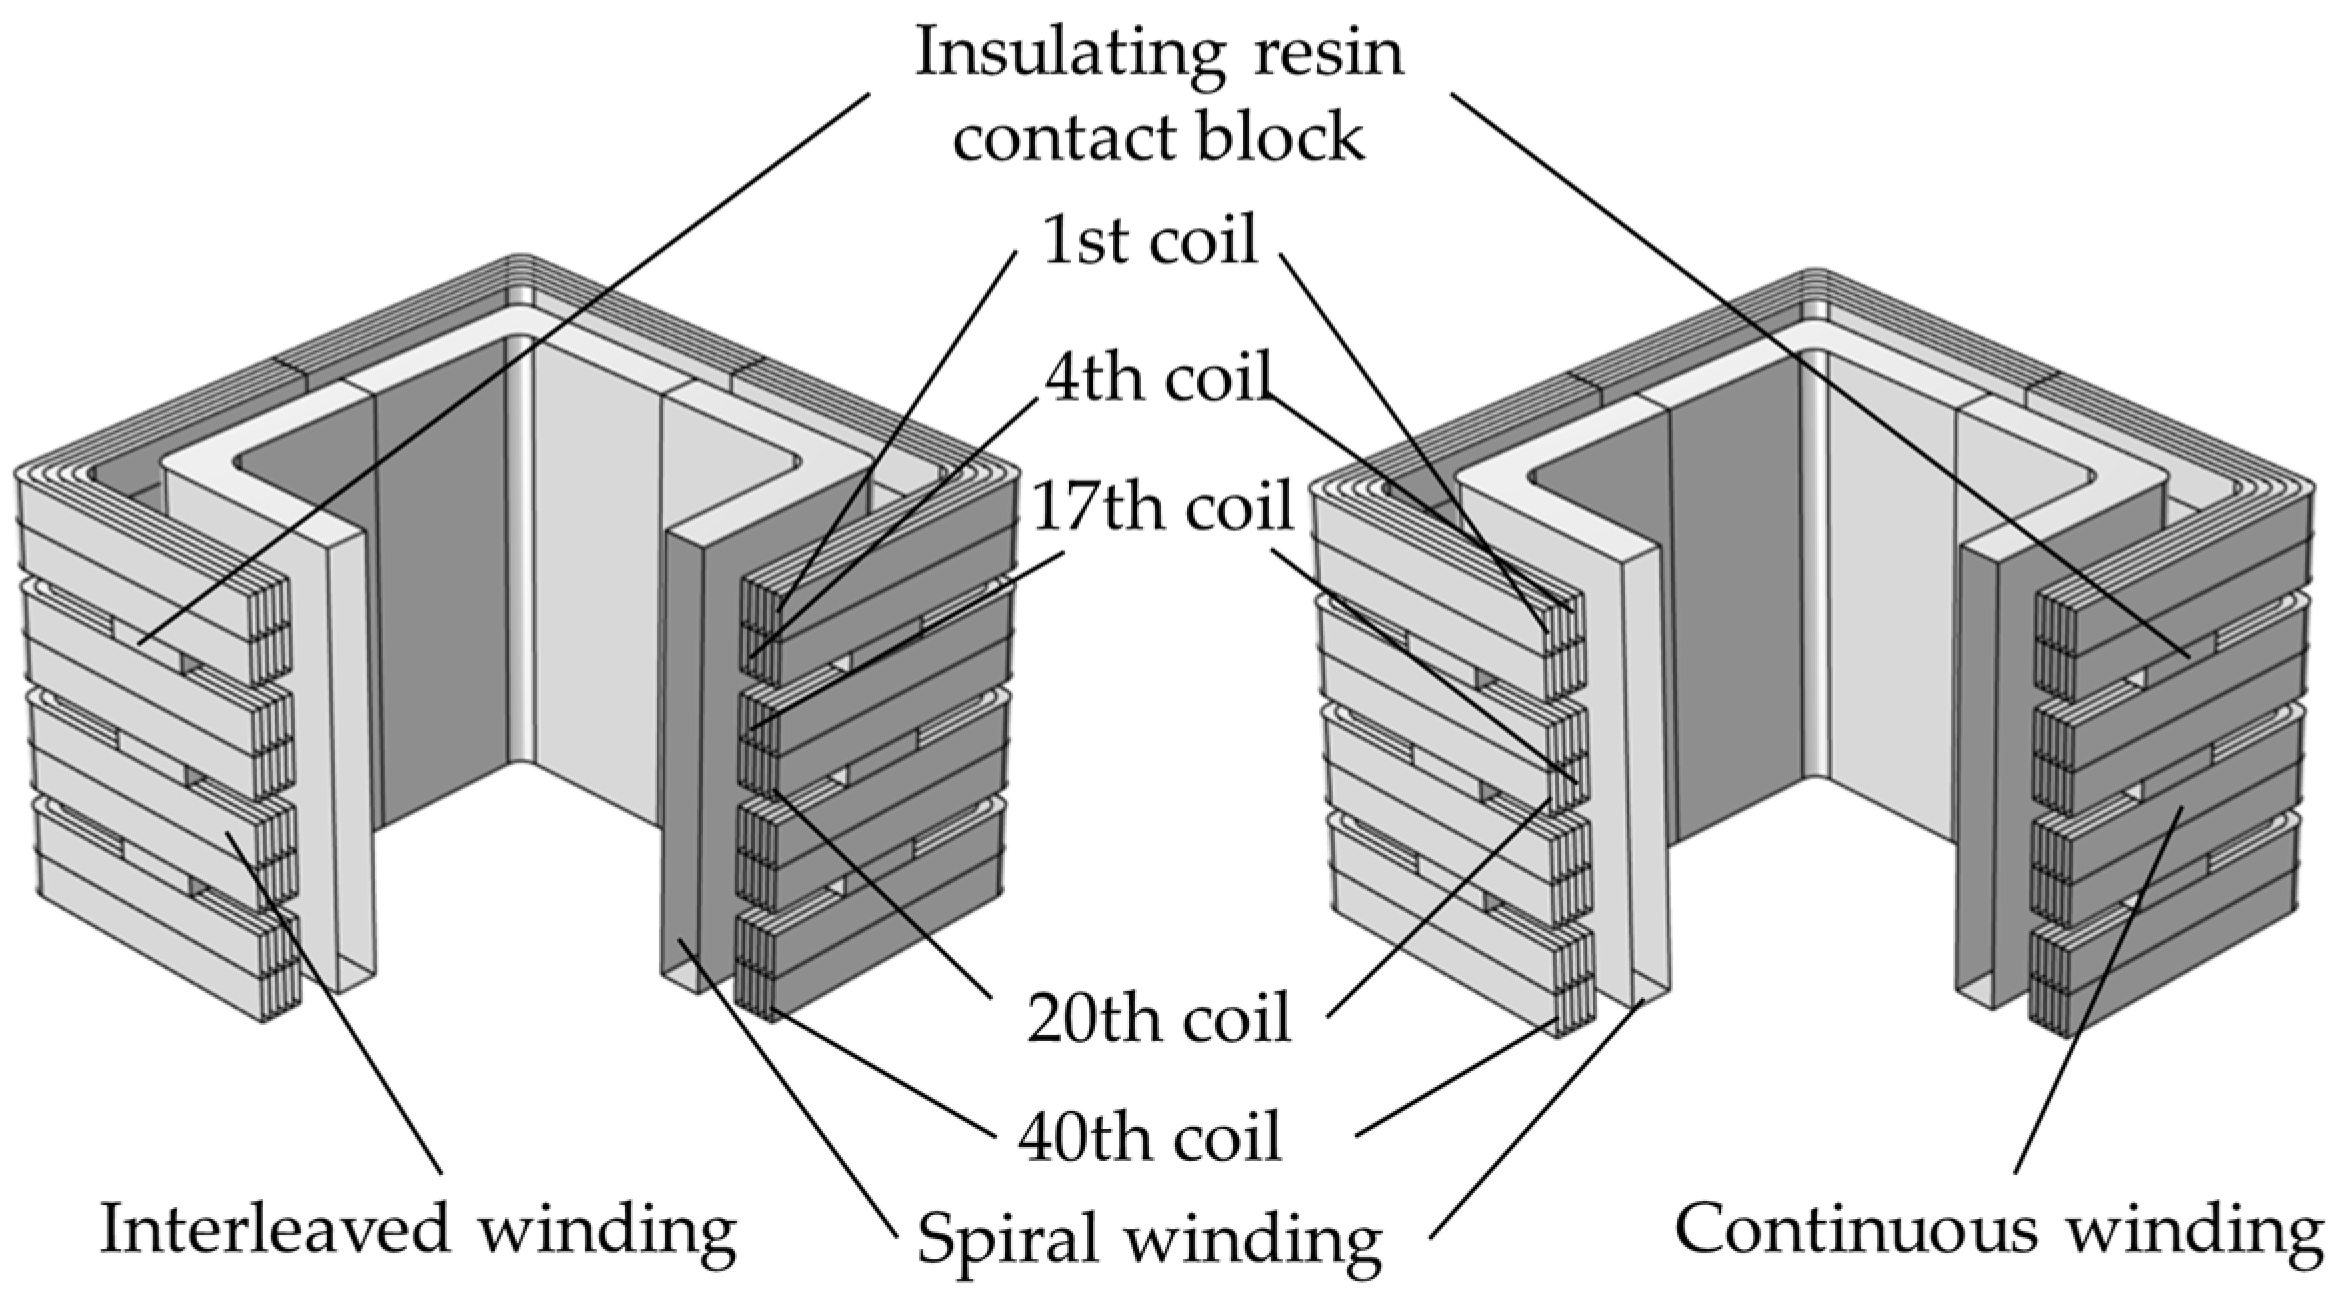
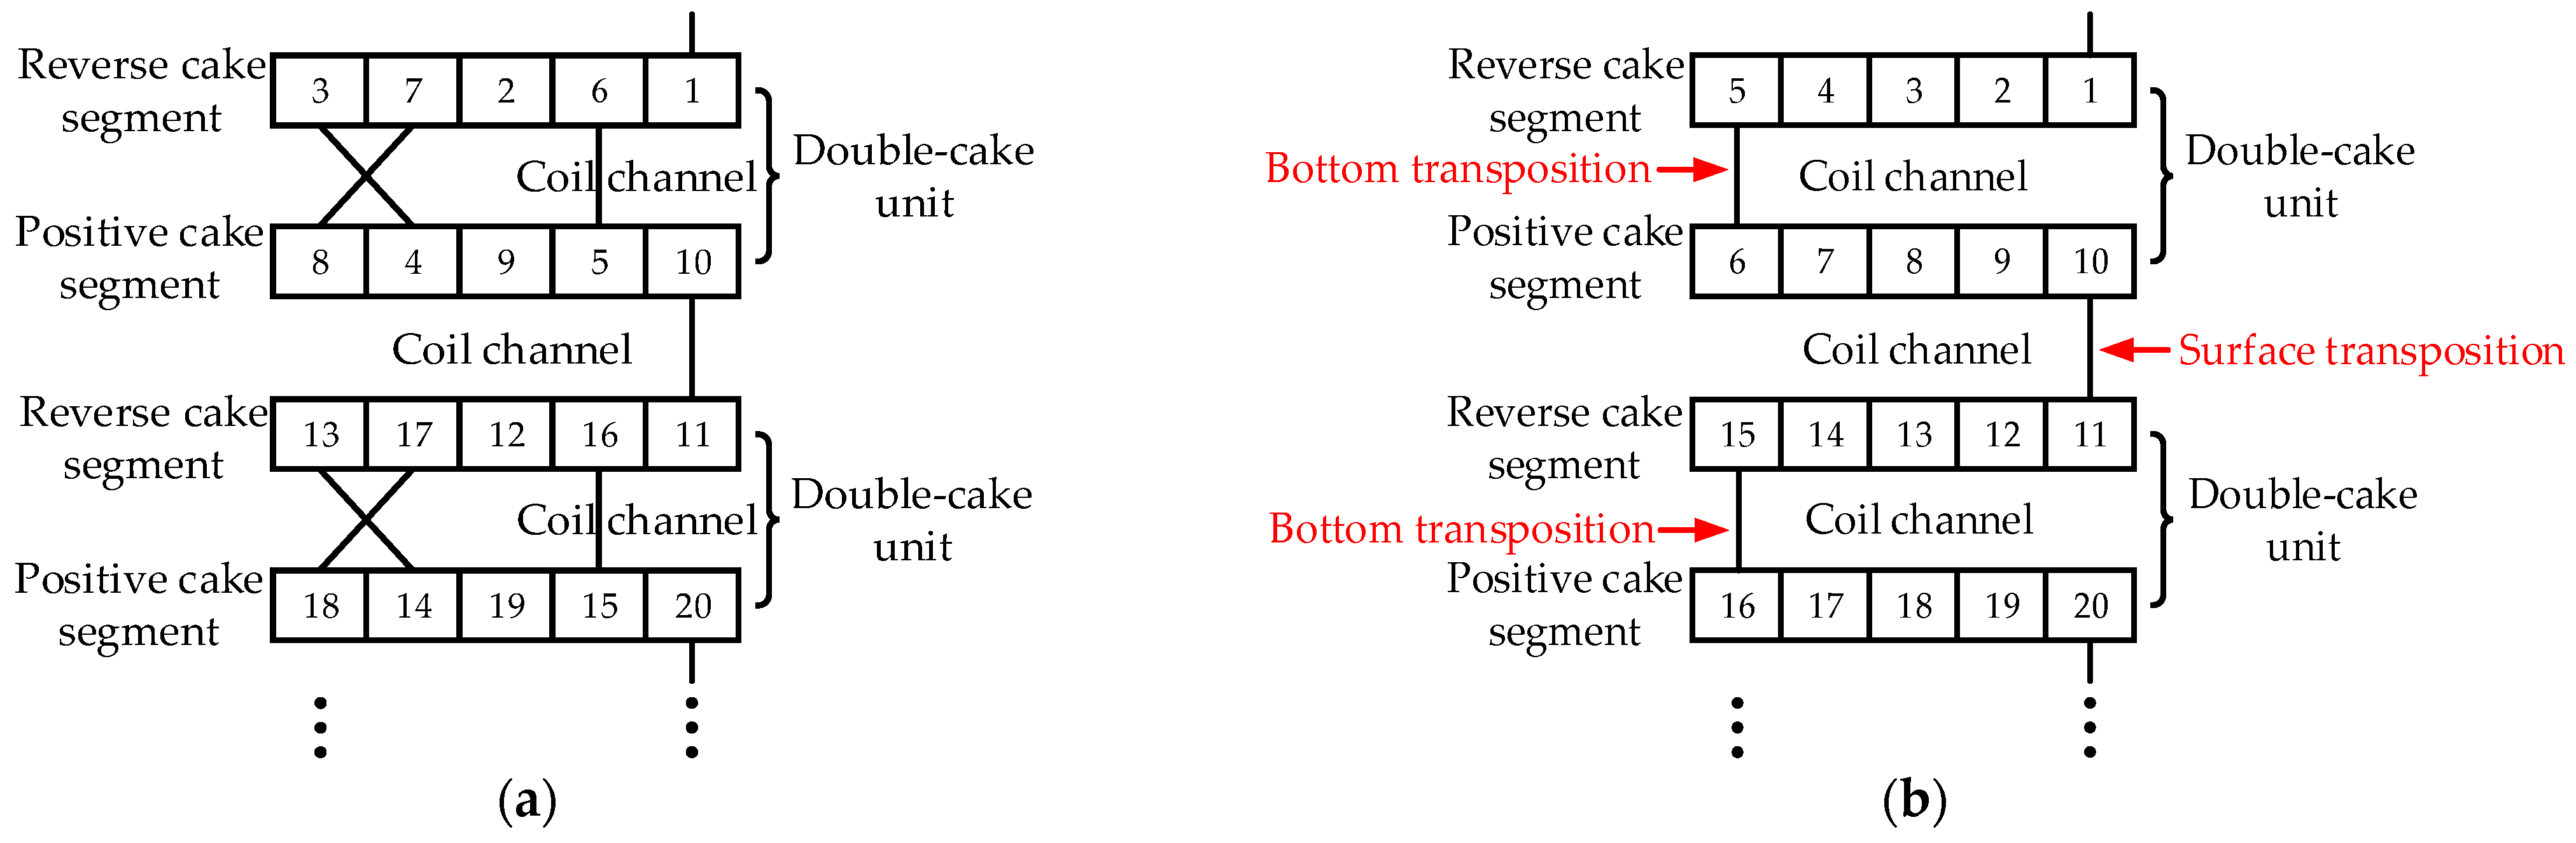
3. Modeling of High Frequency Transformer
4. Analysis of Vibration and Noise Characteristics under Inter-Turn Short Circuits
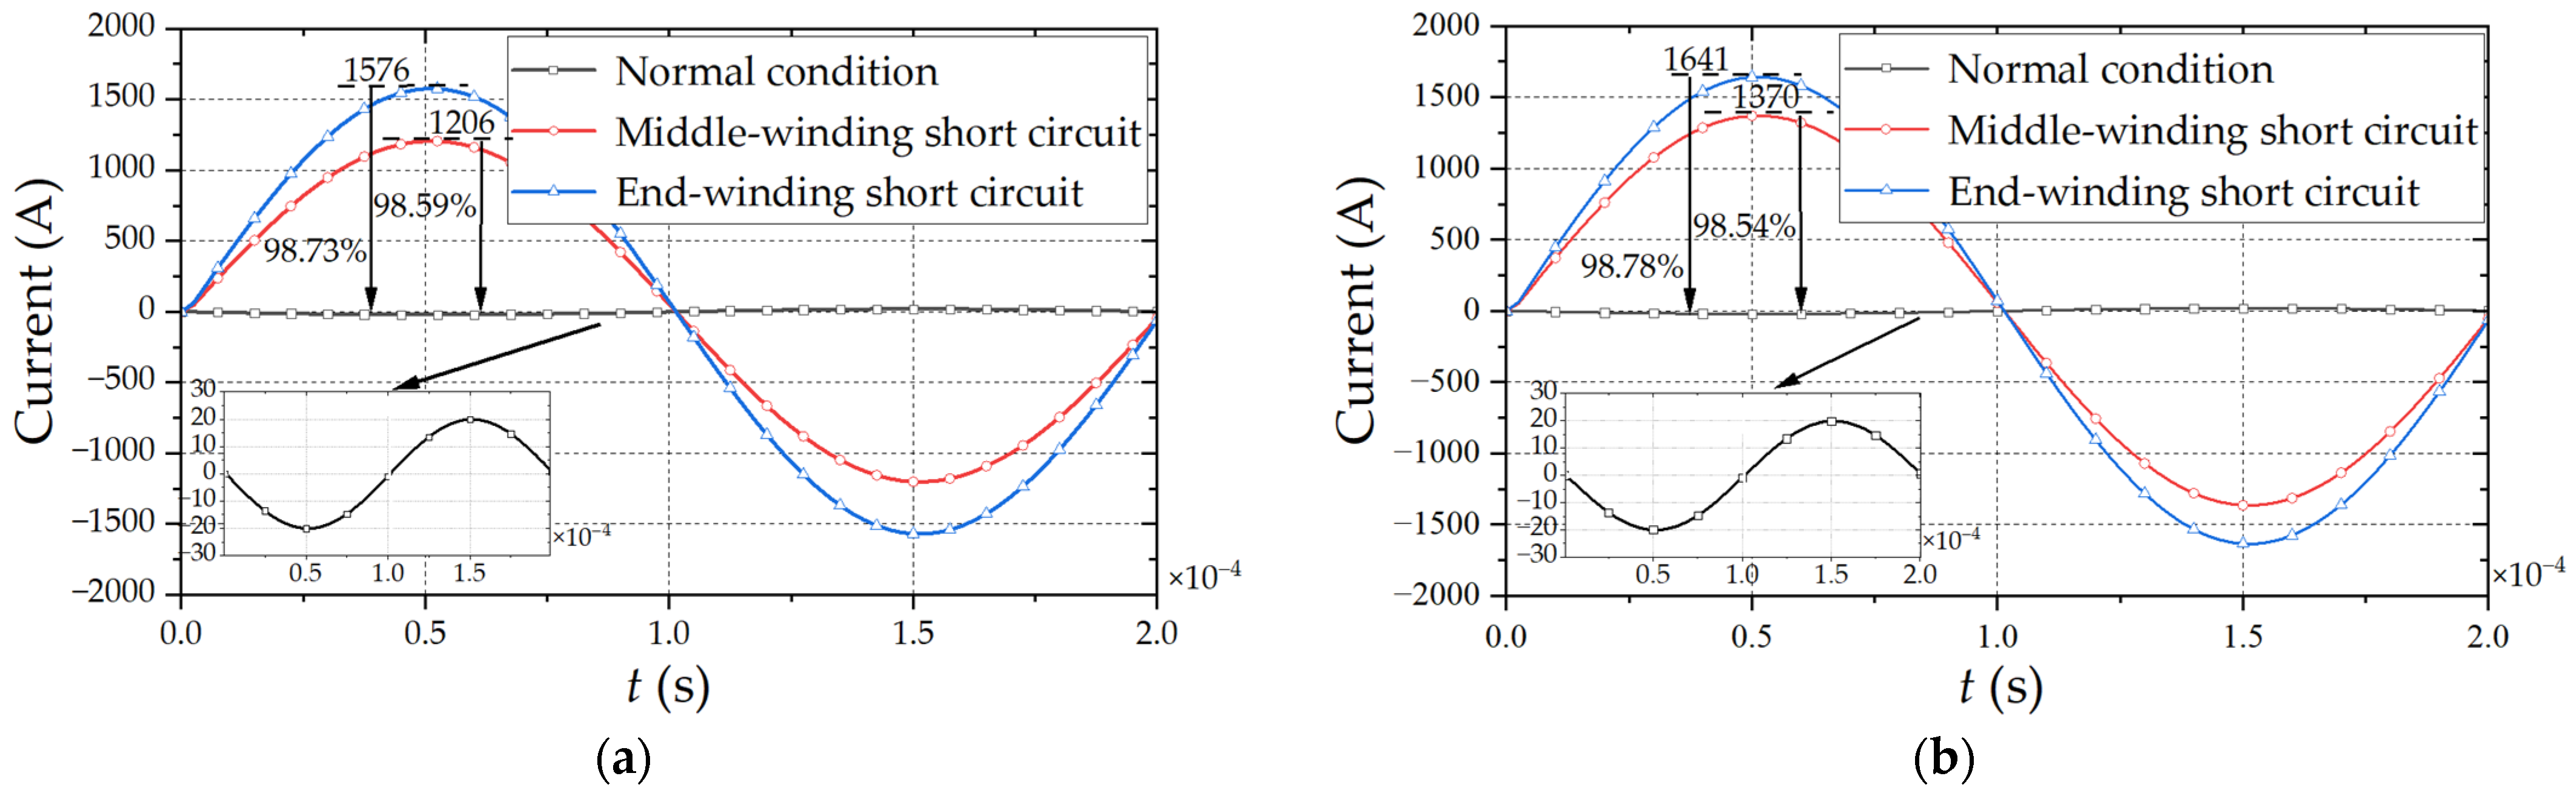
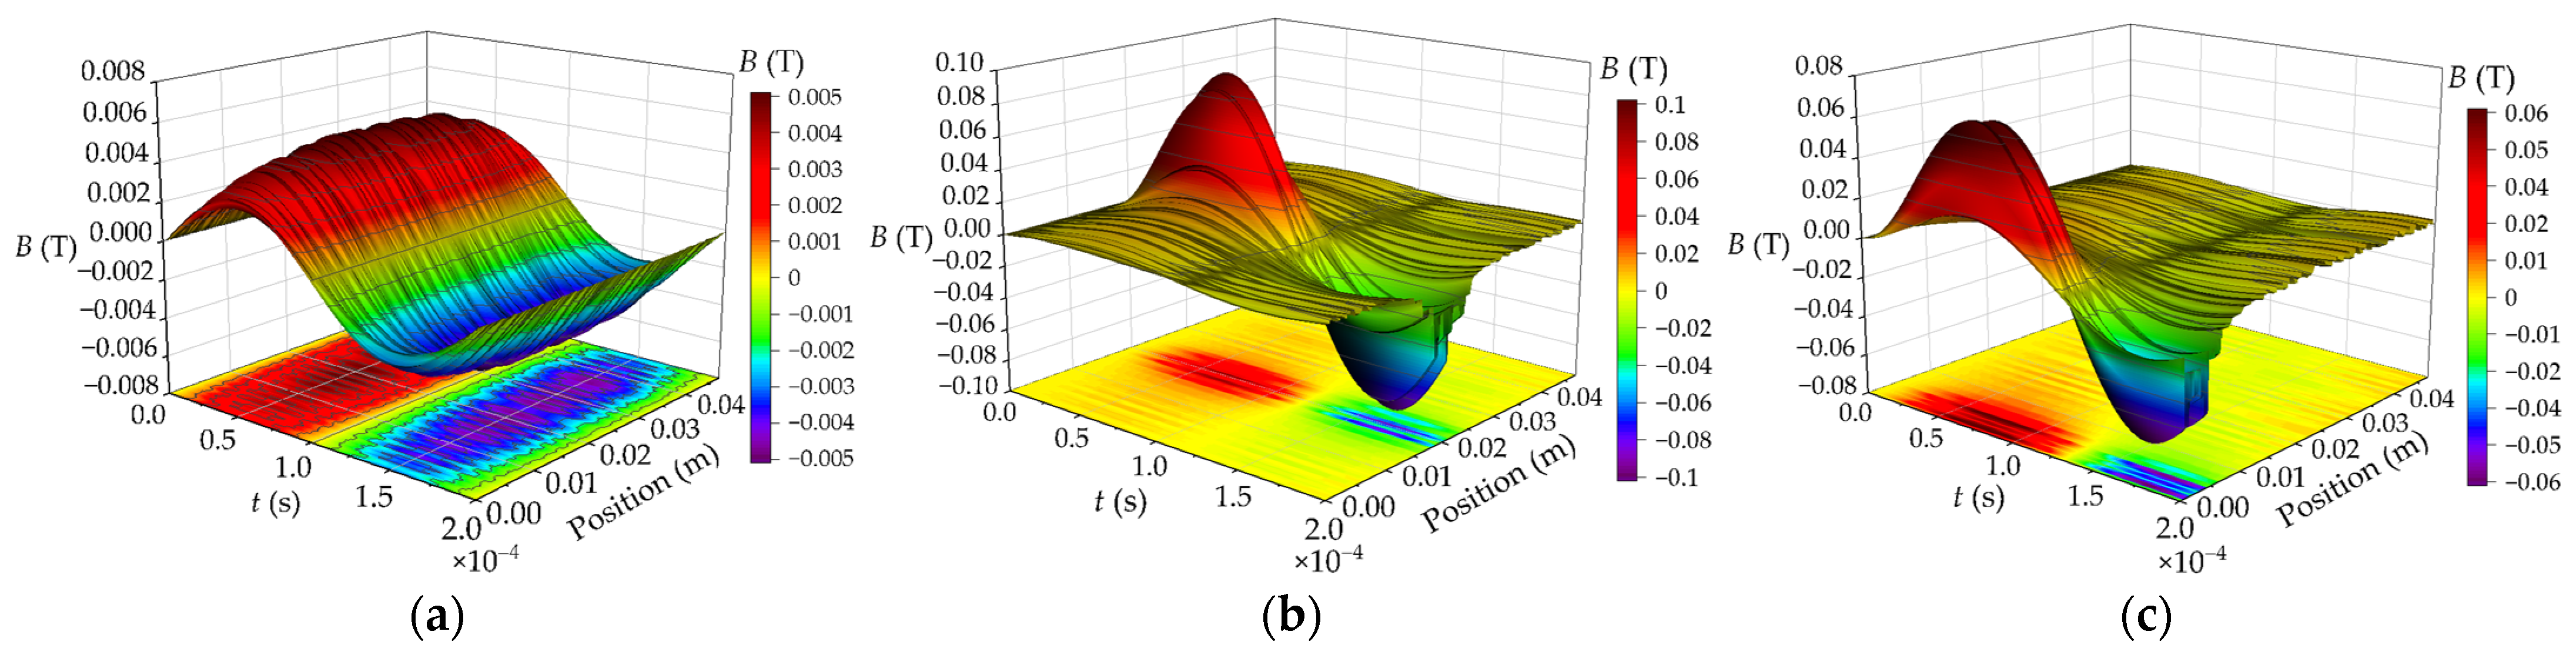
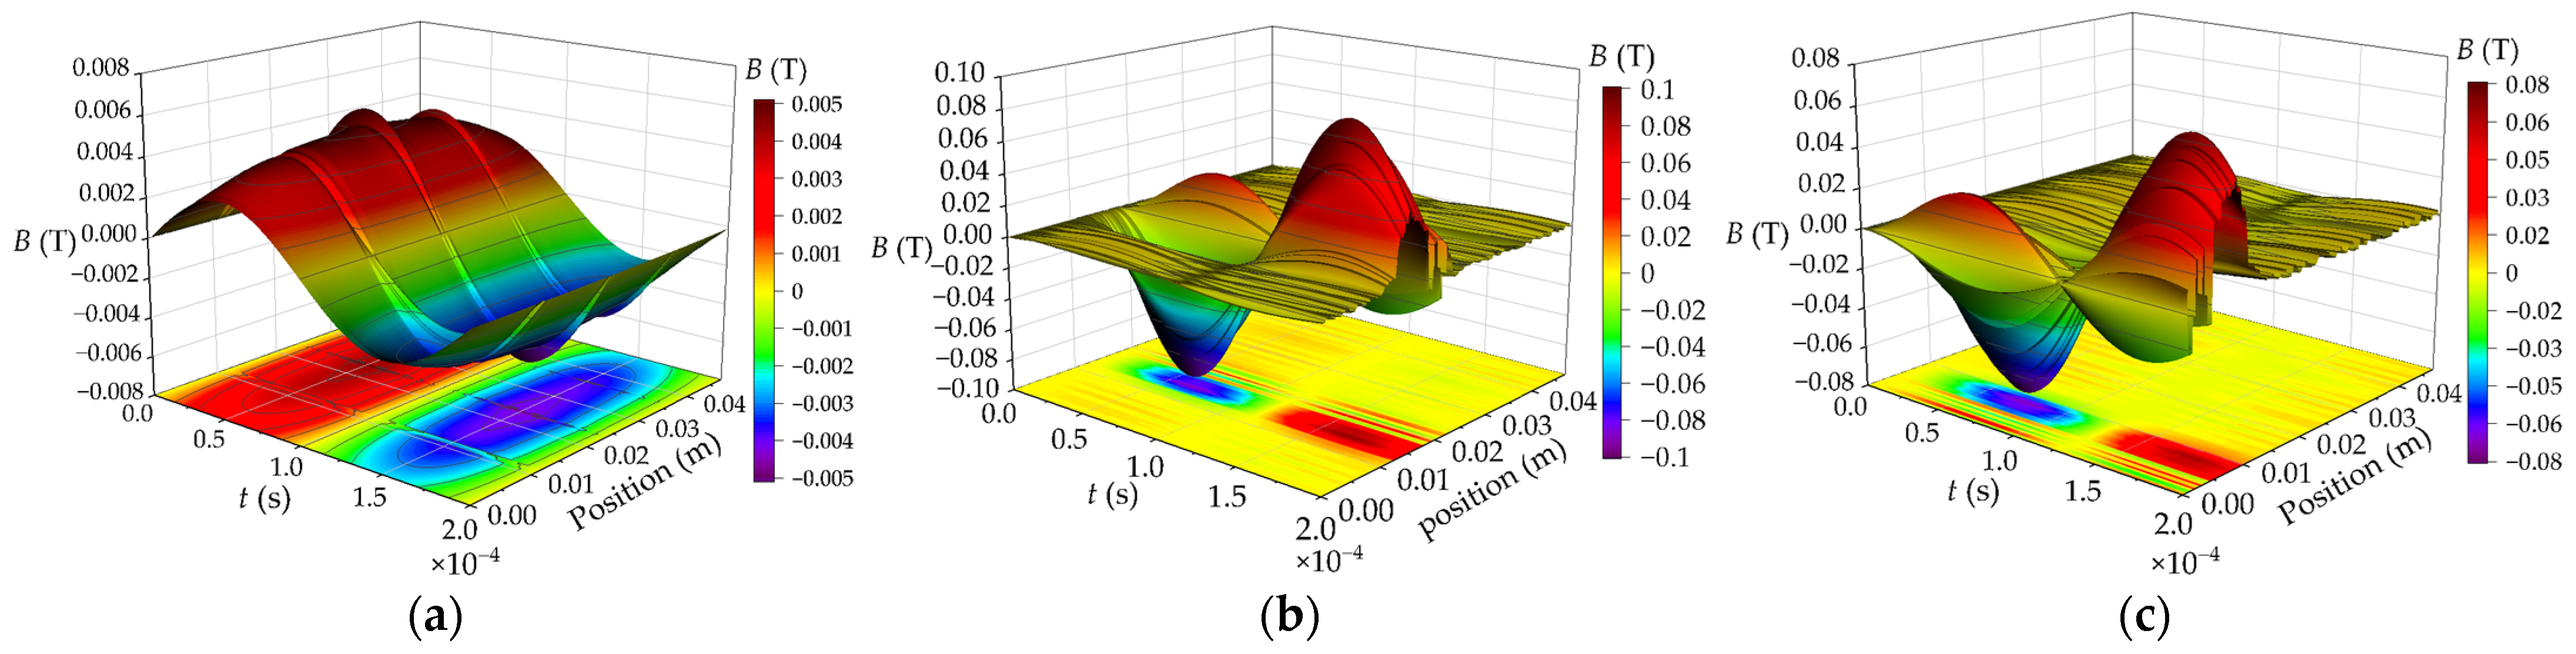
4.1. Analysis of Short-Circuit Current and Axial Magnetic Flux Leakage
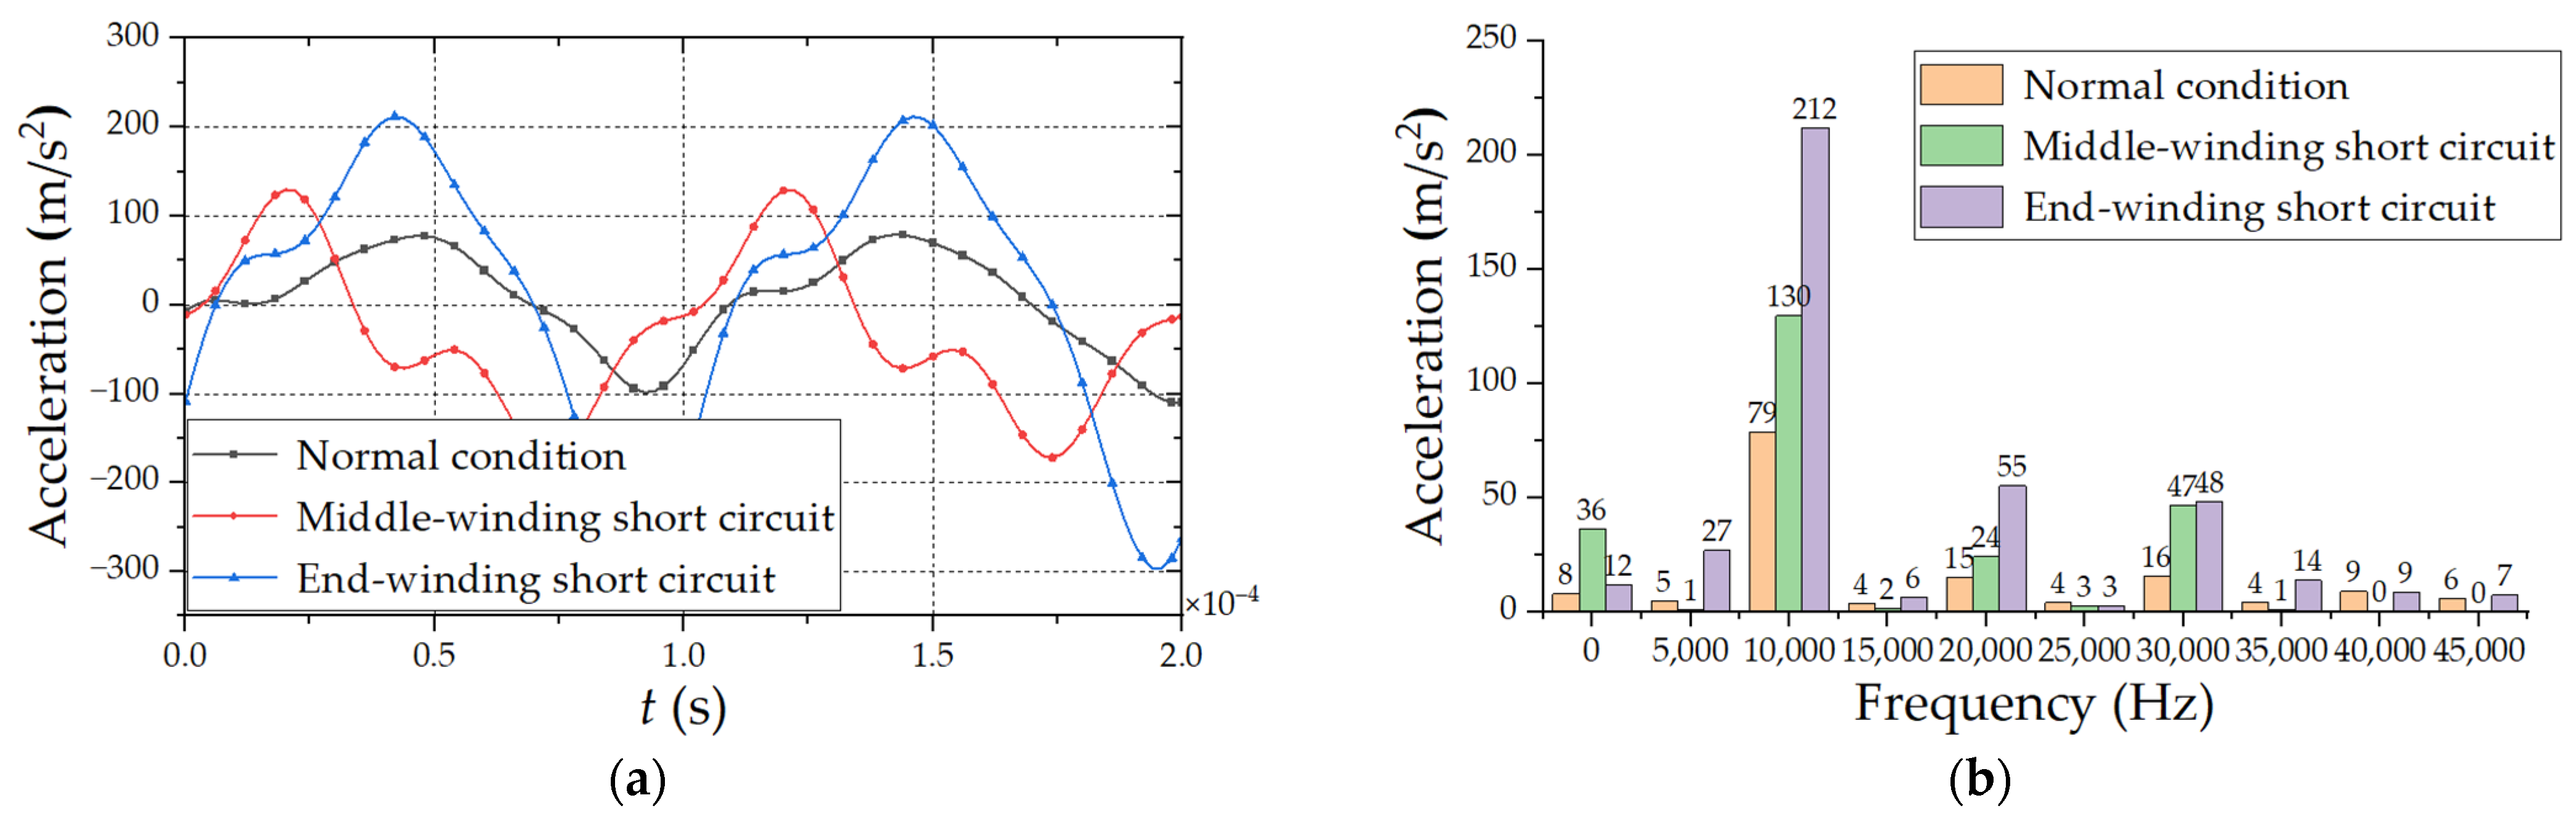
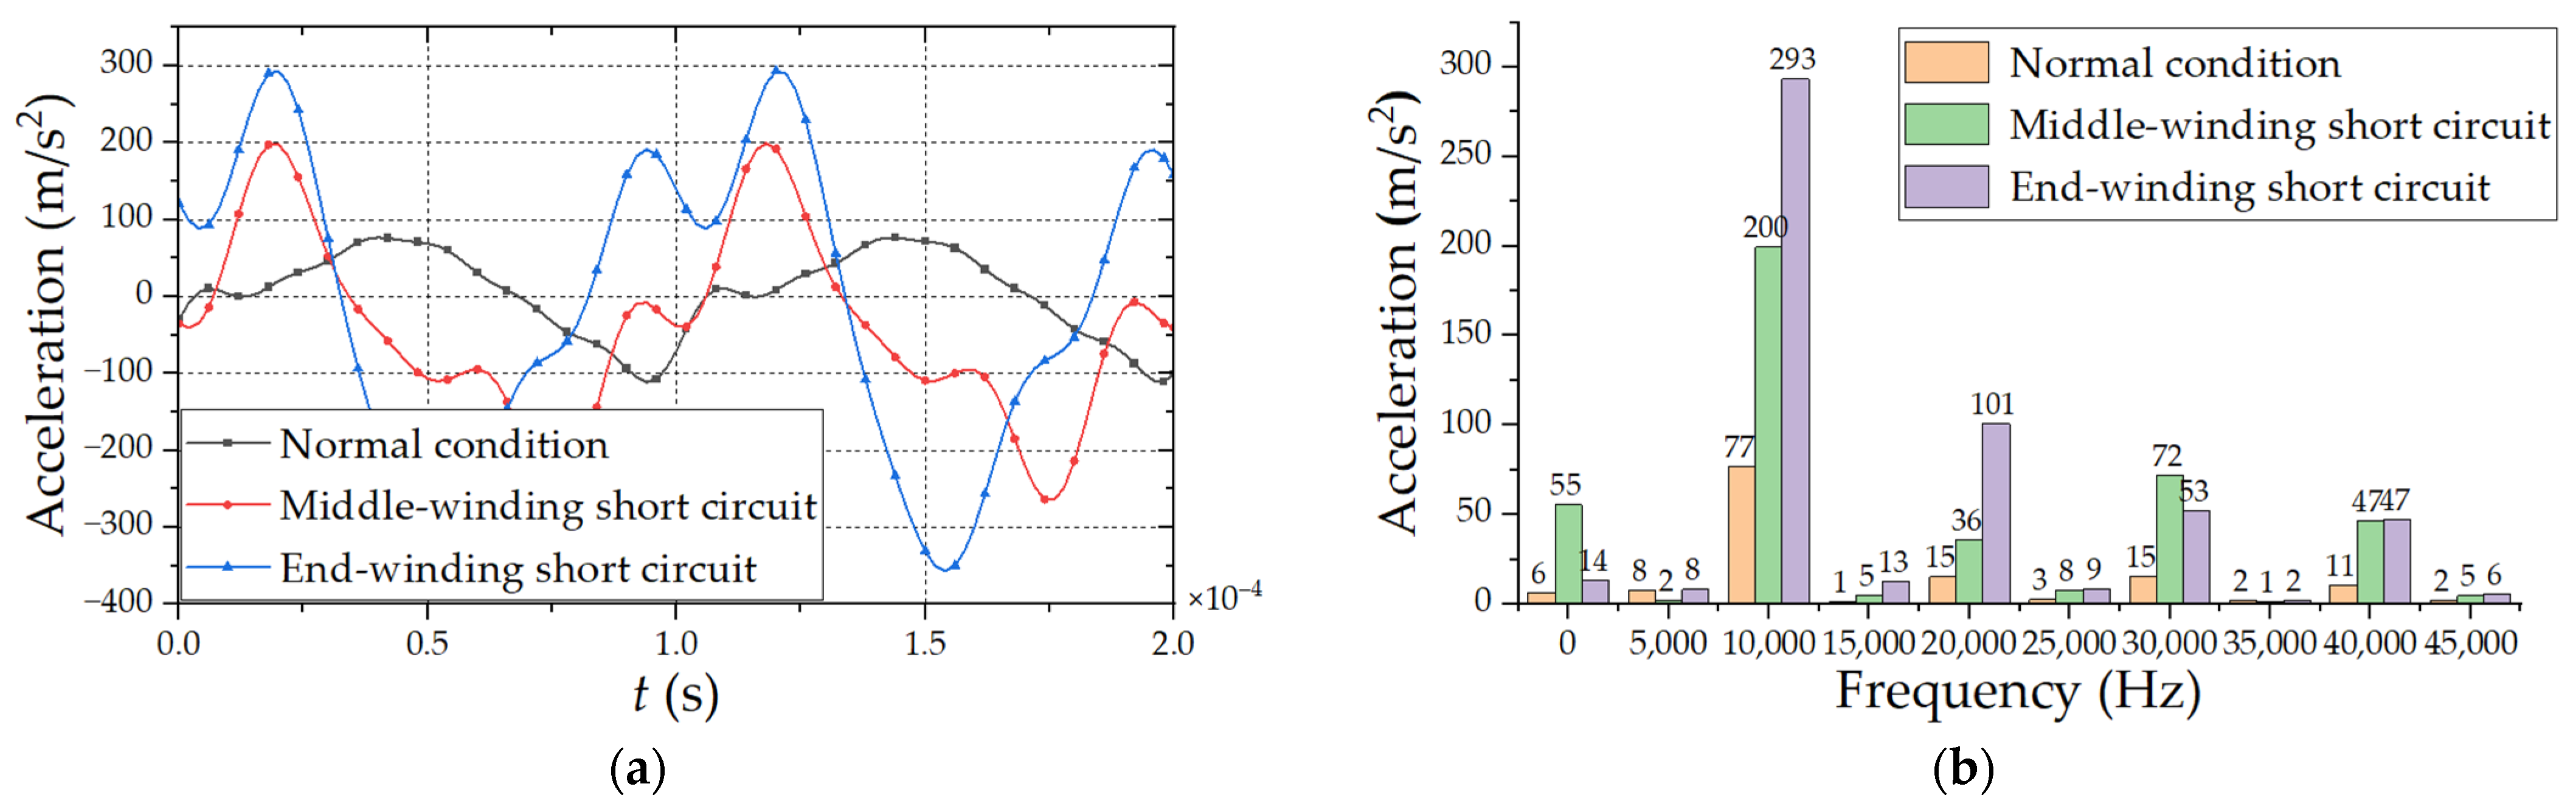
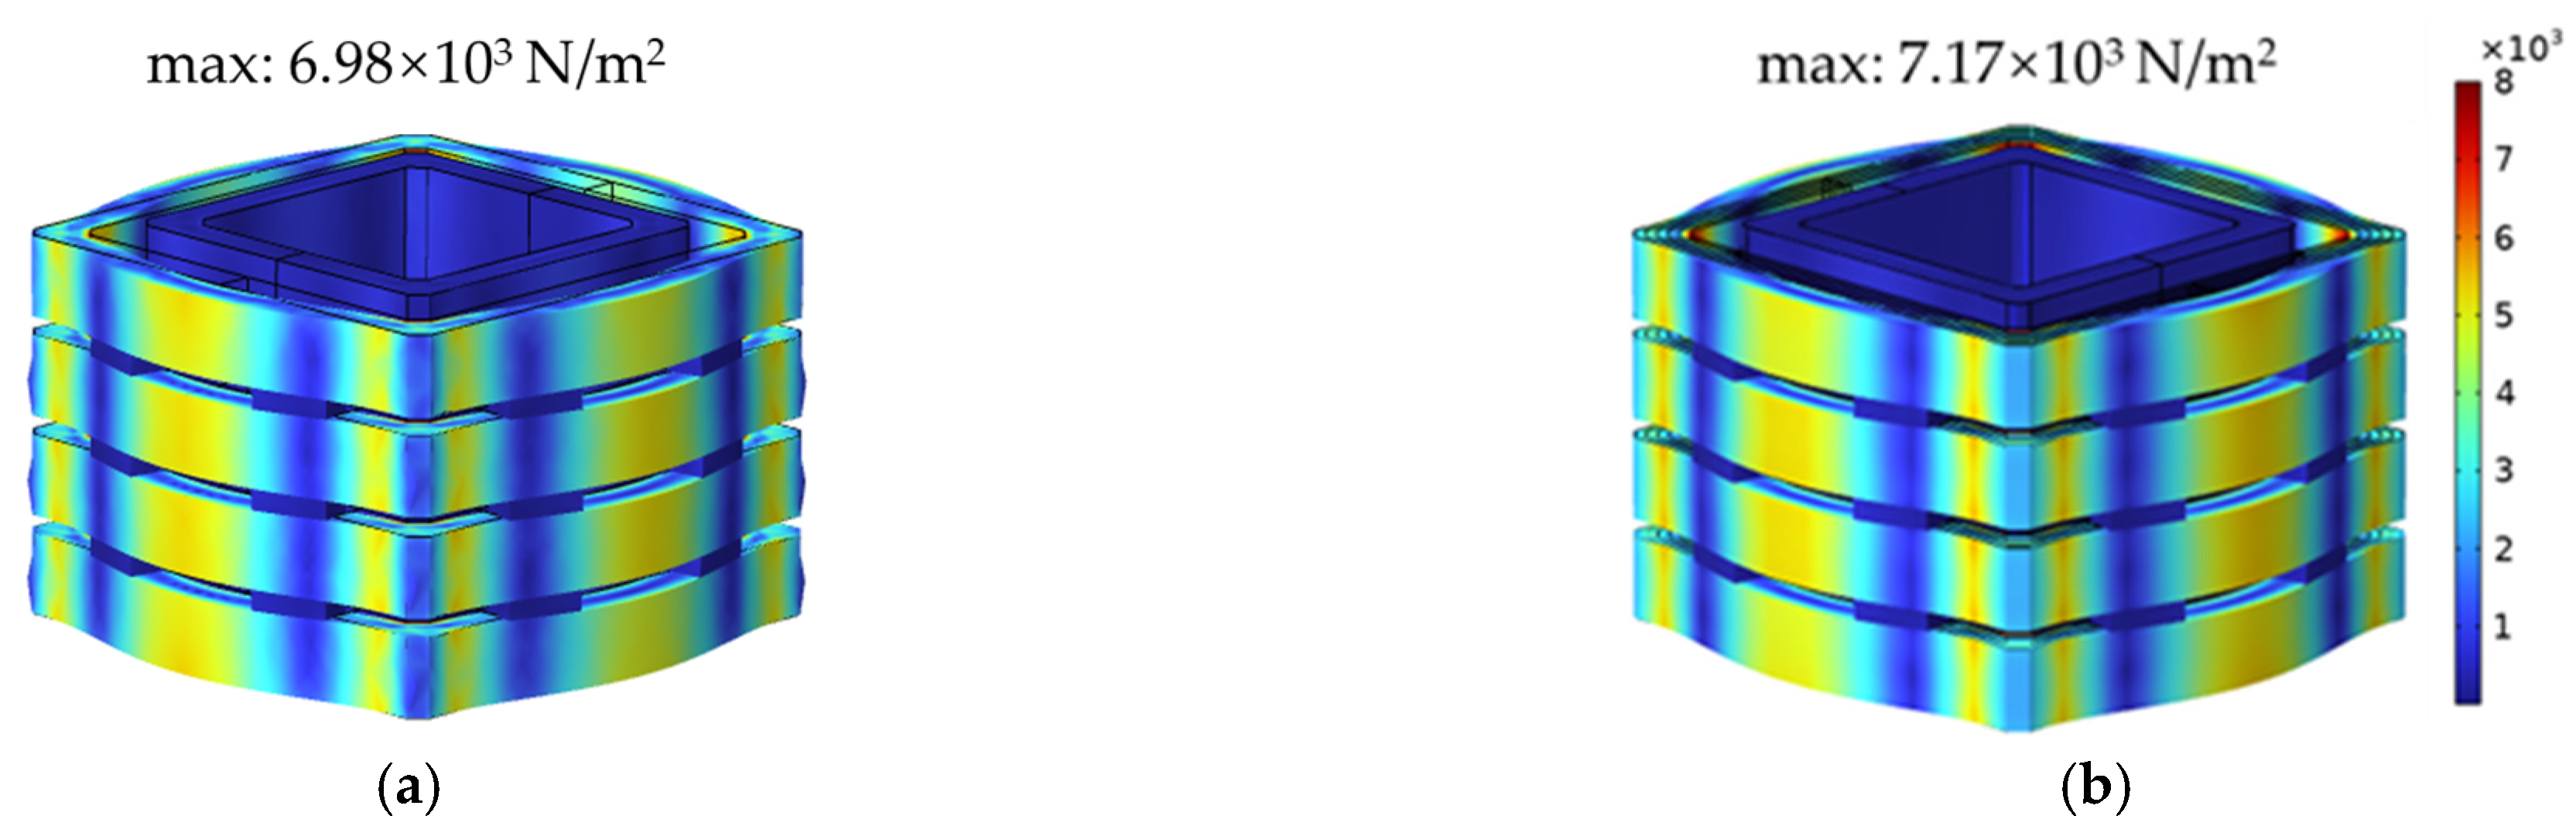
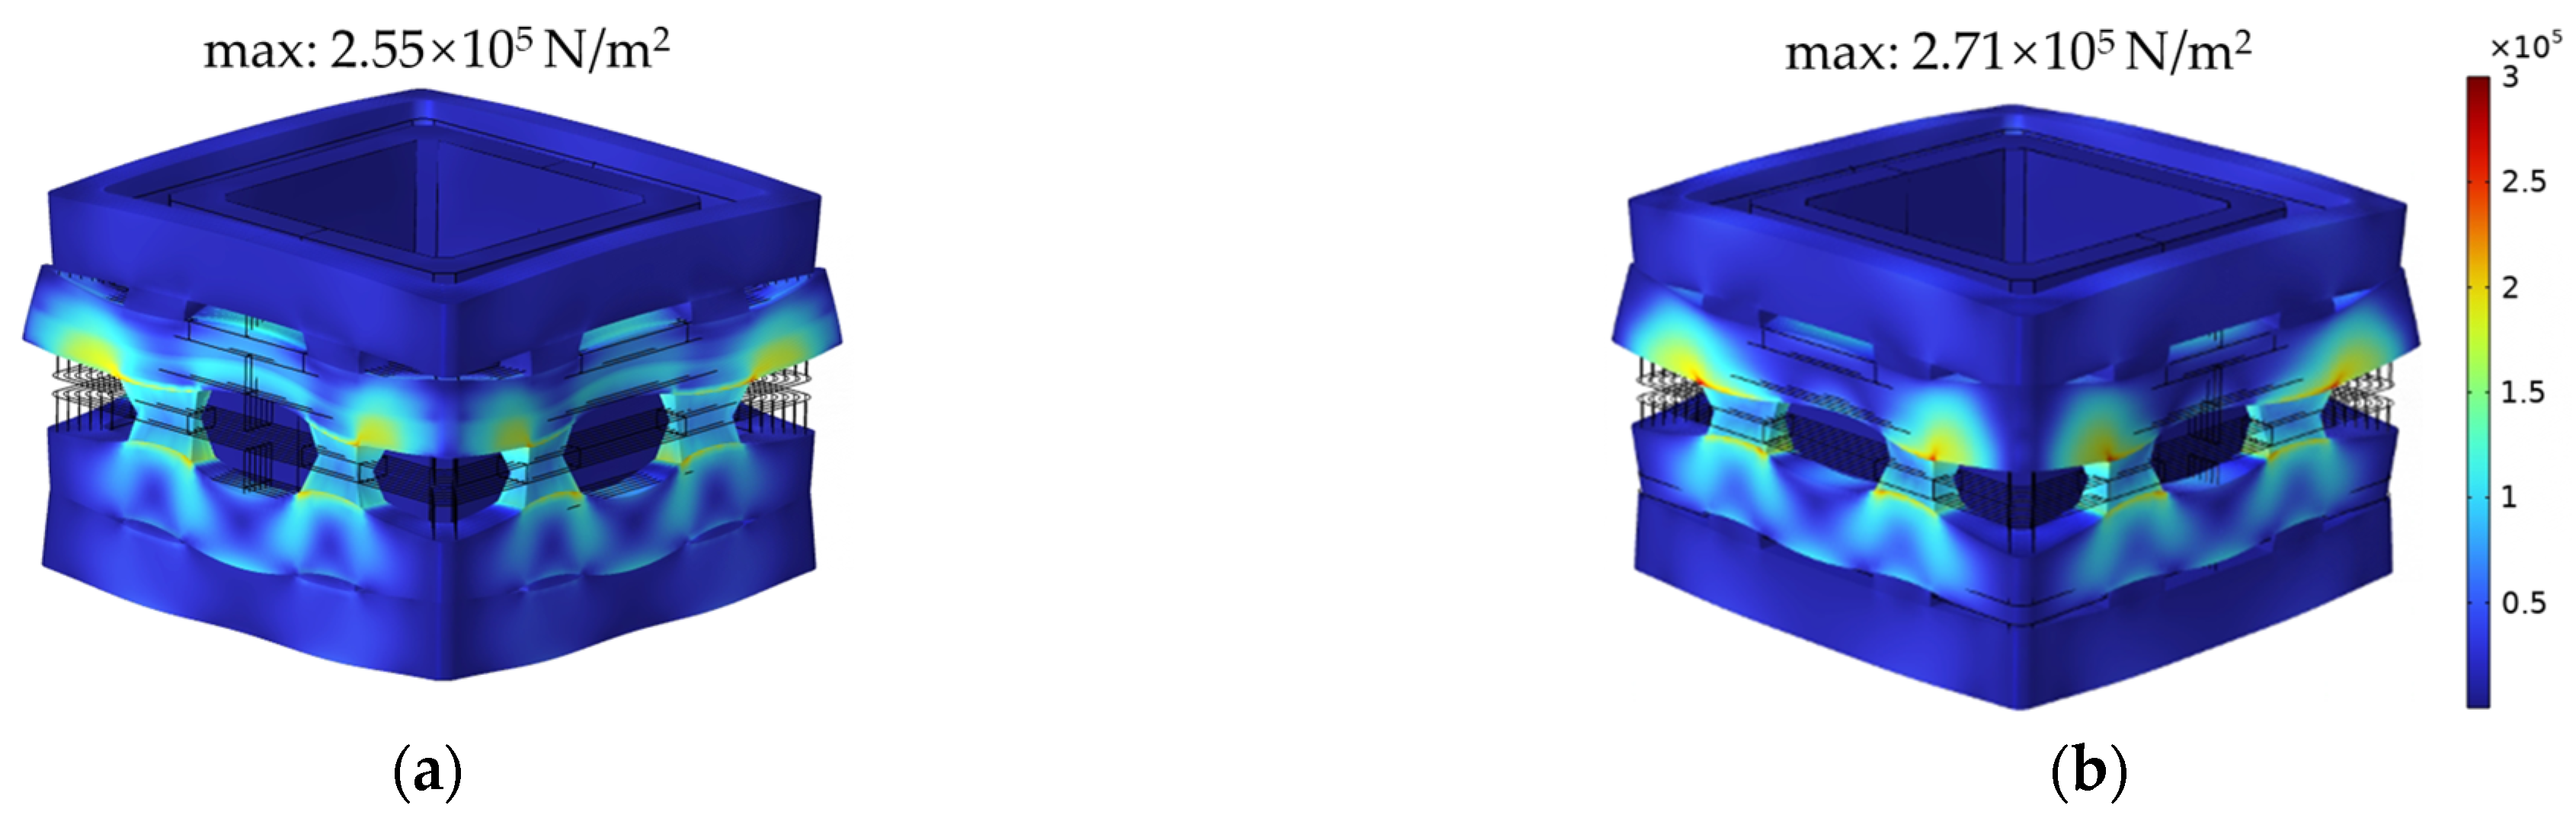
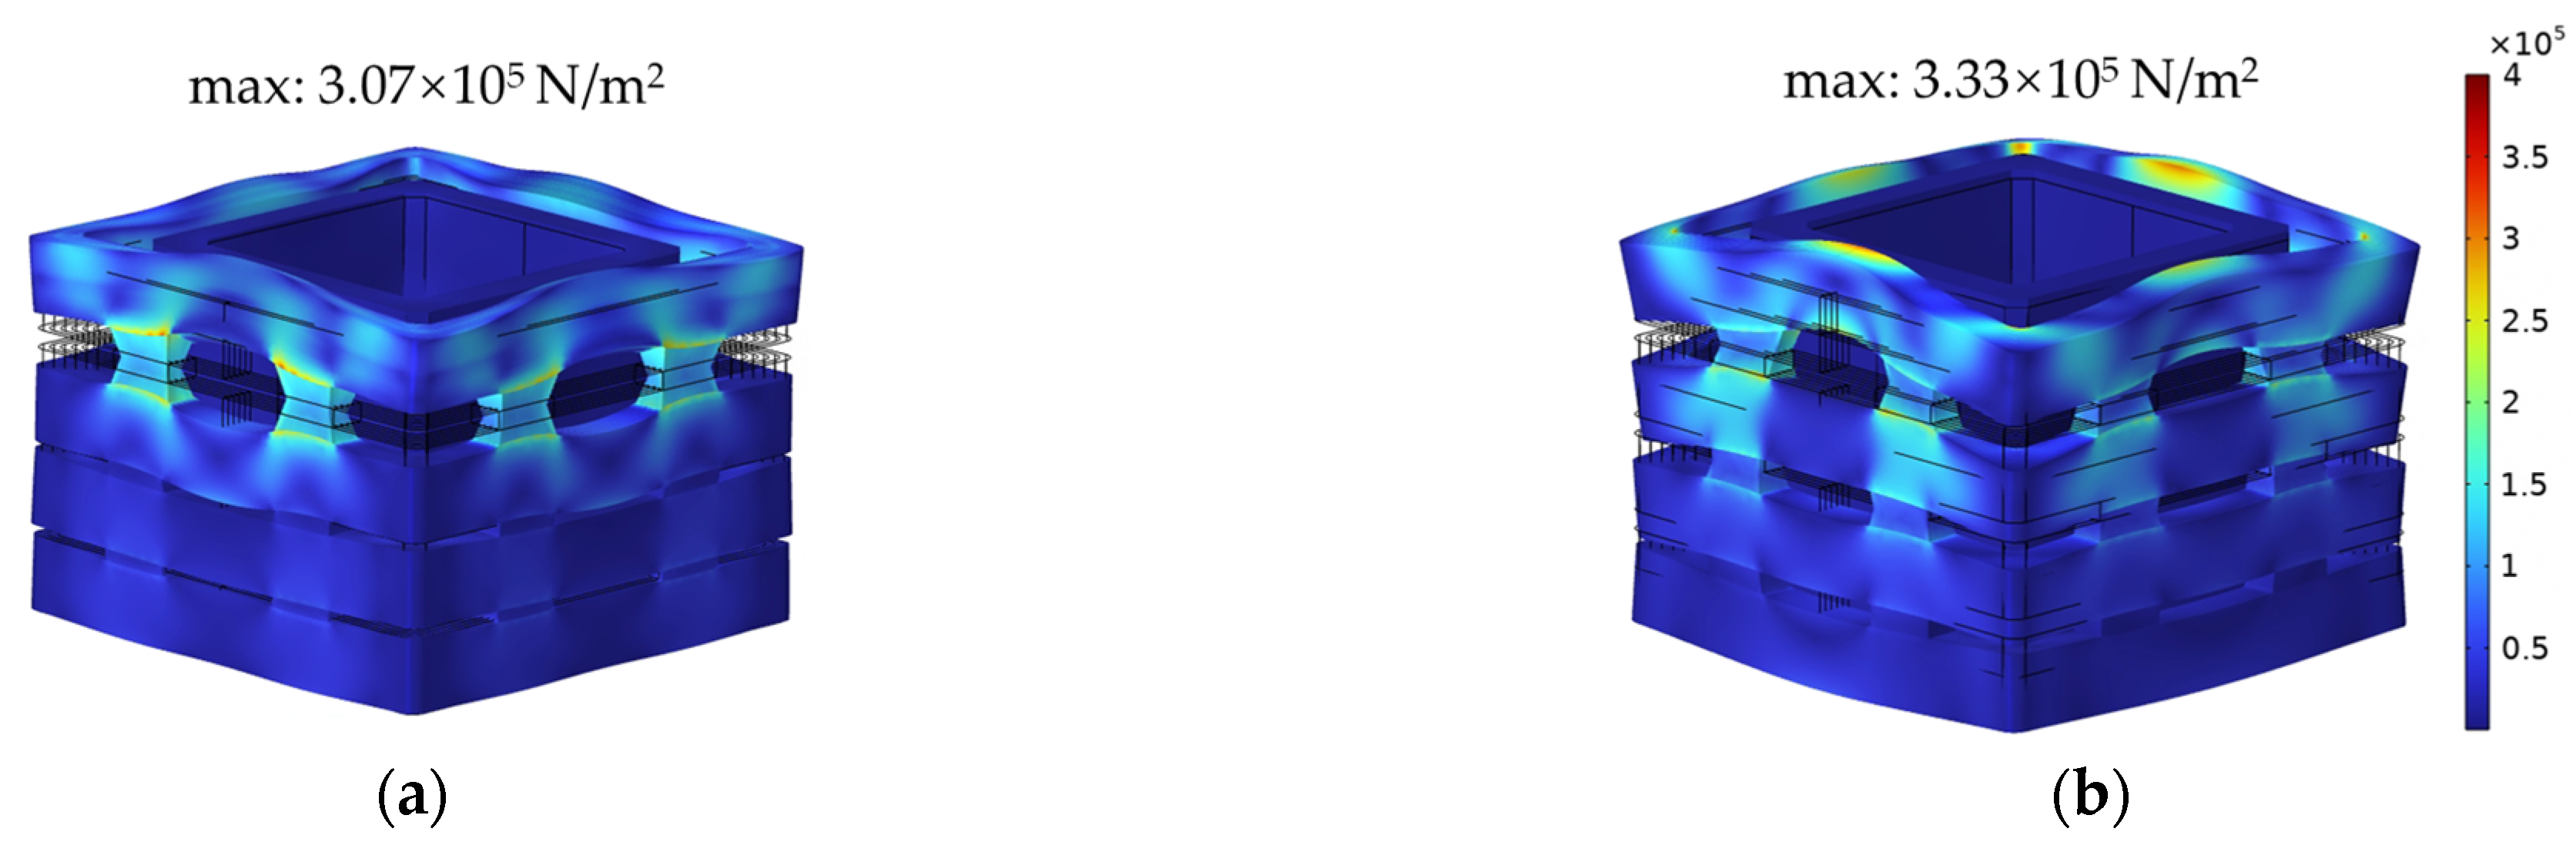
4.2. Analysis of Winding Vibration Acceleration Harmonic Response and Stress Distribution
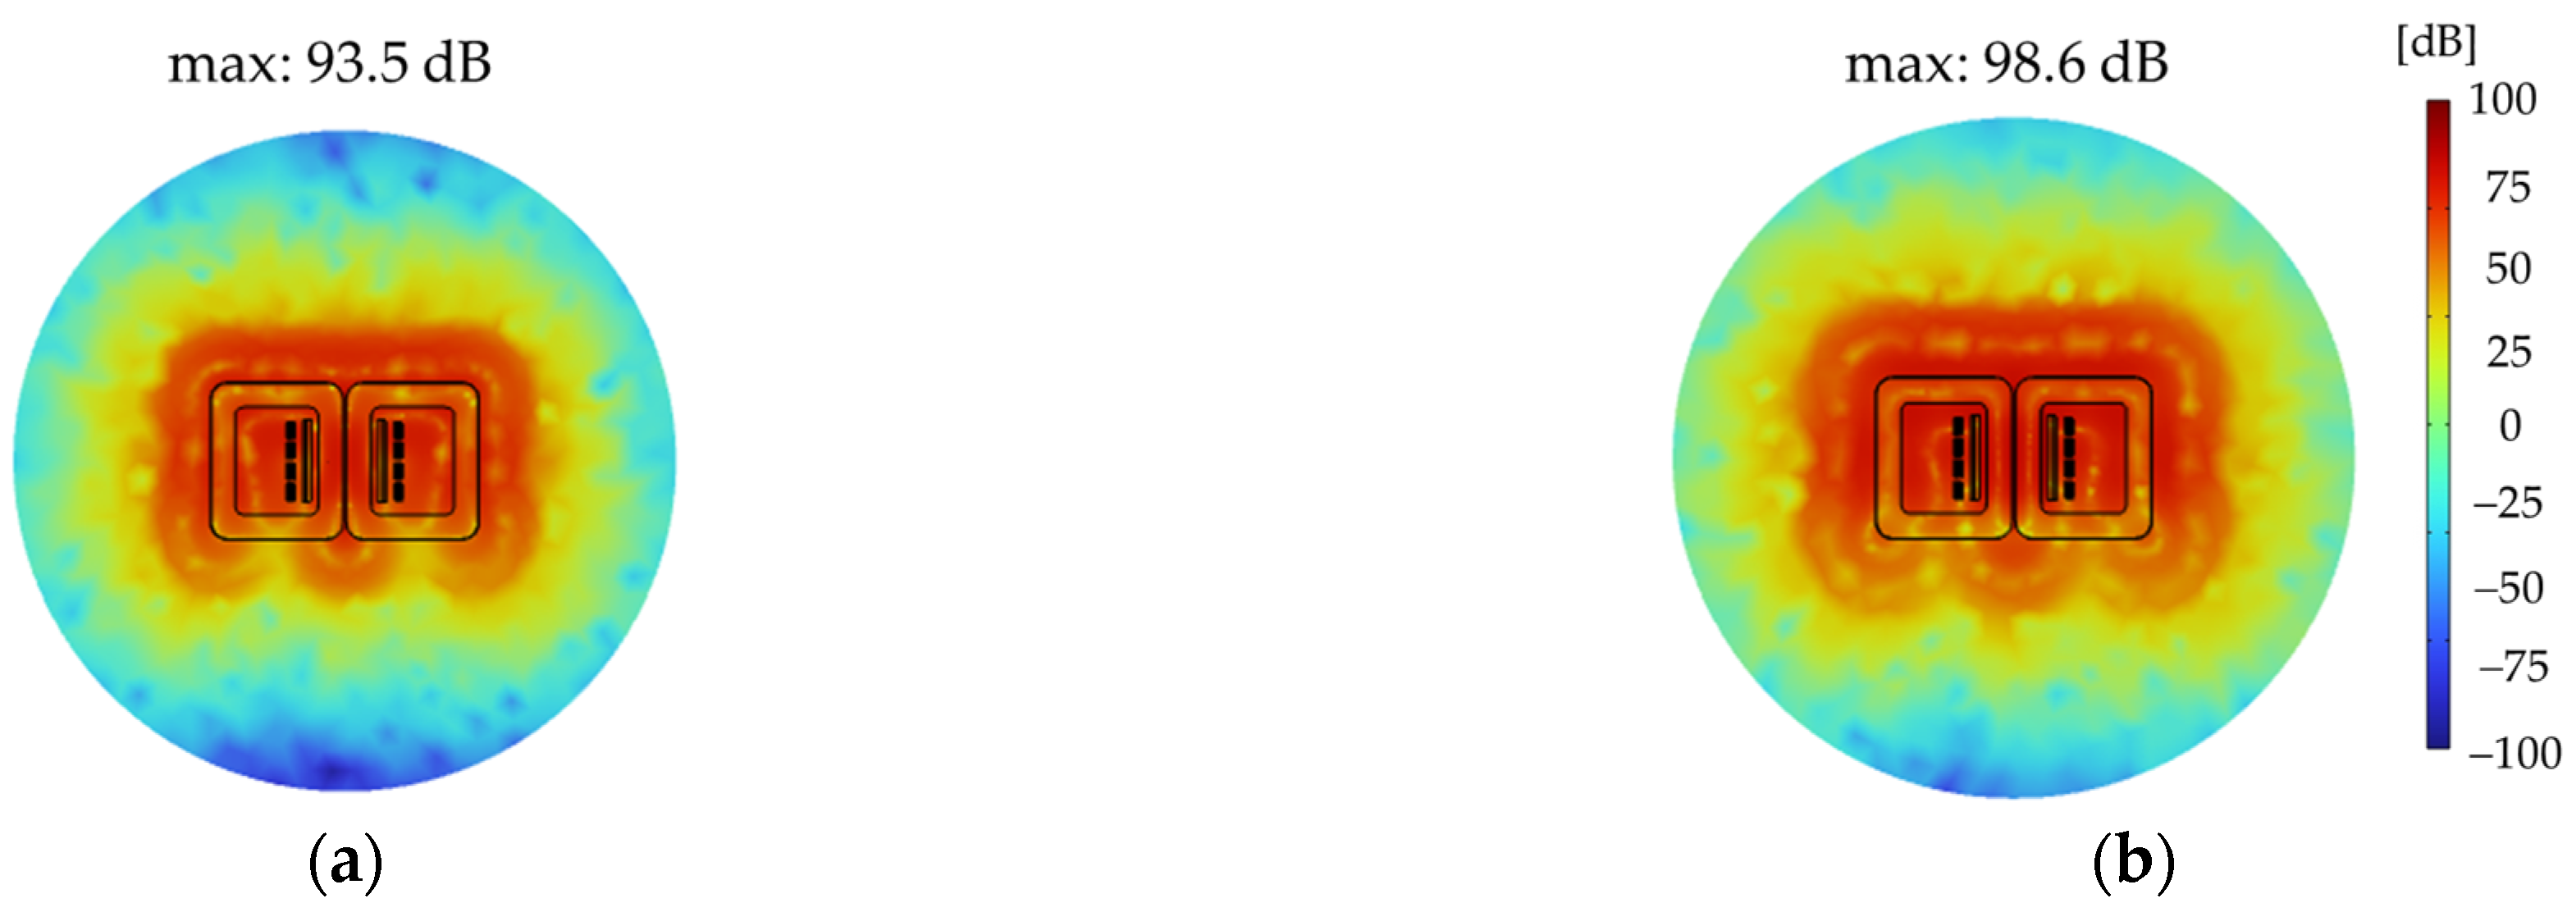
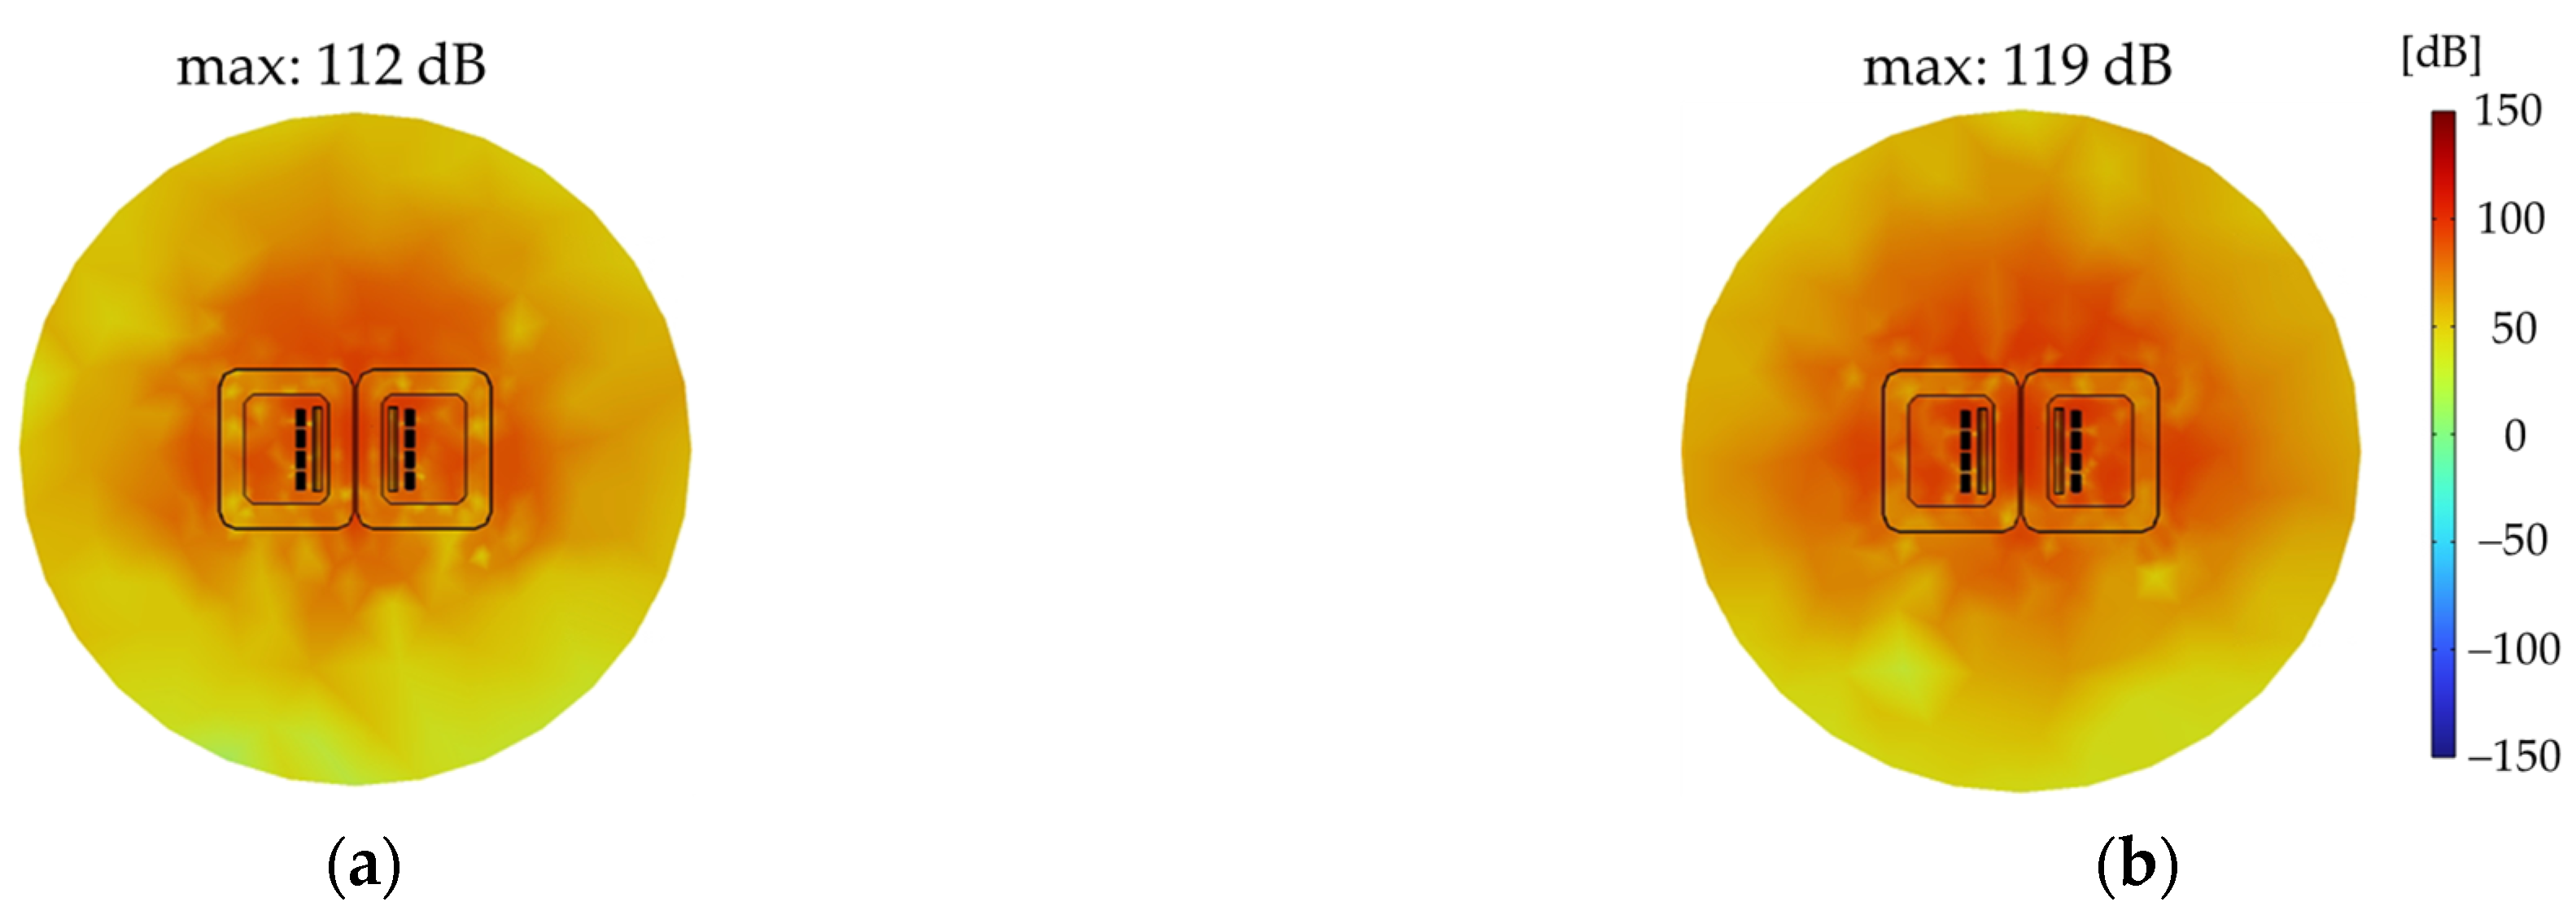
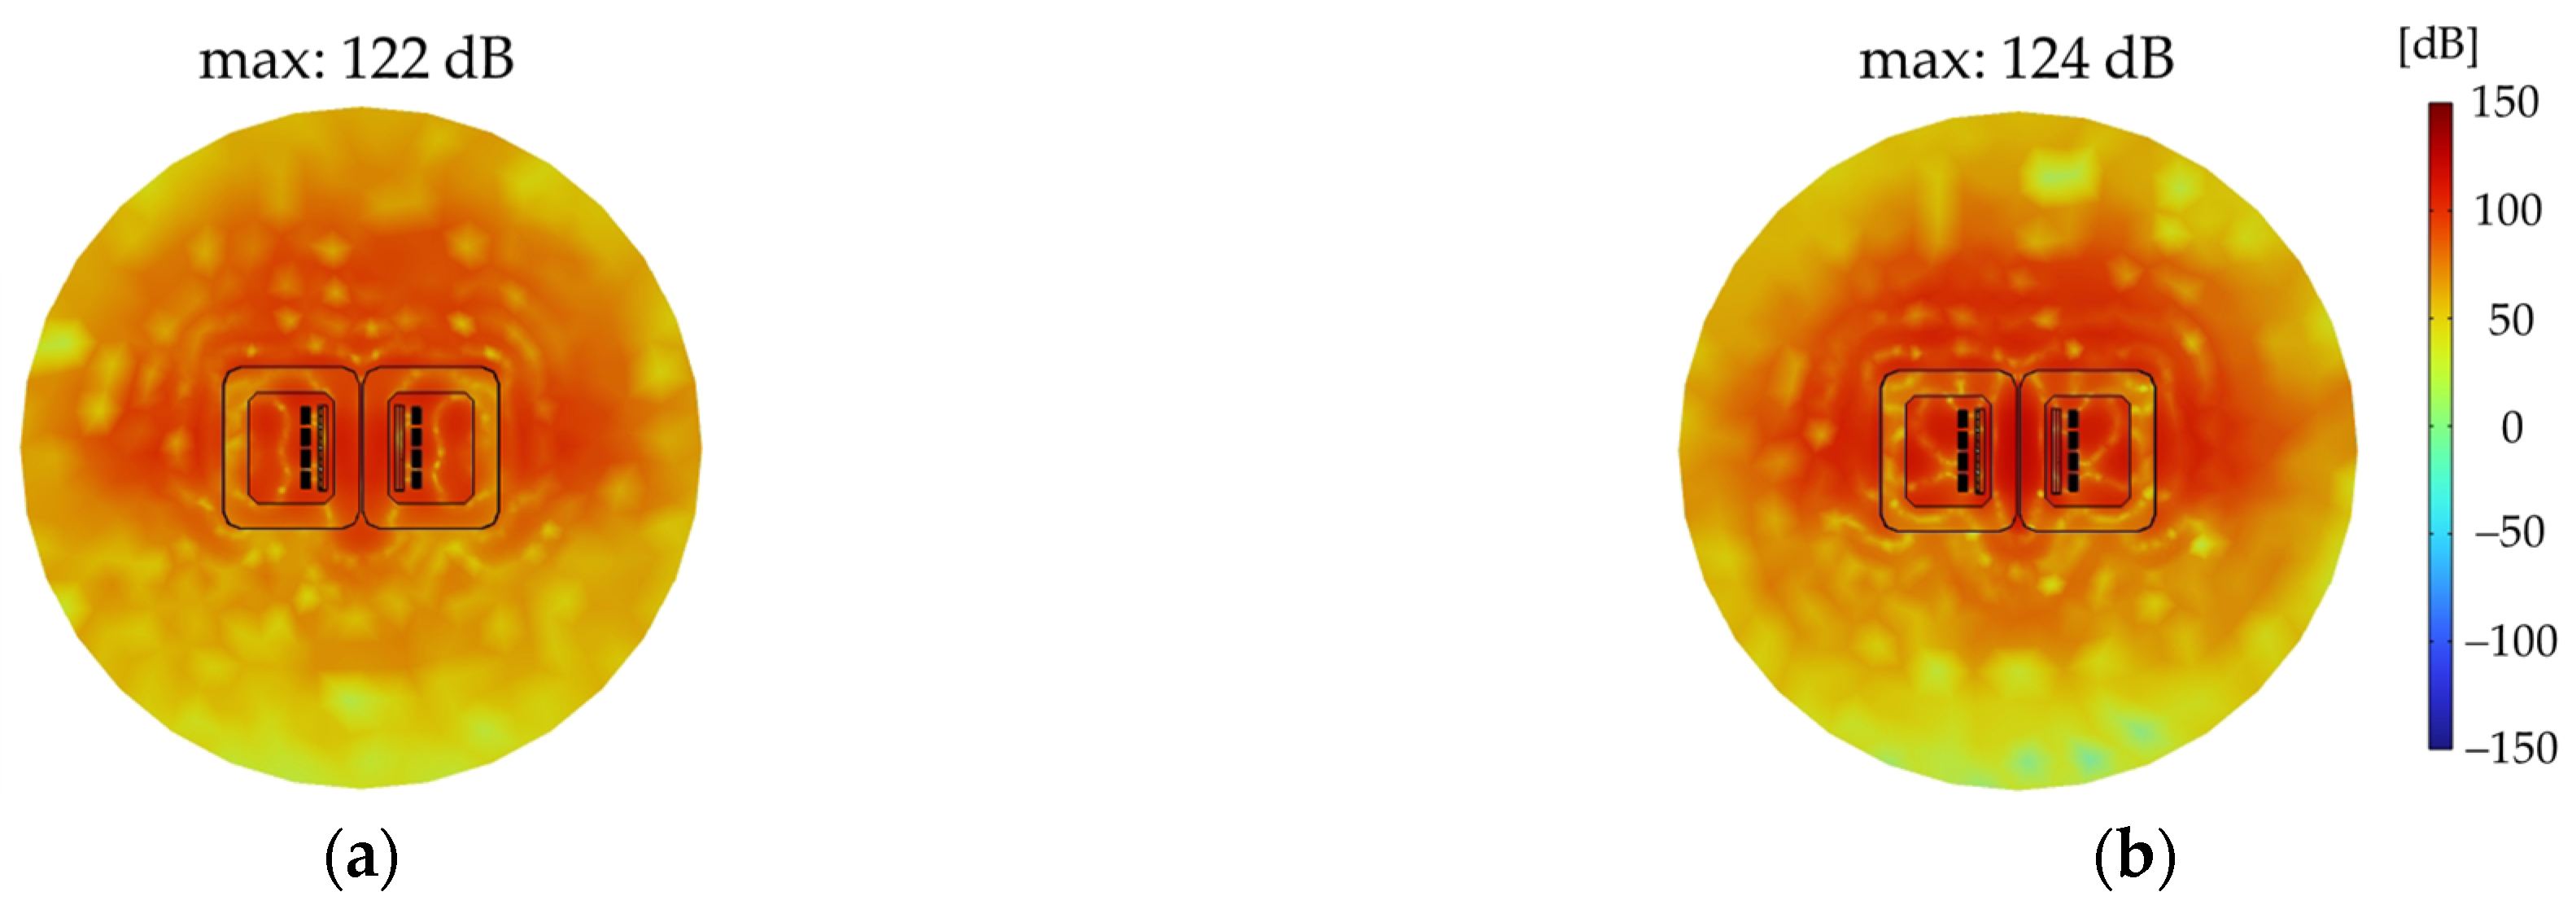
4.3. Acoustic Field Distribution
5. Conclusions
Author Contributions
Funding
Data Availability Statement
Conflicts of Interest
References
- Xiao, H.; He, X.; Li, C. Probability Density Forecasting of Wind Power Based on Transformer Network with Expectile Regression and Kernel Density Estimation. Electronics 2023, 12, 1187. [Google Scholar] [CrossRef]
- Yang, P.; Wang, T.; Yang, H.; Meng, C.; Zhang, H.; Cheng, L. The Performance of Electronic Current Transformer Fault Diagnosis Model: Using an Improved Whale Optimization Algorithm and RBF Neural Network. Electronics 2023, 12, 1066. [Google Scholar] [CrossRef]
- Cervero, D.; Fotopoulou, M.; Muñoz-Cruzado, J.; Rakopoulos, D.; Stergiopoulos, F.; Nikolopoulos, N.; Voutetakis, S.; Sanz, J.F. Solid State Transformers: A Critical Review of Projects with Relevant Prototypes and Demonstrators. Electronics 2023, 12, 931. [Google Scholar] [CrossRef]
- Li, X.; Lu, K.; Zhao, Y.; Chen, D.; Yi, P.; Hua, W. Incorporating harmonic-analysis-based loss minimization into MPTC for efficiency improvement of FCFMPM motor. IEEE Trans. Ind. Electron. 2022, 70, 6540–6550. [Google Scholar] [CrossRef]
- Xu, C.; Zhang, Q.; Mei, L.; Shen, S.; Ye, Z.; Li, D.; Yang, W.; Zhou, X. Dense Multiscale Feature Learning Transformer Embedding Cross-Shaped Attention for Road Damage Detection. Electronics 2023, 12, 898. [Google Scholar] [CrossRef]
- Lu, W.; Shi, C.; Fu, H.; Xu, Y. A Power Transformer Fault Diagnosis Method Based on Improved Sand Cat Swarm Optimization Algorithm and Bidirectional Gated Recurrent Unit. Electronics 2023, 12, 672. [Google Scholar] [CrossRef]
- Li, X.; Xue, Z.; Yan, X.; Zhang, L.; Ma, W.; Hua, W. Low-complexity multivector-based model predictive torque control for PMSM with voltage preselection. IEEE Trans. Power Electron. 2021, 36, 11726–11738. [Google Scholar] [CrossRef]
- Liu, H.; Chen, J.; Li, J.; Shao, L.; Ren, L.; Zhu, L. Transformer Fault Warning Based on Spectral Clustering and Decision Tree. Electronics 2023, 12, 265. [Google Scholar] [CrossRef]
- Li, J.; Zhang, Y.; Li, J.; Yang, M.; Wan, J.; Xiao, X. Research on the Electromagnetic Characteristics of an Integrated Multi-Winding Inductive Filtering Converter Transformer and Its Filter System. Electronics 2023, 12, 227. [Google Scholar] [CrossRef]
- Huang, Y.-C.; Wu, W.-B.; Kuo, C.-C. Application of Fault Overlay Method and CNN in Infrared Image of Detecting Inter-Turn Short-Circuit in Dry-Type Transformer. Electronics 2023, 12, 181. [Google Scholar] [CrossRef]
- Jeong, D.-K.; Yun, H.-J.; Park, S.-H.; Kim, M.-H.; Ryu, M.-H.; Baek, J.-W.; Kim, H.-S. 13.2 kV Class 3-Phase Solid State Transformer System Based on EtherCAT Communication. Electronics 2022, 11, 3092. [Google Scholar] [CrossRef]
- Himanshu; Singh, H.; Kumar, P.S.; Ali, M.U.; Lee, H.Y.; Khan, M.A.; Park, G.S.; Kim, H.-J. High Frequency Transformer’s Parasitic Capacitance Minimization for Photovoltaic (PV) High-Frequency Link-Based Medium Voltage (MV) Inverter. Electronics 2018, 7, 142. [Google Scholar] [CrossRef]
- Coffeen, L.; Britton, J.; Rickmann, J. A New Technique to Detect Winding Displacements in Power Transformers Using Frequency Response Anaiysis. In Proceedings of the 2003 IEEE Bologna Power Tech Conference Proceedings, Bologna, Italy, 23–26 June 2003. [Google Scholar]
- Hashemnia, N.; Abu-Siada, A.; Islam, S. Improved Power Transformer Winding Fault Detection Using FRA Diagnostics-Part 1: Axial Displacement Simulation. IEEE Trans. Dielectr Electr Insul. 2015, 22, 556–563. [Google Scholar] [CrossRef]
- Li, Y.; Liu, N.; Liang, Y. Oil-Immersed Transformer Load Capacity Evaluation Model Based on Temperature Rise Characteristics. Chin. J. Electr. Eng. 2018, 38, 6737–6746. [Google Scholar]
- Li, Z.; Peng, M.; Huang, Q. Application of Traveling Wave Reflection Method in Fault Location of Transformer Winding Inter-Turn Short Circuit. Power Syst. Prot. Control 2016, 44, 84–89. [Google Scholar]
- Xu, Y.M.; Guo, R.; Zhang, H. Calculation of Short-Circuit Electric Power of Power Transformer Windings. J. Electr. Mach. Control 2014, 18, 36–42. [Google Scholar]
- Zhao, Z.; Li, G.; Li, J. Analysis of Short-Circuit Resistance of Large Power Transformers Based on Finite Element Method. High Volt. Technol. 2014, 40, 3214–3220. [Google Scholar]
- Xu, Y.; Gong, Y.P.; Liu, Y. Block Frequency Analysis Method for Transformer Winding Frequency Response Data. Autom. Power Syst. 2014, 38, 91–97. [Google Scholar]
- Chen, M.; Wang, M.; Zheng, J. On-Line Detection Method for Short-Circuit Reactance of Distribution Transformers Considering Asymmetric Load. High Volt. Technol. 2015, 41, 881–886. [Google Scholar]
- Zhao, Z.; Li, G.; Li, J.; Zhang, S.; Liu, Y.; Gao, F. Analyzing the Short-Cinuit Withstanding Ability of Large Power Transformer Based the Fem Method. High Volt. Eng. 2014, 40, 3214–3220. [Google Scholar]
- Bagheri, M.; Phung, B.T. Frequency Response and Vibration Analysis in Transformer Winding Turn-To-Turn Fault Recognition. In Proceedings of the 2016 International Conference on Smart Green Technology in Electrical and Information Systems (ICSGTEIS), Denpasar, Indonesia, 6–8 October 2016; pp. 10–15. [Google Scholar]
- Xu, Y.; Gong, Y.; Liu, Y.; Ma, W.; Zhao, Q.; Wang, W. Transformer Winding Frequency Response Data Analysis with Block Frequency Point Method. Autom. Electr. Power Syst. 2014, 38, 91–97. [Google Scholar]
- Watts, G.B. A Mathematical Treatment of The Dynamic Behaviour of A Power-Transformer Winding Under Axial Short-Circuit Forces. Proc. Inst. Electr. Eng. 2010, 110, 551–560. [Google Scholar] [CrossRef]
- McNutt, W.J.; Johnson, W.M.; Nelson, R.A.; Ayers, R.E. Power Transformen Short-Circuit Strength-Requirements, Design, and Demonstration. IEEE Trans. Power App. Syst. 1970, 89, 1955–1969. [Google Scholar] [CrossRef]
- Swihart, D.O.; Wright, D.V. Dynamic Stiffness and Damping of Transformer Pressboard During Axial Short Circuit Vibration. IEEE Trans. Power App. Syst. 1976, 95, 721–730. [Google Scholar] [CrossRef]
- Berler, Z.; Golubev, A.; Rusov, V.; Tsvetkov, V.; Patterson, C. Vibro-Acoustic Method of Transformer Clamping Pressure Monitoring. In Proceedings of the Conference Record of the 2000 IEEE International Symposium on Electrical Insulation (Cat. No.00CH37075), Anaheim, CA, USA, 5 April 2000; pp. 263–266. [Google Scholar]
- Madin, A.B.; Whitaker, J.D. The Dynamic Behaviour of A Transformer Winding Under Axial Short-Circuit Forces. Proc. Inst. Electr. Eng. 1963, 110, 535–550. [Google Scholar] [CrossRef]
- Beltle, M.; Tenbohlen, S. Usability of Vibration Measurement for Power Transformer Diagnosis and Monitoring. In Proceedings of the 2012 IEEE International Conference on Condition Monitoring and Diagnosis, Bali, Indonesia, 23–27 September 2012; pp. 281–284. [Google Scholar]


| Item | Unit | Value |
|---|---|---|
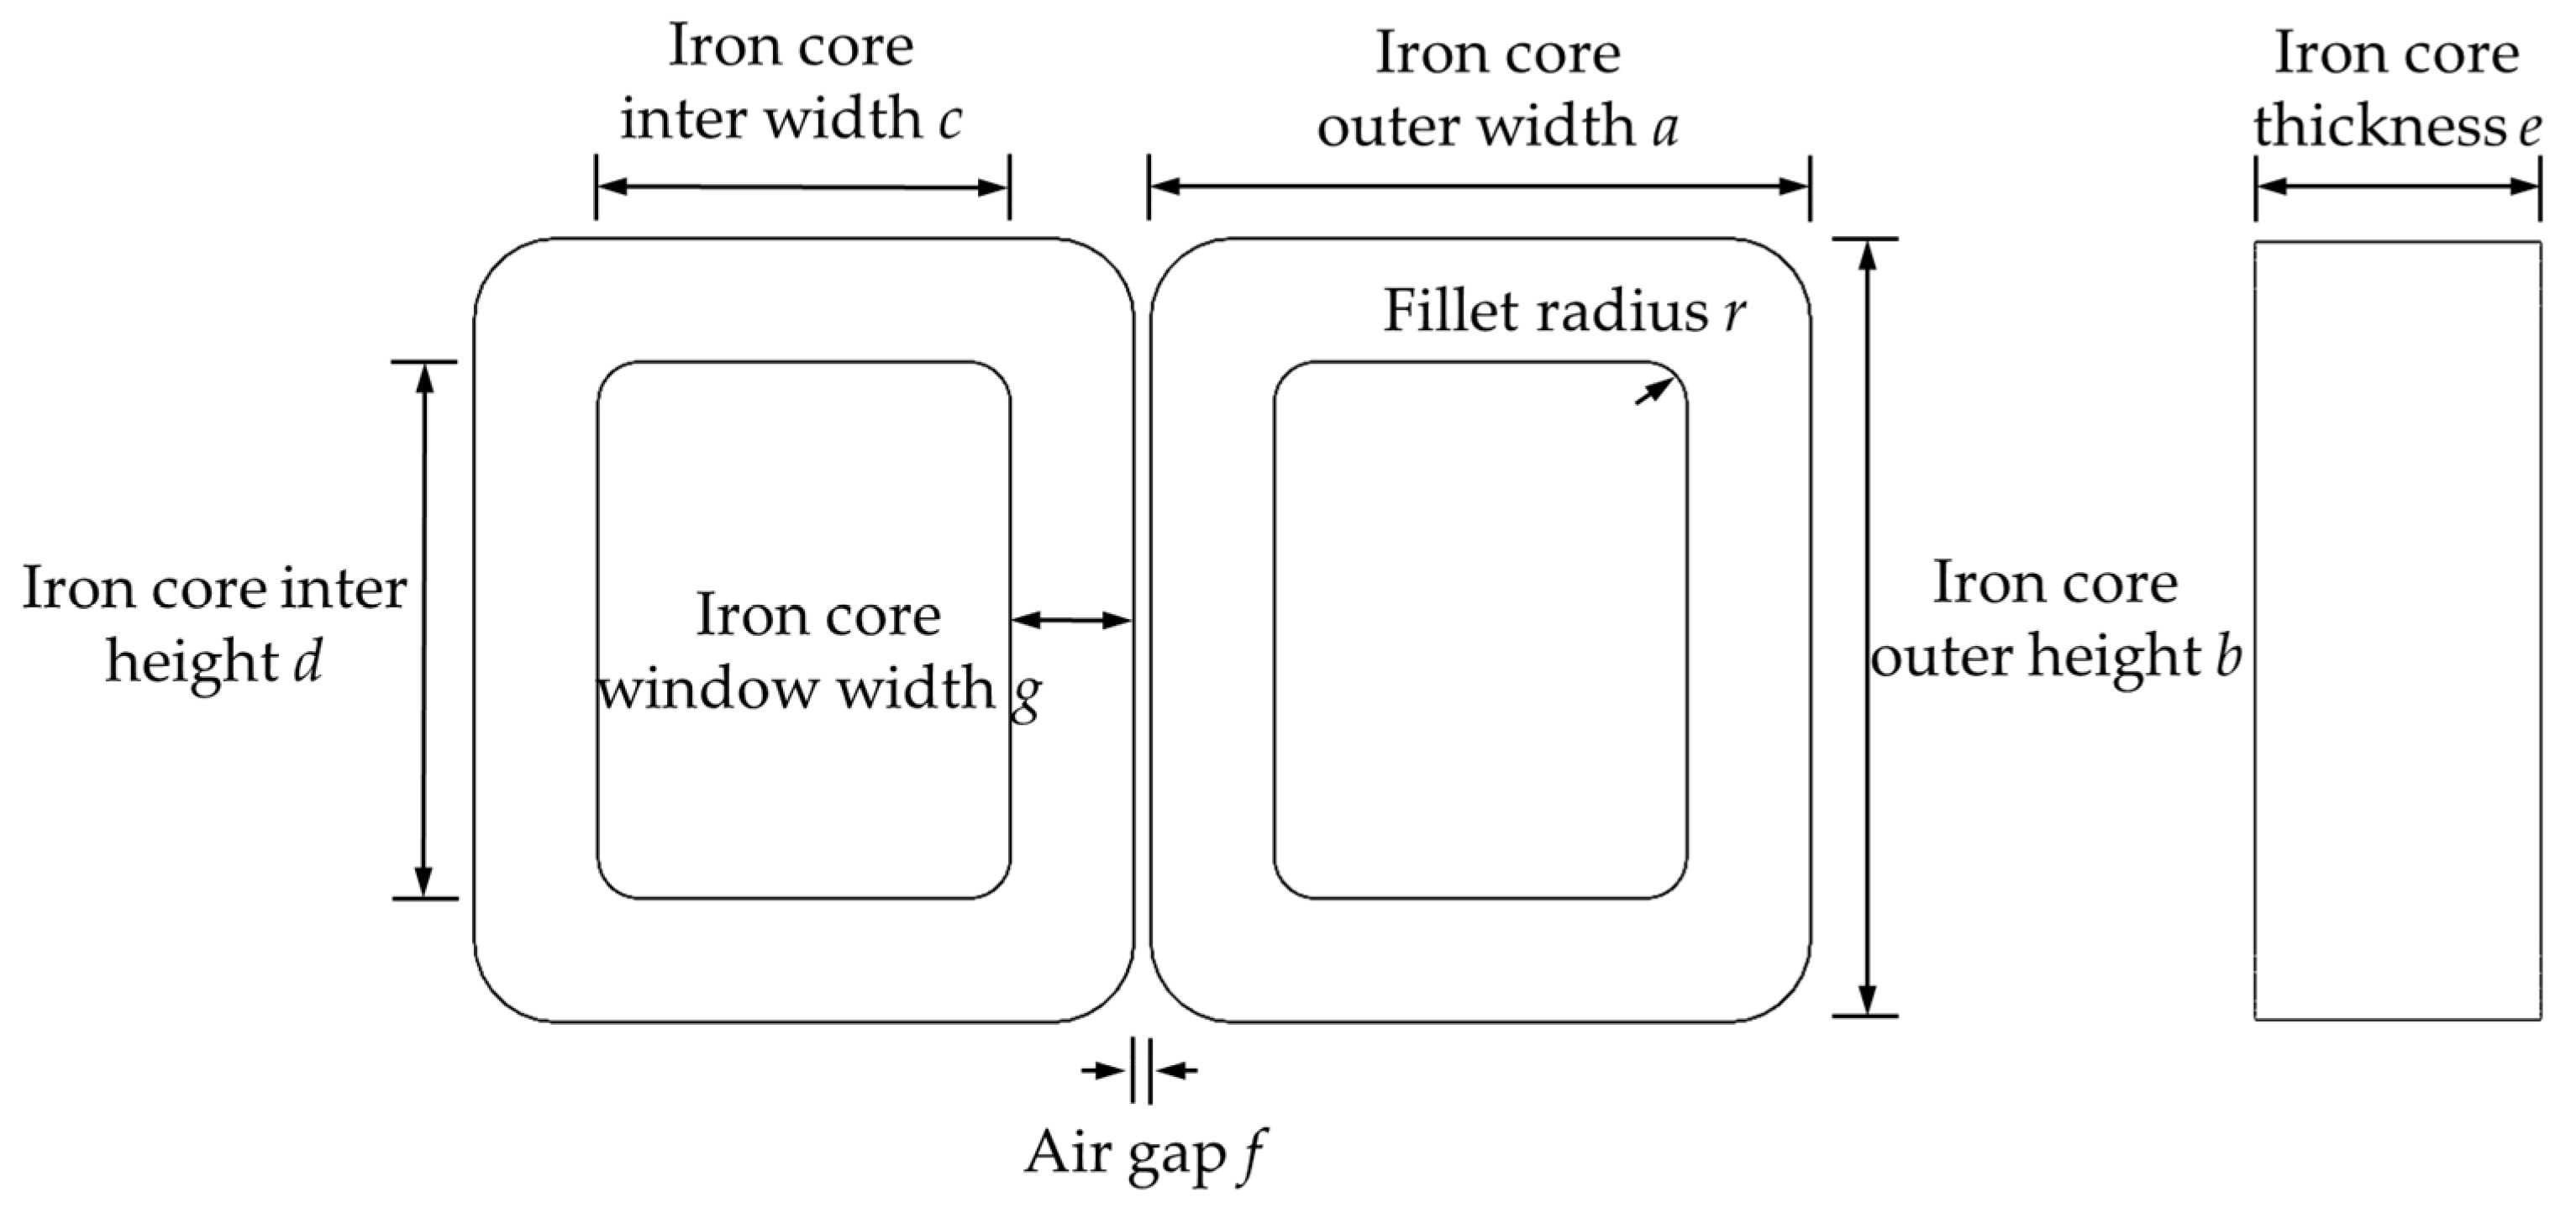
| Iron core outer width a | mm | 80 |
| Iron core outer height b | mm | 95 |
| Iron core inter width c | mm | 50 |
| Iron core inter height d | mm | 65 |
| Iron core thickness e | mm | 35 |
| Air gap f | mm | 2 |
| Iron core window width g | mm | 15 |
| Fillet radius r | mm | 10 |
| Cross-sectional area of core g × e | mm2 | 15 × 35 |
| Cross-sectional area of core window d × c | mm2 | 65 × 50 |
| Item | Unit | Value |
|---|---|---|
| Model | / | QZ-2 |
| Resistivity | Ω·m | 1.73 × 10⁻⁸ |
| Length of primary winding | mm | 5.00 |
| Width of primary winding | mm | 1.00 |
| Cross-sectional area of primary winding | mm2 | 5.00 |
| Length of secondary winding | mm | 5.00 |
| Width of secondary winding | mm | 1.25 |
| Cross-sectional area of secondary winding | mm2 | 6.25 |
| Airway widths between primary and secondary windings | mm | 5.00 |
| Thickness of insulating resin contact block | mm | 2.50 |
| Density | kg·m−3 | 1.26 |
Disclaimer/Publisher’s Note: The statements, opinions and data contained in all publications are solely those of the individual author(s) and contributor(s) and not of MDPI and/or the editor(s). MDPI and/or the editor(s) disclaim responsibility for any injury to people or property resulting from any ideas, methods, instructions or products referred to in the content. |
© 2023 by the authors. Licensee MDPI, Basel, Switzerland. This article is an open access article distributed under the terms and conditions of the Creative Commons Attribution (CC BY) license (https://creativecommons.org/licenses/by/4.0/).
Share and Cite
Ding, H.; Zhao, W.; Diao, C.; Li, M. Electromagnetic Vibration Characteristics of Inter-Turn Short Circuits in High Frequency Transformer. Electronics 2023, 12, 1884. https://doi.org/10.3390/electronics12081884
Ding H, Zhao W, Diao C, Li M. Electromagnetic Vibration Characteristics of Inter-Turn Short Circuits in High Frequency Transformer. Electronics. 2023; 12(8):1884. https://doi.org/10.3390/electronics12081884
Chicago/Turabian StyleDing, Haibo, Wenliang Zhao, Chengwu Diao, and Min Li. 2023. "Electromagnetic Vibration Characteristics of Inter-Turn Short Circuits in High Frequency Transformer" Electronics 12, no. 8: 1884. https://doi.org/10.3390/electronics12081884