1. Introduction
Voltage measurement is widely used in power systems, and the accuracy, reliability, and convenience of voltage measurement play an important role in fault detection and fault analysis of power systems [
1,
2,
3,
4]. In the current power system, voltage transformers are mainly relied on to obtain voltage signals. Nowadays, the most common voltage transformers used in power grids are electromagnetic voltage transformers and capacitive voltage transformers [
5]. The electromagnetic voltage transformer has a small capacity, high cost, complex insulation structure, ferromagnetic resonance phenomenon, leakage inductance distribution capacitance, and other factors and gradually does not adapt to the needs of today’s power grid. Capacitive voltage transformers are mainly used in power grids above 330 kV, which are large, expensive, and not easy to install and cannot meet the requirements of low-cost distributed devices [
6]. The non-intrusive voltage measurement method realized by the electric field coupling principle has a series of advantages such as low insulation difficulty, simple structure, wide dynamic range, and fast transient response, which caters to the future need for intelligent voltage sensors in power systems and becomes a new direction for voltage measurement technology [
7,
8,
9,
10,
11,
12,
13,
14]. For transmission lines, non-invasive voltage measurement schemes based on the principle of capacitive coupling are less available, and the accuracy of the measurement cannot be guaranteed due to the change in the coupling capacitance value between the sensor system and the conductor to be measured due to different measurement environments [
15,
16,
17].
The principle of non-invasive voltage measurement was first proposed in document [
18], which relies on a probe vibrating at a certain frequency to form a time-varying capacitance between the line to be measured and the probe, thereby measuring the voltage of the line to be measured. However, in practical measurements, the bandwidth of this measurement scheme is limited by the vibration frequency of the probe, resulting in significant limitations. Most of the measurement schemes proposed in recent years use static coupling sensing probes, which are fixed on or near the surface of the line to be measured based on the voltage level. The voltage of the line to be measured is coupled to the measurement device using the coupling capacitance formed between the line to be measured and the sensor sensing plate for voltage measurement. The literature [
19] used the principle of capacitive voltage division for non-intrusive voltage measurement, combined with field applications, and analyzed the influence of factors such as the height of the line to be measured, the ambient temperature and humidity, and the distance from the installation point to the pole tower on the coupling capacitance and measurement results, but the coupling capacitance between the line to be measured, the earth, and the sensor inductor pole plate changes with the measurement environment in the actual measurement process and cannot be equated to a constant. In the literature [
20], a non-intrusive voltage measurement method based on electric field coupling with two probes was proposed to eliminate the measurement error brought by interference from other directions, and although this measurement scheme can effectively eliminate the influence brought by external interference, it still does not solve the problem of measurement error caused by the change of coupling capacitance due to the change of measurement environment. The literature [
21] eliminates the coupling capacitance between the sensor and the line by connecting the sensing electrode inside the sensor directly to the line to be measured for equipotential measurement, but the coupling capacitance value between the sensor and the earth in this measurement method will still change due to the change of the measurement environment, which makes it difficult to guarantee the measurement accuracy. Aiming at the problem of measurement error caused by the uncertainty of the coupling capacitance between the sensor and the earth, David L. Epperson of Fluke et al. relied on the human body as a coupling ground conductor, eliminating the capacitance to the ground and thus solving the problem of restricted measurement locations [
22]. The measurement process requires the human body as a coupling ground conductor, resulting in a method that cannot be applied to high voltage measurement scenarios, such as voltage measurements on overhead transmission lines. In addition, when multiple conductors are present in the measurement scenario, its measurement accuracy is still compromised. The literature [
23,
24,
25,
26] eliminates the unknown coupling capacitance between the induction electrode and the line to be tested by injecting a known heterofrequency sinusoidal reference signal in order to improve measurement accuracy. However, there are various harmonics on the line in the actual measurement scenario, which makes it difficult to distinguish between the injected signal and the harmonic signal already on the line for accurate measurement. In addition, when measuring high voltage scenarios, a high amplitude voltage needs to be injected to ensure that the signal is not drowned, making it difficult for the method to achieve engineering applications.
Based on the principle of electric field coupling, this paper constructs a non-invasive floating ground three-capacitance voltage measurement model based on the coupling capacitance between the sensor and the line to be measured, the ground, and the sensor itself. In the process of non-invasive voltage measurement, there are the following problems: (1) the coupling capacitance between the line to be measured and the sensor may vary due to factors such as line diameter, insulation material and thickness, and relative position and distance between the sensor and the line, resulting in uncertainty in capacitance values; (2) the coupling capacitance between the sensor (suspended on the line to be measured) and the ground is uncertain due to the lines to be measured being at different heights to the ground; (3) changes in the measurement environment, such as temperature and humidity, can also lead to changes in the coupling capacitance; (4) due to the influence of processing technology, material dielectric constant characteristics, sensor volume, and other factors, the sensor’s own capacitance can only reach pF level, and the low voltage division ratio leads to a large output voltage when the sensor measures high-voltage lines, which brings inconvenience to subsequent sampling and processing. To solve the above problems, this paper proposes to sample capacitance in parallel between two electrodes of the sensor to obtain unknown coupling capacitance values in real-time and accurately measure the line voltage to be measured. At the same time, the sampling capacitance is often several orders of magnitude larger than the capacitance of the sensor itself, thereby achieving a greater voltage division ratio, which is more conducive to the measurement of high voltage scenarios.
2. The Principle of Non Invasive Floating Ground Three Capacitor Voltage Measurement
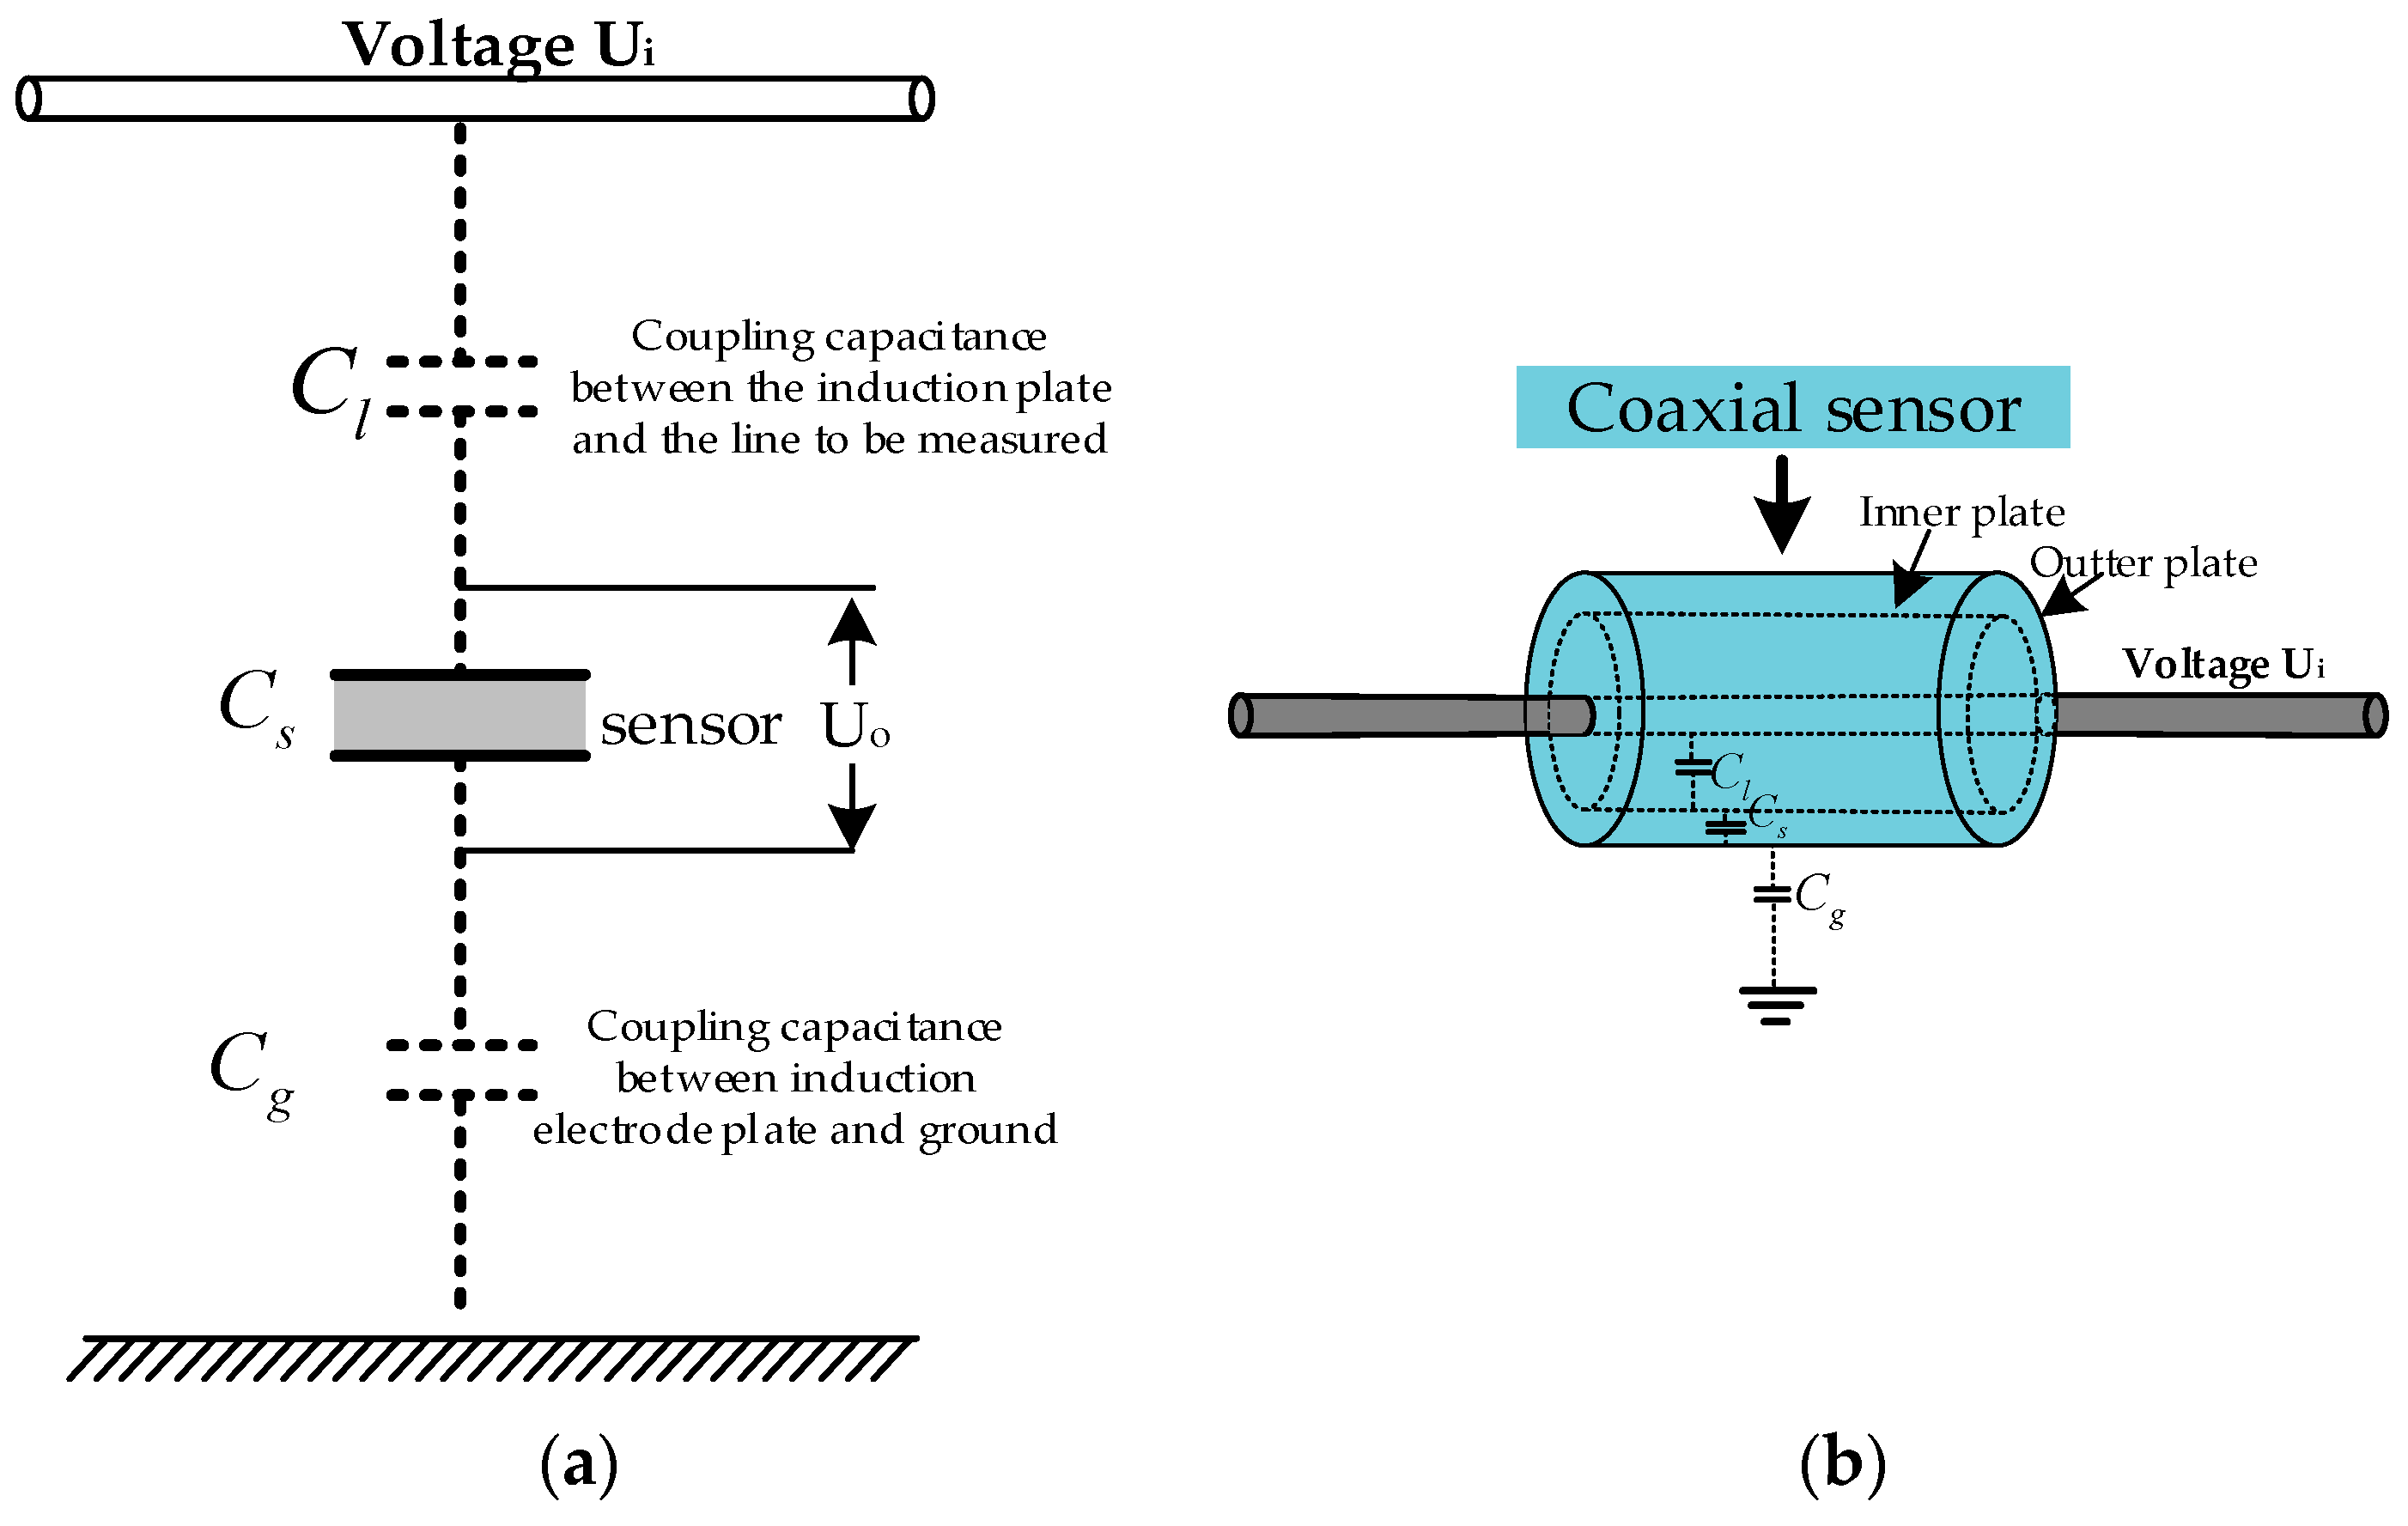
This paper proposes a non-invasive floating ground-type three capacitance voltage measurement model, which has the advantages of convenient handling, high construction safety, not being affected by line insulation, and being able to replace sensors with electricity. In this model, the voltage sensor does not need to be connected to the line to be measured and to the ground to complete the voltage measurement. The sensing probe is connected to the line to be measured and to the ground through a coupling capacitor.
The principle of non-invasive floating three-capacitance voltage measurement is shown in
Figure 1, where the intrinsic capacitance between the two electrodes of the sensor is
. The coupling capacitance formed between the sensor and the line to be measured is
. The coupling capacitance formed with the earth is
. The voltage to be measured
is output from
after series voltage dividing by capacitors
,
, and
. The output voltage of the sensor is the difference between the levitation potentials of the two sensing electrodes, which offsets the common mode voltage component, making the sensor more resistant to interference.
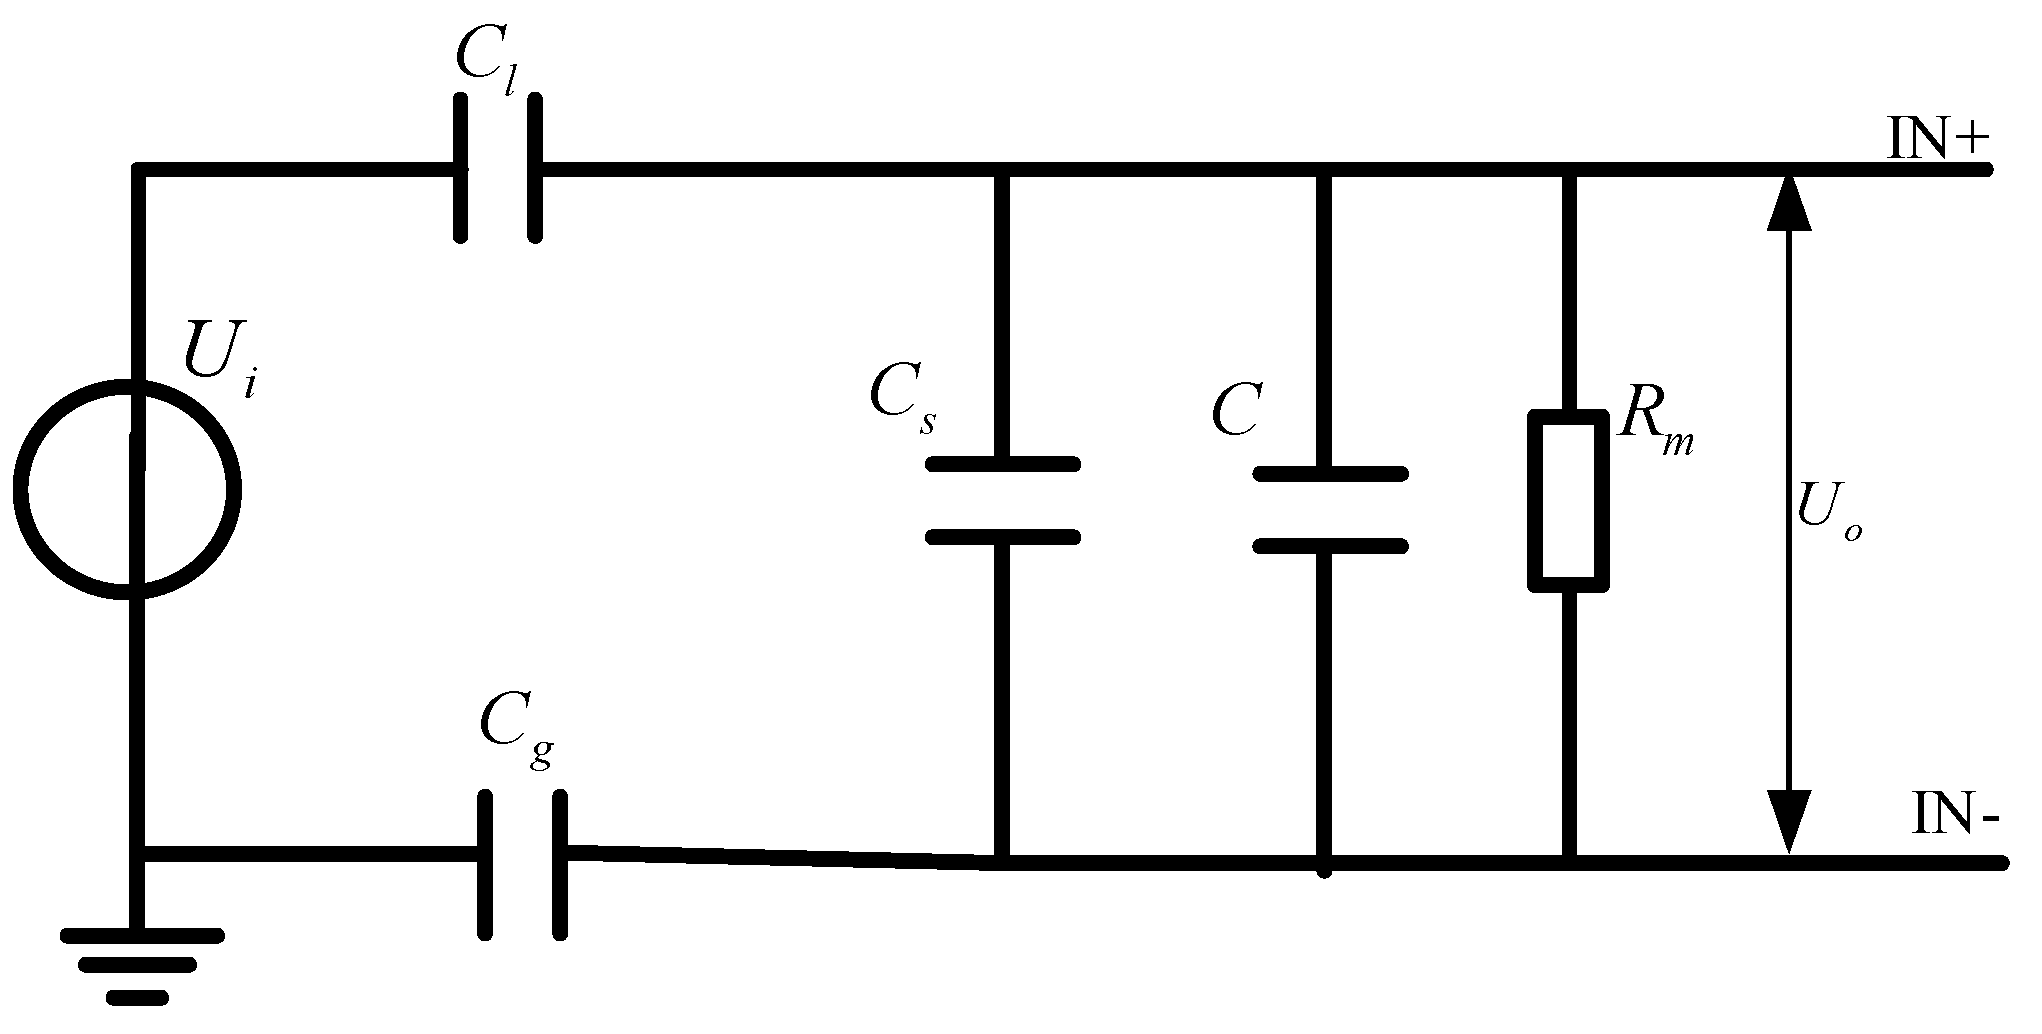
The lumped parameter equivalent circuit model of the model is shown in
Figure 2, and the transfer relationship between the voltage
to be measured and the output voltage
is obtained by Laplace transformation:
The voltage division ratio is
As can be seen in Equation (2), the sensor gain (voltage division ratio) is determined by the capacitors , , and . The capacitance is the capacitance of the sensor itself. As long as the structure of the sensor is determined, it is a certain value, and the influence of the measurement environment can be ignored. However, the capacitances and change due to a change in the measurement environment.
In this paper, the effect of line diameter and ground distance on capacitors
and
is analyzed by using COMSOL Multiphysics software simulation. In the simulation, the sensor is a coaxial sensor; the inner and outer electrodes are copper; the insulating medium between the two electrodes is epoxy resin; the dielectric constant is set to 4; the radius of the inner electrode is 2 cm; the thickness of the electrode is 2 mm; the radius of the outer electrode is 2.7 cm; the thickness of the insulating medium is 5 mm; and the sensor is 10 cm long. Refer to the radius of the 10 kV transmission line and its height to perform parametric scanning, the comsol simulation model is shown in
Figure 3.
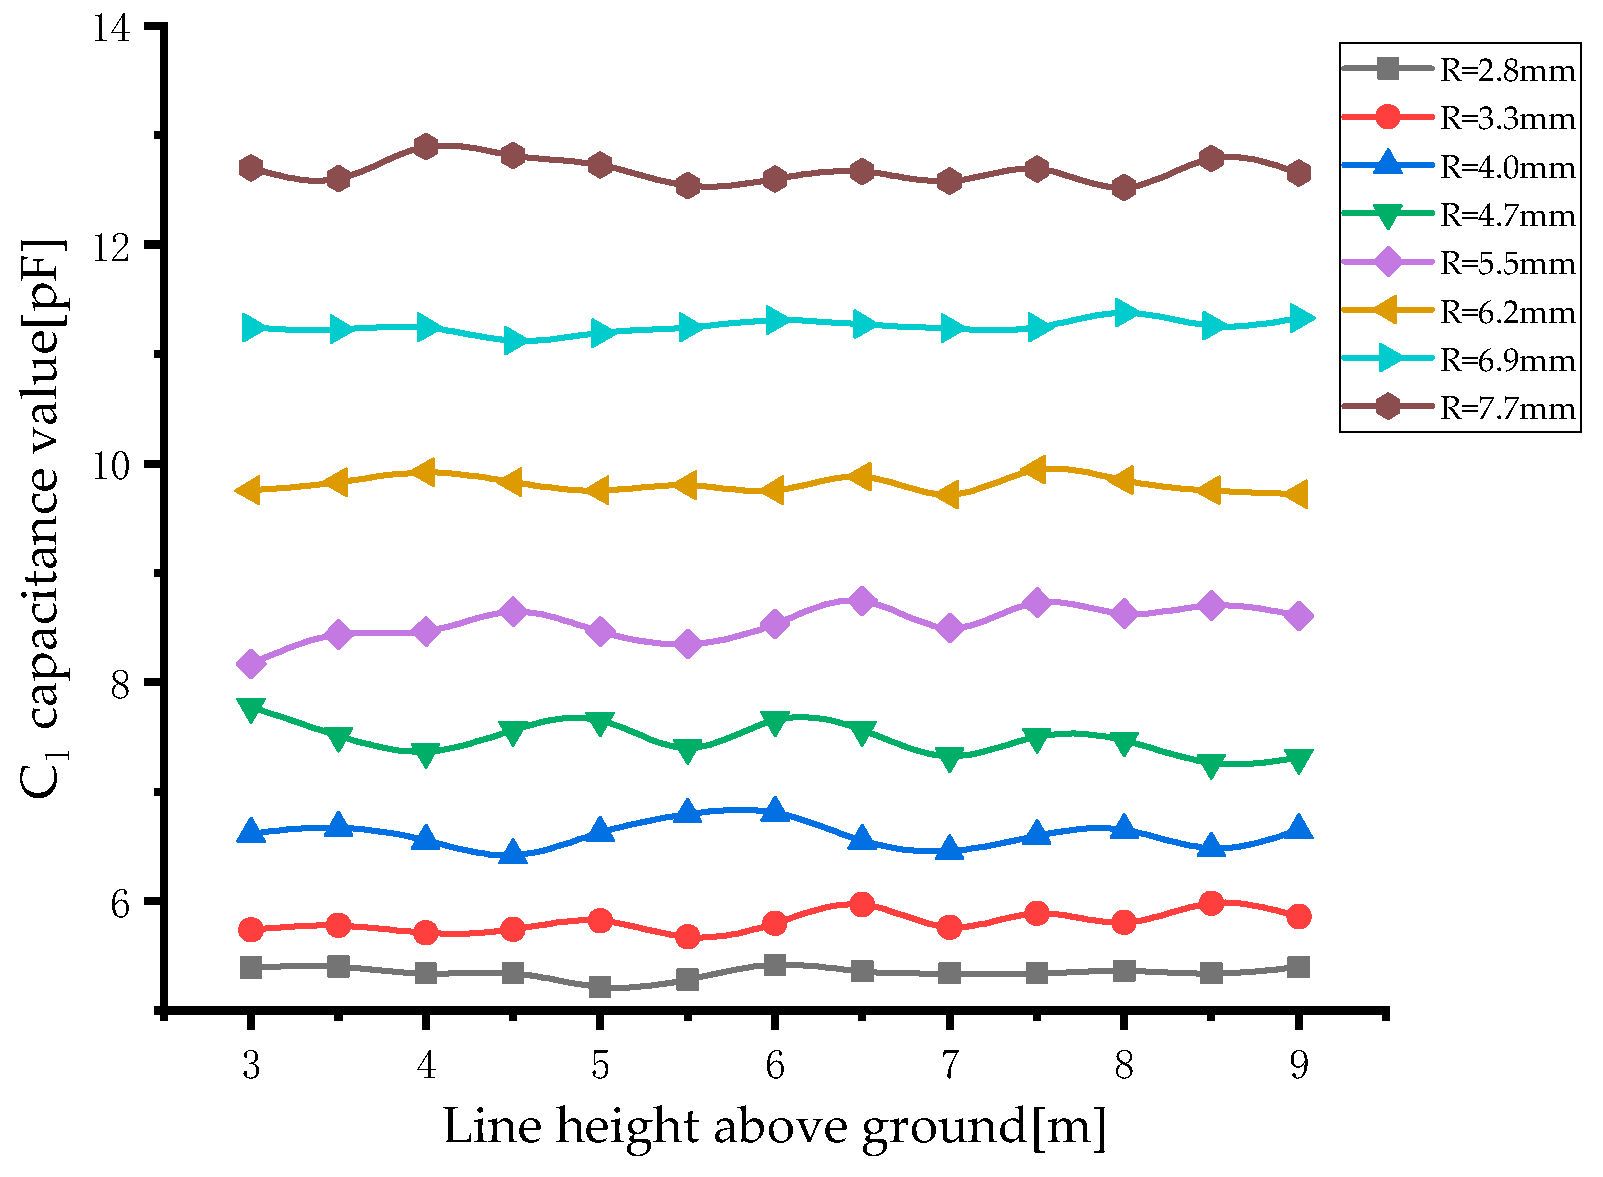
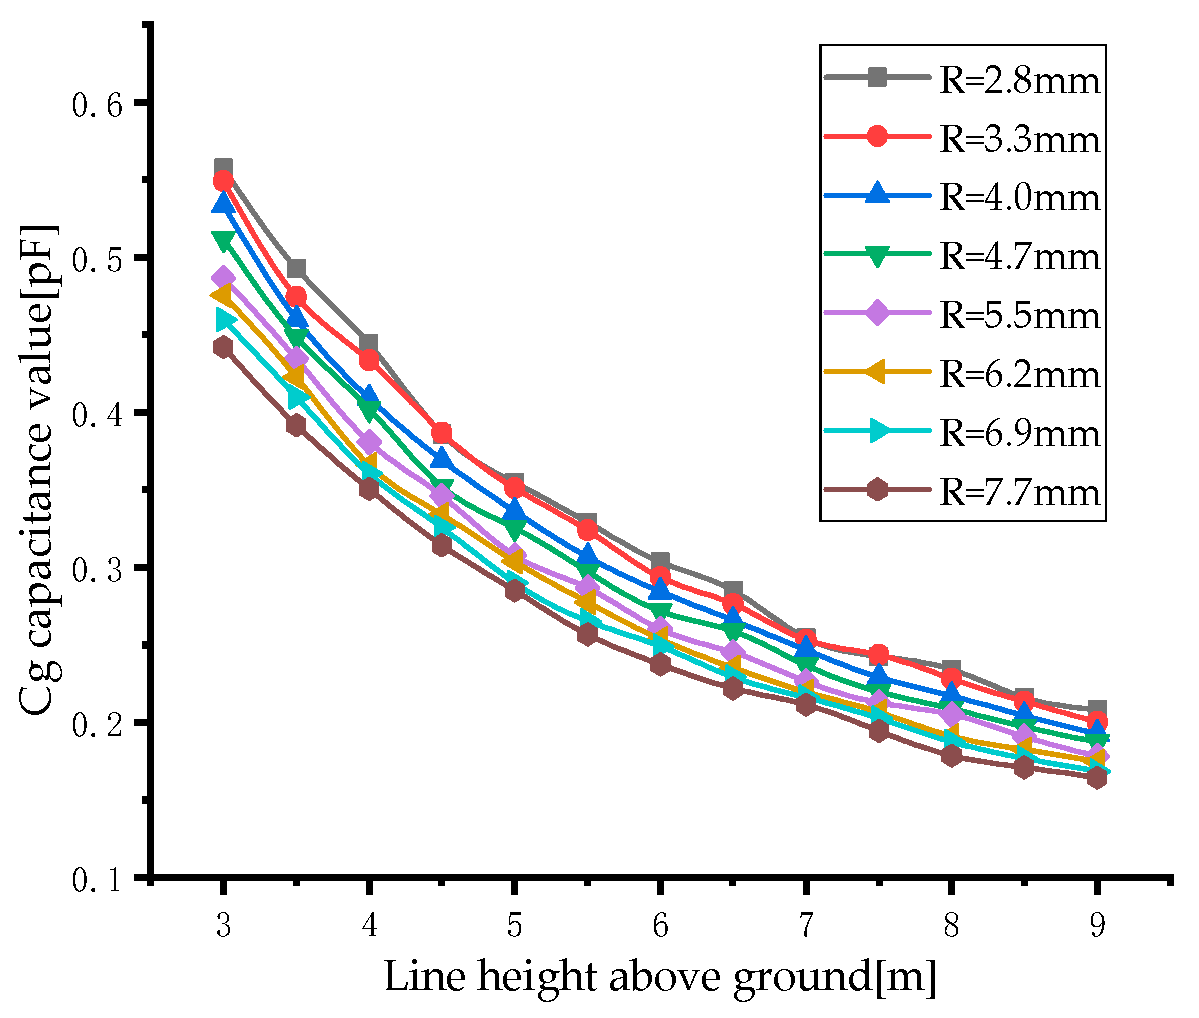
From
Figure 4 and
Figure 5, we can see that the coupling capacitances
and
have different capacitance values under different measurement scenarios. The coupling capacitance
is influenced by the line diameter—the larger the line diameter to be measured is, the higher the capacitance value is; when the line diameter is determined, the height from the ground has less influence on the coupling capacitance
; the coupling capacitance
is influenced by the height of the line from the ground—the further from the ground, the smaller the capacitance value is; when the line distance from the ground is determined, the line diameter has less influence on the coupling capacitance
. Therefore, the coupling capacitance in the non-contact voltage measurement will be affected by the line diameter to be measured and the height from the ground; that is, for the above non-intrusive floating ground three-capacitance voltage measurement model, in the actual measurement process there are still practical problems such as unstable voltage division ratio and insufficient measurement accuracy. In order to adapt the sensor to different measurement environments and obtain coupling capacitance values under different working conditions, the following will conduct research on it.
3. Principle and System Design of Self Calibration Measurement
3.1. Self-Calibration Principle
The estimation of coupling capacitance and the calibration of voltage division ratio in non-contact voltage measurement are the keys to sensor design. However, in the above measurement model, this issue has not been resolved. Therefore, an improved non-invasive floating ground-type three-capacitance voltage measurement is proposed, in which the sampling capacitance is connected in parallel between the two electrodes of the sensor. By changing the size of the sampling capacitance, a set of equations is established, and the coupling capacitance and the voltage to be measured are solved simultaneously. The measurement principle is shown in
Figure 6.
The lumped capacitors and are connected in parallel between the two electrodes of the sensor. and are switches controlled by relays, which can control whether the capacitors and are put into operation.
- (1)
The switch
is closed, and
is disconnected. The capacitor
is paralleled between the two electrodes of the sensor. At this point, the relationship between the output voltage
and the line voltage
to be measured is
Order
, Equation (3) can be converted to
- (2)
The switch
is closed, and
is disconnected. The capacitor
is paralleled between the two electrodes of the sensor. At this point, the relationship between the output voltage
and the line voltage
to be measured is
In the above steps, the size of the sampling capacitance is only changed by controlling the opening and closing of switches and , without any changes to the sensor and its operating environment. Therefore, the sensor’s own capacitance and coupling capacitances and remain unchanged during this process.
Solve
and
by combining Equations (4) and (5).
Through Equations (6) and (7), the unknown parameter can be obtained, and the voltage value can be obtained accurately.
From the above analysis, it can be seen that when there is no parallel sampling capacitor between the two sensing plates of the sensor, the voltage division ratio
is
When parallel sampling capacitor
, its voltage division ratio
is
In Equation (8), is the series equivalent value of and . According to the above simulation, both and are at pF level, so is at pF level or even fF level. The sampling capacitance in Equation (9) can be selected as nF or even uF level so that the voltage division ratio . Therefore, the improved non-invasive floating ground-type three-capacitance voltage measurement model can not only achieve online calibration of the sensor, determine the sensor partial voltage ratio, and accurately measure the voltage value to be measured but also significantly improve the partial voltage ratio to achieve higher voltage level measurement.
3.2. Back-End Signal Processing
The equivalent circuit model of the entire measurement system can be represented as shown in
Figure 7. The line voltage to be measured is equivalent to a voltage source with a potential to ground of
;
is the coupling capacitance between the sensor and the line to be measured;
is the coupling capacitance between the sensor and the ground;
is the capacitance of the sensor itself;
is the sampling capacitance connected in parallel to the two electrodes of the sensor; and
is the sampling load resistance. The voltage
across the sampling resistor
is the measured signal.
Through Laplace transform, the transfer function of the sensor is obtained as follows:
Additionally,
, and Equation (10) can be reduced to:
When
, the transfer function of the sensor can be expressed as
In this case, the sensor operates in a differential mode, and it is necessary to add an integration circuit to the later stage circuit to make the measured output signal have a linear relationship with the measured signal.
When
, the transfer function of the sensor can be expressed as
In this case, the sensor operates in a self integrating mode, and the sensor does not require an integrating circuit to maintain a linear relationship between its input and output.
If the sensor operates in differential mode, it is difficult to improve the signal-to-noise ratio of the sensor using an integrating circuit, and the stray parameters of the integrating circuit components may cause waveform distortion. Considering a series of problems with integrating circuits, sensors operating in self integrating mode will have greater advantages. In order for the sensor to operate in the self integrating mode, should be satisfied, where and are at pF level, and the sampling capacitance can reach nF or even uF level. To make this formula valid, should be at level.
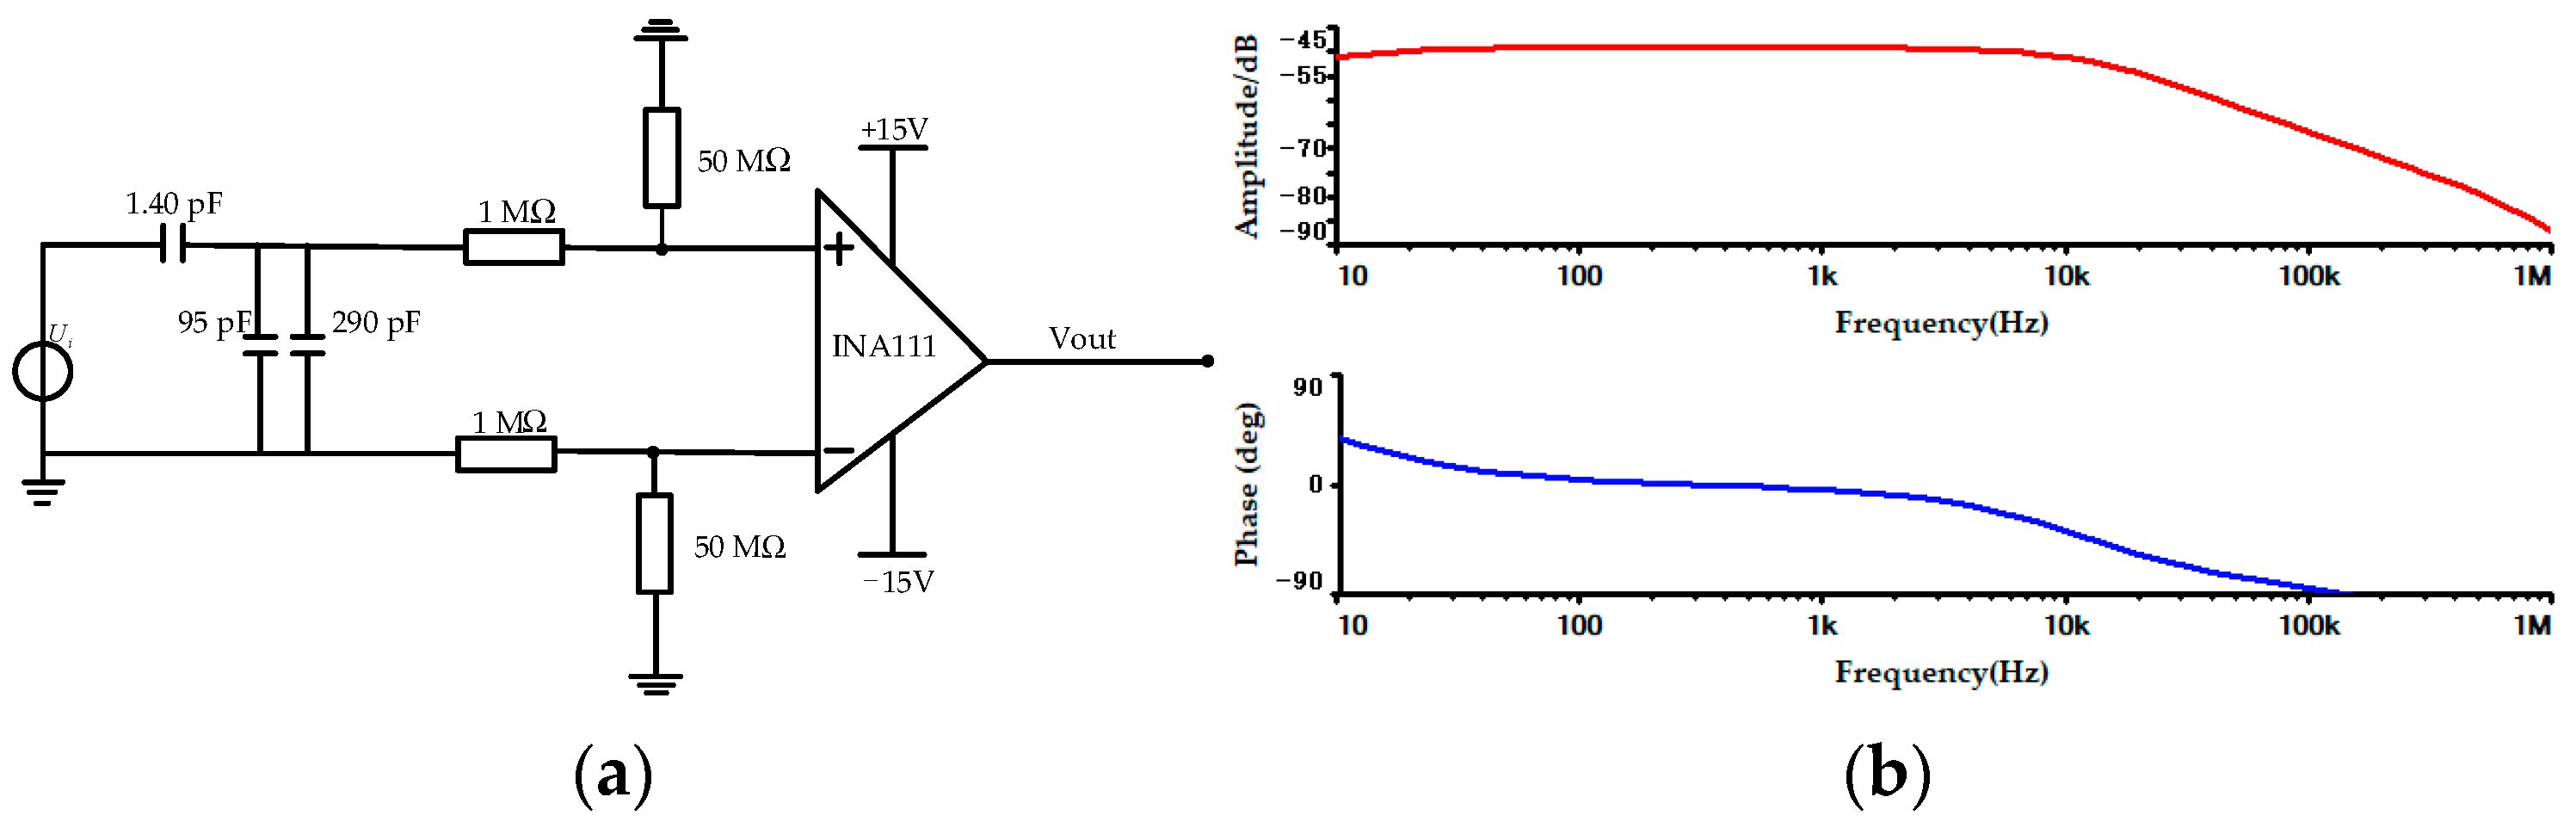
Due to the differential input structure of the sensor, the potentials of both sensing electrodes are unknown floating potentials. The back-end needs to use a differential signal processing circuit to convert the dual input signal into a single-ended signal relative to the circuit reference ground potential, making it suitable for signal processing and transmission. Therefore, this article selects the INA111 instrument amplifier produced by Texas Instruments (TI), which has an input impedance of up to 1000
, to meet the requirements of high-input impedance. It also has a differential signal processing function that can convert the differential measurement signal output by the sensor into a single ended signal. The back-end signal processing circuit and its frequency response curve are shown in
Figure 8, where resistors
and
serve as limiting values to prevent excessive circuit current, with a size of 1
.
and
are DC bias resistors with a size of 50
. Using this differential method to directly input the output voltage to the amplifier can achieve self-integration while eliminating the load resistance, avoiding a series of problems caused by the load resistance.
3.3. System Design
It can be seen from the above analysis that the improved non-invasive floating three-capacitor voltage measurement can achieve accurate measurement of voltage in different measurement scenarios. The main contents include the following solutions: (1) by changing the size of the parallel sampling capacitor between the two electrodes of the sensor, the joint input and output equation solves the coupling capacitor and the voltage value to be measured so that the sensor can adapt to different measurement scenarios to accurately measure the voltage to be measured; (2) connecting a capacitor with a larger capacitance value in parallel between the two sensing electrodes of the sensor achieves a larger voltage division ratio of the sensor while making it easier for the sensor to meet the operation in the self-integrating mode; (3) the back-end differential signal processing circuit can convert the double-ended input signal on the two sense electrodes into a single-ended signal relative to the circuit reference ground potential for subsequent data acquisition. At the same time, the differential amplification circuit can suppress the errors brought about by environmental interference signals on the measurement results and realize the accurate measurement of the sensor output signal. The measurement system and the specific implementation steps are shown in
Figure 9.
4. Test and Result Analysis
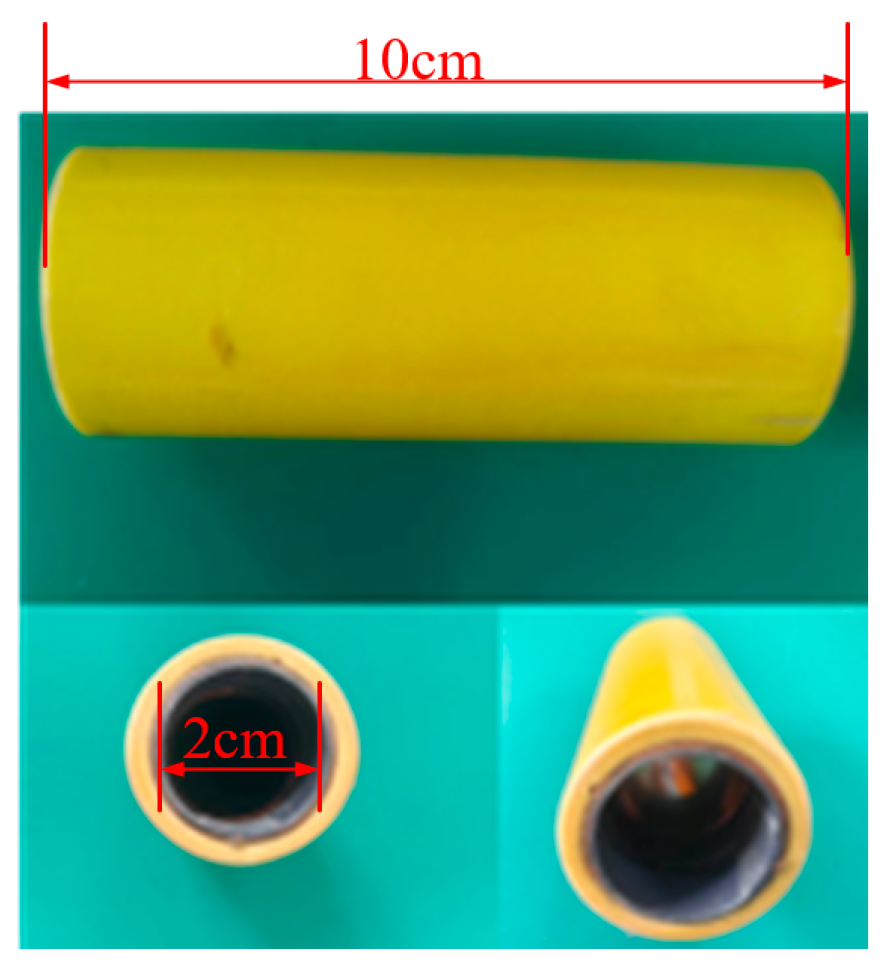
In order to verify the feasibility of the proposed method in the actual measurement, the coaxial sensor with internal and external induction electrodes of copper, inter-electrode insulation medium of epoxy resin, and outer layer of PVC pressure-resistant material is made, and the actual sensor is shown in
Figure 10. The total set parameter capacitance (sampling capacitance) and the fabricated coaxial sensor used in the experiments were measured using the Tong-Hui TH2840BX precision LCR digital bridge for the capacitance value to eliminate the measurement error caused by the difference between the actual and nominal values of the capacitance, and the measured capacitance value of the coaxial sensor was 95 pF.
Firstly, the low-voltage performance of the sensor is tested in a low-voltage scenario (100 V–300 V), and, secondly, it is verified whether the method proposed in this paper can effectively improve the voltage division ratio of the sensor and can be applied to a high-voltage measurement scenario (1 kV–5 kV).
4.1. Sensor Low Voltage Scenario Testing
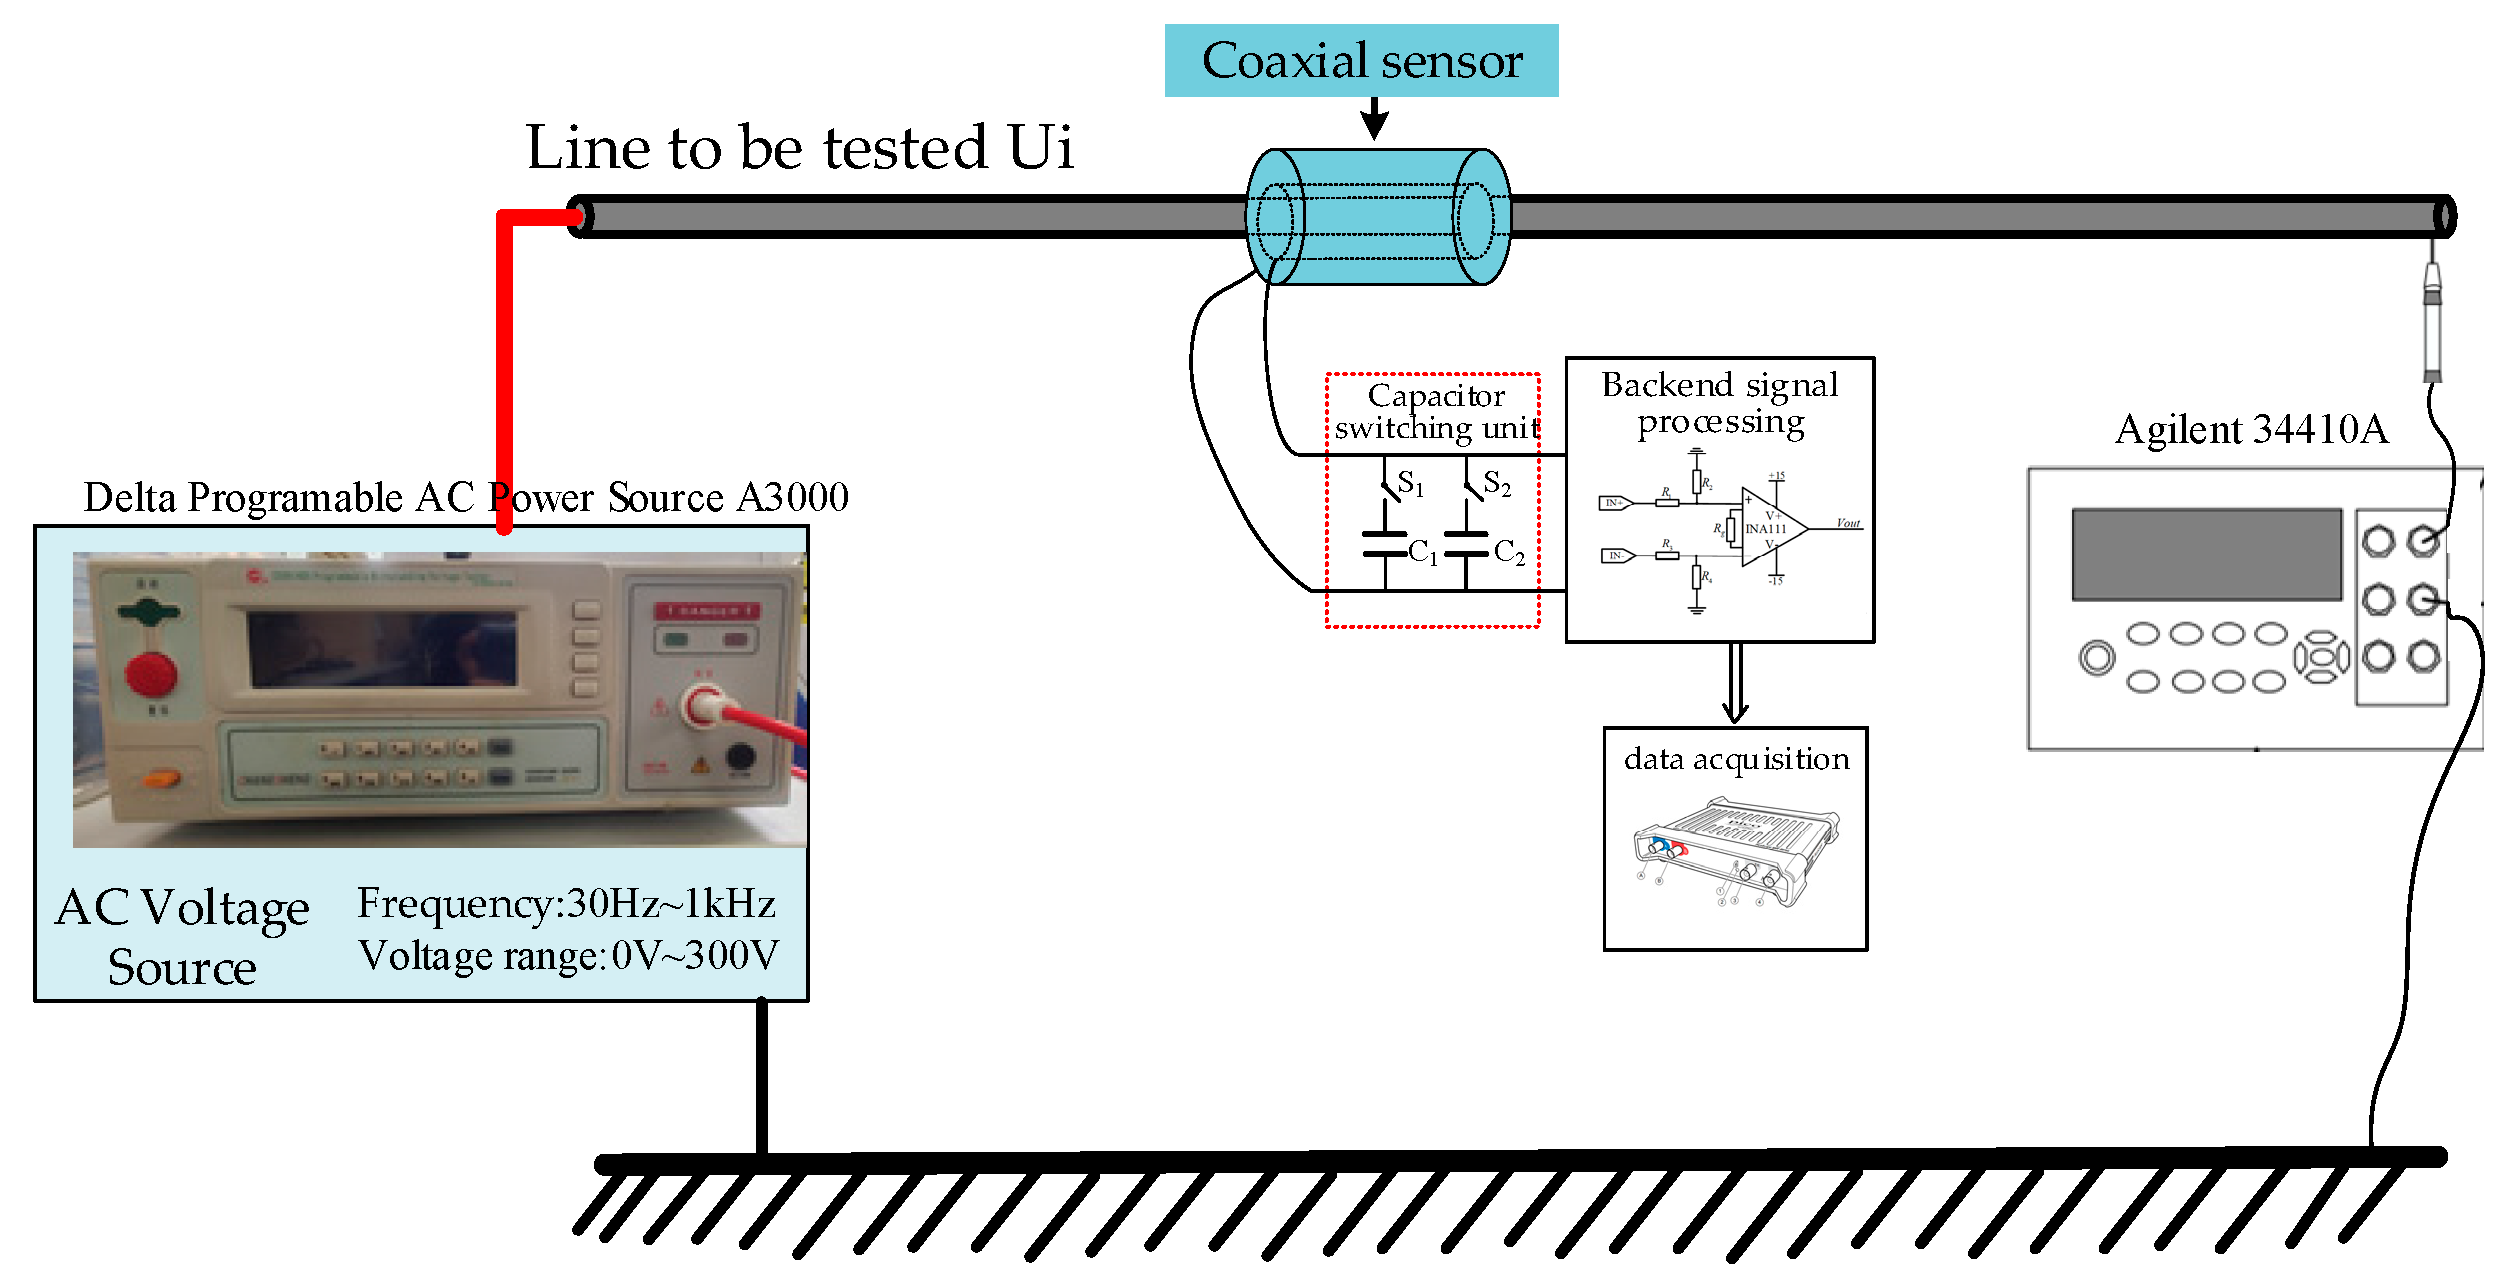
In the experiment, the Delta Programable AC Power Source A3000 (output voltage range 0–300 V, frequency 30 Hz–1 kHz) was used to generate the voltage to be measured, increasing from 100 V to 300 V in steps of 20 V, and the output voltage was measured using an Agilent 34410A digital multimeter to determine the line to be tested. The actual voltage value is determined using an Agilent 34410A digital multimeter. The coaxial sensor is mounted on the line to be measured, and the output voltage is obtained by a 16-bit PicoScope 5244D data acquisition card after the sensor output voltage is processed by the back-end circuit. The experimental schematic and the experimental platform are shown in
Figure 11 and
Figure 12.
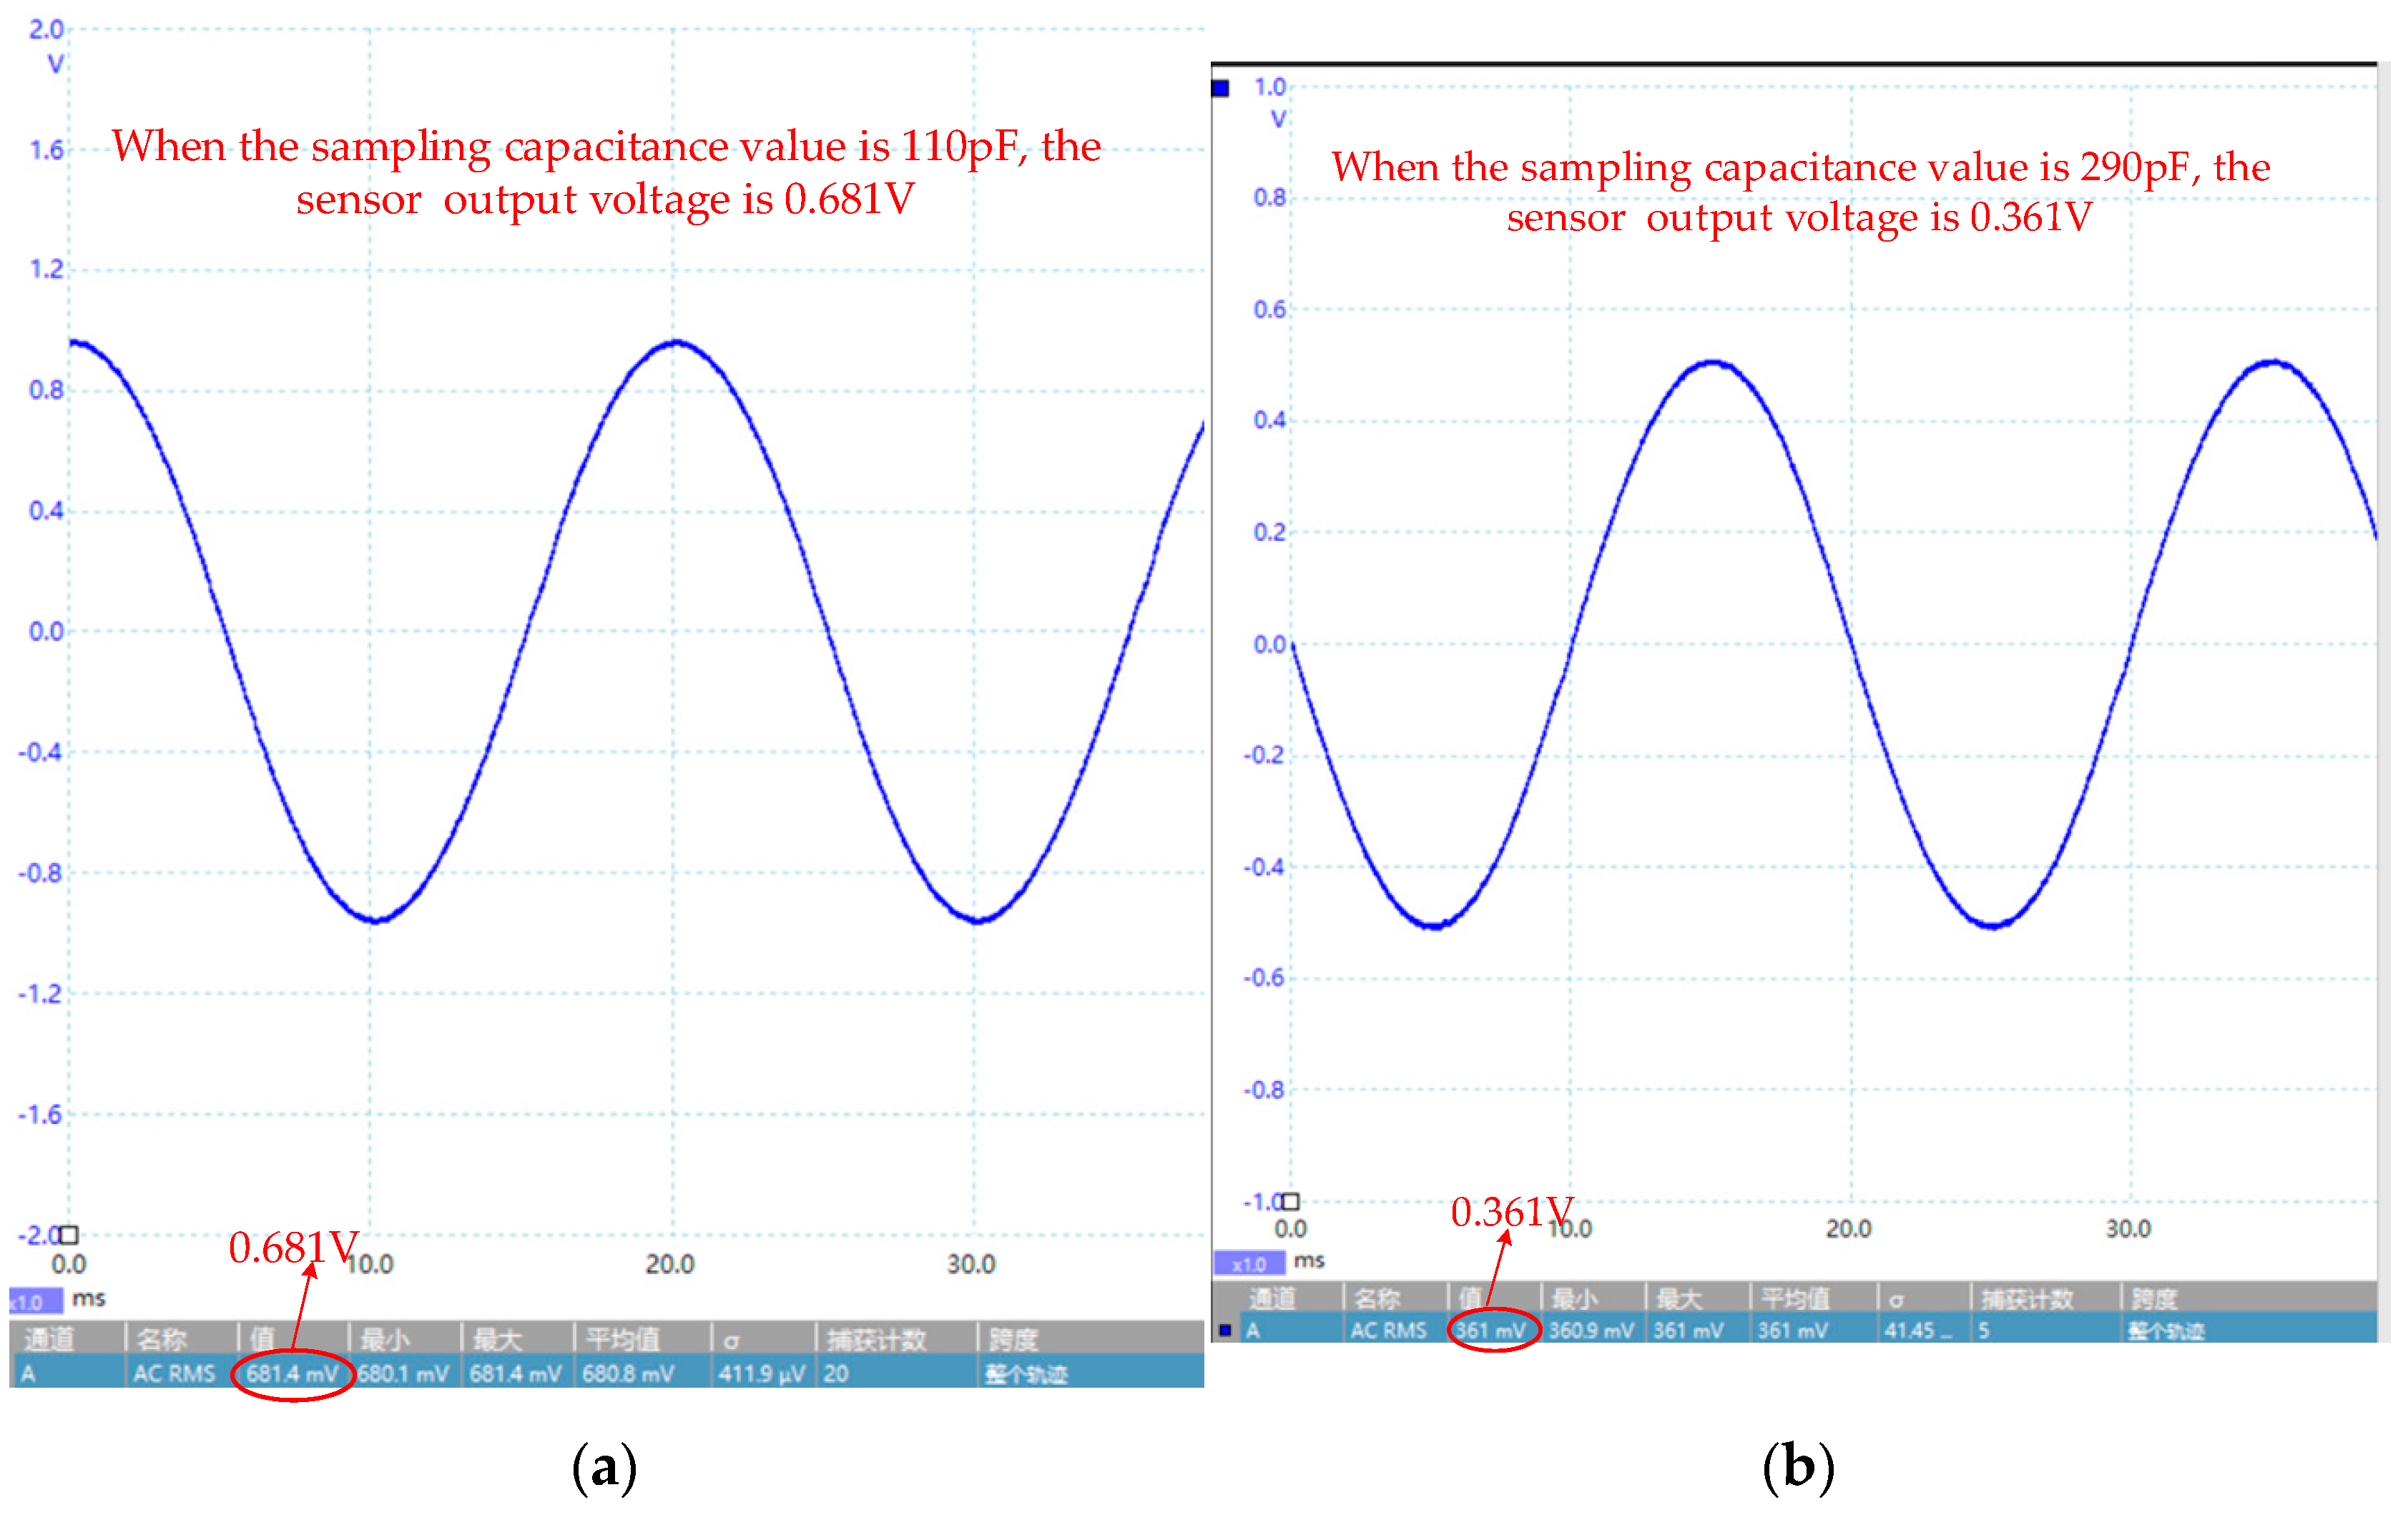
Select parallel sampling capacitors 110 pF, 290 pF, AC source output amplitude 100 V, and frequency 50 Hz of the voltage to be measured, and switch the sampling capacitance to obtain different output voltage of the sensor as shown in
Figure 13. Calculate the value of the sensor coupling capacitance under such conditions as shown in
Table 1.
From
Table 1, it can be concluded that the series equivalent values
of the stray capacitances
and
between the sensor and the line to be measured and the ground are approximately 1.40 pF. In the low-voltage performance test, the maximum voltage of the line to be tested is 300 V. In order to make the sensor output voltage less than 3.3 V to meet the subsequent AD acquisition, the sensor voltage division ratio should be greater than 300/3.3 ≈ 91. The voltage division ratio is taken as 91 and substituted into Equation (9) to obtain the minimum sampling capacitance value of 31 pF. In order to make the sensor with a larger voltage division ratio, it is easier to meet the self-integration conditions, the sampling capacitance is taken as 290 pF, the voltage division ratio of the sensor is 276, and the equivalent circuit model of the measurement system and its frequency characteristics are shown in
Figure 14. It can be seen that the sensor works in a self-integrating model, which meets the design requirements.
The low-voltage performance (linearity and accuracy) of the sensor is shown in
Table 2 and
Figure 15, where the input voltage
is measured by an Agilent 34410A digital multimeter as the true voltage of the line to be measured, and the output voltage
of the sensor is measured by a PicoScope 5244D data acquisition card. The ratio error (ε%) is defined as
In Equation (14), K is the partial pressure ratio of the sensor, which is 276 under this operating condition.
In
Figure 15, the horizontal axis represents the actual voltage value
of the tested circuit, the left axis represents the reconstructed voltage value
based on the sensor output, and the right axis represents the ratio error between the reconstructed voltage value and the actual voltage value. From the graph, it can be seen that the linear relationship is y = 0.99x + 1.82 (y represents the reconstructed voltage, and x represents the actual voltage of the line) with a fitting degree of 0.9951. Therefore, the sensor can determine the coupling capacitance value in low-voltage measurement scenarios, accurately measure the voltage value to be measured, have good linearity, and the measurement error is within 2.0%.
4.2. Sensor High-Voltage Scenario Testing
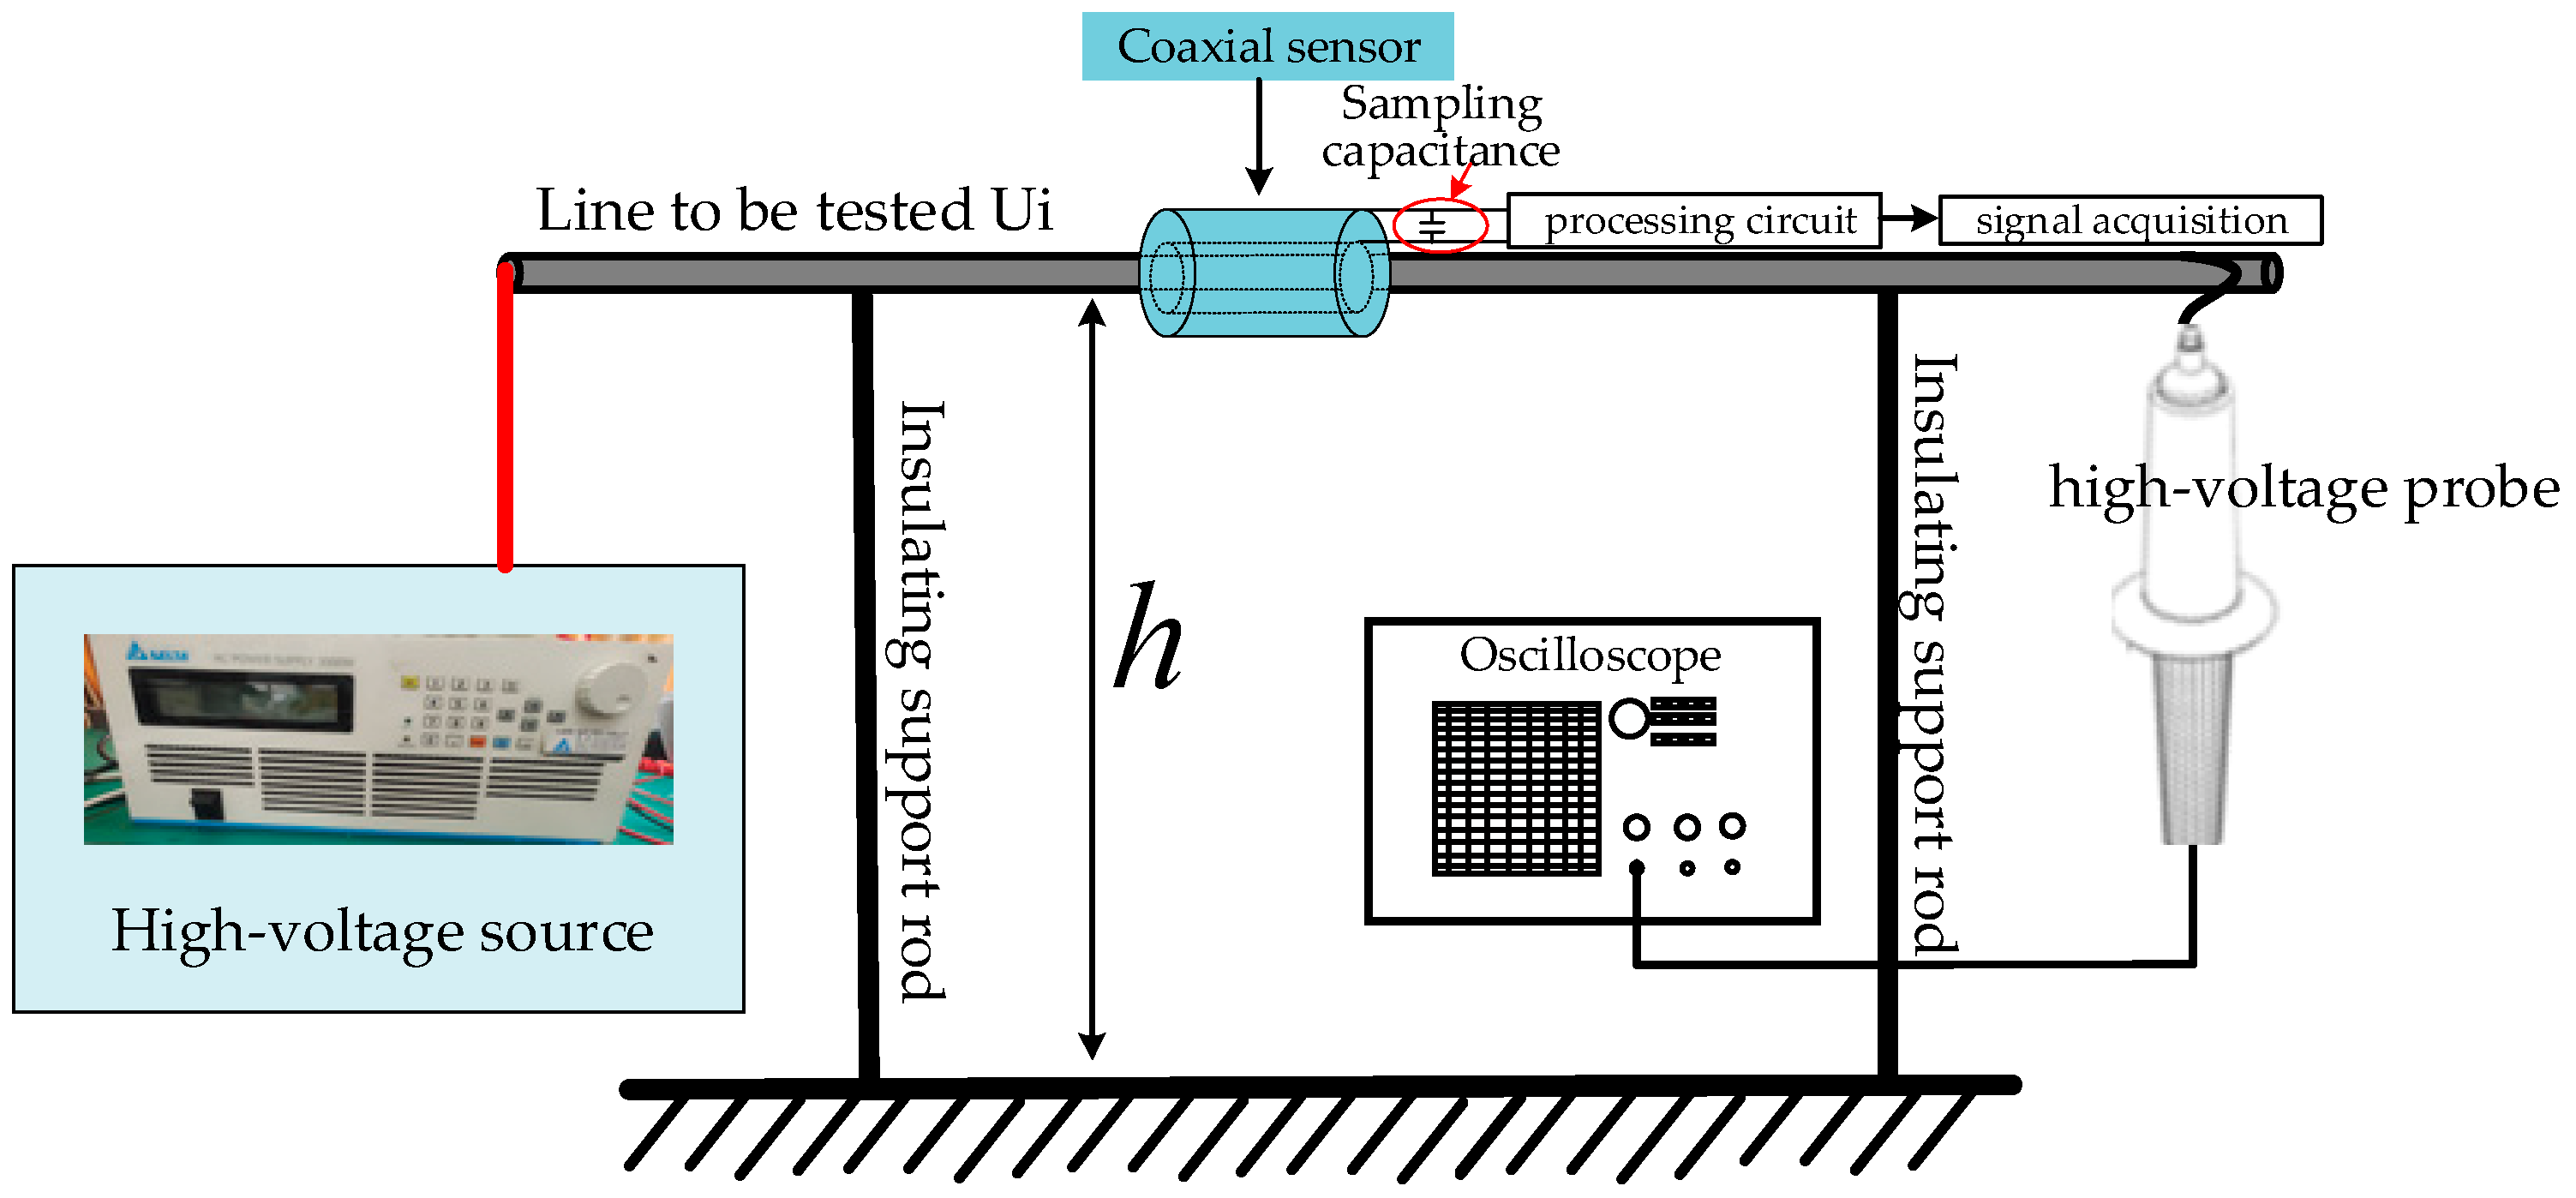
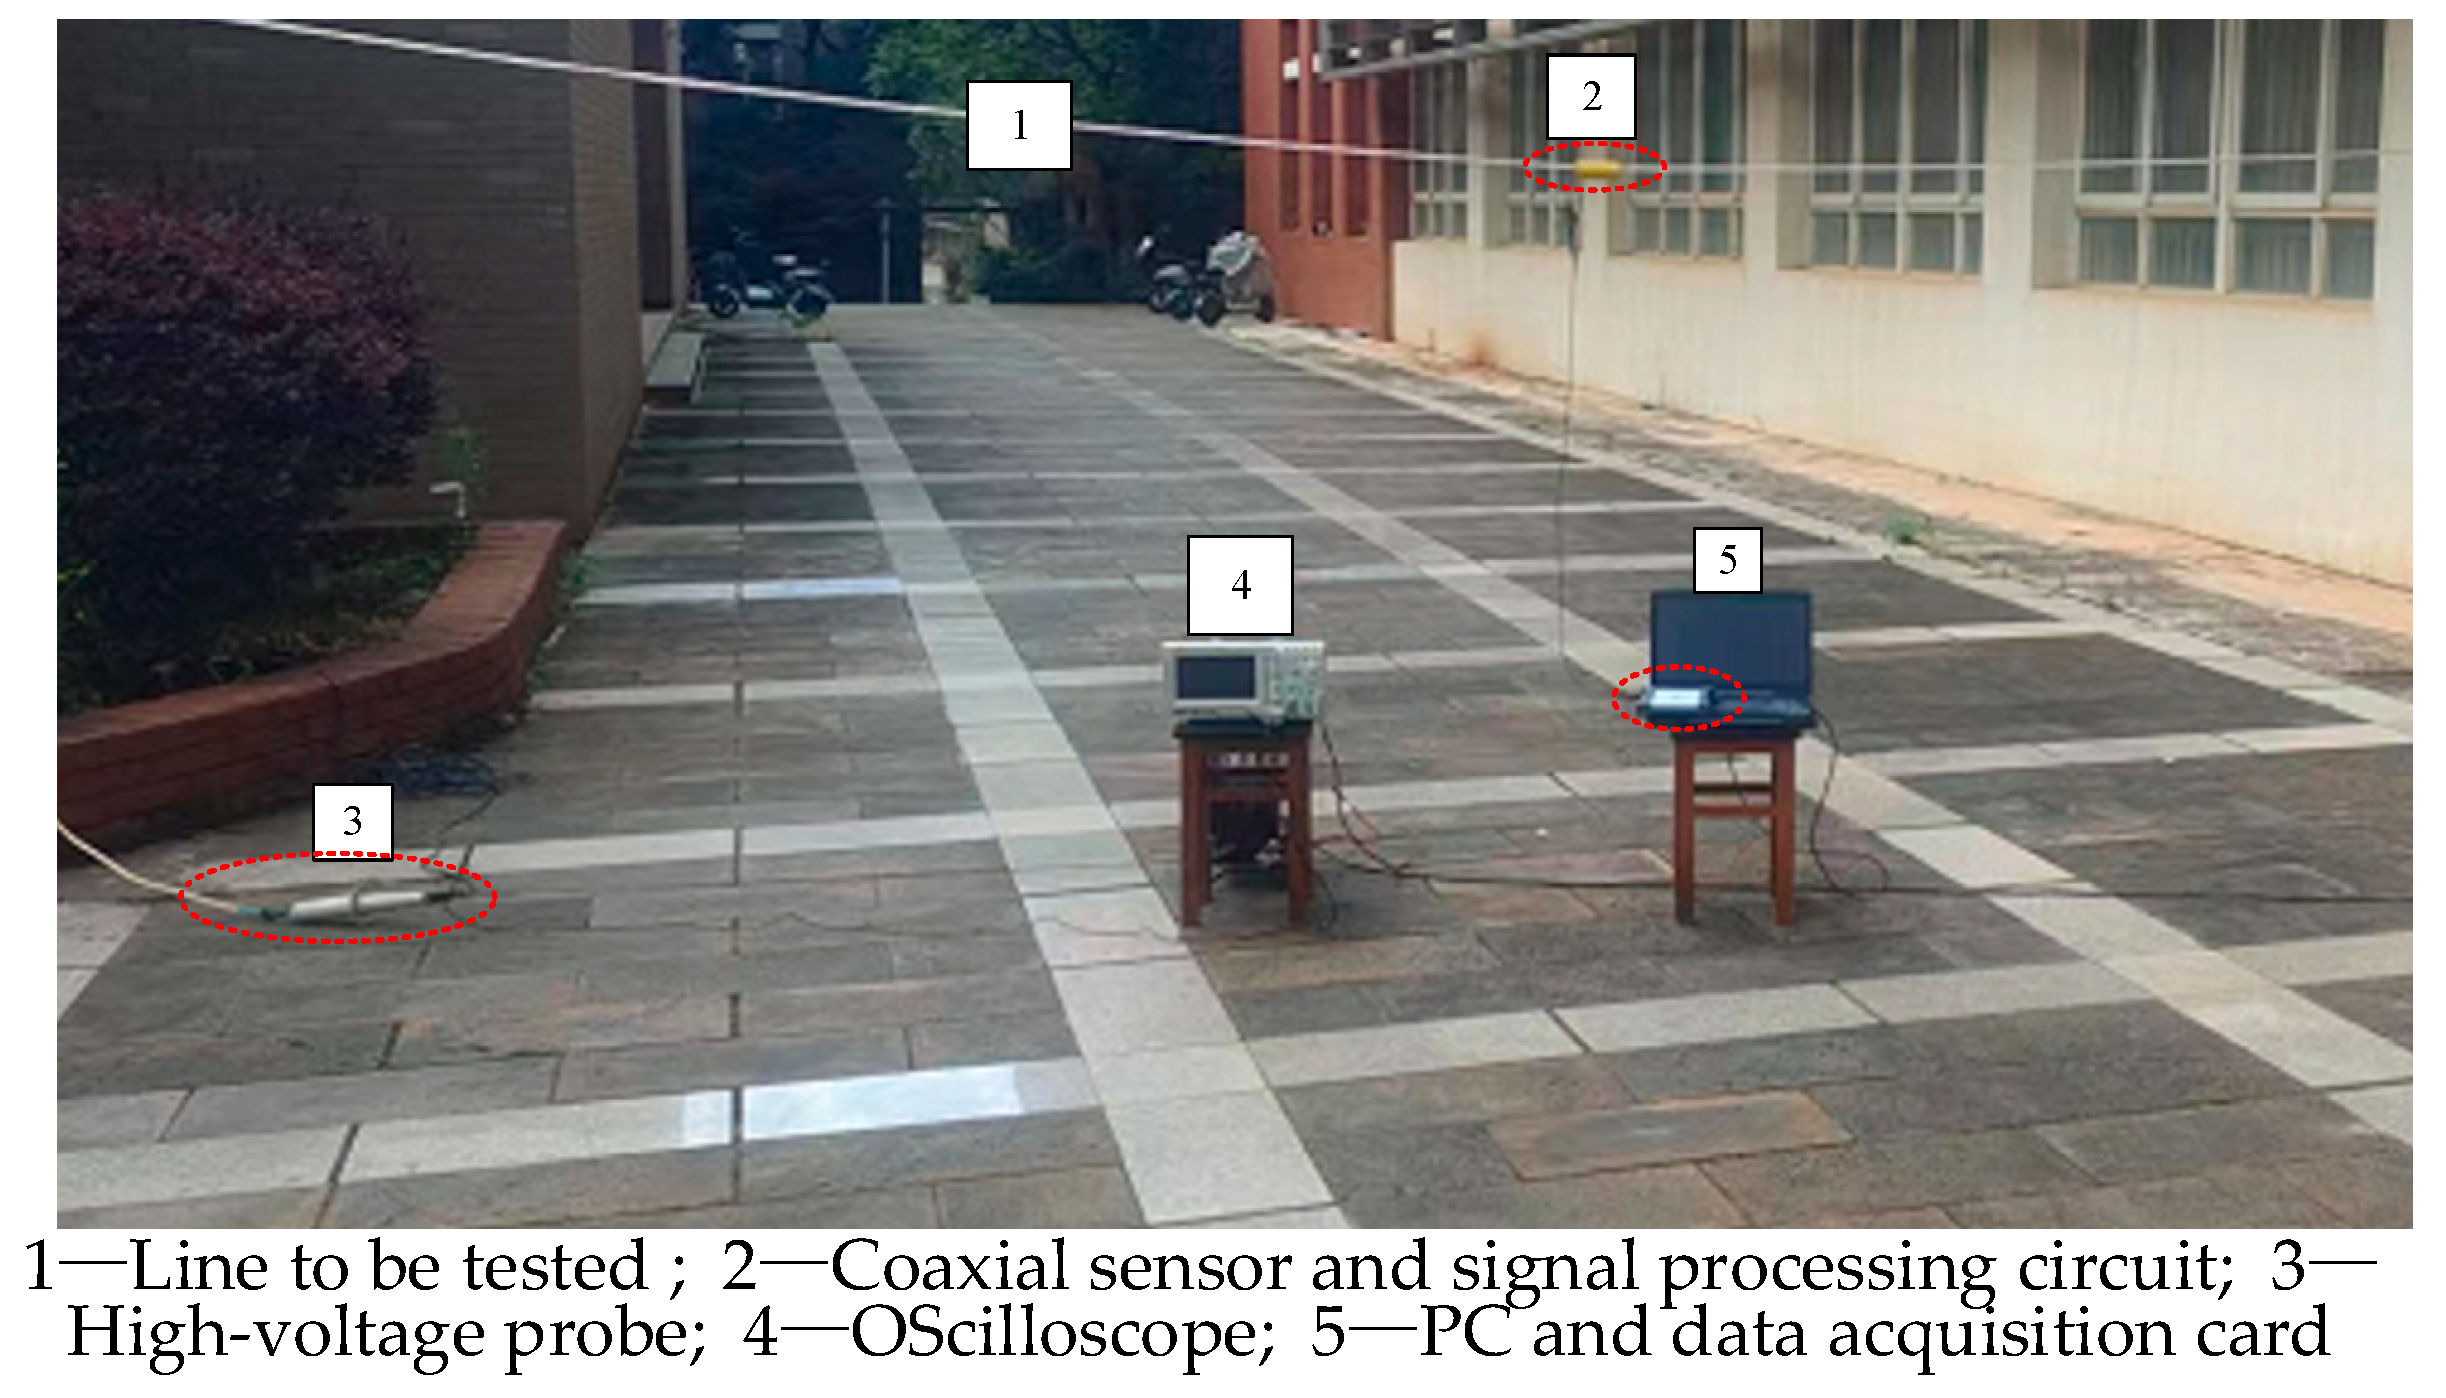
When testing the performance of the sensor in high-voltage scenarios, choose the Changsheng CS9914BX (output voltage range 0.05 kV–5.0 kV, frequency 40 Hz–400 Hz) high-voltage source to output the voltage to be tested, and use the high-voltage probe TekP6015A as a reference to determine the true value of the line voltage to be tested. Hang the coaxial sensor on the circuit to be tested, and the output voltage of the sensor is obtained through the back-end processing circuit using a 16-bit PicoScope 5244D data acquisition card. The experimental schematic diagram and experimental platform are shown in
Figure 16 and
Figure 17.
Select parallel sampling capacitors 1074 pF, 3140 pF, AC source output amplitude 1000 V, and frequency 50 Hz of the voltage to be measured to obtain different output voltage of the sensor as shown in
Figure 18. Calculate the value of the sensor coupling capacitance under such conditions as shown in
Table 3.
From
Table 3, the coupling capacitance value
is 1.89 pF; the minimum voltage division ratio of the sensor is 5 kV/3.3 ≈ 1516 for the sensor output voltage less than 3.3 V, and the minimum value of the sampling capacitance is 2769 pF. Therefore, the sampling capacitance is taken as 3140 pF, at which time the voltage division ratio of the sensor is 1712, and the equivalent circuit model of the measurement system and its frequency characteristics are shown in
Figure 19. The sensor works in self-integrating mode, which meets the design requirements.
The high-voltage performance (linearity and accuracy) of the sensor is shown in
Table 4 and
Figure 20, where the input voltage
is measured by the high-voltage probe TekP6015A, which is the true voltage of the tested circuit, and
is obtained by the PicoScope 5244D data acquisition card, which is the output voltage of the sensor. Substitute the value of
as 1712 into Equation (14) to calculate the ratio error (ε%).
In
Figure 20, the horizontal axis represents the output voltage value of the high-voltage probe, which is the actual voltage value
of the tested circuit. The left axis represents the reconstructed voltage value
based on the sensor output, and the right axis represents the ratio error between the reconstructed voltage value and the actual voltage value. From the graph, it can be seen that the linear relationship is y = 1.01x − 18.64 (y represents the reconstructed voltage, and x represents the actual voltage of the line), with a fitting degree of 0.9997. Therefore, the sensor can measure the voltage value to be measured in high-voltage scenarios with good linearity and measurement error within 2.0%.
4.3. Advancement of the Measurement System
To highlight the advanced nature of the measurement system proposed in this paper, it is compared with other measurement systems mentioned in the introduction section in terms of measurement method, measurement principle, accuracy, system cost, and its advantages and disadvantages, as shown in
Table 5.
Therefore, the non-invasive floating ground voltage measurement method proposed in this article has advantages over traditional contact voltage measurement, such as low cost, high safety, low insulation difficulty, and simple structure. At the same time, this method also solves the drawback that traditional capacitive non-contact voltage measurement cannot be applied without an effective grounding point.


