Article

Research on Improved Multi-Channel Image Stitching Technology Based on Fast Algorithms

Beijing Engineering Research Center for IoT Software and Systems, Beijing University of Technology, 100 Pingleyuan, Chaoyang District, Beijing 100124, China
*
Author to whom correspondence should be addressed.
Electronics 2023, 12(7), 1700; https://doi.org/10.3390/electronics12071700
Submission received: 24 February 2023 / Revised: 30 March 2023 / Accepted: 3 April 2023 / Published: 3 April 2023
(This article belongs to the Topic Computer Vision and Image Processing)

Abstract

:
The image registration and fusion process of image stitching algorithms entails significant computational costs, and the use of robust stitching algorithms with good performance is limited in real-time applications on PCs (personal computers) and embedded systems. Fast image registration and fusion algorithms suffer from problems such as ghosting and dashed lines, resulting in suboptimal display effects on the stitching. Consequently, this study proposes a multi-channel image stitching approach based on fast image registration and fusion algorithms, which enhances the stitching effect on the basis of fast algorithms, thereby augmenting its potential for deployment in real-time applications. First, in the image registration stage, the gridded Binary Robust Invariant Scalable Keypoints (BRISK) method was used to improve the matching efficiency of feature points, and the Grid-based Motion Statistics (GMS) algorithm with a bidirectional rough matching method was used to improve the matching accuracy of feature points. Then, the optimal seam algorithm was used in the image fusion stage to obtain the seam line and construct the fusion area. The seam and transition areas were fused using the fade-in and fade-out weighting algorithm to obtain smooth and high-quality stitched images. The experimental results demonstrate the performance of our proposed method through an improvement in image registration and fusion metrics. We compared our approach with both the original algorithm and other existing methods and achieved significant improvements in eliminating stitching artifacts such as ghosting and discontinuities while maintaining the efficiency of fast algorithms.

1. Introduction

Video stitching combines the images of multiple partial views with overlapped sections to create a complete scene. It effectively solves the single-camera view’s limitations [1] and has broad applications in many fields, such as virtual reality [2], drone aerial photography [3], medical imaging [4], remote sensing images [5], and intelligent robot navigation [6]. The initial concept for our project was driven by the demand for rapid indoor and outdoor scene stitching and displays as the need for multi-camera video stitching applications continues to grow. In areas with diverse scenes, such as scenic areas [7], buildings [8], mining work environments [9], and indoor and outdoor monitoring [10], the display and monitoring effects of multi-camera video stitching were unparalleled compared to single cameras. Additionally, we considered the potential future application of this technology to embedded devices.
In the field of algorithms, in addition to the traditional image registration and fusion algorithms used in image stitching, an increasing number of improved methods have also been applied to various stages of the image stitching process. For example, Hoang et al. [7] proposed a deep-learning-based image stitching method that was used to generate high-resolution panoramic images that support virtual tourism interactions. Chen et al.’s [11] proposed method introduced a new energy function to reduce structural deformation near the seams and improve the invisibility of the seams, which was particularly effective when applied to images with continuous depth variations and complex textures.
In terms of application platforms, there are currently many image stitching applications based on field-programmable gate array (FPGA) or graphics processing unit (GPU) platforms. Jose et al. [12] proposed a video stitching method based on FPGA architecture, which was designed in Verilog for video frame capture, SIFT feature detection, video frame stitching, and an output display driver. Du et al. [13] improved feature detection based on GPU characteristics to achieve real-time video stitching. Regarding image and video stitching applications in embedded devices [14], we roughly estimated that the ability of embedded platforms with 5 W to 10 W can achieve approximately three to five channels of video stitching for 480 P resolution images.
To balance the stitching effect and real-time performance of multi-channel video stitching applications, we strengthened the stitching effect of fast image stitching algorithms or optimized complex algorithms and improved their efficiency. Ultimately, from the perspective of algorithm complexity and the difficulty of platform porting, our research approach for multi-channel image stitching methods was to use fast image registration and fusion algorithms to enhance the stitching effect.
Our research and contributions on image stitching algorithms mainly focused on two stages: image registration and image fusing.
  • In the registration stage, the accuracy of registration was improved based on the Brisk + GMS fast image registration algorithm. In this stage, the gridded BRISK method was used to improve the efficiency of feature point matching, and the bidirectional matching GMS algorithm was used to improve the accuracy of feature point matching.
  • In the fusing stage, the stitching effect was improved based on the seamline and weighted average fusion algorithm. In this stage, the image was fused, including the determination of the stitching area and image blending, to obtain a panoramic image. Firstly, the best seam line method was used to obtain the stitching seam, and then different blending regions were constructed. The weighted average algorithm was used to blend the stitching, transition, and extension regions, resulting in a high-quality and smooth stitching image.
The rest of this paper is organized as follows: A review and brief analysis of the related work on image stitching is presented in Section 2. The algorithmic basis for the proposed method is also presented in this section. In Section 3, a proposed and improved image stitching method is discussed. Section 4 compares and analyses the experimental results of the proposed method with other methods. The paper is concluded in Section 5.

2. Related Work

Image registration aims to find the geometric relationship between video images and perform the alignment process. The image registration process works as follows:
  • The first step is identifying and describing the two images’ feature points.
  • Next, the feature point sets are matched, and the transformation parameters are calculated based on the successful matching pairs.
  • Finally, the parameters are applied to achieve image alignment.
Video image fusion aims to stitch the registered video images with overlapping areas in the video image frames to synthesize a panoramic video image without apparent seams and natural transitions.
This section provides an analysis of the various common algorithms used for image feature extraction, feature matching, and image fusion in the two stages of image registration and image fusion. We also propose the basis and rationale for choosing fast algorithms for image registration and image fusion.

2.1. Image Registration

Image registration algorithms can be divided into the transform domain, grayscale information, and image features. Feature extraction is extremely important for object recognition [15] and image stitching [16]. Feature-based image registration algorithms are experimentally verified to have the advantage of fast computational speed, stability, and accuracy.
In the stage of extracting image feature points, Binary Robust Independent Elementary Features (BRIEF) [17], BRISK [18], Oriented FAST and Rotated BRIEF (ORB) [19], Scale-Invariant Feature Transform (SIFT) [20], Speeded Up Robust Feature (SURF) [21], Principal Components Analysis SIFT (PCA-SIFT) [22], Learned Invariant Feature Transform (LIFT) [23], and Coherence-based Decision boundaries (CODE) [24] are more robust algorithms. Among them, PCA-SIFT, LIFT, and CODE are even more robust algorithms with higher computational complexity, which is not suitable for real-time applications. SURF, BRISK, and ORB algorithms are faster but less robust, and they are generally more practical in systems with limited hardware resources and high real-time requirements. BRISK is stronger than SURF in image feature extraction under illumination changes and is more robust than ORB [25,26]. Taking into account the actual application in our research, the BRISK feature extraction algorithm was adopted, and its limitations were solved.
After feature point extraction, two feature point sets were obtained for the images in order to be stitched, and image matching found a correspondence between the feature points of the two images. In the rough matching stage of image feature points, the nearest neighbor method is commonly used, with BF (Brute-Force) and FLANN (Fast Library for Approximate Nearest Neighbors) being the most well known. Both of them are O(N^2) matching algorithms, but FLANN’s parameters are more difficult to select. In our actual application, the effect of matching using the BF algorithm is better. Therefore, the BF algorithm was used for coarse matching in this paper.
After the rough matching process, mismatches arise, and the fine matching method must be used to eliminate the matching relationship of the incorrect feature points. The Random Sample Consensus (RANSAC) [27] and Progressive Sample Consensus (PROSAC) [28] algorithms are commonly used and have uncertainty in estimating parameters because they are based on random sampling. In addition, there are optimization-based Graph Matching algorithms and motion-estimation-based matching methods. Among them, the GMS algorithm based on motion estimation has the best time efficiency. Li et al. [3] proved the superiority of GMS in matching performance with smaller overlapping and less-textured problems. In this paper, the GMS algorithm with good time efficiency was used for the fine matching method, and the RANSAC-based outlier rejection scheme was used to calculate the registration accuracy. The GMS algorithm only completed the matching stage of feature points, using Hamming distance to measure the similarity between feature points, with high robustness and real-time matching performance, which could quickly distinguish correct and incorrect feature point matching pairs.

2.2. Image Fusion

In the image fusion stage, weighted average fusion, multi-resolution fusion [29], Poisson fusion [30], and optimal seam line fusion [31] are more common fusion methods; each algorithm has its pros and cons and is applicable in different scenarios. The optimal seam line algorithm can be combined with weighted average fusion or multi-resolution fusion methods to improve the image fusion effect. Among them, the algorithms that are fast in fusion and achieve a balance in fusion effect are the weighted average fusion based on the optimal seam line and the multi-resolution fusion based on the seam line proven for real-time performance [32].
The optimal seam algorithm finds an ideal seamline segment or seam according to the search strategy, and then a fusion strategy is used along the optimal seam to stitch the image. The common search algorithms are the Dijkstra algorithm, graph cuts, and dynamic programming. The graph cut method has a better fusion effect, while there are several optimal seamline positions, and the seamline to be found is rough. Therefore, it is recommended to use this algorithm in combination with other fusion algorithms to achieve the most accurate results.
The weighted average fusion method includes direct averaging and the fade-in and fade-out weighting average method. These two methods are considered classic and relatively simple fusion techniques. In the fade-in and fade-out weighting average fusion method, the overlapping parts of the two images are added and averaged to produce the fused image. However, this method may result in ghosting at the stitching seamline, and if the exposure of the images is different, it may also lead to color unevenness or inconsistency in the final image.
In multi-resolution fusion, images are fused using the structure of the Gaussian pyramid and Laplacian pyramid, which can solve the problem of stitching the seamline and cause a difference in exposure. The multi-resolution method may lead to ghosting and missing details in the image.
This paper adopts an improved fade-in and fade-out weighted fusion algorithm based on the optimal seam algorithm.

3. Proposed Image Stitching Method

In this section, we propose a method that can enhance the stitching effect of existing fast image algorithms in this paper. We improved the effect and accuracy of image stitching at each stage of the fast image algorithms used in this paper, including BRISK feature point extraction, BF + GMS feature matching, and optimal seam line + weighted average fusion algorithms, while taking into account the efficiency of the algorithm.

3.1. Improved Gridded BRISK Algorithm

The BRISK algorithm uses adaptive and generic corner detection based on a novel scale-space FAST-based (AGAST) detector for feature point detection. A concatenated binary bit string is obtained when constructing a feature descriptor by comparing grey pixel values to describe the feature points. It adopts the neighborhood uniform sampling mode and constructs discrete Bresenham’s line circles to be concentric with the key points. The constructed concentric circles are then evenly sampled to create circles of various radii around the feature point’s center. The BRISK algorithm has high efficiency, simple operation, good rotation invariance, scale invariance, certain diffraction invariance, and high-quality performance for registering large, blurred images.
However, the shortcoming of the BRISK algorithm is that the extracted feature points are still not uniformly distributed to describe the feature information of the image completely. As shown in Figure 1a, the feature points extracted by the BRISK algorithm are denser in places where the local features are prominent, and the corresponding features are not detected in the places where the surrounding features are not noticeable, such as the ceiling, thus losing part of the image information.
Given the uneven distribution of feature points in the BRISK algorithm, the image is divided into small parts and it detects the image feature points in each grid separately to achieve a more uniform distribution of feature points. After comparison experiments, it was found that the image’s 4 × 4 grid division was easy to operate for the image with a resolution of about 480 × 640 pixels and could take into account the time and feature point extraction effects.
In the experiment, we also found that setting an appropriate limit on the number of feature points detected in each grid in the program did not reduce the effect of feature point extraction. We used 500 feature points per grid to effectively evaluate the performance of feature extraction. According to the improved BRISK algorithm obtained from the above settings, we can solve the uneven distribution of feature points problem in the BRISK algorithm and achieve better time efficiency.
The feature extraction result by the non-gridded BRISK algorithm is shown in Figure 1a, and the feature extraction result by the gridded BRISK algorithm is shown in Figure 1b.
We did not quantify a specific relationship between the number of grids and the effect of feature point extraction, nor did we analyze the reason for this from a theoretical perspective. However, this paper proposed an idea for future research: for image feature extractors with unevenly distributed detected feature points, a grid-based image segmentation method could be used to extract image features separately based on image details. An evaluation index for whether the distribution of feature points was uniform could be formulated to calculate the number of grids adaptively in different scenarios and in order to achieve the best grid effect.
The feature detection algorithm extracts features from the entire screen’s image, while for the stitching of multi-channel video images only the feature points in the overlapping area of the camera vision are important. The overlapped portions of the image or the outer expansion regions close to the overlapped portions were detected, which drastically minimized the calculation time required for feature detection and the quantity of correctly and incorrectly detected feature points. This paper’s camera image acquisition and feature extraction regions are schematically depicted in Figure 2.
The extraction algorithm is only used in the feature extraction area. In different scenarios, the size of the overlapping area between the camera views must be considered to calculate the feature extraction area of the video image. The overlapping area of the same scene is approximately 30–60% [8]. Therefore, we set the overlapping area of the images to be no less than one-third of the source image and followed this rule to capture images for stitching during the experiment.

3.2. Bidirectional Matching Strategy Based on GMS Algorithm

In the feature matching stage, correspondences were identified between sets of feature points extracted from two images, and matching point pairs were optimized to eliminate false matches. The proposed matching strategy uses the BF matching method to perform rough matching and then uses the GMS algorithm to perform fine matching.
The BF algorithm uses a random sampling strategy for rough matching, and there are many mismatches that need to be removed by GMS fine matching. However, when multiple feature points in the area match the same feature point, the GMS algorithm generally does not eliminate the mismatched pairs.
A bidirectional BF matching method is proposed in this work. The feature extraction algorithm was used to find a matching point B in image b for the corresponding feature point A in image a to match images a and b. Similarly, image a was searched to match image b’s feature point B to point A’. Points A and A’ were compared; if the two points were identical, feature points A and B were correctly matched to feature point pairs; otherwise, the two points were considered mismatched.
In summary, in the image registration stage, given the disadvantage of uneven feature distribution in the feature extraction of the BRISK algorithm, the grid division method was used to improve it. Furthermore, the extraction area was limited to the overlapping part of the image, thereby reducing the number of feature points and improving the speed of feature extraction. In the matching stage, the combination of bidirectional BF rough matching and GMS precise matching was used to improve the matching accuracy.

3.3. Weighted Image Fusion Algorithm Based on Optimal Seam Line

The fade-in and fade-out weighted average fusion method’s algorithm works on the basis that each pixel point in the overlapped area of the left and right images was assigned a weight coefficient based on its coordinate position, and this weight was used to calculate the pixel information of the fused image. The principle of the algorithm is shown in Figure 3.
As shown in Figure 3, assuming that the left image pixel of the two images to be fused is L ( x , y ) , the right image pixel is R ( x , y ) , and the stitched image pixel is I ( x , y ) , the expression of the fade-in and fade-out weighted average fusion method can be written as follows:
I ( x , y ) = { L ( x , y )                                       ( x , y ) L W 1 ( x , y ) L ( x , y ) + W 2 ( x , y ) R ( x , y )   ( x , y ) ( L R ) R ( x , y )                                       ( x , y ) R
where W 1 and W 2 are the weighting coefficients of the pixel points ( x , y ) in the overlapping area on the two images and W 1 + W 2 = 1. Their corresponding weight functions are W 1 ( x , y ) and W 2 ( x , y ) , respectively, as shown in Formula (2):
{ W 1 ( x , y ) = X R x X R X L W 2 ( x , y ) = x X L X R X L
X L and X R in the equation are expressed as the left and right borders of the overlapping area of the image; therefore, the width of the overlapping area is W = X R X L .
When ghosting was removed using the optimal seam method, the stitching’s seams became very obvious, which created a new problem, as the entire image’s overlapping regions were fused using the fade-in and fade-out weighted average fusion method. The more pronounced seam pixels were handled as other pixels in the overlapped area, blend transitions were less natural, and the seam line was more noticeable than in other pixels. As a result, each seam area needs to be dealt with specifically.
In this paper, after calculating the width of the overlapping area, the width of W e increased on both sides to create a new fusion area. Usually, 100- to 200-pixel values are taken, and these specific values can be taken based on the experimental results of the stitching scene. The schematic diagram of the constructed fusion area is shown in Figure 4 below. The width of the overlapping area is W , and the coordinates of the left and right boundaries are X L and X R , while the width of the fusion area becomes W + 2 W e . The original transition area is the overlapping area, excluding the seam area. The original and extended areas were combined into a new transition area, and the two new areas were transitioned and fused to the entire image.
After the optimal seamline was obtained, the area to be seamed was first fused individually. Thus, the pixels that needed to be calculated came from the image on the left, right, and seam area fused. The weight coefficient calculation formula of the weighted average fusion method was improved in accordance with the various pixel coordinate positions in the different areas, which were fused to perform the fusion in a targeted manner, eliminate the seam problem, and prevent ghosting. The improved weighted average fusion method was calculated by the weight coefficient formula of Formula (2). Different regions generated multiple boundaries and then performed a weight correction according to different boundaries to obtain the final fused image.
The diagram of the improved fade-in and fade-out weighted image fusion algorithm based on the optimal seam is shown in Figure 5.
The weight calculation formula of the fade-in and fade-out weighted average fusion algorithm in the seam area is shown in (3):
{ W 3 ( x , y ) = X s r x X s r X s l W 4 ( x , y ) = x X s l X s r X s l
Among them, W 3 + W 4 = 1, 0 < W 3 , W 4 < 1. x is the abscissa of the current pixel point and X s l and X s r are the abscissas of the left and right borders of the seam area.
The weight calculation formulas of the fade-in and fade-out weighted average fusion algorithm in the transition area are shown in (4) and (5):
{ W 1 ( x , y ) = X s l x X s l X l W 2 ( x , y ) = x X l X s l X l
{ W 5 ( x , y ) = X r x X r X s r W 6 ( x , y ) = x X s r X r X s r
Among them, W 1 + W 2 = 1, W 5 + W 6 = 1, 0 < W 1 , W 2 , W 5 , W 6 < 1 .   x is the abscissa of the current pixel point and X l and X r are the abscissas of the left and right borders of the transition area.
Finally, according to Formula (1), a corresponding modification was made, and the seam area was first fused to obtain the fusion image C ( x , y ) , and then the transition area was fused. The stitched image pixel calculated by the algorithm is shown in Formula (6):
I ( x , y ) = { L ( x , y )                                       x < X l W 1 ( x , y ) L ( x , y ) + W 2 ( x , y ) C ( x , y )             X l x < X s l   W 3 ( x , y ) L ( x , y ) + W 4 ( x , y ) R ( x , y )             X s l x < X s r W 5 ( x , y ) C ( x , y ) + W 6 ( x , y ) R ( x , y )             X s r x < X r R ( x , y )                                     x X r
The pixel values in the seam area were adjusted to blend into the surrounding image more naturally and smoothly using this fusion method, taking advantage of the information features of the different regions. This section combines the best seam method and the fade-in and fade-out weighting average method for fusion. The fused image of the seam area was obtained and computed with the newly constructed transition areas to solve the seam problem.
To sum up, the overall stitching process of the image is shown in Figure 6 to summarize the previous algorithms for image registration and fusion.

4. Experimental Results

In this section, we meticulously evaluate the multiple algorithmic improvements we proposed, such as the enhanced BRISK algorithm, image registration algorithm, and image fusion algorithm. Moreover, this section highlights the observed phenomena during the experiments and provides an in-depth analysis of the experimental results. We used other fast algorithms as control groups and presented the performance of each stage of image stitching using clear pictures and charts.
The experimental environment of this paper was as follows:
Operating system: Windows10 64-bit; software integrated development environment: Visual Studio2015, OpenCV2.4.13; hardware operating platform: Intel(R) Core(TM) i5-3230M CPU @2.60 GHz; memory: 8.0 GB RAM.
We captured image data using the rear cameras of several smartphones. The registered images were not simply cropped, rotated, subjected to changes in lighting, or scaled based on the original images. Instead, the original and registered images were captured separately, and only the image size was adjusted. For this study, multiple sets of images were selected, and all image sets were simulated to create a video stitching scene with restricted feature regions. The feature extraction regions were limited to the overlapping area at 1/2 of the image. The selected images in this study closely resemble real-world stitching scenes, and the comparison of image processing effects between algorithms was clearly evident.

4.1. Image Registration Result Analysis

This section verifies the speed and robustness of the improved BRISK + GMS algorithms proposed in this paper for image registration. First, an improvement in feature extraction after BRISK gridding was compared, and then the algorithm in this paper was compared with the BRISK + improved GMS algorithm, BRISK + RANSAC algorithm, and ORB + RANSAC algorithm in terms of feature point extraction performance. ORB and RANSAC were selected as the control group because the two algorithms have low computational complexity and are more in line with the requirements of improving real-time performance.

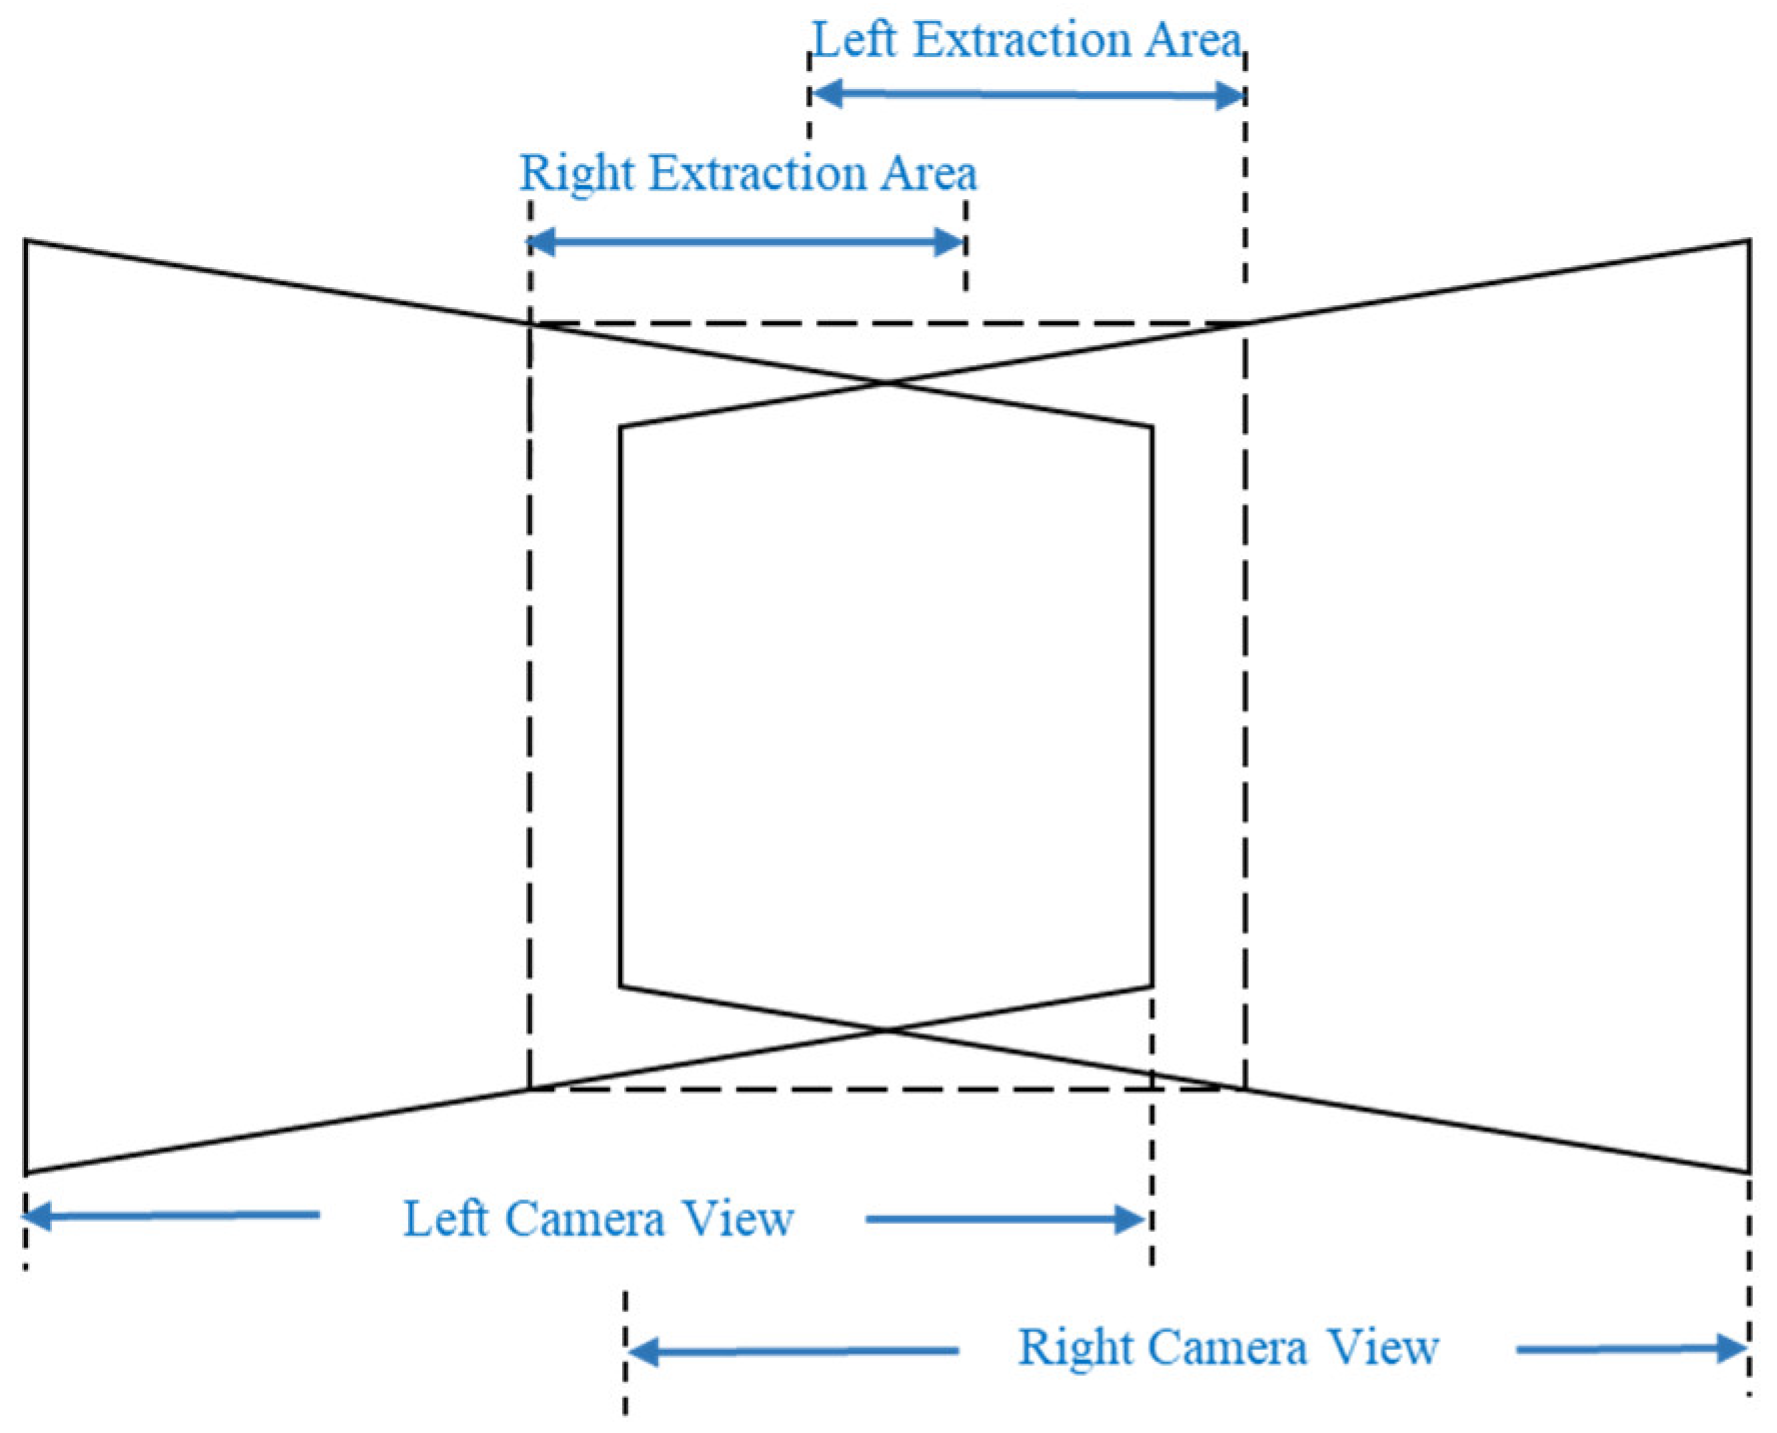
4.1.1. Improved Gridded BRISK Algorithm with Area Restriction

Figure 7 shows the comparison results of the number of detection feature points and the detection time for the left and right views before and after gridding the extraction area. The detection results of left and right views before and after gridding are summarized in Table 1. The improved algorithm reduced the number of feature points in the left view by 57.52% and the detection time by 35.24%. The algorithm also reduced the number of feature points in the right view by 50.51% and the detection time by 49.83%.

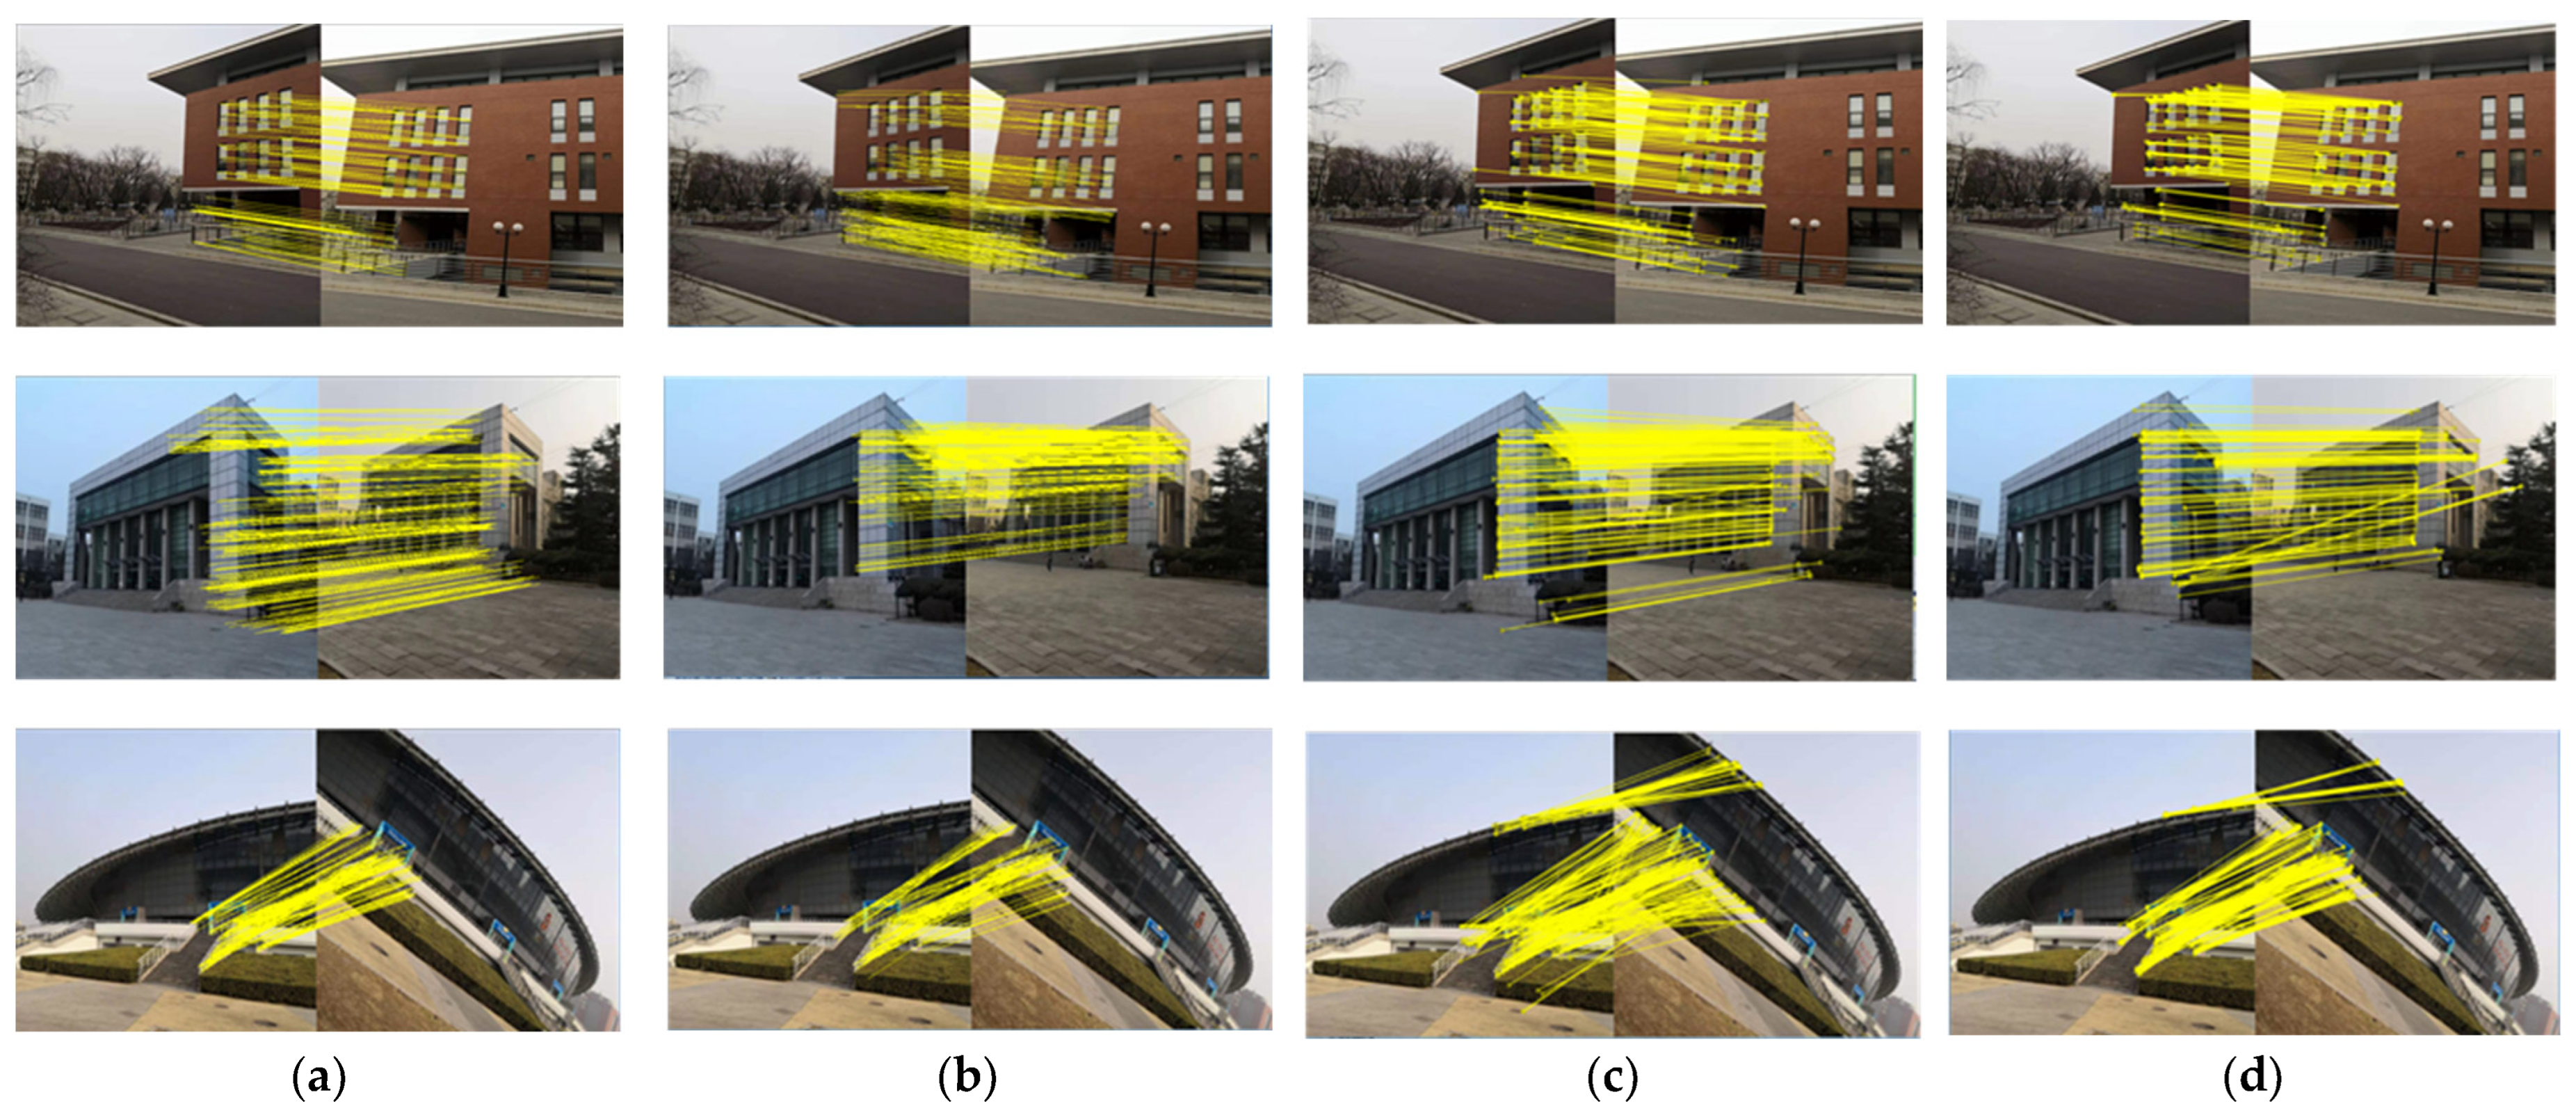
4.1.2. Image Registration Result Comparison

Image registration includes detection feature points and image feature matching. In this paper, three image transformations of scaling, exposure, and rotation were selected to match the image set, as shown in Figure 8.
In the proposed method of this article, the number of feature points extracted from each image was set at 1500, and the number of feature points per grid was limited to 500 to improve image registration efficiency and provide enough feature points for the GMS algorithm to match.
Figure 9, Figure 10 and Figure 11 show the results of image feature matching using the proposed algorithm of this article, the BRISK + improved GMS algorithm, the BRISK + RANSAC algorithm, and the ORB + RANSAC algorithm, respectively.
As seen in Figure 9, the proposed algorithm provided a more uniform distribution of feature points in the experiment, and there was no apparent accumulation phenomenon or mismatch of points.
Figure 10a compares the feature point detection performance for each algorithm, and Figure 10b compares the feature point pairs matching performance for each algorithm. The proposed algorithm typically detects fewer feature points than other algorithms, but more matching pairs and correct matching pairs were obtained, as shown in Figure 10.
By extraction area restriction, the number of point pairs that needed to be matched was significantly reduced, and the speed was also improved. This article employed the classic method for calculating precision based on the RANSAC outlier rejection to determine the number of correctly matched points. The precision calculation formula is shown in (7):
P e r c i s i o n = C o r r e c t M a t c h e s M a t c h e s × 100 %
The variable “Matches” represents a pair of matched points that have been filtered by the nearest neighbor to next neighbor distance ratio. Additionally, the “CorrectMatches” refers to the matching pairs that remain after filtering through a RANSAC-based outlier rejection scheme. The feature detection time and matching precision are shown in Figure 11.
Figure 11a demonstrates how this algorithm’s matching accuracy improved when compared to other algorithms subjected to scaling, exposure, and rotation transformations and how the average accuracy was essentially guaranteed to be above 85%. Figure 11b compares the total serial execution time taken by each algorithm to extract the feature points and match two images. Compared with the RANSAC algorithm, the proposed algorithm improved the matching accuracy in terms of scale, illumination, and affine invariance feature matching, resulting in better registration performance. This is because the RANSAC algorithm has no upper limit on the number of iterations when calculating parameters from a data set containing a large number of outliers, and it is highly dependent on environmental changes, resulting in a decrease in the registration rate. The GMS-based algorithm proposed in this paper has many matching point pairs around the matching feature points due to its motion smoothness, which resulted in higher matching accuracy. The proposed method outperformed the existing algorithm in terms of matching accuracy and the speed of feature detection when the results from the previous tests are considered.

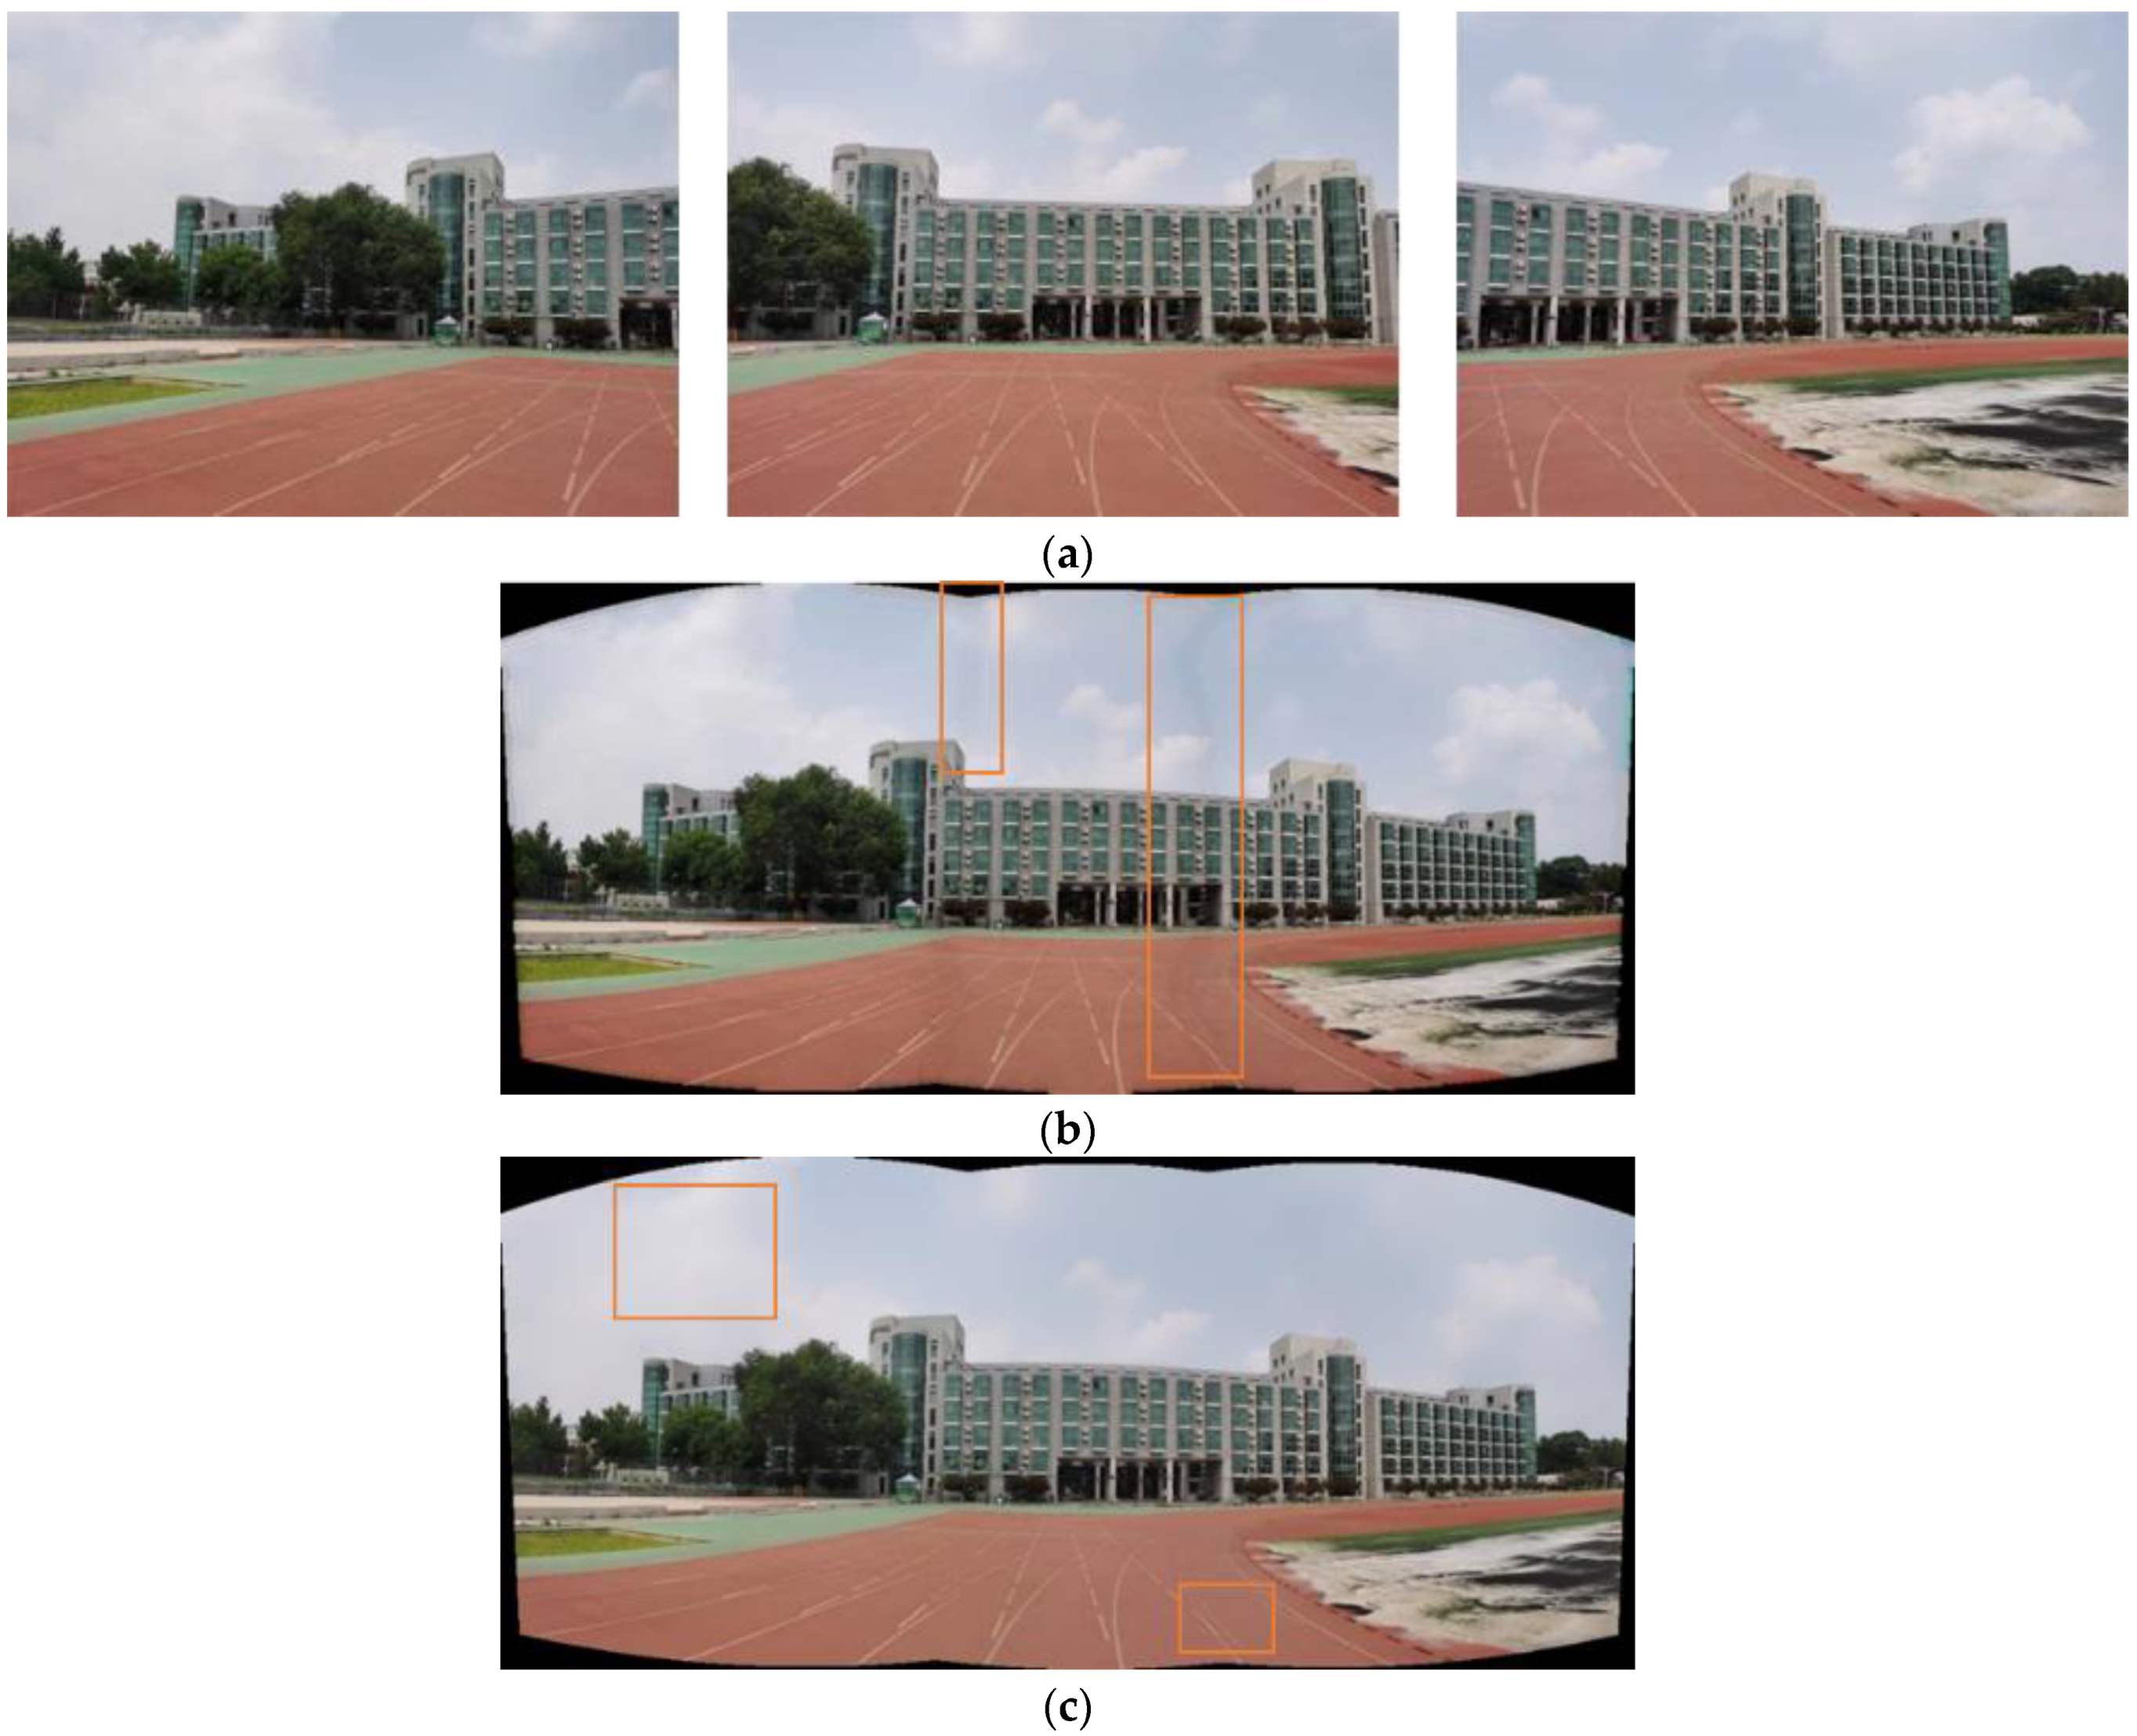
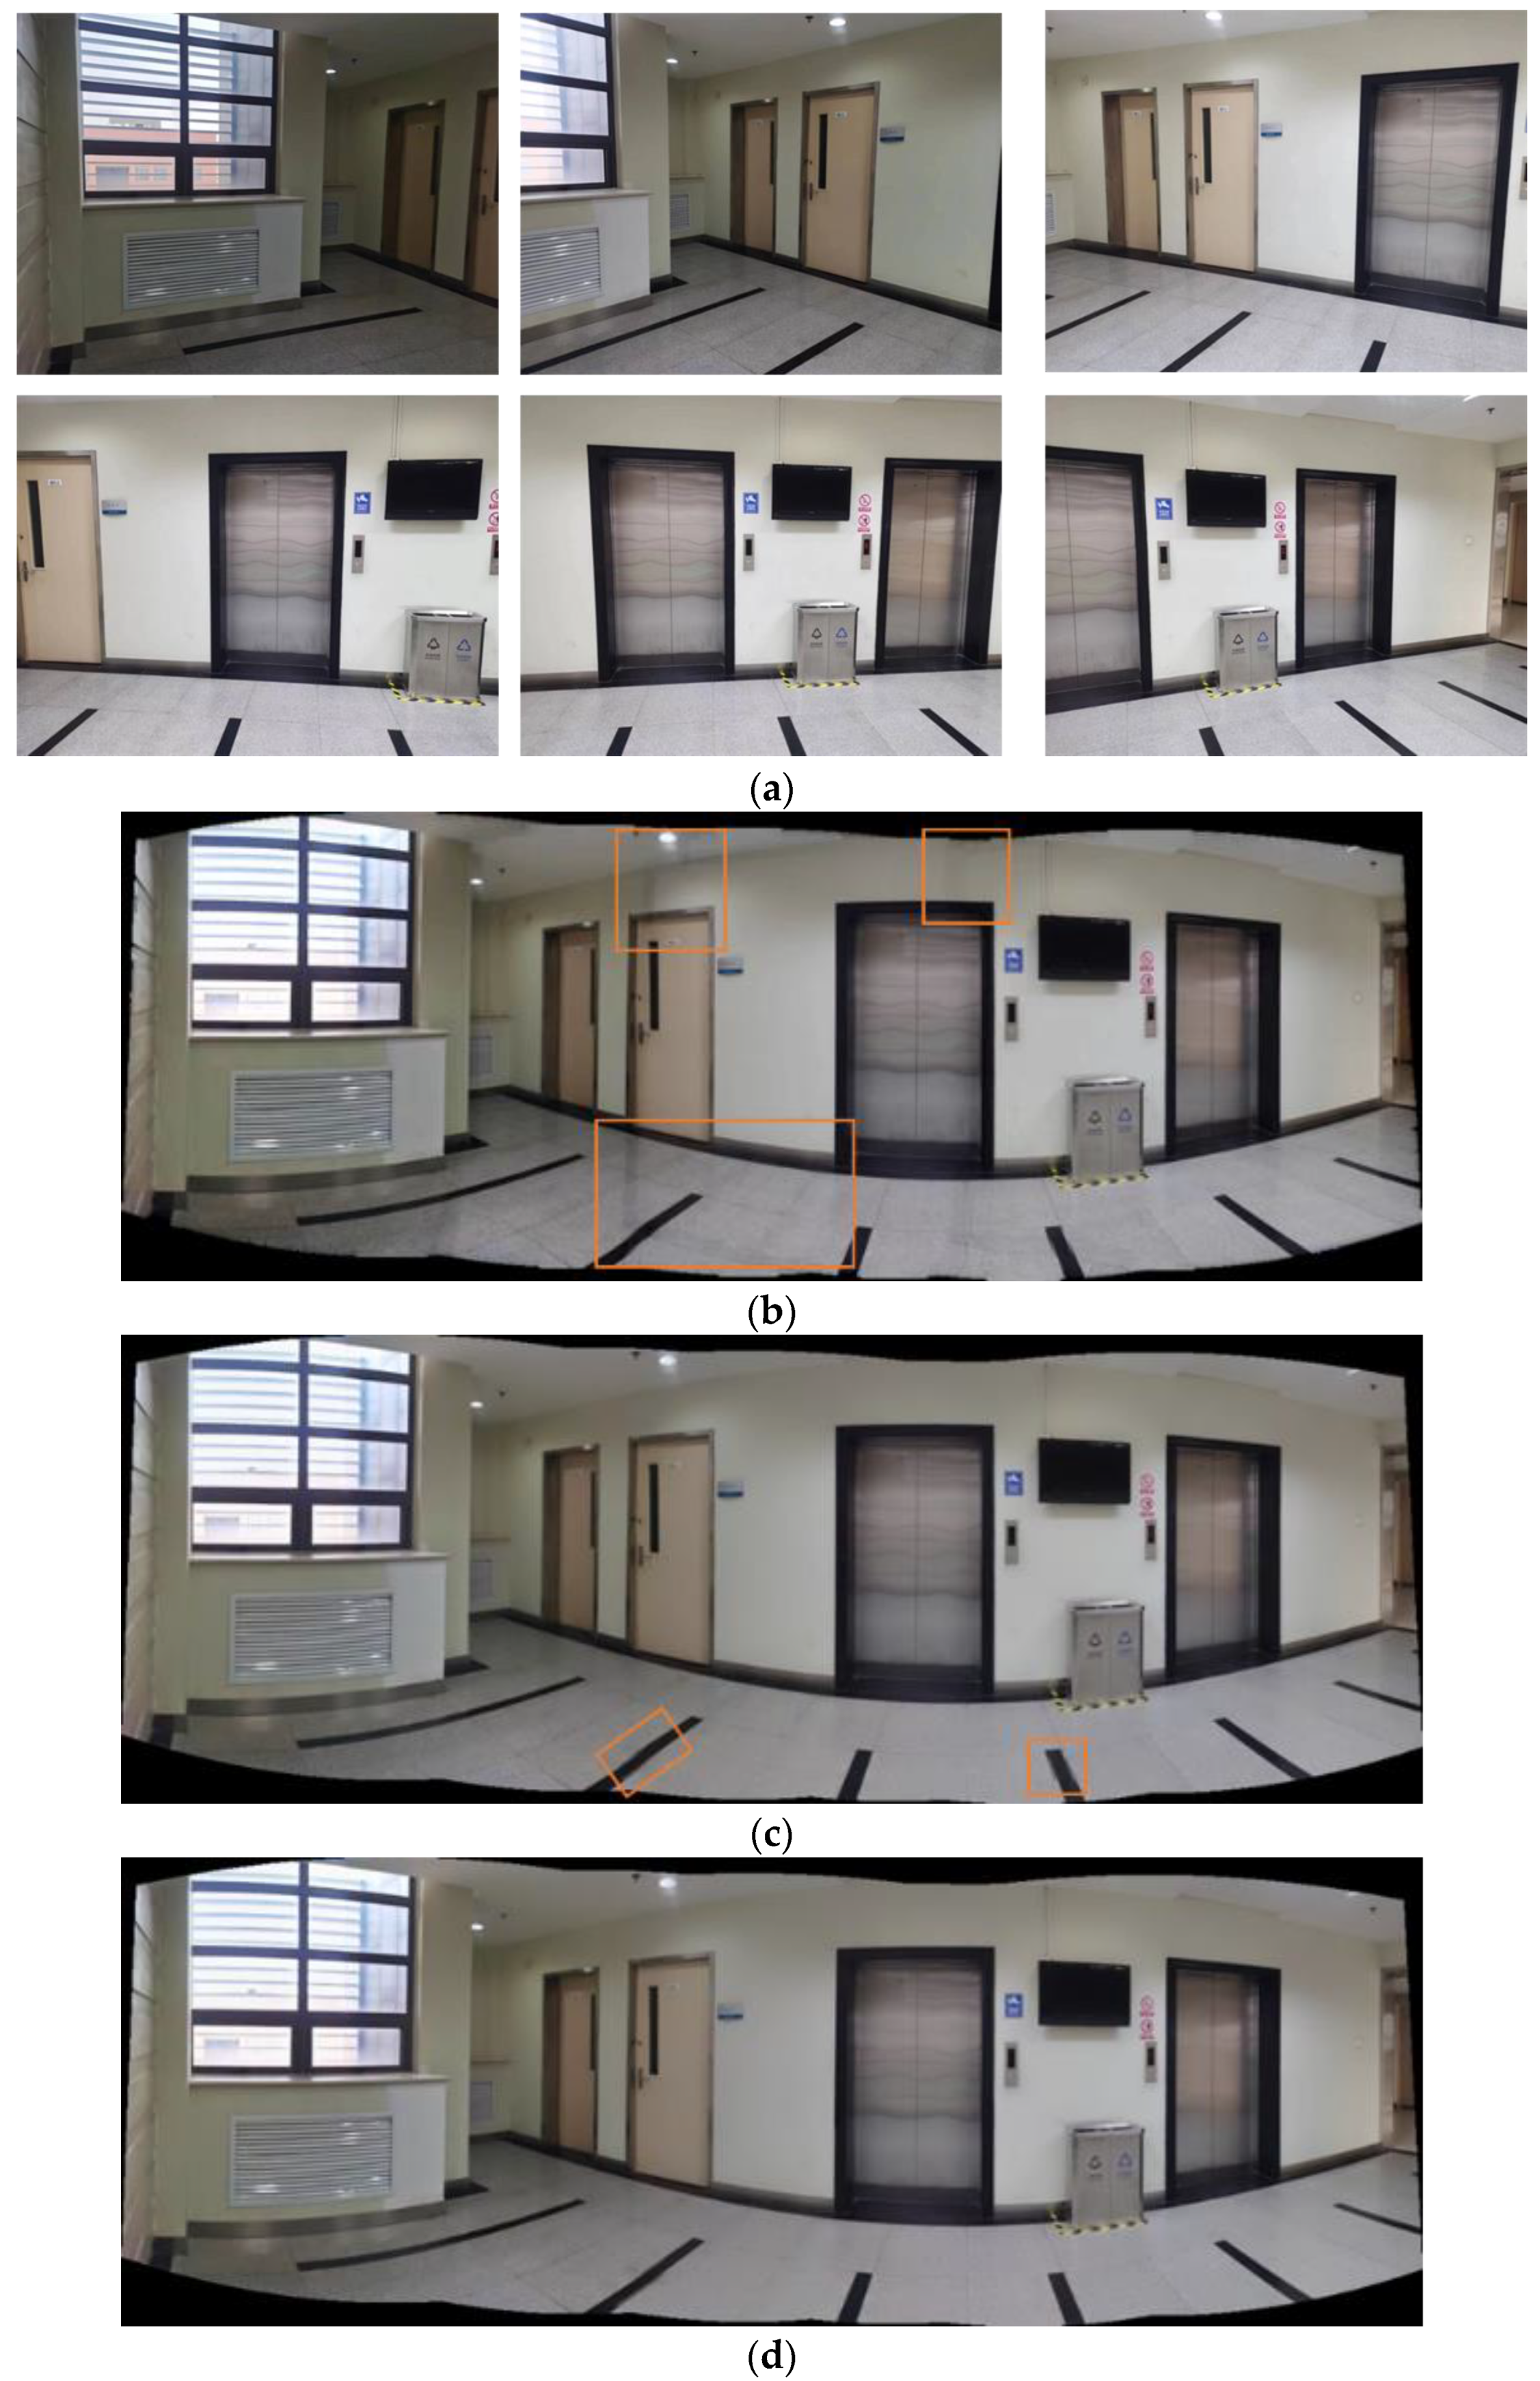
4.2. Analysis of Image Fusion

The image stitching experiment used images taken from a single point and multiple angles to splice, simulating the multi-channel images obtained by the camera in the real-time image mosaic scene. Additionally, we reduced the image size to 640 × 480, which made it convenient for us to manage and evaluate. The optimal seam + fade weighted fusion method, the optimal seam + multi-resolution fusion method, and the method proposed in this article were each employed for fusing the images. These three methods were better real-time methods obtained by comparative experiments. The original pictures and stitching results are shown in Figure 12, Figure 13 and Figure 14.
The stitching results in Figure 12, Figure 13 and Figure 14’s orange boxes highlight non-smooth issues, such as distortion and incoherence. As shown in Figure 12b, Figure 13b and Figure 14b, the optimal seam + fade-in and fade-out weighted method can solve the ghosting problem, though there are obvious seams. The result of the optimal seam + multi-resolution method is shown in Figure 12c, Figure 13c and Figure 14c. The multi-resolution method is very smooth for the background transition but loses the details of the image. The cloud details in the background in Figure 12 and Figure 13 disappear. In addition, it has a ghosting problem. As shown in Figure 12d, Figure 13d and Figure 14d, the proposed method eliminates ghosting and seams, and these panorama images have no incoherence of exposure difference.
Our findings reveal that the optimized fade-in and fade-out weighted algorithm, in conjunction with the optimal seam algorithm, which we utilized to construct the fusion area, results in a substantial improvement in time efficiency when compared to the original stitching algorithm, despite the additional time required. Specifically, the increase in time for stitching three images was approximately 6 ms. Additionally, our approach surpassed the multi-resolution + seam line algorithm in both stitching quality and efficiency. Additionally, we conducted an evaluation of the time efficiency of three sets of images, as depicted in Figure 15.
In addition to analyzing the visual fusion results, the three fusion algorithms’ image quality was objectively assessed using the quantitative indicators presented in [33,34] and using the following indicators:
  • Image information entropy. The image information entropy represents the amount of image information. A higher value indicates more image information.
  • Mean grey value. The average grayscale value of the image represents the brightness of the image. A higher value indicates more uniform brightness.
  • Difference of edge map (DoEM).
The DoEM method contains three steps: detect the image edge, construct edge difference spectrum, and then produce statistics for the difference spectrum information and calculate the score. The specific calculation formula is shown in (8):
D o E M = e σ 2 c 4 ( μ e e μ e c 1 + μ a e μ a c 2 μ e + μ a ) + ( 1 e σ 2 c 4 ) e σ 2 c 3
where μ e is the mean value of the transition area image edge difference spectrum; μ a and σ 2 are, respectively, the overall mean and overall variance of the transition area image edge difference spectrum; C 1 , C 2 , C 3 , and C 4 are four constants: C 1 and C 2 are selected according to the correlation degree of mean variation; C 3 , and C 4 values are selected according to the 3 σ criteria. A greater value indicates a lower misalignment of the stitching image and a smoother brightness transition.
4.
Structural similarity measurement (SSIM)
The SSIM score indicates three influencing factors: brightness similarity, contrasting similarities, and the structural similarity of the lossless stitched image. The specific calculation formula is shown in (9):
S S I M ( x , y ) = ( 2 μ x μ y + C 1 ) ( 2 σ x y + C 2 ) ( μ x 2 + μ y 2 + C 1 ) ( σ x + σ y + C 2 )
where μ x and μ y are the average intensity values of the two images, σ x y represents the correlation coefficient between two images, and σ x and σ y are the standard deviation. The SSIM value was closer to one, and there was less image distortion.
The specific calculated values are shown in Table 2. The data in Table 2 show that, in most cases, the proposed algorithm had higher information entropy, mean grey value, SSIM score, and DoEM score compared to the other algorithms. In the indoor images case, the obvious seam lines of optimal seam + fade-in and the fade-out weighting average fusion algorithm caused the information entropy value to be slightly higher than the proposed algorithm in this article. From this objective evaluation, it could be concluded that the proposed algorithm has certain advantages in image fusion.

5. Conclusions

In summary, this article first studied the current developments in image stitching and video stitching technologies both domestically and abroad. With the aim of future applications in real-time video stitching, the research approach of this article was determined to improve the stitching effect based on fast image algorithms. The two most critical stages in the video image stitching process, image registration and fusion, were studied, and an improved algorithm was proposed. Moreover, this article presented a detailed evaluation of the improved algorithm’s performance, highlighted the observed phenomena during the experiments, and provided an in-depth analysis of the experimental results.
In the feature matching process, the GMS algorithm combined with a bidirectional rough matching is proposed to improve the accuracy of feature point matching. An improved method combining the optimal seam and the fade-in fade-out weighted average algorithm was proposed for the image fusion stage. The optimal seam method was used to eliminate ghosting. A key factor for image fusion is the transition areas’ construction. Different boundary calculation weights were used for fusion to eliminate the seams for fused seam regions and transition regions, resulting in smoother and more natural transitions between images. Our approach not only achieved satisfactory stitching results but also outperformed the original algorithm in terms of stitching quality, with a negligible increase in computational time. Compared to another fast method, our approach not only improved the stitching effect but also provided an advantage in real-time performance. Through the parallel design of the program, the stitching speed on a bare CPU of eight frames per second of three 480p cameras was initially achieved.
Our research has led to improvements in video stitching, yet it has also revealed several challenges and opportunities for further exploration. Our future research directions include, but are not limited to, the following points:
  • To significantly reduce the stitching time, we aimed to gradually decrease the number of image feature points. While our experiments utilized a large number of feature points, other studies [8] have demonstrated that successful stitching can be achieved with fewer than 80 feature points in overlapping areas. We intend to investigate other approaches to reduce the number of feature points and achieve more efficient image matching.
  • Our findings suggest that the degree of overlap between the stitching frames plays a crucial role in image matching efficiency. Interestingly, we discovered that smaller overlapping areas could sometimes increase the time required for image matching. As a result, the camera layout is another important factor to consider in the stitching process. We also observed that different cameras, including phone cameras, network cameras, and wide-angle network cameras, exhibited varying performance levels. Night-time shooting can pose additional noise-related challenges, further complicating image stitching. Consequently, we plan to develop a real multi-resolution dataset that encompasses diverse stitching scenarios to facilitate future research in this field.
  • This paper’s panoramic video stitching system was implemented based on the Windows platform. Future work may port the method to the GPU, ARM, or FPGA platform with high parallel computing performance. In this way, embedded panoramic video stitching can be applied in various fields, such as edge computing.

Author Contributions

Conceptualization, Z.H.; methodology, H.G. and H.Y.; software, C.C. and H.G.; validation, H.G. and H.Y.; investigation, H.G. and X.Z.; resources, H.G.; writing—original draft preparation, H.G. and H.Y.; writing—review and editing, H.G. and Z.H.; visualization, H.G. and X.Z.; supervision, Z.H.; project administration, Z.H. All authors have read and agreed to the published version of the manuscript.

Funding

This research received no external funding.

Data Availability Statement

Not applicable.

Conflicts of Interest

The authors declare no conflict of interest.

References

  1. Xiang, T.-Z.; Xia, G.-S.; Bai, X.; Zhang, L. Image stitching by line-guided local warping with global similarity constraint. Pattern Recognit. 2018, 83, 481–497. [Google Scholar] [CrossRef] [Green Version]
  2. Madhusudana, P.C.; Soundararajan, R. Subjective and objective quality assessment of stitched images for virtual reality. IEEE Trans. Image Process. 2019, 28, 5620–5635. [Google Scholar] [CrossRef] [PubMed]
  3. Li, C.; Guo, B.; Guo, X.; Zhi, Y. Real-time UAV imagery stitching based on grid-based motion statistics. J. Phys. Conf. Ser. 2018, 1069, 012163. [Google Scholar] [CrossRef] [Green Version]
  4. Alwan, M.G.; AL-Brazinji, S.M. Automatic panoramic medical image stitching improvement based on feature-based approach. Period. Eng. Nat. Sci. 2022, 10, 155–163. [Google Scholar] [CrossRef]
  5. Zhang, T.; Zhao, R.; Chen, Z. Application of migration image registration algorithm based on improved SURF in remote sensing image mosaic. IEEE Access 2020, 8, 163637–163645. [Google Scholar] [CrossRef]
  6. Rettkowski, J.; Gburek, D.; Göhringer, D. Robot navigation based on an efficient combination of an extended A algorithm, bird’s eye view and image stitching. In Proceedings of the Conference on Design and Architectures for Signal and Image Processing (DASIP), Krakow, Poland, 23–25 September 2015; pp. 1–8. [Google Scholar]
  7. Hoang, V.-D.; Tran, D.-P.; Nhu, N.G.; Pham, T.-A.; Pham, V.-H. Deep Feature Extraction for Panoramic Image Stitching. In Proceedings of the Intelligent Information and Database Systems: 12th Asian Conference, ACIIDS 2020, Part II 12, Phuket, Thailand, 23–26 March 2020; pp. 141–151. [Google Scholar]
  8. Liu, W.; Zhang, K.; Zhang, Y.; He, J.; Sun, B. Utilization of Merge-Sorting Method to Improve Stitching Efficiency in Multi-Scene Image Stitching. Appl. Sci. 2023, 13, 2791. [Google Scholar] [CrossRef]
  9. Bai, Z.; Li, Y.; Chen, X.; Yi, T.; Wei, W.; Wozniak, M.; Damasevicius, R. Real-time video stitching for mine surveillance using a hybrid image registration method. Electronics 2020, 9, 1336. [Google Scholar] [CrossRef]
  10. He, B.; Yu, S. Parallax-robust surveillance video stitching. Sensors 2016, 16, 7. [Google Scholar] [CrossRef]
  11. Chen, X.; Yu, M.; Song, Y. Optimized Seam-Driven Image Stitching Method Based on Scene Depth Information. Electronics 2022, 11, 1876. [Google Scholar] [CrossRef]
  12. Jose, A.; Pachath, A.; Rajesh, A.; Chandhan, P.; Shenil, P. FPGA Based Novel Architecture for Real-Time Video Stitching. In Proceedings of the Innovations in Power and Advanced Computing Technologies (i-PACT), Kuala Lumpur, Malaysia, 27–29 November 2021; pp. 1–7. [Google Scholar]
  13. Du, C.; Yuan, J.; Dong, J.; Li, L.; Chen, M.; Li, T. GPU based parallel optimization for real time panoramic video stitching. Pattern Recognit. Lett. 2020, 133, 62–69. [Google Scholar] [CrossRef] [Green Version]
  14. Qendri, D. Real Time Video Stitching Implementation on a Zynq FPGA SOC. Master’s Thesis, University of Ontario Institute of Technology, Toronto, ON, Canada, 2019. [Google Scholar]
  15. Bansal, M.; Kumar, M.; Kumar, M. 2D object recognition: A comparative analysis of SIFT, SURF and ORB feature descriptors. Multimed. Tools Appl. 2021, 80, 18839–18857. [Google Scholar] [CrossRef]
  16. Zhu, J.; Gong, C.; Zhao, M.; Wang, L.; Luo, Y. Image mosaic algorithm based on PCA-ORB feature matching. Int. Arch. Photogramm. Remote Sens. Spat. Inf. Sci. 2020, 42, 83–89. [Google Scholar] [CrossRef] [Green Version]
  17. Calonder, M.; Lepetit, V.; Strecha, C.; Fua, P. BRIEF: Binary robust independent elementary features. In Proceedings of the 11th European Conference on Computer Vision, ECCV 2010, Heraklion, Crete, Greece, 5–11 September 2010; pp. 778–792. [Google Scholar]
  18. Leutenegger, S.; Chli, M.; Siegwart, R.Y. BRISK: Binary Robust invariant scalable keypoints. In Proceedings of the IEEE International Conference on Computer Vision, ICCV 2011, Barcelona, Spain, 6–13 November 2011; pp. 2548–2555. [Google Scholar]
  19. Rublee, E.; Rabaud, V.; Konolige, K.; Bradski, G. ORB: An efficient alternative to SIFT or SURF. In Proceedings of the IEEE International Conference on Computer Vision, ICCV 2011, Barcelona, Spain, 6–13 November 2011; pp. 2564–2571. [Google Scholar]
  20. Lowe, D.G. Distinctive Image Features from Scale-Invariant Keypoints. Int. J. Comput. Vis. 2004, 60, 91–110. [Google Scholar] [CrossRef]
  21. Bay, H.; Tuytelaars, T.; Van Gool, L. SURF: Speeded up robust features. In Proceedings of the 9th European Conference on Computer Vision, ECCV 2006, Graz, Austria, 7–13 May 2006; pp. 404–417. [Google Scholar]
  22. Ke, Y.; Sukthankar, R. PCA-SIFT: A more distinctive representation for local image descriptors. In Proceedings of the IEEE Computer Society Conference on Computer Vision and Pattern Recognition, CVPR 2004, Washington, DC, USA, 27 June–2 July 2004; pp. II506–II513. [Google Scholar]
  23. Yi, K.M.; Trulls, E.; Lepetit, V.; Fua, P. LIFT: Learned invariant feature transform. In Proceedings of the 21st ACM Conference on Computer and Communications Security, CCS 2014, Scottsdale, AZ, USA, 3–7 November 2014; pp. 467–483. [Google Scholar]
  24. Lin, W.Y.; Wang, F.; Cheng, M.M.; Yeung, S.K.; Torr, P.H.; Do, M.N.; Lu, J. CODE: Coherence Based Decision Boundaries for Feature Correspondence. IEEE Trans. Pattern Anal. Mach. Intell. 2018, 40, 34–47. [Google Scholar] [CrossRef] [PubMed]
  25. Yakovleva, O.; Nikolaieva, K. Research of descriptor based image normalization and comparative analysis of SURF, SIFT, BRISK, ORB, KAZE, AKAZE descriptors. Adv. Inf. Syst. 2020, 4, 89–101. [Google Scholar] [CrossRef]
  26. Tareen, S.A.K.; Saleem, Z. A comparative analysis of sift, surf, kaze, akaze, orb, and brisk. In Proceedings of the International Conference on Computing, Mathematics and Engineering Technologies (iCoMET), Sukkur, Pakistan, 3–4 March 2018; pp. 1–10. [Google Scholar]
  27. Fischler, M.A.; Bolles, R.C. Random Sample Consensus: A Paradigm for Model Fitting with Applications to Image Analysis and Automated Cartography. Commun. ACM 1981, 24, 381–395. [Google Scholar] [CrossRef]
  28. Chum, O.; Matas, J. Matching with PROSAC—Progressive sample consensus. In Proceedings of the IEEE Computer Society Conference on Computer Vision and Pattern Recognition, CVPR 2005, San Diego, CA, USA, 20–25 June 2005; pp. 220–226. [Google Scholar]
  29. Pan, J.; Wang, M.; Cao, X.; Chen, S.; Hu, F. A multi-resolution blending considering changed regions for orthoimage mosaicking. Remote Sens. 2016, 8, 842. [Google Scholar] [CrossRef] [Green Version]
  30. Wang, H.; Raskar, R.; Ahuja, N. Seamless video editing. In Proceedings of the 17th International Conference on Pattern Recognition, ICPR 2004, Cambridge, UK, 23–26 August 2004; pp. 858–861. [Google Scholar]
  31. Gao, J.; Yu, L.; Chin, T.J.; Brown, M.S. Seam-Driven Image Stitching. Eurographics 2013, 13, 45–48. [Google Scholar]
  32. Wang, B.; Li, H.; Hu, W. Research on key techniques of multi-resolution coastline image fusion based on optimal seam-line. Earth Sci. Inform. 2020, 13, 333–344. [Google Scholar] [CrossRef]
  33. Wang, Z.; Bovik, A.C.; Sheikh, H.R.; Simoncelli, E.P. Image quality assessment: From error visibility to structural similarity. IEEE Trans. Image Process. 2004, 13, 600–612. [Google Scholar] [CrossRef] [Green Version]
  34. Wan, G.-T.; Wang, J.-P.; Li, J.; Cao, H.-H.; Wang, S.; Wang, L.; Li, Y.-N.; Wei, R. Method for quality assessment of image mosaic. Tongxin Xuebao J. Commun. 2013, 34, 76–81. [Google Scholar] [CrossRef]
Figure 1. Comparison of feature extraction results: (a) non-gridded BRISK feature extraction; (b) gridded BRISK feature extraction.
Electronics 12 01700 g001
Figure 2. Schematic diagram of the improved feature point extraction area.
Electronics 12 01700 g002
Figure 3. Diagram of the fade-in and fade-out weighted average fusion method.
Electronics 12 01700 g003
Figure 4. The schematic diagram of the fusion area’s construction.
Electronics 12 01700 g004
Figure 5. Diagram of the improved fade-in and fade-out weighted image fusion algorithm.
Electronics 12 01700 g005
Figure 6. The image stitching process in this paper.
Electronics 12 01700 g006
Figure 7. Comparison of the BRISK algorithm before and after gridding: (a) non-gridded left view; (b) gridded left view; (c) non-gridded right view; (d) gridded right view.
Electronics 12 01700 g007
Figure 8. Images to be registered: (a) images of the scaling group; (b) images of the exposure group; (c) images of the rotation group.
Electronics 12 01700 g008
Figure 9. Comparison of feature points extraction and matching results: (a) this article; (b) BRISK + improved GMS; (c) BRISK + RANSAC; (d) ORB + RANSAC.
Electronics 12 01700 g009
Figure 10. Comparison of feature point detection and matching results: (a) feature point extraction quantity; (b) the number of matching and correct matching pairs for each algorithm.
Electronics 12 01700 g010
Figure 11. Comparison of image registration matching performance: (a) comparison of the matching accuracy of algorithms; (b) comparison of feature point extraction and matching time.
Electronics 12 01700 g011
Figure 12. Building images: (a) input images; (b) panorama by optimal seam + fade-in and fade-out weighted method; (c) panorama by optimal seam + multi-resolution method; (d) panorama by proposed method.
Electronics 12 01700 g012aElectronics 12 01700 g012b
Figure 13. Artificial lake images: (a) input images; (b) panorama by optimal seam + fade-in and fade-out weighted method; (c) panorama by optimal seam + multi-resolution method; (d) panorama by the proposed method.
Electronics 12 01700 g013
Figure 14. Indoor images: (a) input images; (b) panorama by optimal seam + fade-in and fade-out weighted method; (c) panorama by optimal seam + multi-resolution method; (d) panorama by the proposed method.
Electronics 12 01700 g014
Figure 15. Comparison of image fusion time.
Electronics 12 01700 g015
Table 1. The detection results of left and right views before and after gridding.
Left ViewRight View
Non-Gridded BRISKGridded BRISKNon-Gridded BRISKGridded BRISK
Number of feature points1156491982486
Detection time (ms)9.76076.32069.07074.5506
Table 2. Quality evaluation of fused images.
Image GroupFusion AlgorithmInformation EntropyMean Grey ValueSSIMDoEM
BuildingOptimal seam + fade-in and the fade-out weighting average fusion algorithm7.163134.6490.87560.8714
Optimal seam + multi-resolution fusion algorithm7.014135.7560.90820.8849
Proposed algorithm7.169137.3360.93050.9573
Artificial lakeOptimal seam + fade-in and the fade-out weighting average fusion algorithm7.22494.8350.89710.9234
Optimal seam + multi-resolution fusion algorithm7.14996.6260.91290.8496
Proposed algorithm7.24497.2310.95910.9672
IndoorOptimal seam + fade-in and the fade-out weighting average fusion algorithm7.173112.5820.92230.8319
Optimal seam + multi-resolution fusion algorithm7.153111.2840.96570.9074
Proposed algorithm7.16113.4610.98050.9438
Disclaimer/Publisher’s Note: The statements, opinions and data contained in all publications are solely those of the individual author(s) and contributor(s) and not of MDPI and/or the editor(s). MDPI and/or the editor(s) disclaim responsibility for any injury to people or property resulting from any ideas, methods, instructions or products referred to in the content.

