1. Introduction
Research on active learning tools such as physical and virtual manipulatives can facilitate the learning of scientific topics and yield positive results [
1,
2,
3,
4]. Moreover, technological advances have positively impacted hands-on tools by combining physical and virtual manipulatives into a single learning experience. One such tool is visuohaptic simulation. With visuohaptic simulations, learners receive visual and haptic feedback from a virtual environment using a haptic device [
5,
6,
7].
The use of visuohaptic simulations (VHS) has demonstrated positive learning outcomes for learning science concepts (e.g., [
7,
8,
9]). However, the value of the haptic feedback in virtual environments is not conclusive (e.g., [
6,
8,
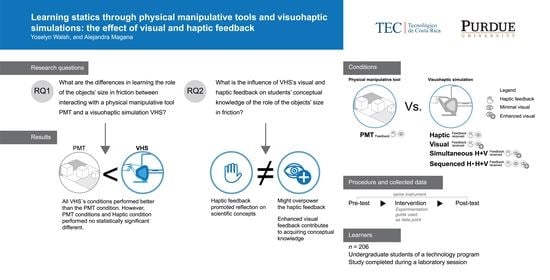
10]). In this study, we measured the learning gains of 206 undergraduate students learning the concept of friction after using a physical manipulative (PMT) or a VHS approach. Both tools provided visual and haptic feedback. Moreover, we used the VHS with different configurations (visually enhanced feedback on/off, force feedback on/off) to investigate the effect of haptic and visual feedback in virtual learning environments. The research questions for the current study are:
RQ1. What are the differences in learning the role of the objects’ size in friction between interacting with a physical manipulative tool PMT and a visuohaptic simulation VHS?
RQ2. What is the influence of VHS’s visual and haptic feedback on students’ conceptual knowledge of the role of the objects’ size in friction?
The configurations of the VHS used in this study were Haptic (H), Visual (V), Simultaneous Haptic and Visual (H + V), and Sequenced, with Haptic first and then Haptic and Visual combined (H→H + V). The null hypothesis for the first research question was that the PMT and the different VHS configurations provides the same learning advantages to students in terms of learning gains (PMT = VHS). The alternative hypothesis of the first research question stated that PMT and VHS provides different learning advantages (PMT ≠ VHS). The claim supporting the alternative hypothesis is that visuohaptic simulations combine physical and virtual manipulatives’ affordances into a single learning experience [
6,
7,
11].
The null hypothesis of the second research question stated that haptic and visual feedback influence the conceptual learning of friction similarly (H = V). The alternative hypothesis stated that haptic and visual feedback influence the conceptual learning of friction differently (H ≠ V). The claim supporting the alternative hypothesis is that haptic and visual feedback are different learning modalities and that visual and haptic feedback have different affordances resulting from interaction with the learning tools [
12,
13].
1.1. Background
This study builds upon research that aims to design instructional experiences targeted to improve the learning of difficult concepts in science. We focused on the statics concept of friction. Additionally, we overviewed research on how physical and virtual manipulatives can support in learning friction. Friction is a science concept that is difficult to learn because it is abstract, counterintuitive, and experienced by humans in their daily life [
12,
14]. For instance, learners considered it counterintuitive that pushing two cubes with the same weight but different sizes require the same applied force [
10], or that forces result from the interaction between objects and are not a property of objects [
15].
Humans may provide explanations of friction based on their own experience. Hence, prior ideas in science are not arbitrary or mistakes. Previous ideas result from a system of beliefs that, when inaccurate, are hard to change and may prevent the acquisition of scientific knowledge [
16,
17]. Researchers reported that after instruction, students might explain friction based on their grounded, personal experiences and previous instruction [
7,
18,
19]. Moreover, it is recognized that students may have an inaccurate understanding of a scientific phenomenon after instruction [
20,
21,
22,
23,
24]. This study’s participants are undergraduate students who received prior instruction in statics (e.g., elementary, middle, and high school and college levels).
1.2. Learning Science
Researchers in science education have considered two practices as effective in science instruction. The first one is acknowledging the students’ empirical explanations before instruction and incorporating them into science instruction [
25]. The second one is using active learning practices in the classroom. Instructors acknowledging students’ prior ideas allows them to focus early on critical aspects of the instruction that may hinder students’ learning. For students, incorporating prior ideas into instruction is also beneficial because it is an opportunity to convert their ideas into testable hypotheses.
Active learning experiences may promote science learning without emphasizing a lack of alignment between prior knowledge and the scientific view [
18,
26]. Two pedagogical tools used for promoting active learning are virtual manipulatives, herein VM (e.g., simulations), and physical manipulative tools, herein PMT [
3,
27]. PMT promotes learning by manipulating concrete objects in real life to observe a phenomenon. For instance, in [
28], researchers proposed an approach for teaching statics concepts that combined techniques of isolation of concepts with active learning using physical manipulatives. Virtual manipulatives promote the observation of a phenomenon through interactive visualizations and materials projected by a computer-based simulation [
29].
1.3. Physical and Virtual Manipulatives for Learning
PMT and VM promote learning science concepts through different human senses and experiences [
30]. Moreover, considering students’ prior knowledge in the design of PMT and VM may allow students to have the opportunity to test their hypothesis and manipulate variables of the phenomena that affect the results [
31]. Hence, VM and PMT may promote students’ inquiry in science and cooperative learning by encouraging discussion among peers [
3,
30,
32]. A list of affordances of VM and PMT is reported in [
30].
Research on the use of VM for learning has found greater learning outcomes in students learning with VM vs. traditional methods (e.g., ~23% more) [
27,
28]. Comparing PMT and VM for learning, a study presented in [
33] found different results comparing PMT and VM for learning about circuits. Undergraduate students (
n = 231) registered in an introductory physics class completed a laboratory session of circuits using PMT (e.g., lab equipment) or VM (e.g., computer simulation). Another group of students (
n = 107) learned about friction through lecture only (L). Results suggested that participants exposed to VM solved a challenge to build a circuit faster than those who used PMT and participants in the lecture-only group (VM < PMT < L). Furthermore, in the reasoning task, students exposed to VM outperformed those in the PMT group (
p-value < 0.05). Results suggested that VM surpasses any learning limitation found in PM [
30].
Researchers in [
34] explored the interaction with PMT in undergraduate students (
n = 7). The study found that learners:
Easily recognized differences in size between objects (e.g., one object is bigger than the other);
Easily recognized the differences in weight when objects had the same size (e.g., one object heavier than the other);
Had problems identifying similarities in weight when the cubes had different sizes (e.g., two objects with the same weight but different sizes);
Had issues identifying the force applied by their hands when the cubes they pushed started to rotate.
Learners indicated they could not distinguish if they applied the same force to move objects with the same weight but different sizes. The size–weight illusion explains why learners had problems differentiating weight and density. Researchers explained the size–weight illusion from two perspectives. First, humans expect larger objects to be heavier than smaller objects, especially when both have the same material. Secondly, the human perception of weight depends on variables such as pressure and muscles involved in lifting the object [
35,
36]. Therefore, the way humans interact with objects influences their perception of weight (e.g., humans can discriminate the weight of an object more accurately when they pick objects up with their fingers rather than with their palms).
1.4. Combining Physical and Virtual Manipulatives in Visuohaptic Simulations
The use of visuohaptic simulations (VHS) for learning science has been explored in different application domains. In [
37], researchers investigated students’ perception of the usefulness and ease of using visuohaptic simulations for learning gross anatomy. Undergraduate students (
n = 89) explored different body organs (e.g., the heart) to learn their structure and composition. Results suggested that participants rated the activity as useful (
M = 72%,
SD = 18%) and easy to use (
M = 57%,
SD = 22%).
Studies comparing the use of VHS vs. other methods showed mixed results. When comparing the learning gains of students exposed to VHS vs. lecture, results favored VHS (e.g., in [
38] for learning impedance control and fuzzy control). Comparing VHS vs. simulations (VM), results have not been conclusive. Quantitative studies found learning gains in students exposed to VHS or VM (e.g., pre-test vs. post-test). However, differences between conditions had no statistically significant differences (e.g., [
39,
40] for learning electric fields). The results of [
39,
40] could be attributable to the limited power of the analysis due to the sample size (e.g., 18 and 25 students per condition in each study, respectively).
Research using qualitative methods for analyzing students’ responses before and after using VHS and VM showed promising results. For instance, in the semantic analysis in [
41] researchers found that students in VHS and VM conditions wrote more detailed answers in the post-test (e.g., included scientific terms such as chemical, steric, force, dynamic, and energetic). However, only the force category in the VHS group had a statistically significant higher percentage of detail in the post-test answers (
p < 0.001). Results suggested that the haptic feedback helped students learn more about the process of protein–ligand recognition and changed the way they reasoned about molecules to include more force-based explanations. Researchers also concluded that haptic feedback might have prevented students from drawing erroneous conclusions about the process of protein–ligand recognition observed when students interacted with only the visual model. In this study, we included an analysis of the experimentation phase to analyze the effect of visual and haptic feedback beyond the pre- and post-test comparison.
1.5. Visual and Haptic Feedback
The learners’ interpretation of the feedback provided by the learning tool (VM, PMT, or VHS) may have a high impact on the success of the learning experience. In this study, we refer to haptic feedback as the combination of force and kinesthetic feedback (e.g., finding it harder to move an object and the proprioception or interpretation of the body position [
42]). Visual feedback allows learners to interact with and actively seek out information about the environment through their eyes [
43]. In [
13], researchers identified other differences between visual feedback and haptic feedback:
Haptic feedback requires human contact with the object, but visual feedback does not require contact;
The amount of information humans can process from haptic feedback is lower than from visual feedback (20–30 Hz vs. 106, 104 bits/s);
The interpretation of the results from haptic feedback is slower than the interpretation of the information from visual feedback
Regarding visual information, virtual environments allow learners to visualize information not available to the naked eye (e.g., microscopic information, force vectors). In learning activities that use visuohaptic simulations, haptic feedback is usually a companion of visual feedback (e.g., [
7,
11,
41]). However, visual feedback is not enhanced in all visuohaptic simulations. In this case, the visuohaptic simulation did not take advantage of the capacity of the virtual environment to show nonvisible information [
30,
44].
In [
45], researchers examined the role of a haptic device’s two types of feedback, kinesthetic and force, in students’ conceptual understanding of simple machines (
n = 118). The three conditions of the experiment were simulation (VM), kinesthetic feedback (K), and haptic feedback, composed of force + kinesthetic feedback (H). Participants in the VM condition received only visual feedback. Participants in the K condition received visual and kinesthetic feedback. Participants in the H condition received visual, kinesthetic, and force feedback. Results of the [
45] study suggested a better performance from the students receiving visual, haptic, and kinesthetic feedback (H condition) in learning simple machines than students receiving visual and kinesthetic feedback (K condition) and only visual feedback (VM condition). Furthermore, researchers of the study concluded that kinesthetic feedback alone was not enough to construct multimodal representations that can serve as a base for building future scientific knowledge.
Moreover, using haptic and visual information provided a multi-sensory experience for learners (e.g., in visuohaptic simulations). The multi-sensory input allowed the information to flow actively in a two-way path between the learner and the tool [
13]. First, students manipulated the tool to obtain information about the concept represented by the tool (e.g., manipulated two objects to compare the weight of the objects). Secondly, the tool provided an output based on the participants’ input (e.g., the velocity of an object increases when the applied force provided to start the motion increases). Additionally, students obtained more information by manipulating an object, such as the object’s characteristics (e.g., shape) and the object’s material, e.g., hardness [
46].
2. Materials and Methods
The instructional intervention was composed of five learning materials, two learning tools (VHS and PMT), a friction worksheet for each learning tool, and a friction test. Students completed the friction test before and after using the learning tool (e.g., pre-test and post-test). The friction test allowed learners to formulate hypotheses and incorporate prior knowledge into the learning activity. The friction worksheet guided the interaction with the learning tools. All the learning materials’ design and evaluation followed an iterative process where professionals in different fields (e.g., computer graphics, engineering education, physics, and HCI) worked together.
The instructional intervention focused on addressing two concepts from the Statics Concept Inventory [
47]: the role of the objects’ weight in friction and the role of the objects’ size in friction. We used the students’ responses to compare the learning benefits of the PMT and the different configurations of the VHS (RQ1), and the influence on learning of the visual and haptic feedback. Our prior work with a similar population, available in [
10], identified the objects’ size in friction as a counterintuitive concept in statics, and the role of the objects’ weight in friction as an intuitive concept. The preliminary analysis of the data from this study showed a similar tendency to that in [
10]. Hence, we decided to focus on the role of the object’s size in friction in this study.
2.1. The Instructional Intervention
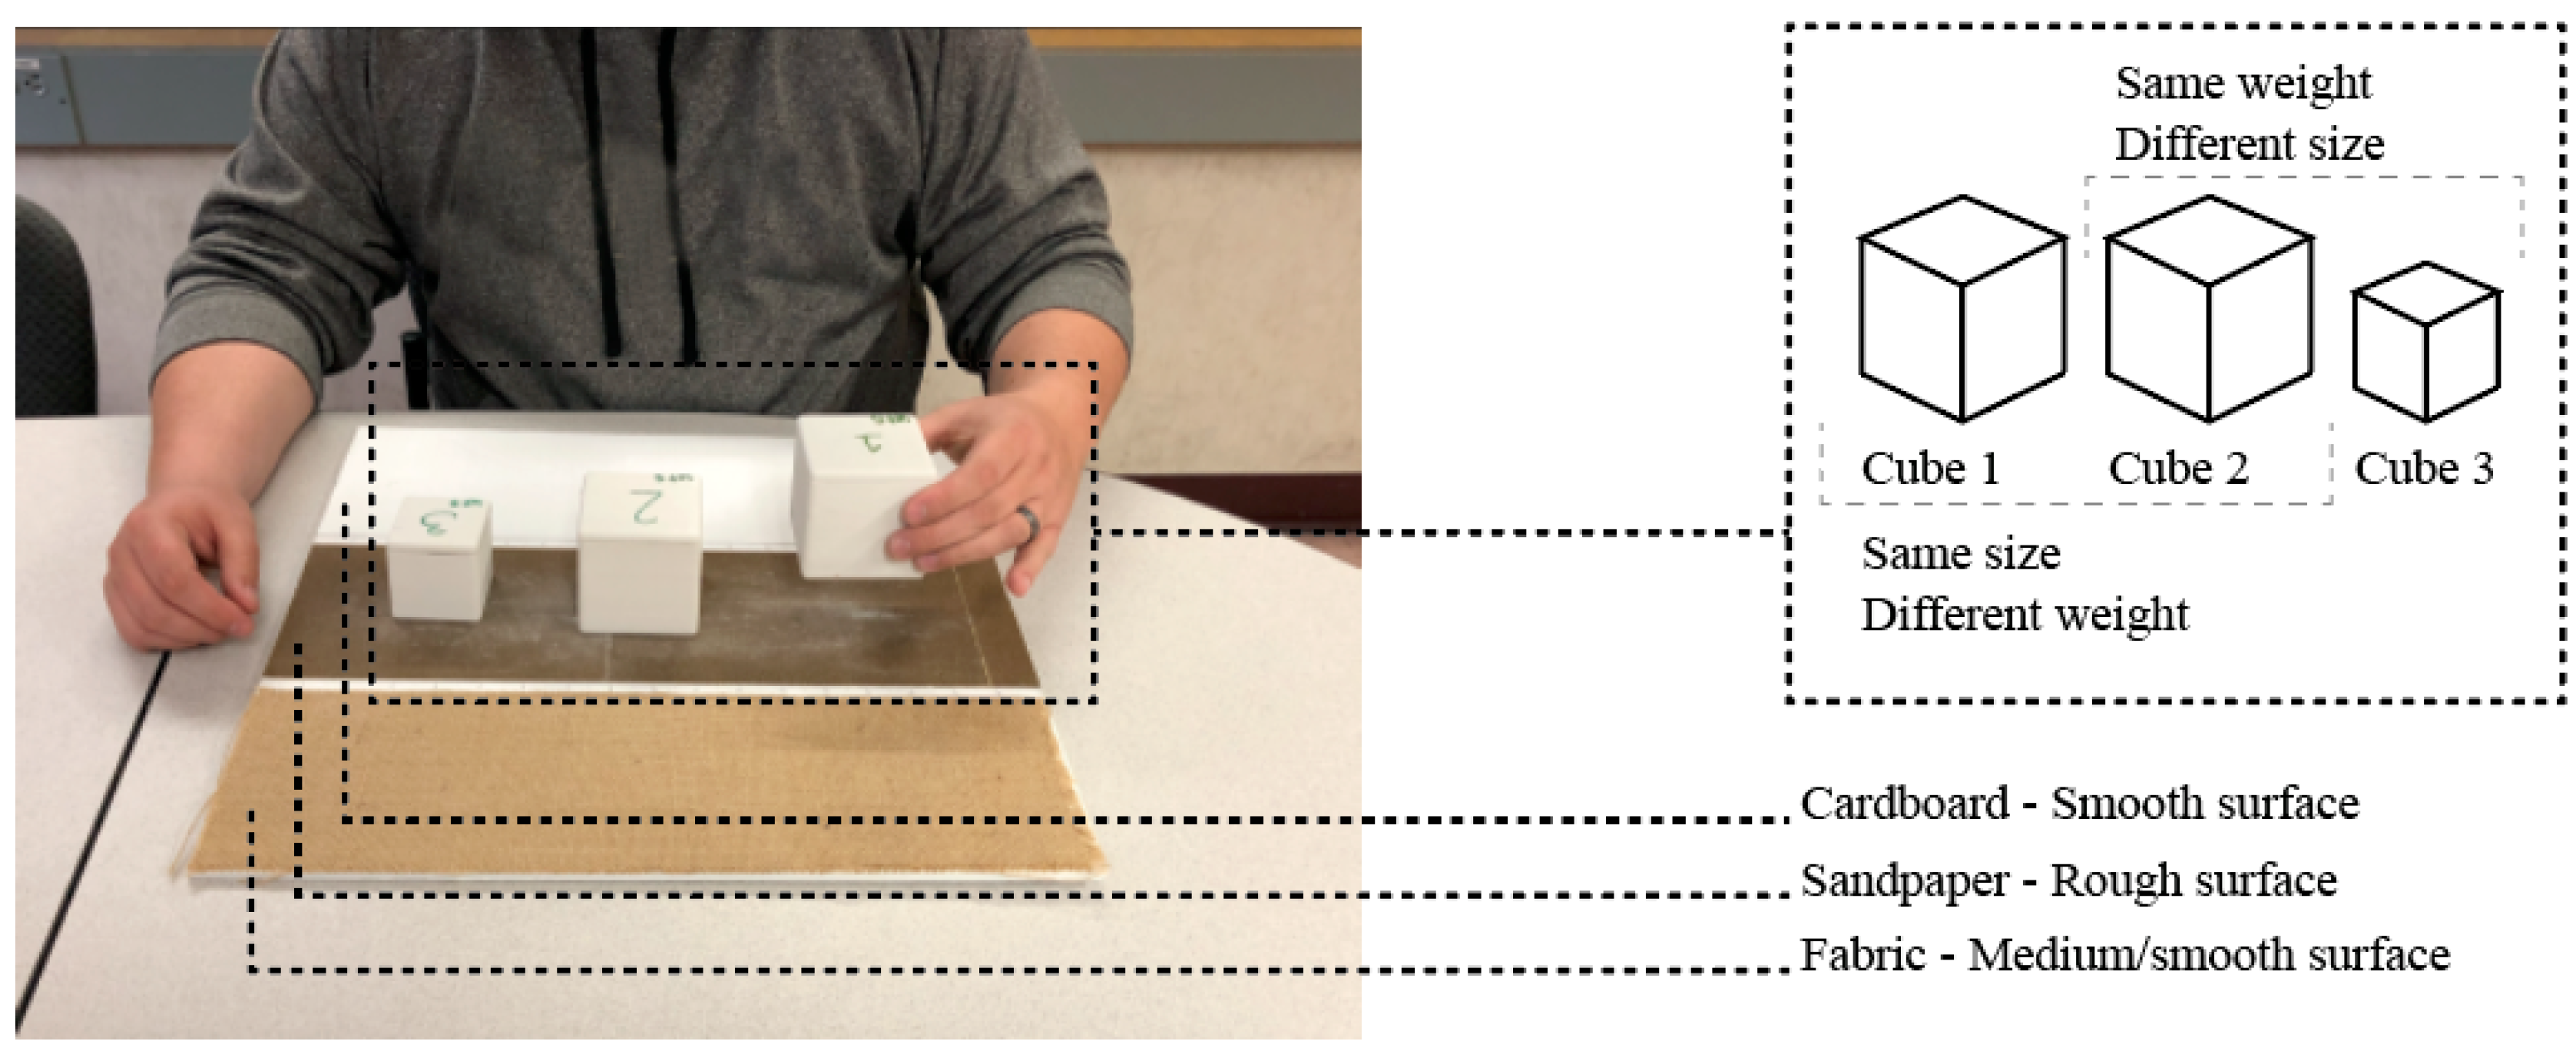
Students interacted with PMT and VHS to learn about friction. The learning tools contained two elements, three cubes, and one board with three different surfaces. The cubes and the board were physical objects in the PMT and virtual objects in the VHS.
The board for sliding the cubes had three surfaces with different friction coefficients: cardboard paper as the smooth surface, fabric as the medium smooth surface, and sandpaper as the rough surface. The objects used for grabbing and sliding were three cubes. Cubes shared similarities and differences among them. Cube 1 and Cube 2 had the same size (7.5 cm of edge) but different weights (Cube 1 = 210 g and Cube 2 = 291 g). Cubes 2 and 3 had the same weight but different sizes (Cube 3 edge = 5 cm). By comparing Cubes 2 and 3, students learned about the role of the objects’ size in friction.
Figure 1 shows the PMT and its main characteristics.
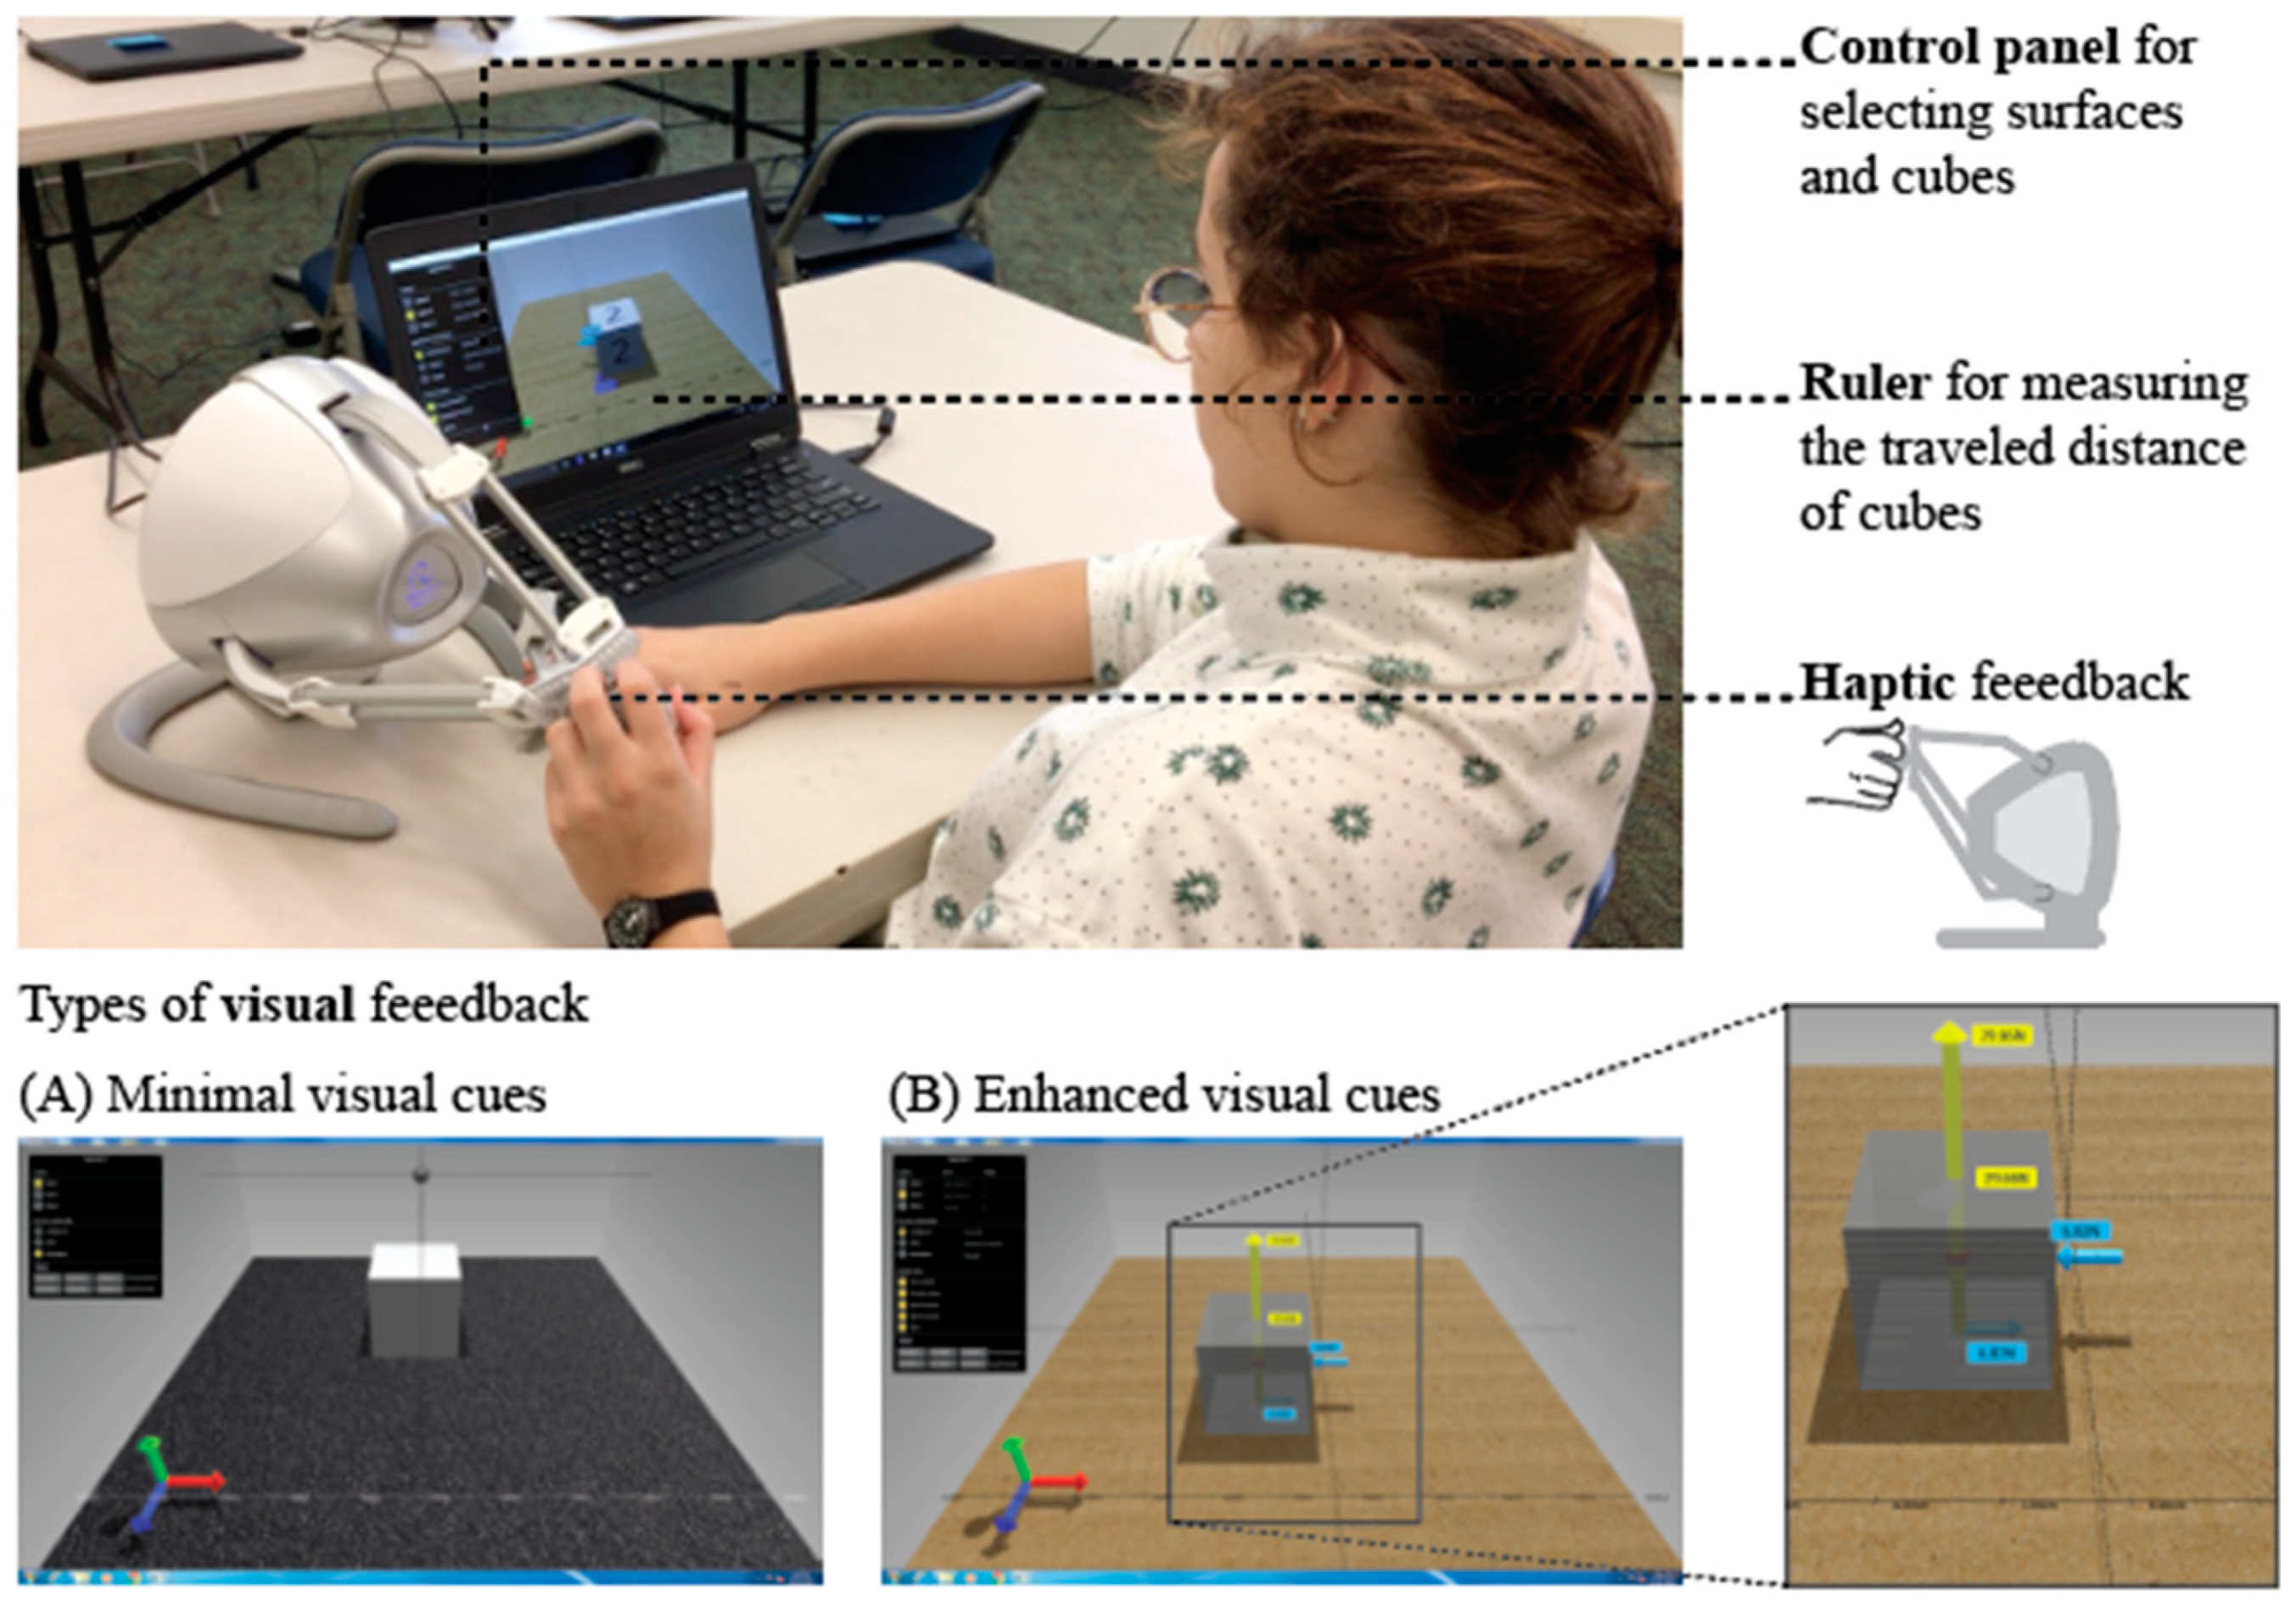
The VHS was implemented in C++ using Chai3D, OpenGL, and GLSL. The learners interacted with the Falcon Novint
® to manipulate the virtual environment and receive haptic feedback. Learners received visual and haptic feedback. The virtual environment exaggerated the maximum force feedback to make the haptic experience easier to perceive and distinguish. Additionally, the VHS constrained the cubes’ rotation (e.g., cubes move only from left to right, and no rotation occurred).
Figure 2 shows a learner interacting with the VHS. The haptic device’s location depended on the learner’s dominant hand. For instance, left-handed students located the haptic device on the laptop’s left side.
The laptop screen displayed the 3D visual information provided by the virtual environment in two different ways, minimal and enhanced. Minimal visual information showed learners the same information as the natural environment of the PMT. For instance, learners saw the displacement distance of the objects pushed on the surfaces. The minimal visual feedback did not show numerical values.
The enhanced visual feedback took advantage of the virtual environment and showed the learners nonvisible information on the friction phenomenon. The nonvisible information showed the forces acting on the cube pushed (i.e., normal force, gravitational force, frictional force, and applied force) or lifted (i.e., normal force, gravitational force). The color code and size of the arrow in the enhanced visual feedback showed differences in the forces’ magnitude. The warm-colored arrows were accompanied by large forces, and cold colors by small forces. Enhanced visual feedback always showed the numerical value of the forces.
Figure 2A shows the virtual environment with minimal visual feedback.
Figure 2B shows the enhanced visual feedback. The applied force (6.82 N) required to push the cube and the frictional force (6.82 N) are shown in light blue. The normal force (29.66 N) and the gravitational force (29.66 N) are yellow, and the arrow is large.
The Falcon Novint provided kinesthetic feedback and force feedback. Kinesthetic feedback provides information about the direction of the object’s movement in the virtual environment by the movement of the arms. The magnitude of the force required to move the cubes in the virtual environment was proportional to the arm movement (e.g., the larger the arm movement, the higher the force). Force feedback was the sensation of force required to push or lift the cubes, which determined the applied force needed by the learner to move the objects in the virtual environment. For instance, students applied a higher force to push a cube on a rough surface than on a smooth surface. Learners experienced haptic feedback when they received force and kinesthetic feedback at the same time.
2.2. The Friction Test
The friction test consisted of multiple-choice questions (one correct answer and two distractors). The questions that addressed the concept of the role of the objects’ size in friction were:
The frictional force of Cube 2 is higher, lower, or equal (<, >, =) to the frictional force of Cube 3;
The speed of Cube 2 is higher, lower, or equal (<, >, =) to the speed of Cube 3;
The acceleration of Cube 2 is higher, lower, or equal (<, >, =) to the acceleration of Cube 3; and
Assuming that you applied the same force to Cubes 2 and 3: the traveled distance of Cube 2 is higher, lower, or equal (<, >, =) to the traveled distance of Cube 3.
Completing the test before using the learning tool promoted the recall of prior knowledge and hypothesis formulation.
2.3. The Worksheet
A worksheet guided the students’ experimentation with the PMT and VHS. The experimentation phase consisted of four stages: (1) recognition, (2) focusing on Cube 2, (3) focusing on Cube 3, and (4) comparing Cube 2 vs. Cube 3. All the stages used multiple-choice questions, with one correct answer and two distractors.
Learners explored the board and the cubes during the recognition stage. The recognition phase served as a pre-training session for learners. Learners using the VHS learned to control and interpret the haptic and visual feedback during the recognition stage. Learners felt and interacted with the board and cubes of the PMT for the first time during the recognition stage. The questions of the recognition phase were: (a) which cube is the smallest? (correct answer: Cube 3) and (b) what is the difference between Cube 2 and Cube 3? (correct answer: Cube 3 is smaller than Cube 2). To answer questions (a) and (b), learners using the VHS lifted the cubes represented in the virtual environment with the haptic device.
Participants in the PMT condition used two methods for recognizing the cubes’ characteristics. In the first method, learners manipulated the objects using their palms (e.g., cubes rested on their palms). In the second method, learners used two paper bags to compare the weight of the cubes. Learners put a cube inside each paper bag and lifted it. The difference between the learners’ recognition methods with the PMT is that the palm method allowed learners to feel the material, composition, density, and shape of the cubes. In the paper bag method, the manipulation of the objects was limited, and the learners focused only on the weight of the objects. Once they finished recognizing the cubes’ weight, we provided a digital scale to learners to measure the weight of the cubes. The scale provided the correct answers to students about the weight of the objects before continuing with the experimentation phase.
The second and third stages of the experimentation with the learning tool required learners to focus on pushing a specific cube on the boards’ surfaces. Learners compared the differences in the force applied, speed, acceleration, and traveled distance required to slide the cube on the different surfaces (e.g., cardboard vs. sandpaper). The fourth stage of the experimentation worksheet focused on the effect of the objects’ size on friction. Learners compared the differences in applied force, friction force, speed, acceleration, and traveled distance between sliding Cube 2 and Cube 3 on a smooth surface.
2.4. Participants and Context
The study occurred during the fall of 2018 and spring of 2019 at Midwest University. Participants were students from an undergraduate technology program registered in an introductory applied statics course (n = 206). The course consisted of two lectures of one hour each and a laboratory section of two hours per week. Students completed the study during the 13th week of the semester during the laboratory section. The course stayed the same from one semester to another; the same instructor taught the course using the same syllabus and learning materials. We only considered the data collected during the fall semester for the nine learners who retook the course in the spring semester. The researchers did not have control over the course registration process. Most study’s participants were freshmen (42.33%) or sophomores (36.41%). A total of 87.38% of the participants were male (n = 171). Thirty-three (n = 33) students were receiving formal static instruction for the first time.
For this study, we had two settings: one for interacting with the VHS and the other for interacting with the PMT. The VHS setting had twenty-eight stations, and the PMT setting had eleven stations. For the classrooms’ configurations, we only considered the number of haptic devices and laptop computers available and the limitations of the space (e.g., door, power outlets, number of tables).
Upon arrival at the laboratory session, participants sat in one of the 28 available VHS stations. If the number of students enrolled in the laboratory session was higher than 28, the remaining participants sat in the PMT classroom.
Participants worked individually in all the stages of the study. Discussion between the students was neither encouraged nor prohibited; students decided where to sit in the classroom upon arrival (e.g., researchers did not arrange student spaces). One or two researchers or teacher assistants were available to clarify instructions.
2.5. Procedures
Participants completed the study in two days. On the first day, participants attended the friction lecture and completed the friction test as a pre-test. During the second day, participants interacted with the corresponding hands-on tool (e.g., VHS or PMT) to learn friction concepts and complete the post-test friction test. The experimentation worksheet guided the interaction with the learning tools.
During the laboratory section of the course, students individually interacted with a visuohaptic simulation (VHS) or a physical manipulative tool (PMT). For students in the VHS condition, we randomly assigned each laboratory section to a different configuration of the VHS condition. The VHS condition configurations were: Visual (V), Haptic (H), Simultaneous (H + V), and Sequenced (H→H + V). The difference between the conditions was the type of feedback received.
Table 1 shows the types of feedback provided for each of the conditions.
The conditions had different numbers of participants because there were laboratory sessions with more students than others. Researchers did not have control over the number of participants attending a laboratory section. Regardless of the condition, all learners received at least one type of haptic information and one type of visual information. Participants in the PMT condition received kinesthetic feedback, force feedback, and visual feedback afforded by the physical environment. Participants in the VHS conditions received force feedback through the haptic device (e.g., Falcon Novint) and visual feedback on the computer laptop screen. Participants in the PMT, V, H, and Simultaneous (H + V) conditions received haptic and visual information during one interaction with the visuohaptic simulation. The Sequenced (H→H + V) condition required two interactions with the VHS. During the first interaction, participants in the Sequenced approach received haptic feedback + minimal visual feedback and haptic feedback + enhanced visual feedback during the second interaction. Therefore, participants in the Sequenced (H→H + V) condition received the same feedback as the Haptic (H) condition in the first interaction, and the same feedback as the Simultaneous (H + V) condition in the second interaction.
For answering the worksheet questions, learners used haptic and visual information. Learners perceived the friction force through haptic feedback and enhanced visual feedback (e.g., the numerical value of the magnitude and direction of the friction force). Kinesthetic feedback provided information about the traveled distance (e.g., how long the arm moved was proportional to the magnitude of the force). The traveled distance was also determined by visually comparing the start and end points of the pushed cubes. The learners determined speed and acceleration only by observing the cubes sliding on the surface.
2.6. Validity and Reliability Considerations
We addressed the instruments’ validity using face and content validity methods. A multidisciplinary team developed the materials used for the study based on the results reported in the Statics Concept Inventory [
47]. The team were experts in physics, mechanical engineering, computer simulations, education, and design ensuring the alignment between the physics laws and the technology capabilities (e.g., the haptic device used had three degrees of freedom). The design team and external personnel with physics and mechanical engineering knowledge revised the materials multiple times.
For assessing the internal consistency reliability, we used the Kuder–Richardson 20 test (KR-20). We used the KR-20 because the data obtained were binary (e.g., correct or incorrect). For the calculation of the KR-20, we considered blank answers as incorrect. The obtained internal consistency value for the eight items included in the pre-test and post-test was a = 0.861.
3. Results
The following sections compare the results obtained at the study stages (e.g., pre-test, experimentation, and post-test) for answering the research questions.
3.1. Comparing PMT and VHS for Learning Friction
This section focuses on answering the first research question about the differences in learning the role of the objects’ size in friction.
Table 2 compares the pre-test vs. post-test scores on each condition. Pre-test scores suggested no significant differences in the conditions at a 0.95 confidence level [F (4201) = 0. 728,
p = 0.574]. Thus, all initial conditions were comparable.
Results from
Table 2 suggest that students had problems answering the role of the objects’ size in friction after the lecture (i.e., pre-test scores). Post-test scores increased in all conditions. The Visual (V) condition had the highest increment, 42.02%, followed by the Simultaneous (H + V) condition, 34.09%. The PMT condition had the lowest increment, 5.71%. The PMT was the only condition with no statistically significant learning gains from the pre-test to the post-test.
The analysis of post-test scores suggests statistically significant differences between condition groups at a 0.95 confidence level [F (4201) = 5.438, p-value = 0.0003]. Post hoc comparisons using the Tukey HSD test suggested two groups of means in the post-test scores. Group A included the PMT and the Haptic (H) conditions. Group B included Visual (V), Simultaneous (H + V), and Sequenced (H→H + V).
Table 3 shows the percentage of correct, incorrect, and no-response answers in the pre-test and post-test by the physics variable investigated in this study (e.g., friction force, speed, acceleration, and traveled distance).
Results suggest that all conditions decreased the percentage of incorrect answers in all the physics concepts investigated in the study. The Visual (V) condition had the highest increment of correct answers from pre-test to post-test in speed, acceleration, and traveled distance, by 45.45%, 44.68%, and 48.94%, respectively. The Simultaneous (H + V) condition obtained the highest increment for the concepts of frictional force, 45.45%.
3.2. Analysis of Experimentation Answers
Results from the recognition stage (e.g., comparing the weight of Cube 2 vs. Cube 3) suggest that students did not have problems identifying that Cube 3 was the smaller cube. Only one student in the Haptic (H) condition incorrectly identified Cube 1 as the smallest cube. Regarding the differences in weight between the cubes,
Table 4 shows the frequency of correct and incorrect answers per condition.
Results shown in
Table 4 suggest that students in the PMT condition had difficulties identifying that Cube 2 and Cube 3 had the same weight but different sizes. For instance, students answered that Cube 3 was heavier than Cube 2 (thirteen in the PMT-palm method and nine PMT-bag method). Twelve students in VHS conditions answered the question about the difference between Cube 2 and Cube 3 incorrectly. Six students indicated that Cube 3 was heavier than Cube 2. The two students that incorrectly recognized the similitude in weight of the cubes in the Visual (V) condition indicated that Cube 2 was heavier than Cube 3.
Table 5 shows the comparison between pre-test and experimentation scores. We only considered the students from the spring semester using the PMT to analyze the experimentation stage (
n = 18). Students in the fall semester answered the experimentation questions in an open-ended question, making it difficult to compare the study stages. We included each interaction with the Sequenced (H→H + V) condition separately. Those in the first interaction of the Sequenced (H→H + V) condition had a similar experience to those in the Haptic (H) condition, while those in the second interaction had a similar experience to those in the Simultaneous (H + V) condition.
Table 5 also shows that the PMT-2 condition was the only group whose mean score decreased from the pre-test to the experimentation stage, by 13.88%. The Haptic (H) condition increased the mean score from pre-test to experimentation by 7.29%, but not at a statistically significantly different level (
p-value = 0.24). All other VHS conditions had significant differences between the pre-test and the experimentation scores. The scores of the Visual (V) and the second interaction of the Sequenced (H→H + V) conditions were statistically significantly different at α = 0.001. The effect size in the Visual (V) condition was strong, and it was moderate for the second interaction of the Sequenced (H→H + V) condition.
Students in the second interaction with the VHS in the Sequenced (H→H + V) condition improved their scores from the first interaction. Comparing the first and second interactions of the Sequenced (H→H + V) scores resulted in statistically significant differences at t (53) = −3.22, p-value = 0.02. The comparison between the experimentation and post-test scores suggest increments in all the conditions except in the Visual (V) condition, in which the mean score decreased by 0.53%. All comparisons between experimentation score and post-test scores were not significantly different.
For comparing the differences among conditions in the experimentation scores, we used one-way ANOVA. Results suggested statistically significant differences in the experimentation scores at F (4184) = 9.183, p-value < 0.001. Similar to comparing the post-test scores, the post hoc analysis using the Tukey HSD method suggested two groups of experimentation scores, Group A (PMT and Haptic (H)) and Group B (Visual (V), Simultaneous (H + V), and second interaction of Sequenced (H→H + V)).
4. Discussion
This study aimed to investigate the differences in learning between interacting with PMT and VHS for learning friction (RQ1), and to determine the haptic and visual feedback’s influence on learning concepts of friction (RQ2). We compared the students’ performance in the multiple-choice questions in the pre-test, experimentation, and post-test. The study’s conditions were PMT and four configurations of the visuohaptic simulation: Haptic (H), Visual (V), Simultaneous (H + V), and Sequenced (H→H + V).
Results of the pre-test suggest that students hold incomplete ideas of friction after instruction. There is an alignment between our results and other studies that have reported that learners hold incomplete ideas of scientific topics even after instruction [
20,
21,
22,
23,
24]. Moreover, the experimentation and post-test scores suggested that the visuohaptic simulation helped learners construct scientific knowledge of friction. The result is aligned with our previous findings in [
7,
10], and with the research suggesting that active learning tools facilitate the learning of scientific concepts (e.g., [
1,
2,
3,
4]). Furthermore, we consider that the combination of students’ prior ideas of friction, as reported in [
47], with the PMT’s and the VM’s affordances, the visuohaptic simulations enhanced the students’ learning of the friction concepts. The obtained results for the PMT were not promising. The following section focuses on analyzing our results differences.
4.1. Comparing PMT vs. VHS
The first research question was: What are the differences in learning the role of the objects’ size in friction between interacting with a physical manipulative tool PMT and a visuohaptic simulation VHS? Based on the analysis of learning gains, answers per question, and experimentation scores, we rejected the null hypothesis (e.g., PMT = VHS). We concluded that students in the VHS conditions outperform students in the PMT condition (PMT < VHS).
Specifically, we based the decision to reject the null hypothesis on two main results. First, our PMT did not help learners modify their incomplete knowledge obtained from previous grounded experience or prior instruction. Scores obtained in the PMT condition were the lowest. Moreover, comparisons of pre-test vs. post-test scores (see
Table 2) and pre-test vs. experimentation scores (see
Table 5) suggested no statistically significant differences.
Secondly, learners who received enhanced visual feedback (e.g., Group B) performed significantly better than those in the PMT condition. Scores of those in the Group B conditions were higher than those in the Group A conditions (see
Table 2,
Table 3,
Table 4 and
Table 5). For instance, in the Visual (V) and Sequenced (H→H + V) conditions, the learning gains from pre-test to post-test were statistically significantly different, with
p-value < 0.001, while the PMT condition was not significantly better (
p-value = 0.41).
One possible explanation for the lower results of Group A compared to Group B is in the results of the recognition phase. The PMT and Haptic conditions had a higher percentage of incorrect answers in the recognition stage. Results suggested that students in the Haptic (H) condition and the PMT experienced the illusion of size–weight [
35,
36]. Moreover, even when students used the scale to determine the weight of Cube 2 and Cube 3 in the PMT condition, students may carry this incorrect perception through the entire interaction with the learning tool. The learners’ interpretation of the feedback provided by the learning tool may have a high impact on the success of the learning experience. More research is needed to test the hypothesis that students carry incorrect perceptions throughout the learning activity.
The results of our study in favor of the VHS conditions over the PMT condition support prior research, indicating that virtual manipulation improves the understanding of concepts by allowing the learners to perform experiments (e.g., [
31]). Results also expanded prior research, whose results favored VM over PMT in learning science concepts (e.g., [
33]). Results contradict the studies that found no advantages of the VM over the PMT environment for learning physics and anatomy (e.g., [
29]). Our experiment considered the Visual (V)-only condition similar to the VM condition (e.g., students manipulated the virtual environment with no haptic feedback). Students in the Visual (V) condition outperformed in the PMT condition in all the analyses performed (e.g., learning gains, percentage of correct answers per physics variable, and experimentation scores).
4.2. Comparing the Visual and Haptic Feedback
The second research question was: What is the influence of VHS’s visual and haptic feedback on students’ conceptual knowledge of the role of the objects’ size in friction? Based on the results, we rejected the null hypothesis (e.g., H = V) and concluded that haptic and visual feedback influence the conceptual knowledge of friction differently (H ≠ V).
We found mixed results in the conditions that received haptic feedback and minimal visual cues from the VHS. Only some of the students could correctly interpret and connect the haptic feedback with the conceptual knowledge, even when we enhanced the haptic feedback to the maximum capacity of the technology (e.g., 10 N). For instance, six students in the Haptic (H) condition provided incomplete friction explanations in the pre-test and experimentation worksheet. However, the results from the pre-test to the first interaction with the VHS in the Sequenced (H→H + V) condition were positive. Students in the Haptic (H) condition and during the first interaction with the VHS in the Sequenced (H→H + V) condition received haptic and minimal visual feedback. Moreover, the results of the recognition of the cube’s characteristics (
Table 4) supported this conclusion. Students can incorrectly interpret virtual objects’ physical characteristics when they receive haptic and minimal visual feedback.
Results suggest positive outcomes when enhanced visual cues were available for the students. Students in the Visual (V) condition received simultaneous visual and kinesthetic feedback. Results in the Visual (V) condition were positive in all the score comparison performed in the study (e.g., Visual (V) condition had significant learning gains from pre-test to post-test at p-value < 0.001). Regarding the Sequenced (H→H + V) condition, results suggested a significant increment of the scores from the first interaction to the second interaction when students had enhanced visual feedback available (p-value = 0.02). We conclude that learners required enhanced visual feedback to construct correct conceptual knowledge of friction. Learners easily interpreted the visual information and connected it with their friction conceptual knowledge.
Moreover, based on the positive results of the Visual (V) condition, enhanced visual feedback might overpower the haptic feedback. Visual feedback is easier to read and process for humans than haptic feedback [
13]. Hence, the benefits of the haptic condition to provide a grounded learning experience decreased when the enhanced visual cues were visible. More research is needed to test this hypothesis.
Haptic feedback provided a grounded experience that promoted reflection on concepts after using the VHS [
11,
45]. Simultaneous (H + V) and Sequenced (H→H + V) had an increment in the mean score from the experimentation to the post-test phases (
Table 5). The Visual (V) condition score dropped by 0.53%. The drop in the Visual (V) condition and the increment in the score in all the haptic conditions suggest that haptic feedback promoted a student’s reflection of the concepts even after using the learning tool. Furthermore, this study allows us to hypothesize that haptic feedback positively influences retention. A future study is required to test this hypothesis.
5. Implications
Our study draws implications for the areas of learning design and education research. For the learning design implications, we compared our results with the affordances presented in [
30]. Depending on the results obtained in this study and the characteristics of the learning experience (e.g., feedback provided), we classified the condition’s impact on affordance into four categories: high-, medium-, low-, and none-value categories. High impact indicates that results suggested a positive and high impact of the condition in the affordance. The low category indicates that results suggested a low impact of the condition in the affordance.
Table 6 presents the classification per affordance presented in [
30] of the conditions of the study.
Comparing PMT and the Haptic conditions, we found an alignment between the affordance analysis and the statistical analysis shown in the prior section. Both analyses suggested the learning benefits of VHS over PMT. VHS facilitated the students’ observation of the friction phenomenon, A3 (e.g., the friction concepts and their relationship with the speed, acceleration, and traveled distance). The multi-sensory feedback provided by the PMT did not provide an advantage for learning (A5). For instance, learners in the PMT had more problems identifying the cubes’ characteristics than those in the Haptic (H) condition. Constraining the cubes’ rotation and tactile information about the materials and density of the cubes (A12) may positively impact learning the role of the object’s size in friction [
34]. The PMT and Haptic (H) conditions had the limitation of not showing multiple linked representations to learners (A5), and learners did not experience the concepts beyond the usual perception, A11 (e.g., by providing enhanced visual feedback). However, the comparable results in the post-test between the PMT and the Haptic (H) conditions allow us to reinforce the importance of enhancing visual information in virtual environments. Prior research suggested that virtual environments are better for learning than the physical environment if there is a consideration and enhancement of the affordances of the virtual environment [
30,
48].
Regarding the comparison of VHS conditions receiving enhanced visual feedback, results suggested that the Sequenced (H→H + V) condition took advantage of six specific affordances of the PMT and VM at a higher level than the Visual (V) and Simultaneous (H + V) approaches. The affordances relate to learners exposed to experimentation skills (A1), allowed the observation of the friction phenomena (A3), offered multi-sensory feedback (A5), used the body for learning (A7), observed multiple linked representations (A10), provided real-time feedback (A13), and provided observable outcomes (A14). Haptic feedback and enhanced visual feedback worked together to promote the conceptual understanding of the role of the objects’ size in friction and its influence on speed, acceleration, and traveled distance. There is an alignment between our results and prior research that suggests that embodied learning activities promote the comprehension of forces because they are a natural way for humans to experience the phenomenon (e.g., [
11]). Providing haptic feedback while manipulating the virtual environment promoted the comprehension of the forces beyond direct observation. Moreover, students in the Sequenced (H→H + V) condition had two experimentation stages, providing more time to observe the phenomenon (A3 affordance) and allowing them to focus on a different sense of each interaction. During the first interaction with the VHS, students focused on haptic feedback to interpret the information. During the second interaction, with enhanced visual feedback, students reinforced their interpretation or were able to change their answers based on the visual cues.
For the education research area, results imply that manipulating a virtual environment through the haptic device provided a sense of immersion and presence in the learning activities and an active transfer of information in a two-way path [
11,
13]. First, learners manipulated the haptic device to modify the virtual environment, and the virtual environment provided information about the forces acting on the cubes. For instance, a learner increased the force required to push the cubes based on the weight simulated in the virtual environment.
The experimentation and observation worksheet guided learners to perform specific actions to acquire knowledge of friction concepts. Learners unfolded the conceptual information through bodily actions [
49]. The VHS had perceptual affordances that facilitated the comprehension of the friction concepts and the performance of actions to interact with the virtual environment. The enhanced visual feedback (e.g., force magnitude and direction) provided easy-to-understand information for the learners [
13].
6. Conclusions and Future Work
From this study, we can draw four main conclusions. First, we conclude that friction is a concept that is difficult to learn. Pre-test results showed that students held incomplete ideas of friction after instruction and that using active learning tools may not guarantee the acquisition of scientific knowledge. Future research could investigate students’ conceptions of friction concepts before being exposed to formal instruction at the college level, for example, at the elementary school level.
Secondly, VHS can be an effective tool for promoting the learning of science concepts in an active way. However, our PMT did not help learners acquire friction knowledge. All the VHS configurations outperformed the PMT condition. The impact of the visual and haptic feedback cannot be separated in the PMT condition because learners received feedback simultaneously. More research is needed to determine the effect of visual and haptic feedback on students’ learning using a physical manipulative tool.
Thirdly, the easy recognition of enhanced visual feedback facilitated learning and helped diminish the size–weight illusion in learners; moreover, due to the differences in the ability to process haptic and visual information, visual information may overpower haptic feedback. However, more than visual feedback was needed to experience a grounded experience. We propose including qualitative methods in analyzing students’ answers to continue investigating the role of haptic and visual feedback in multimodal learning environments.
The last conclusion relates to the design of learning experiences using visuohaptic simulation. Specifically, the learning experience must promote experimentation skills by enhancing the affordances of virtual and physical manipulatives. Learners interacting with VHS in a sequenced approach can result in their familiarization with the learning tool and the feedback.


