
Sustainable and Intelligent Phytoprotection in Photovoltaic Agriculture: New Challenges and Opportunities

Abstract
:1. Introduction
- (1)
- (2)
- (3)
- (4)
- (5)
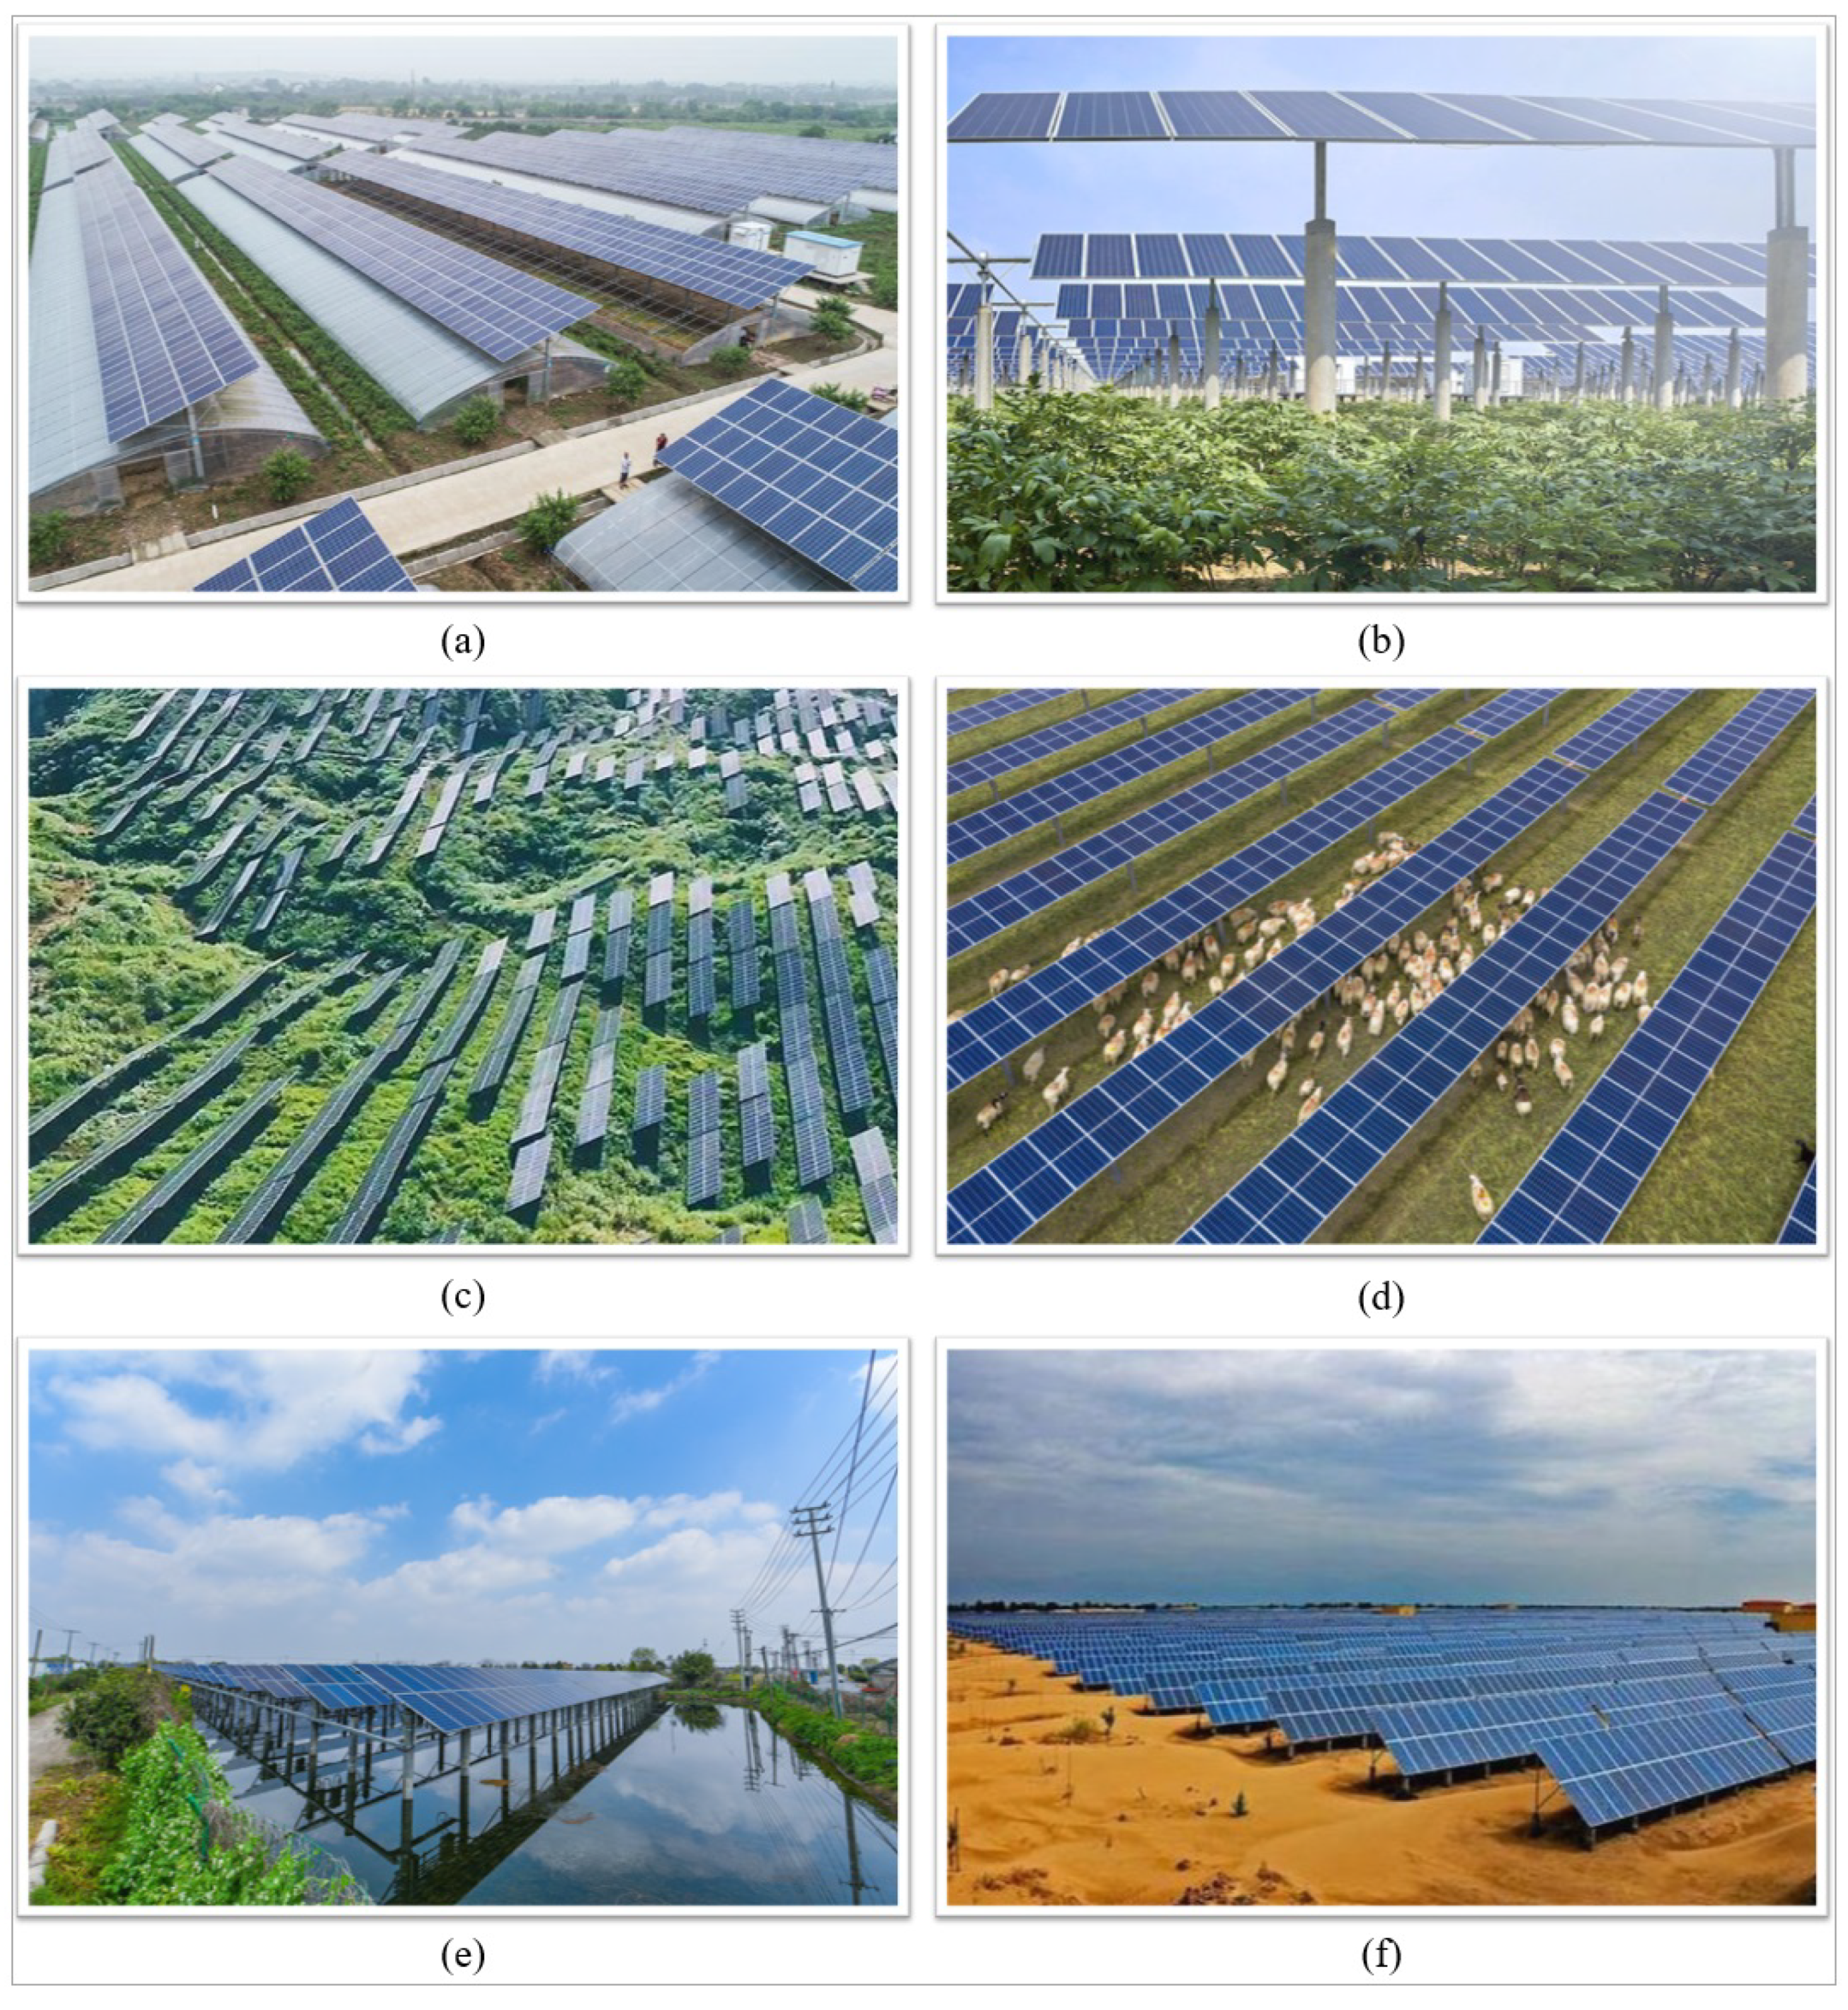
- Fishery-optical complementarity: Aquaculture is practiced under photovoltaic panels. In these systems, intense light is prevented from directly hitting the water body and reducing the water temperature, which benefits some aquacultures. These are generally known as photovoltaic fishery (Figure 1e [7]).
- (6)
- (1)
- The key research challenges of sustainable and intelligent phytoprotection in PA were discussed, including the use of physical control equipment and wireless sensors.
- (2)
- In PA, wireless sensor nodes should not be deployed on the whole metal bracket where the confluence box is located. Deploying wireless sensor nodes at any position on this metal bracket will seriously affect the normal working state of Zigbee-based devices.
- (3)
- When nodes are deployed in PA, the connection between nodes also needs to be far from certain areas centered on the metal bracket where the confluence box is located. The Packet Reception Rate (PRR) will be affected if this connection passes through this area.
2. PA-Related Works
2.1. The Coverage Rate of Photovoltaic Panels
2.2. The Policy of Photovoltaic Land Utilization
2.3. Absence of Agricultural Monitoring Facilities
- After deploying photovoltaic facilities in arid and desertification areas, the large-scale photovoltaic facilities improved the local microclimate and soil temperature and humidity between photovoltaic arrays, which increased the local plant coverage and carbon sequestration potential [21]. Therefore, after the establishment of photovoltaic power stations in northwest China, there is more and more forage grass under photovoltaic facilities, enough to support animal husbandry.
- For saline-alkaline land, except for highly severe saline-alkaline land and land plots with large topographic relief, they can be improved by engineering and agronomic measures to become farmland or land for agricultural facilities construction. Following the above principles on saline-alkaline land, grass planting, oat planting, well drilling and rice planting are selected for land improvement, and utilization [22]. Land improvement can combine favorable environmental and climate changes to produce a better effect.
3. Photovoltaic Agriculture: Phytoprotection Applications and Their Requirements
3.1. Concept of Sustainable and Intelligent Phytoprotection
3.2. Why Carry Out Sustainable and Intelligent Phytoprotection in PA?
3.3. How to Carry Out Sustainable and Intelligent Phytoprotection in PA?
- Physical control: The Solar Insecticidal Lamp (SIL), as a representative physical control equipment, can be deployed on the metal bracket under the photovoltaic panel, effectively reducing the deployment cost. The SIL, equipped with a camera and a temperature and humidity sensor, can be deployed to monitor plant diseases and pests in the area around SIL. Moreover, the environmental condition parameters in PA can also be collected, further judging the occurrence law of pests and diseases.As shown in Figure 3, the application mode of SIL in PA is as follows:
- (1)
- In the daytime, photovoltaic panels generate electricity, part of which charges the storage battery of the SIL, and part of which is connected to the grid to sell electricity. The air temperature and humidity sensor, soil moisture sensor, soil fertility sensor, and camera on the SIL are to collect the environmental condition data, pests and diseases in PA. SIL nodes communicate with each other through wireless sensor networks, and the data is transmitted to the base station for analysis to draw up further plant protection measures in this area.
- (2)
- In the nighttime, the metal mesh of SIL discharges to kill pests, and the insecticidal quantity is recorded to analyze the active time of different pests, further acquiring the law of their active time. The time for SIL killing the pests is up to the results about the active time of both pests and beneficial insects in PA, thus decreasing the number of beneficial insects killed.
- Biological control: Biological control can be carried out according to the above law of the active time of different pests. Furthermore, the impact of various factors, e.g., environmental conditions, host plants, host pests, application methods, and product batches, on natural enemies of pests and pathogenic microorganisms is taken into consideration, further realizing green intelligent biological control.
- Ecological control: Ecological control can also be carried out. According to the current environmental conditions in PA, some kinds of crops can be determined so that the crops can be in a suitable growth environment, thus improving the disease resistance of crops. Furthermore, the planting structure of crops can be continuously improved, beneficial organisms can be protected, and the occurrence rate of pests and diseases can be controlled through biodiversity regulation.
- Carrying out photovoltaic projects on these two kinds of land, photovoltaic panels will improve local climate conditions, positively affecting land improvement. At the beginning of the project, environmental monitoring sensors are deployed to monitor the changes in environmental condition parameters in PA and decide whether to plant crops and what kinds of crops to plant according to the environmental condition parameters. With the gradual improvement of the land, the variety of crops that can be planted increases, and the corresponding pests and diseases also change. At this time, the land could be treated as ordinary farmland.
3.4. Considerations for Phytoprotection Requirements
- (1)
- Deployment of physical control equipment: Due to the influence of the inverter and other equipment, the wireless communication in PA will be affected by EMI. The strong electromagnetic pulse generated by the SIL during the insecticidal discharge will seriously interfere with the communication equipment around it and even lead to equipment failure. Therefore, to reduce the interference on deployed equipment in PA, deployment can be carried out as far as possible to avoid the interference area, and at the same time, wireless communication equipment and sensors are not deployed within 25 cm around the SIL [27].
- (2)
- Deployment of monitoring sensors: Monitoring environmental parameters is vitally important for understanding the occurrence law of diseases and pests in this area and what kind of crops are suitable for planting. In order to monitor the change of environmental parameters in PA, it is necessary to deploy air temperature, humidity, and soil moisture sensors, which can also be integrated into the nearby SIL.
4. Case: Influencing Factors of Wireless Communication Quality on Zigbee-Based Devices in PA
4.1. Experimental Setup
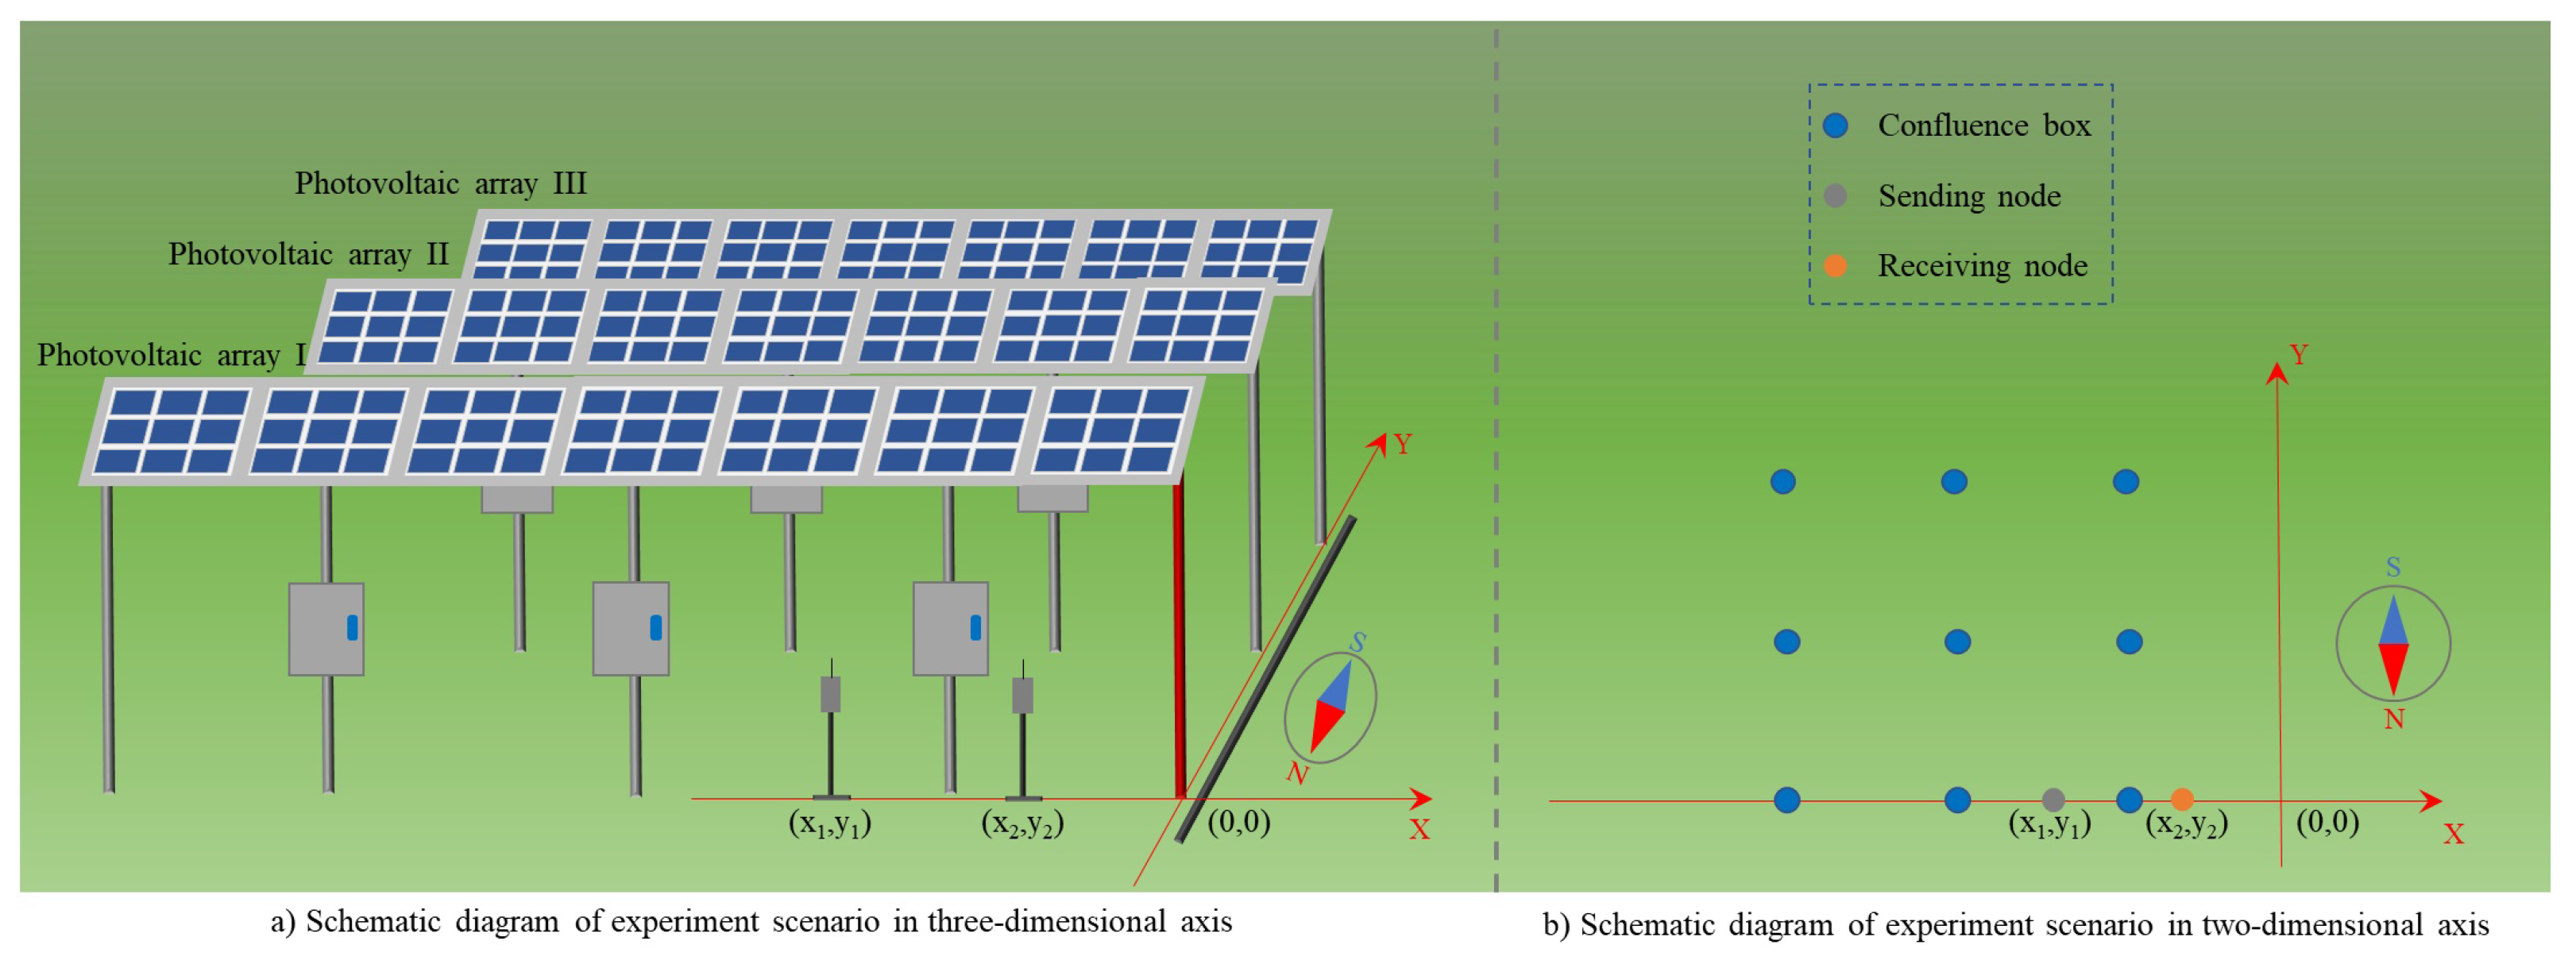
4.1.1. Experimental Scenario
- (1)
- Introduction
- (2)
- Deployment of experimental devices
- (3)
- Selection of communication protocol
- 2021-09-11 13:31:51.104: it means data sending time;
- AA.BB.CC.000: it means data details;
- -43: it means RSSI.
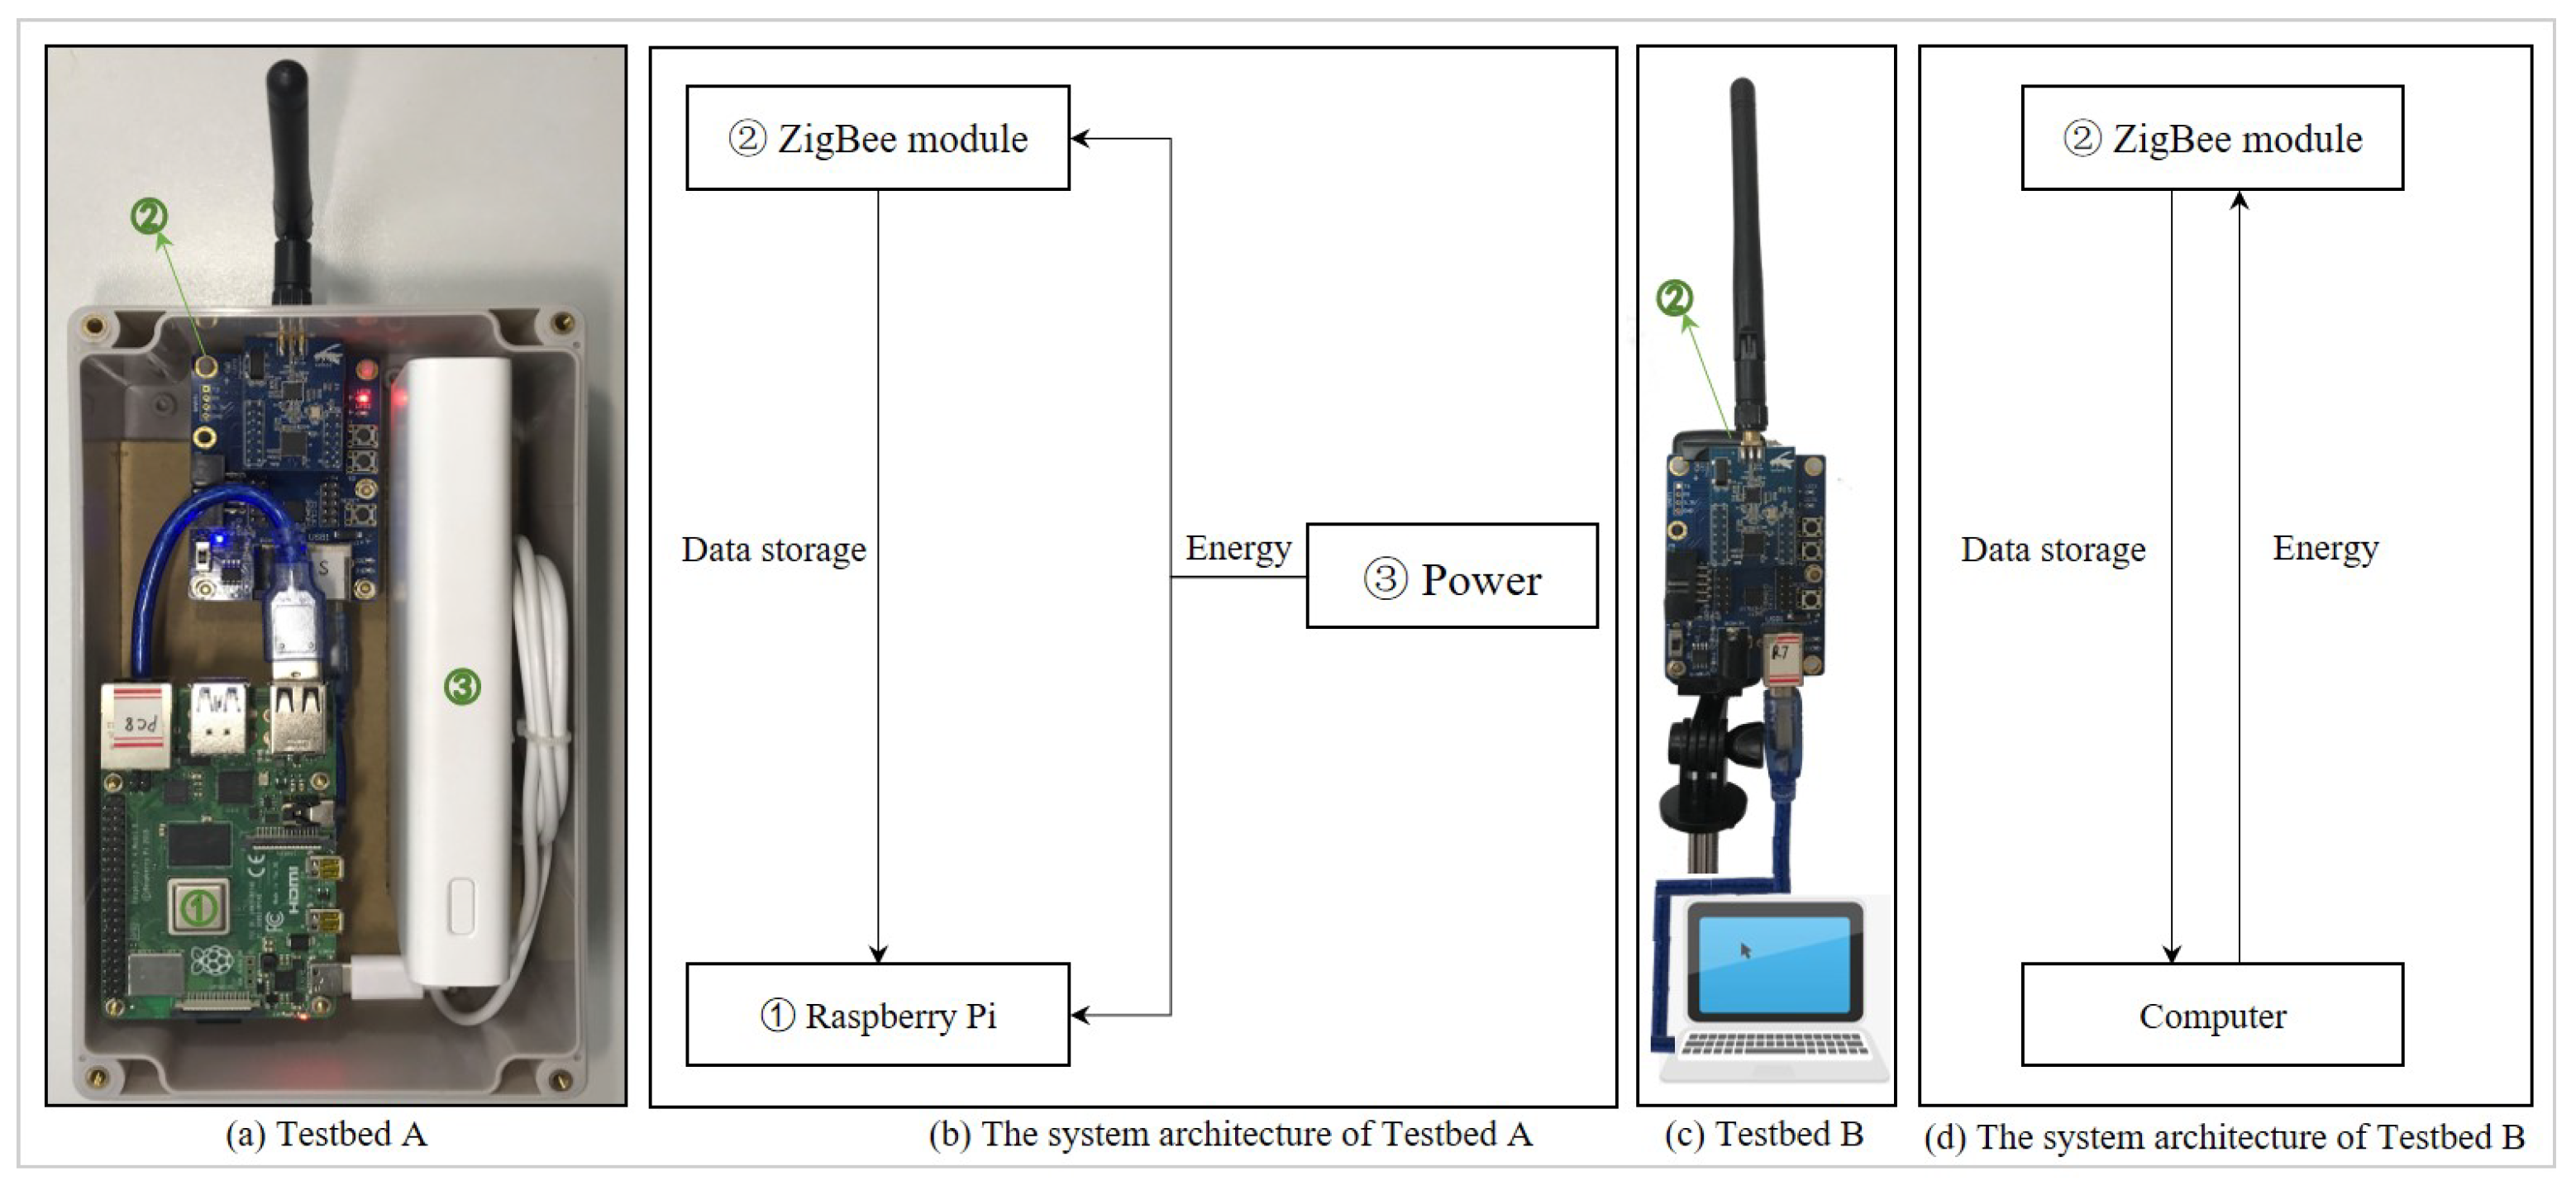
4.1.2. Testbeds
- (1)
- Testbed A
- (2)
- Testbed B
4.2. Experimental Scheme
- In the experiments with the No from 1 to 4, move the receiving node to change the distance between the receiving node and the confluence box.
- In the experiment with the No 5, move the sending node and the receiving node simultaneously to stay away from the confluence box.
- In the experiments with the No from 6 to 8, move the sending node to change the position of both the sending node and the receiving node and to change the distance between the receiving node and the confluence box.
- In the experiment with the No 9, move the sending node and the receiving node away from the confluence box simultaneously.
- In the experiments with the No from 1 to 4, move the receiving node to change the distance between the receiving node and the confluence box.
- In the experiment with No 5, move the sending node to the other side of the metal bracket under the photovoltaic panels, and at the same time, move the receiving node so that the connection line between the sending and receiving nodes does not pass through the confluence box.
- In the experiments with the No from 6 to 7, fix the position of the receiving node and move the sending node to the neighbor metal bracket of the same photovoltaic array.
- In the experiments with the No from 8 to 11, exchange the positions of the sending node and the receiving node corresponding to the experiments with the No from 1 to 4.
- In the experiments with the No from 12 to 14, which is different from the experiments with the No from 5 to 7, move the sending node so that the confluence box can appear on the connection line between the sending and receiving nodes.
4.3. Experimental Results and Analysis
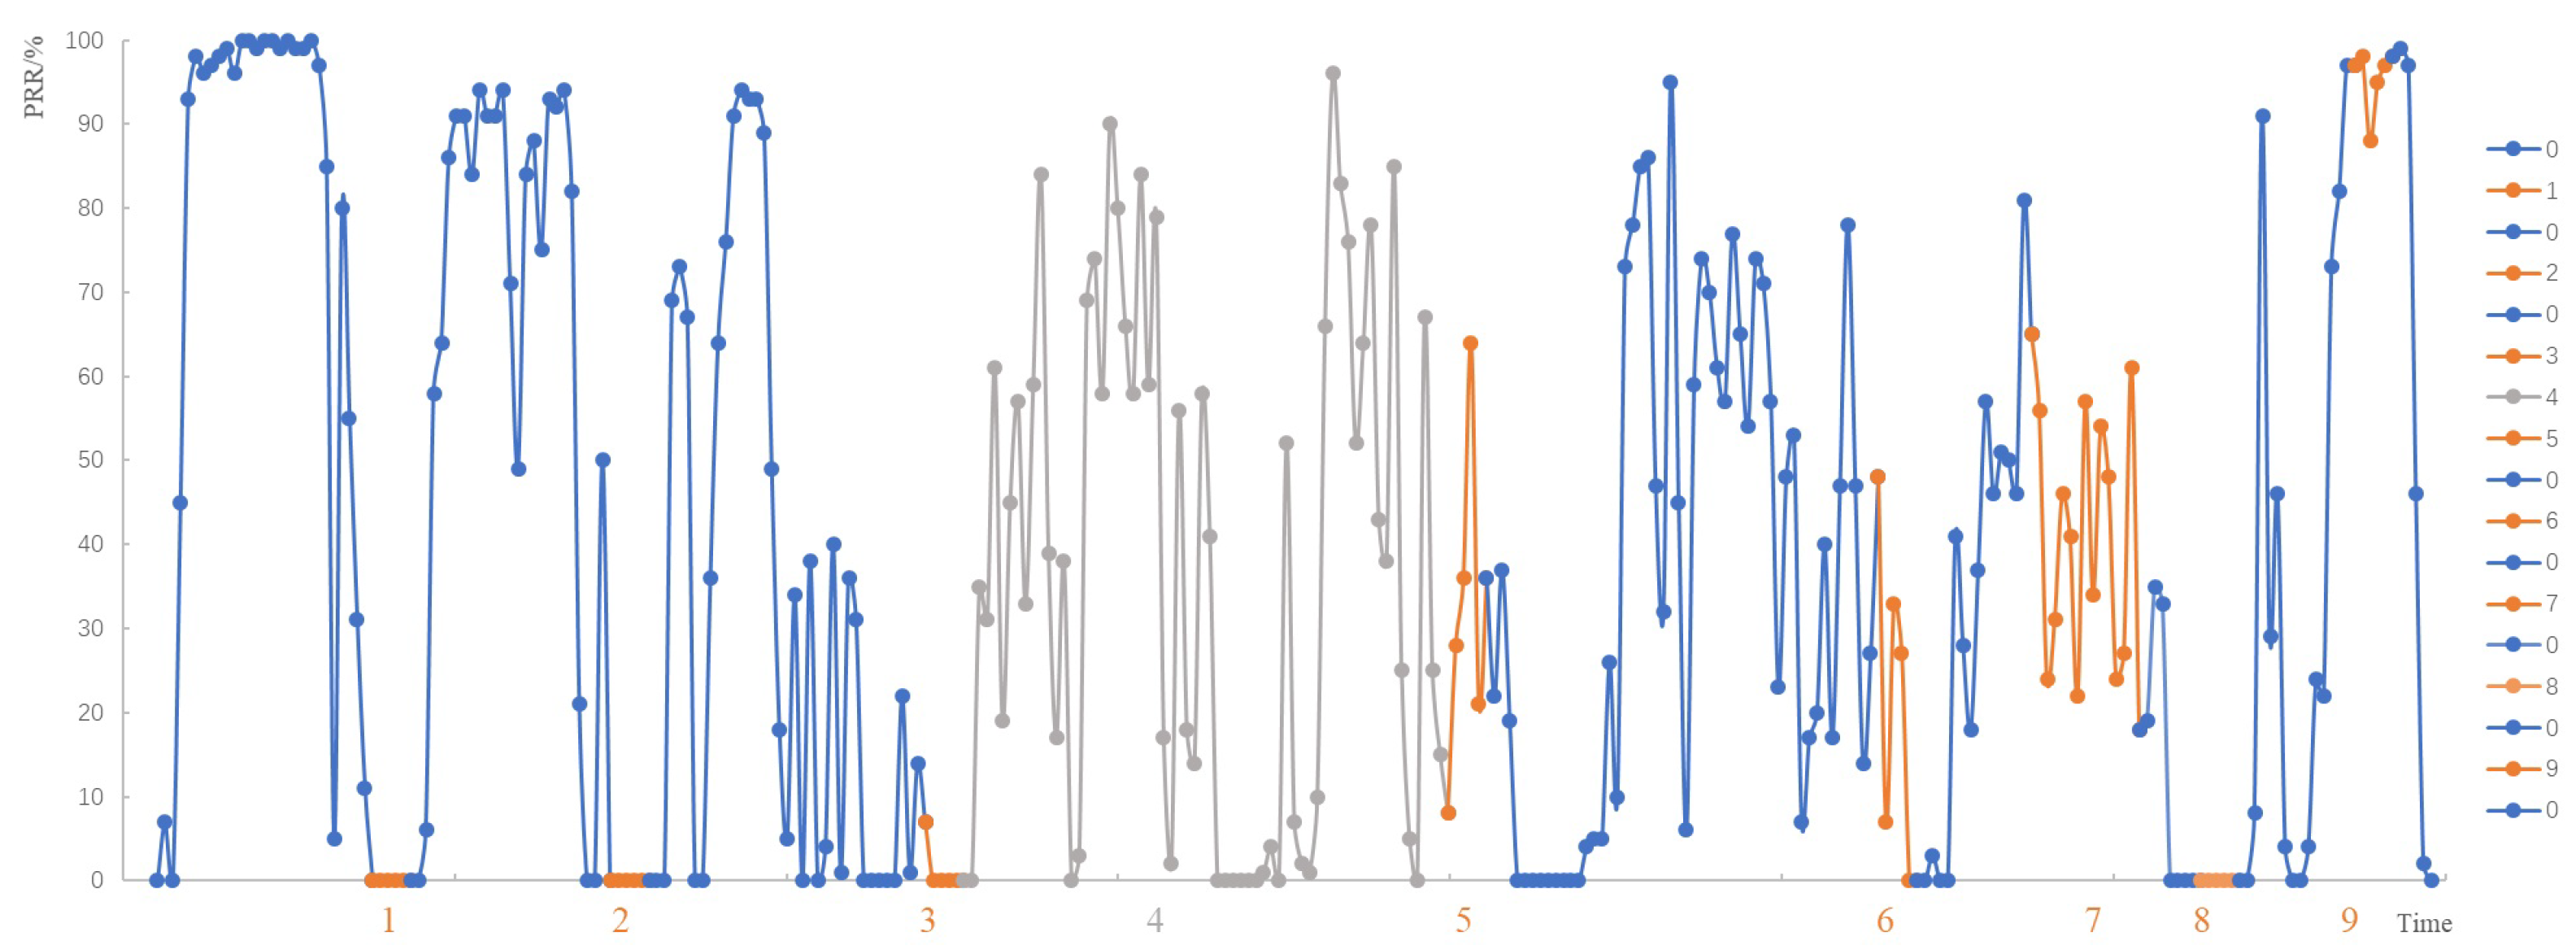
4.3.1. Controlled Experiments on the Power of 0 dBm
- Label 0: It is the collected data while moving the nodes;
- Label 1 to 3: When the receiving node is deployed on the metal bracket near the confluence box, the PRR is very low or even zero;
- Label 4: When the receiving node moves up and down on the metal bracket where the confluence box is located, the PRR also fluctuates significantly, and the PRR is even zero sometimes;
- Label 5: When the sending node and the receiving node synchronously move to the position far away from both the photovoltaic array and the confluence box, the PRR improved;
- Label 6: When the sending node is deployed again on the metal bracket near the confluence box, the PRR is not zero;
- Label 7: When the sending node moves to the metal bracket where the confluence box is located, the PRR is not zero;
- Label 8: When there is a confluence box between the sending node and the receiving node, the PRR is zero;
- Label 9: When the sending node and the receiving node synchronously move away from both the photovoltaic array and the confluence box, the PRR recovers to a high value.
4.3.2. Transmission Experiments on the Power of 0 dBm
- Label 0: It is the collected data while moving the nodes;
- Label 1 to 2: There is no confluence box on the connecting line between the sending node and the receiving node. When the receiving node is gradually moved forward to the confluence box, and the PRR does not fluctuate significantly;
- Label 3: There is a confluence box on the connecting line between the sending node and the receiving node, and the PRR does not fluctuate significantly;
- Label 4: There is a confluence box on the connecting line between the sending node and the receiving node. Compared with the experiment in “Label 3”, the receiving node is far away from the confluence box, and the PRR fluctuates significantly;
- Label 5 to 7: There is no confluence box on the connecting line between the sending node and the receiving node, and the receiving node is 6m away from the confluence box. When the sending node is gradually moved forward to the receiving node, the PRR fluctuates, indicating that the PRR is also affected by factors other than the distance;
- Label 8 to 9: There is no confluence box on the connecting line between the sending node and the receiving node. The sending node in “Label 9” is closer to the confluence box than that in “Label 8”, then the PRR drops greatly;
- Label 10 to 11: A confluence box is on the connecting line between the sending node and the receiving node. When the sending node is moved away from the confluence box, the PRR is low;
- Label 12–14: There is a confluence box on the connecting line between the sending node and the receiving node. The position of the sending node is unchanged. When the receiving node is gradually moved away from the confluence box, the PRR is reduced from a high value to zero;
- Label 10.1, 9.1, 10.2, 9.2: The experiments were repeated twice at the positions in “Label 10” and “Label 9”, and the PRR exhibited a significant difference. Combined with the conclusion of the controlled experiments, it can be assumed that there is an area of EMI near the confluence box. If the receiving and sending nodes are deployed in this area, the PRR will be affected. The closer to the confluence box, the greater the interference effect. Therefore, if the sending node and the receiving node with the power of 0 dBm are deployed on the metal bracket within the area which is 6 m away from the confluence box, the PRR of the receiving node will still be affected.
4.3.3. Controlled Experiments on the Power of 21 dBm
- Label 1 to 8, 10 to 14: The PRR is high without violent fluctuation;
- Label 9: When there is a confluence box on the connecting line between the sending node and the receiving node, the PRR will still be affected. Overall, the negative effect is less than 0 dBm at the cost of increasing node energy consumption.
4.4. Experimental Discussion
4.5. Experimental Conclusions
5. Current Challenges and Future Research Opportunities
5.1. SIL Deployment Strategy in PA
- The deployment strategy of SILs in photovoltaic agricultural greenhouses needs to consider the size limitation of the greenhouse.
- The deployment strategy of SILs in forestry-photovoltaic complementarity needs to consider the constraints of topography and geomorphology.
- In the fishery-optical complementarity, the insecticidal lamp without metal mesh can be deployed, and the pests fall into the water after colliding with the lamp, further being food for fish. This structure of the insecticidal lamp is simple and the cost is cheap, so we can improve the deployed insecticidal lamp quantity under the same budget, thereby reducing the loss of crops around the water area by pests.
- For the agro-photovoltaic complementarity, husbandry-photovoltaic complementarity, and photovoltaic sand control, according to the previous experimental conclusions, it is not suitable to deploy wireless sensor network nodes in the area where the confluence box is located. In addition, the installed capacity should also be taken into consideration, which is related to the size of the above area.
5.2. Environmental Sensors Deployment Strategy in PA
- The climate in PA will change due to the shading effect of photovoltaic panels. Taking agro-photovoltaic complementarity, husbandry-photovoltaic complementarity, and photovoltaic sand control as examples, the transpiration of the soil below is weakened, and the soil moisture content is increased, which is beneficial to plant growth and the outbreak of plant diseases and pests. Therefore, it is necessary to monitor the changes in climate in PA and provide long-term data support for the outbreak law of plant diseases and pests in PA.
- The lighting conditions in PA will change due to the shading effect of photovoltaic panels. The coverage rate of photovoltaic panels directly affects the plant species planted in PA. Furthermore, the light will impact the insects [35]. For insects active in the daytime, photovoltaic panels can prevent insects from being burned by strong light in summer and provide a more suitable habitat for their reproduction. For insects active at night, insecticidal lamps with different wavelengths will attract different kinds of insects, and a reasonable selection of the lamp can effectively reduce the number of beneficial insects killed [36].
- The electromagnetic environment will change due to the power generation equipment in PA. The migration of insects is influenced by the direction and intensity of the magnetic field [37], and the magnitude of the earth’s magnetic field is between 0.03 and 0.06 mT, while the standard of the magnetic field intensity of electromagnetic radiation in PA is not more than 0.1 mT [38]. Therefore, the magnetic field intensity in PA may exceed that of the earth, which will inevitably affect the growth and development, phototaxis and flight behavior, reproduction and behavior, and life span of insects, thus the pest control measures need to be adjusted accordingly [39,40,41].
- The deployment density of different monitoring sensors is not the same, so it is necessary to take into account the monitoring requirements for different parameters and carry out the sensor deployment strategy differently. For sensors integrated on the SIL, it is not suitable to deploy the wireless sensor network node near the metal mesh 25 cm to avoid the interference of EMI generated from high voltage discharge [27].
5.3. Adaptive Adjustment Strategy of Data Transmission in PA
5.4. Special Design on Equipment Stability in PA
5.5. New Equipment and Technology for Forecasting Pests and Diseases in PA
- The existing insect situation forecast lamp is expensive, and its function cannot meet the needs of pest monitoring in different time periods, thus its popularization and application are limited. It is necessary to develop an insect situation forecast lamp with diversified functions.
6. Conclusions and Future Scope
6.1. Conclusions
6.2. Future Scope
- (1)
- Sustainable and intelligent pest identification and control in PA;
- (2)
- Green intelligent biological control technology in PA;
- (3)
- Green intelligent ecological control technology in PA;
- (4)
- Scientific breeding and quality control technology in PA;
- (5)
- Green smart and scientific pesticide application technology in PA;
- (6)
- Intelligent weather disaster prevention technology in PA.
Author Contributions
Funding
Data Availability Statement
Conflicts of Interest
References
- Yi, X.; Li, X.; Sheng, B.; Yang, H.; Cao, B.; Xu, P. Impact of Russia–Ukraine Conflict on International Economic and Trade Landscape. Int. Econ. Rev. 2022, 3, 9–37. [Google Scholar]
- Huang, K.; Shu, L.; Li, K.; Yang, F.; Han, G.; Wang, X.; Pearson, S. Photovoltaic Agricultural Internet of Things towards Realizing the Next Generation of Smart Farming. IEEE Access 2020, 8, 76300–76312. [Google Scholar] [CrossRef]
- Photovoltaic Agricultural Greenhouses Benefit Farmers in Zhejiang, E China. Available online: http://www.xinhuanet.com/english/2018-05/27/c_137210458.htm (accessed on 19 January 2023).
- Understanding the Impact of Dual-Use Solar-Agriculture Installations in Massachusetts. Available online: https://www.cns.umass.edu/news-events/news/understanding-impact-dual-use-solar-agriculture-installations-massachusetts (accessed on 19 January 2023).
- Forestry-Photovoltaic Complementarity Project Helps Rural Revitalization in Wujiang. Available online: https://www.sohu.com/a/504949995_120099883 (accessed on 19 January 2023).
- Husbandry-Photovoltaic Complementarity Project Realizes Ecological Enrichment. Available online: http://www.gonghe.gov.cn/html/1808/608571.html (accessed on 19 January 2023).
- In Fishery-Optical Complementarity Project, Power Is Generated above and Fishes Are Raised below. Available online: http://www.nanxunfb.com/xzsm/202003/t20200331_1409046.html (accessed on 19 January 2023).
- The Destruction of Dunhuang Shelterbelt Attracts Attention to Photovoltaic Sand Control and Creates a New “Oasis” in the Desert. Available online: https://www.origin-se.com/newsinfo/1128819.html (accessed on 19 January 2023).
- Chen, J.; Wang, L. The Development Stage and Regional Distribution of Photovoltaic Agriculture in China. J. Anhui Agric. Sci. 2022, 50, 246–249. [Google Scholar]
- Wang, L.; Li, Y. Research on Niche Improvement Path of Photovoltaic Agriculture in China. Int. J. Environ. Res. Public Health 2022, 19, 13087. [Google Scholar] [CrossRef]
- Fu, X.; Niu, H. Key Technologies and Applications of Agricultural Energy Internet for Agricultural Planting and Fisheries Industry. Inf. Process. Agric. 2022. [Google Scholar] [CrossRef]
- Wang, Y.; Wei, X. Advance on the Effects of Different Light Environments on Growth, Physiological Biochemistry and morphostructure of Plant. J. Mt. Agric. Biol. 2010, 29, 353–359. [Google Scholar]
- Touil, S.; Richa, A.; Fizir, M.; Bingwa, B. Shading Effect of Photovoltaic Panels on Horticulture Crops Production: A Mini Review. Rev. Environ. Sci. Bio/Technol. 2021, 20, 281–296. [Google Scholar] [CrossRef]
- Cho, J.; Park, S.M.; Park, A.R.; Lee, O.C.; Nam, G.; Ra, I.-H. Application of Photovoltaic Systems for Agriculture A Study on the Relationship between Power Generation and Farming for the Improvement of Photovoltaic Applications in Agriculture. Energies 2020, 13, 4815. [Google Scholar] [CrossRef]
- Si, Z.; Yang, M.; Yu, Y.; Ding, T. Photovoltaic Power Forecast Based on Satellite Images Considering Effects of Solar Position. Appl. Energy 2021, 302, 117514. [Google Scholar] [CrossRef]
- Gorjian, S.; Bousi, E.; Özdemir, Ö.E.; Trommsdorff, M.; Kumar, N.M.; Anand, A.; Kant, K.; Chopra, S.S. Progress and Challenges of Crop Production and Electricity Generation in Agrivoltaic Systems using Semi-transparent Photovoltaic Technology. Renew. Sustain. Energy Rev. 2022, 158, 112126. [Google Scholar] [CrossRef]
- Jiang, H. Forecast of Development Trend of PV Power Generation Technologies in the Future. Sol. Energy 2022, 1, 5–13. [Google Scholar]
- Wang, Q.; Sun, Y.; Zhang, H.; Ru, J.; Jiang, H. Review of China Photovoltaic Industry in 2021 and Prospect in 2022. Electr. Age 2022, 5, 20–28. [Google Scholar]
- Notice on Land Utilization Control Index of Photovoltaic Power Station Project from Ministry of Natural Resources of the People’s Republic of China. Available online: http://f.mnr.gov.cn/201703/t20170329_1447083.html (accessed on 19 January 2023).
- Opinions on Supporting Photovoltaic Poverty Alleviation and Standardizing Land Utilization of Photovoltaic Power Generation Industry. Available online: http://f.mnr.gov.cn/201710/t20171010_1609304.html (accessed on 19 January 2023).
- Wu, C.; Su, Z.; Liu, H.; Zhao, W.; Yu, H. Eco-hydrological Effects of Photovoltaic Power Generation Facilities on Dryland Ecosystems: A Review. Plateau Meteorol. 2021, 40, 690–701. [Google Scholar]
- Gao, M.; Tian, Z.; Gao, F.; Tan, H.; Mu, N.; Wang, J.; Zhao, Z. Research on “Photovoltaic+Agriculture” Development Model of Saline-alkaline Land in Western Jilin Province. Anhui Agric. Sci. Bull. 2019, 25, 156–158. [Google Scholar]
- Huang, K.; Shu, L. Grand Challenges in Sustainable and Intelligent Phytoprotection. Front. Plant Sci. 2021, 12, 2513. [Google Scholar] [CrossRef] [PubMed]
- Wang, H. Smart phytoprotection and suggestions for its development. J. China Agric. Univ. 2022, 27, 1–21. [Google Scholar]
- Photovoltaic Agriculture: Turning Saline-alkaline Land into “Jinshan Yinshan”. Available online: https://new.qq.com/rain/a/20220916A06OOM00 (accessed on 19 January 2023).
- Li, K.; Shu, L.; Huang, K.; Sun, Y.; Yang, F.; Zhang, Y.; Huo, Z.; Wang, Y.; Wang, X.; Lu, Q.; et al. Research and Prospect of Solar Insecticidal Lamps Internet of Things. Smart Agric. 2019, 1, 13–28. [Google Scholar]
- Huang, K.; Li, K.; Shu, L.; Yang, X.; Gordon, T.; Wang, X. High Voltage Discharge Exhibits Severe Effect on ZigBee-based Device in Solar Insecticidal Lamps Internet of Things. IEEE Wirel. Commun. 2020, 27, 140–145. [Google Scholar] [CrossRef]
- Bauer, J.; Aschenbruck, N. Towards a Low-cost RSSI-based crop monitoring. ACM Trans. Internet Things 2020, 1, 1–26. [Google Scholar] [CrossRef]
- Batista, N.C.; Melício, R.; Matias, J.C.O.; Catalão, J.P.S. Photovoltaic and Wind Energy Systems Monitoring and Building Home Energy Management using ZigBee Devices within a Smart Grid. Energy 2013, 49, 306–315. [Google Scholar] [CrossRef]
- Zhu, B.; Leskarac, D.; Lu, J.; Wishart, M. Electromagnetic Interference Investigation of Solar PV System for Microgrid Structure. In Proceedings of the 7th Asia Pacific International Symposium on Electromagnetic Compatibility, Shenzhen, China, 17–21 May 2016. [Google Scholar]
- Toledo, C.; Serrano-Lujan, L.; Abad, J.; Lampitelli, A.; Urbina, A. Measurement of Thermal and Electrical Parameters in Photovoltaic Systems for Predictive and Cross-Correlated Monitorization. Energies 2019, 12, 668. [Google Scholar] [CrossRef] [Green Version]
- Yang, F.; Shu, L.; Huang, K.; Li, K.; Han, G.; Liu, Y. A Partition-Based Node Deployment Strategy in Solar Insecticidal Lamps Internet of Things. IEEE Internet Things J. 2020, 7, 11223–11237. [Google Scholar] [CrossRef]
- Yang, F.; Shu, L.; Yang, Y.; Liu, Y.; Gordon, T. Improved Coverage and Connectivity via Weighted Node Deployment in Solar Insecticidal Lamp Internet of Things. IEEE Internet Things J. 2021, 8, 10170–10186. [Google Scholar] [CrossRef]
- Yang, F.; Shu, L.; Yang, Y.; Han, G.; Pearson, S.; Li, K. Optimal Deployment of Solar Insecticidal Lamps over Constrained Locations in Mixed-Crop Farmlands. IEEE Internet Things J. 2021, 8, 13095–13114. [Google Scholar] [CrossRef]
- Irwin, A. The dark side of light: How artificial lighting is harming the natural world. Nature 2018, 553, 268–270. [Google Scholar] [CrossRef] [PubMed] [Green Version]
- Yao, H.; Shu, L.; Yang, F.; Jin, Y.; Yang, Y. The phototactic rhythm of pests for the Solar Insecticidal Lamp: A review. Front. Plant Sci. 2022, 13, 1018711. [Google Scholar] [CrossRef] [PubMed]
- He, J.; Wan, G.; Zhang, M.; Pan, W.; Chen, F. Progress in The Study of Giomagnetic Responses of Organisms. Prog. Biochem. Biophys. 2018, 45, 689–704. [Google Scholar]
- Kenli District People’s Government. Announcement of Kenli District Branch of Dongying Ecological Environment Bureau on the Approval of the Environmental Impact Assessment Documents of Construction Projects on April 30, 2021. Available online: http://www.kenli.gov.cn/art/2021/4/30/art_172734_10291476 (accessed on 24 February 2023).
- Zhang, M.; Liu, R.; He, J.; Yuan, R.; Wan, G.; Pan, W.; Chen, F. Wing-form differentiation, phototaxis and flight performance of the brown planthopper, Nilaparvata lugens (Hemiptera: Delphacidae) under near-zero magnetic fields. Acta Entomol. Sin. 2019, 62, 82–90. [Google Scholar]
- He, J.; Zhang, M.; Liu, R.; Wan, G.; Pan, W.; Chen, F. Effects of the Interference of Key Magnetic Response Genes on the Longevity of Brown Planthopper (Nilaparvata lugens) Under Near-Zero Magnetic Field. Sci. Agric. Sin. 2019, 52, 45–55. [Google Scholar]
- Wan, G.; Yuan, R.; Wang, W.; Fu, K.; Zhao, J.; Jiang, S.; Pan, W.; Sword, G.A.; Chen, F. Reduced geomagnetic field may affect positive phototaxis and flight capacity of a migratory rice planthopper. Anim. Behav. 2016, 121, 107–116. [Google Scholar] [CrossRef]
- Sun, Y.; Ding, W.; Shu, L.; Li, K.; Zhang, Y.; Zhou, Z.; Han, G. On Enabling Mobile Crowd Sensing for Data Collection in Smart Agriculture: A Vision. IEEE Syst. J. 2021, 16, 132–143. [Google Scholar] [CrossRef]
- Sun, Y.; Nurellari, E.; Ding, W.; Shu, L.; Huo, Z. A Partition-Based Mobile-Crowdsensing-Enabled Task Allocation for Solar Insecticidal Lamp Internet of Things Maintenance. IEEE Internet Things J. 2022, 9, 20547–20560. [Google Scholar] [CrossRef]
- Yang, X.; Shu, L.; Huang, K.; Li, K.; Huo, Z.; Wang, Y.; Wang, X.; Lu, Q.; Zhang, Y. Characteristics Analysis and Challenges for Fault Diagnosis in Solar Insecticidal Lamps Internet of Things. Smart Agric. 2020, 2, 11–27. [Google Scholar]
- Yang, X.; Shu, L.; Li, K.; Huo, Z.; Shu, S.; Nurellari, E. SILOS: An Intelligent Fault Detection Scheme for Solar Insecticidal Lamp IoTs with Improved Energy Efficiency. IEEE Internet Things J. 2022, 10, 920–939. [Google Scholar] [CrossRef]
- Yang, X.; Shu, L.; Li, K.; Huo, Z.; Zhang, Y. SA1D-CNN: A Separable and Attention Based Lightweight Sensor Fault Diagnosis Method for Solar Insecticidal Lamp Internet of Things. IEEE Open J. Ind. Electron. Soc. 2022, 3, 291–303. [Google Scholar] [CrossRef]
- Huang, K.; Shu, L.; Li, K.; Yang, X.; Zhu, Y.; Wang, X.; Su, Q. Design and Prospect of Anti-theft and Anti-destruction of Nodes in Solar Insecticidal Lamps Internet of Things. Smart Agric. 2021, 3, 129–143. [Google Scholar]
- Si, P.; Fu, Z.; Shu, L.; Yang, Y.; Huang, K.; Liu, Y. Target-Barrier Coverage Improvement in an Insecticidal Lamps Internet of UAVs. IEEE Trans. Veh. Technol. 2022, 71, 4373–4382. [Google Scholar] [CrossRef]


| No | Sending Node Position | Receiving Node Position | Distance between Two Nodes/m |
|---|---|---|---|
| 1 | (−15.0, 46.0) | (−36.6, 46.0) | 21.60 |
| 2 | (−15.0, 46.0) | (−39.6, 46.0) | 24.60 |
| 3 | (−15.0, 46.0) | (−42.6, 46.0) | 27.60 |
| 4 | (−15.0, 46.0) | (−39.6, 46.0) | 24.60 |
| 5 | (−15.0, 56.7) | (−39.6, 56.7) | 24.60 |
| 6 | (−36.6, 46.0) | (−15.0, 46.0) | 24.60 |
| 7 | (−39.6, 46.0) | (−15.0, 46.0) | 24.60 |
| 8 | (−42.6, 46.0) | (−15.0, 46.0) | 27.60 |
| 9 | (−42.6, 56.2) | (−15.0, 56.2) | 27.60 |
| No | Sending Node Position | Receiving Node Position | Distance between Two Nodes/m |
|---|---|---|---|
| 1 | (0, 25.0) | (−33.6, 46.0) | 39.62 |
| 2 | (0, 25.0) | (−36.6, 46.0) | 42.20 |
| 3 | (0, 25.0) | (−42.6, 46.0) | 47.49 |
| 4 | (0, 25.0) | (−45.6, 46.0) | 50.20 |
| 5 | (0, 23.0) | (−33.6, 46.0) | 40.72 |
| 6 | (0, 2.5) | (−33.6, 46.0) | 54.97 |
| 7 | (0, 0) | (−33.6, 46.0) | 56.96 |
| 8 | (−33.6, 46.0) | (0, 25.0) | 39.62 |
| 9 | (−33.6, 46.0) | (0, 25.0) | 39.62 |
| 10 | (−42.6, 46.0) | (0, 25.0) | 47.49 |
| 11 | (−45.6, 46.0) | (0, 25.0) | 50.20 |
| 12 | (−45.6, 46.0) | (0, 23.0) | 51.07 |
| 13 | (−45.6, 46.0) | (0, 2.5) | 63.02 |
| 14 | (−45.6, 46.0) | (0, 0) | 64.77 |
Disclaimer/Publisher’s Note: The statements, opinions and data contained in all publications are solely those of the individual author(s) and contributor(s) and not of MDPI and/or the editor(s). MDPI and/or the editor(s) disclaim responsibility for any injury to people or property resulting from any ideas, methods, instructions or products referred to in the content. |
© 2023 by the authors. Licensee MDPI, Basel, Switzerland. This article is an open access article distributed under the terms and conditions of the Creative Commons Attribution (CC BY) license (https://creativecommons.org/licenses/by/4.0/).
Share and Cite
Huang, K.; Shu, L.; Li, K.; Chen, Y.; Zhu, Y.; Valluru, R. Sustainable and Intelligent Phytoprotection in Photovoltaic Agriculture: New Challenges and Opportunities. Electronics 2023, 12, 1221. https://doi.org/10.3390/electronics12051221
Huang K, Shu L, Li K, Chen Y, Zhu Y, Valluru R. Sustainable and Intelligent Phytoprotection in Photovoltaic Agriculture: New Challenges and Opportunities. Electronics. 2023; 12(5):1221. https://doi.org/10.3390/electronics12051221
Chicago/Turabian StyleHuang, Kai, Lei Shu, Kailiang Li, Yuejie Chen, Yan Zhu, and Ravi Valluru. 2023. "Sustainable and Intelligent Phytoprotection in Photovoltaic Agriculture: New Challenges and Opportunities" Electronics 12, no. 5: 1221. https://doi.org/10.3390/electronics12051221