1. Introduction
Due to the vigorous development of connectomics research, it is possible to produce high-resolution and high-magnification electronic microscope (Electronic Microscopy, EM) images, allowing scientists and biologists to perform nanoscale imaging. Subsequently, it is essential to identify and study cellular organelles, such as vesicles or mitochondria, etc., in particular, the observation and analysis of the state and structure of mitochondria. In definition, the mitochondria are called the power plants of cells. They synthesize adenosine triphosphate to make cells the primary source of chemical energy for activities. They play a pivotal role in the cell, and mitochondrial morphology and its malfunction usually lead to the disorder of their function and distribution [
1].
Because the changes in mitochondrial morphology are related to neurodegeneration, calcium signaling, and cell death, the change and regulation of their shape are significant to cell physiology. This also proves that relative changes in the morphology of mitochondria are also very important in the immune system [
2]. In addition, mitochondria are also closely related to cancer [
3,
4,
5]. The mitochondria in cancer cells can resist the life cycle of general apoptosis. These have also led to many related cancer treatment studies that stimulate the mitochondria of cancer cells. The membrane’s permeability may change the mitochondrial metabolism of cancer cells to allow cancer cells to die [
6]. Mitochondria are also very important in clinical research. In addition to the cancers mentioned above, their size, number, and shape are also closely related to other serious diseases, such as bipolar disorder [
7], diabetes [
8], Parkinson’s disease [
9], and Alzheimer’s disease [
10]. The upper mitochondria are related to other serious diseases, so academic and clinical research on the mitochondrial shape and state in the cell has received considerable attention. The above factors make distinguishing and analyzing mitochondria a critical task. However, the noise on EM images is due to mitochondrial morphology and structure variability. Other subcellular structures similar to mitochondrial structure exist; thus, cutting and reconstructing mitochondria on EM images is also challenging.
Because of the recent advancement in electron microscope technology, imaging can be expanded significantly, and the leading development is in capturing 3D information. The difference between a scanning electron microscope (SEM) and an optical microscope is that the optical microscope uses visible light for imaging, while the electron microscope is formed by the interaction of an electron beam light source and an electromagnetic field and collects secondary electrons and backscattering after electrons hit the object. The electrons are then analyzed and imaged. After forming a series of 2D EM images, they are realigned and merged in order to obtain the 3D reconstructed EM images. It is mentioned in [
11] that FIB-SEM works similarly to SEM, except that the ions that strike the sample are different. To more accurately show the state of cell interaction, FIB-SEM with excellent resolution is used. FIB-SEM has been used to detect the number of viruses in cells and some delicate membranous structures, such as filopodia (Filopodia), and it is also known that viruses can use these structures to transfer from one cell to another. Therefore, if FIB-SEM imaging can provide excellent 3D resolution of more than thousands of cubic microns, it can quickly solve the problem of ultra-small structures such as cells or viruses [
11].
2. Related Work
With the advancement of Electron Microscopy (EM) technology, neuroscientists can study the functions of various organelles in various cells, such as mitochondria, endoplasmic reticulum, etc., at high magnification. Using human resources to analyze mitochondria in electron microscope imaging and estimating the number of mitochondria is time-consuming and expensive. To resolve this issue, many studies use specially designed manual features (Hand-crafted) [
12,
13] to cut mitochondria. These features are usually trained with machine learning algorithms to achieve better results [
14,
15,
16]. Techniques such as Random Forest and Conditional Random Field are commonly used. In recent years, the process can be completely automated because of the emergence of Fully Convolutional Neural Networks (FCN).
The idea is to build a more profound and broader neural network to solve challenging biomedical image-cutting problems. The most widely used model is U-Net, a typical FCN architecture. Using encoder–decoder and by adding a shortcut connection, the feature map of the corresponding scale of each layer can be extracted. After that, it is integrated with the up-sampling result to compensate for the spatial information lost due to the down-sampling operation. The current studies on EM’s mitochondrial cutting tasks that perform well [
10,
17] are based on the U-Net architecture, and its 3D (three-dimensional) variant U-Net is used for enhanced results.
Given a volume image dataset, the 2D convolutional neural network processes each slice one by one. Although the calculation efficiency is high, the 2D cutting network usually cannot achieve competitive results because it completely ignores the correlation between each slice. In contrast, using a 3D convolutional neural network can obtain a more comprehensive view during 2D training using the information of the full-space front and rear slices. In addition, pre-processing methods are often used in biomedical images, including cutting out glands from histology images (Glands) and cutting out nerve cells from electron microscope images, etc. Examples of the cutting methods used in cutting electron microscope imaging have achieved good results. However, the mitochondrial data integration method used in the experiment of this study is the same as the nerve cells, as mentioned earlier. These images are from an electron microscope, but compared with the example of neuron cell cutting, each mitochondria has a different length and thickness. Generally, the cutting method of neuron cells produces wrong results in the case of mitochondria, which are sparse and similar in appearance [
18,
19]. Work [
20] divides the mitochondrial instance cutting task into two methods. The first is the top-down method, in which the 2D image is passed through the object detector, and the object with the high bounding box is selected.
Further, the cutting results are obtained by point-by-point classification for these bounding boxes, which is then combined with post-processing, e.g., connected component algorithm or graph-based watershed algorithm. The final objective is to achieve the instance segmentation of each mitochondria. The second approach is based on the bottom-up method, which uses the 2D CNN or 3D CNN to predict its edge-cutting. A contour or binary segmentation mask is combined with the post-processing steps, such as connected component or graph-based watershed algorithms. These steps mainly improvise the overall instance segmentation of the mitochondria.
2.1. Top-down Approaches
The commonly used object detector in the top-down approach is built on the 2D Mask R-CNN architecture [
21]. Initially, object detection is performed, and based on the bounding box information, the segmentation model focuses on targeting the mitochondria regions. Generally, the model detects and cuts the region in all the directions of the bounding box regions, and the detected outline can cover the mitochondria region. However, the major problem with 2D Mask R-CNN is that there is no 3D connectivity information, which causes the mitochondria in some slices to be easily missed. The narrow and long characteristics of mitochondria often create incomplete results, mainly due to insufficient receptive fields.
Another top-down method [
22] aims to increase the amplification direction of its visibility so that the mitochondrial contour can be detected with high accuracy. In addition to the R-CNN architecture, a recursive cutting subnet is also used. The method returns the output result to the input to further refine the results, which is also used in the proposed technique.
2.2. Bottom-up Approaches
To conduct a bottom-up approach, a new dataset termed Lucchi++ [
23] is proposed, which comes with the improved label in the original Lucchi dataset [
15]. The approach performs cutting on every 2D slice, and the 2D U-Net is used as a backbone model. Moreover, the method uses interpolated up-sampling to replace the deconvolution in the classic U-Net architecture to achieve an acceleration effect. In addition, to make up for the lack of 3D connectivity information in 2D cutting, the z-filtering post-processing is used to obtain 3D information, which can significantly improve the cutting results.
Subsequent bottom-up approaches are mainly based on three-dimensional information. The method [
17] uses a 3D U-Net cutting architecture to achieve excellent performance in medical image cutting, and then uses a deep supervision mechanism to prevent possible gradient vanishing during model training. In addition, to improve the cutting stability and performance, the test-time augmentation method is used. However, no big improvements are made on the model configuration, which can detect the mitochondria through better feature learning. Although the authors have obtained good cutting results with the 3D CNN architecture, misjudgment detection still exists. Moreover, semantic segmentation using adversarial networks is also proposed to learn and predict the higher-order inconsistencies from the ground truth segmentation maps [
24]. However, the segmented image suffers from jagged edges and overfitting problems. In the latest, a new transformer-based architecture for medical segmentation is proposed, termed UNEt TRansformers (UNETR) [
25]. The segmentation network can capture global multiscale information and performs with better accuracy. On the downside, the network requires extensive training and high computational resources.
Considering the above limitations, the proposed work focuses on improving the top-down and three-dimensional bottom-up approaches, taking advantage of both.
3. Proposed Method
This section presents the proposed cascaded two-stage training mechanism for the enhanced segmentation of mitochondria. The section is divided into three subsections. The first subsection details the open-source 3D mitochondrial datasets used for this study. The second subsection covers the limitations of the 2D top-down and 3D bottom-up approaches with illustrations. The final subsection proposes three strategies for performance improvisation, and the optimal method is selected.
3.1. Mitochondria Dataset
For the experimental study and analysis, the publicly available Luchhi++ dataset [
23] is considered, and it contains 3D mitochondrial images. Many works initially focus on the Luchhi dataset [
15], and several issues have been identified. In the method in [
26], while analyzing the large 3D mitochondrial image, some mitochondrial border labels are found to be not consistent. Another method in [
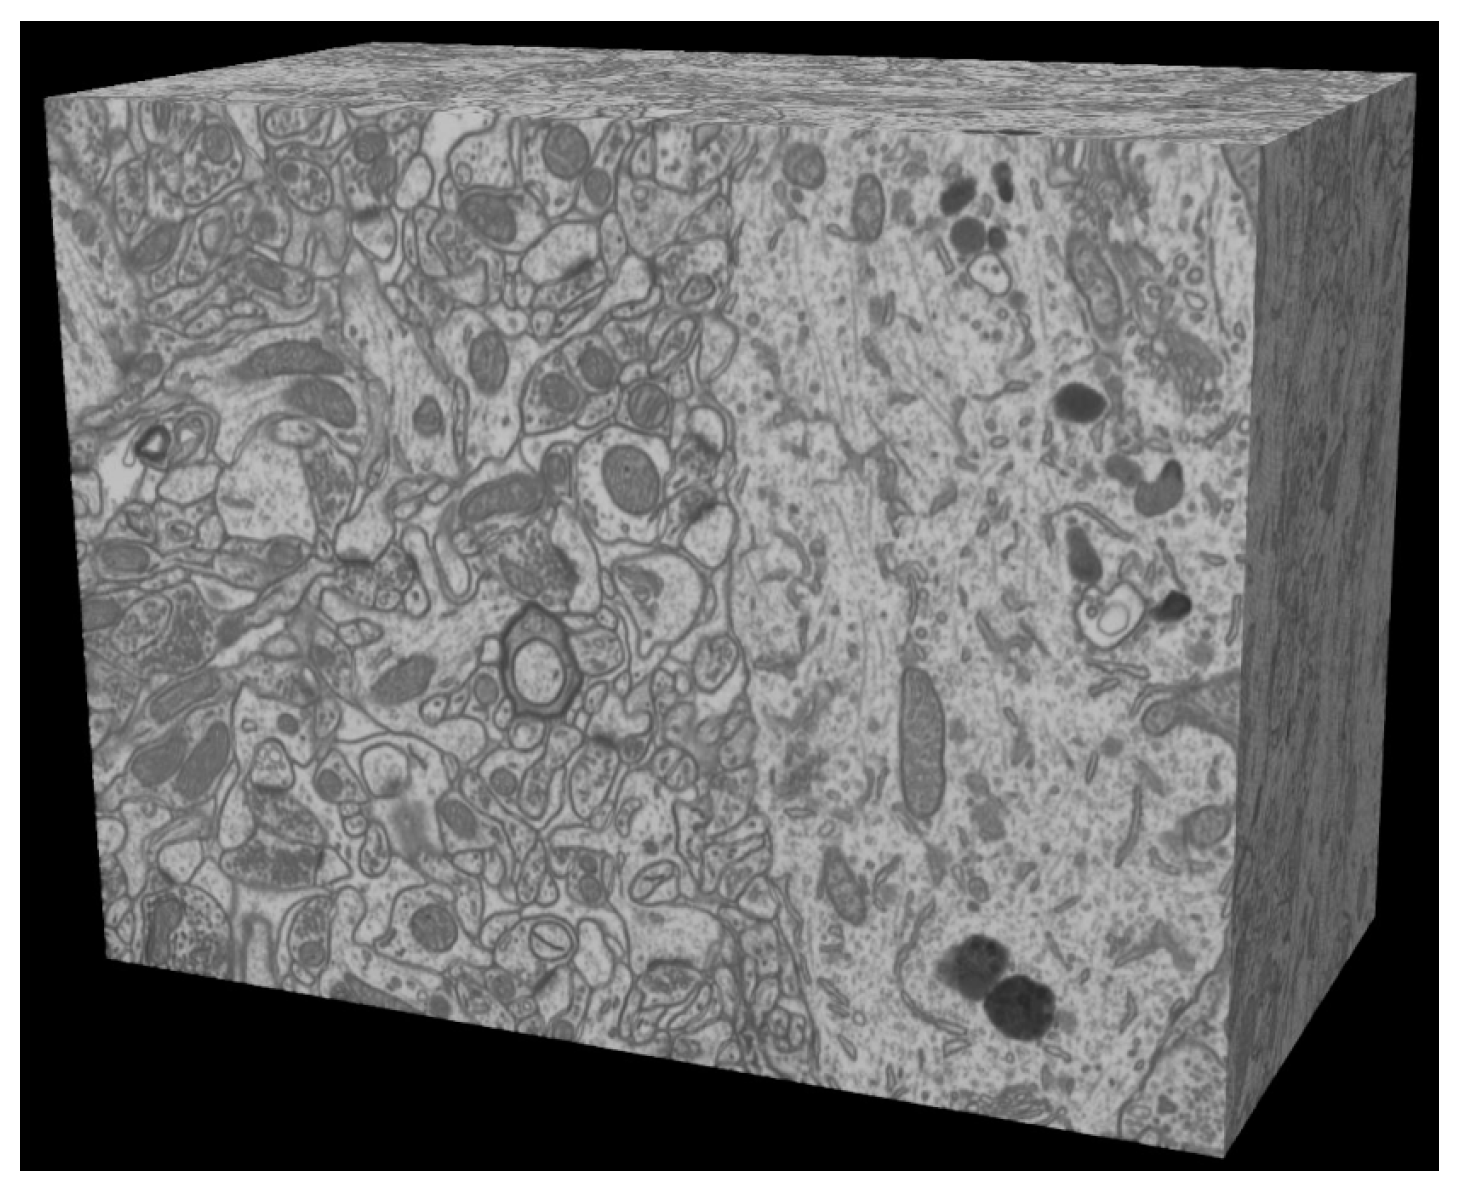
23] also reported some defects in the mitochondrial label, such as wrong classifications and the inconsistency of the membrane on the mitochondria. Subsequently, the Lucchi++ dataset is released with a re-annotated qualitative truth label. Many senior biologists are involved in this modified work to obtain accurate labeling of the mitochondrial membrane. In general, two neuroscientists are asked to correct the correctness separately, and labels are finalized based on mutual agreement. The Luchhi++ dataset is an improved version of the Luchhi dataset, with revised and fine-tuned labels. The dataset is obtained by sampling a small section of hippocampal gyrus cell slices from the mouse brain and using a focused ion beam scanning electron microscope (FIB-SEM) to capture the microscopic details. The initial pixel (Voxel, vx) size is of 5 × 5 × 5 nm scanning imaging. With the final alignment and correction, it is a 3D image of size 2048 × 1536 × 1065 vx, as shown in
Figure 1. However, the manually created mitochondria segmentation is available only for two neighboring image stacks of each 1024 × 768 × 165 vx, and these two sub-sets are commonly used for training and testing to evaluate mitochondria detection algorithms [
10,
17,
23,
27].
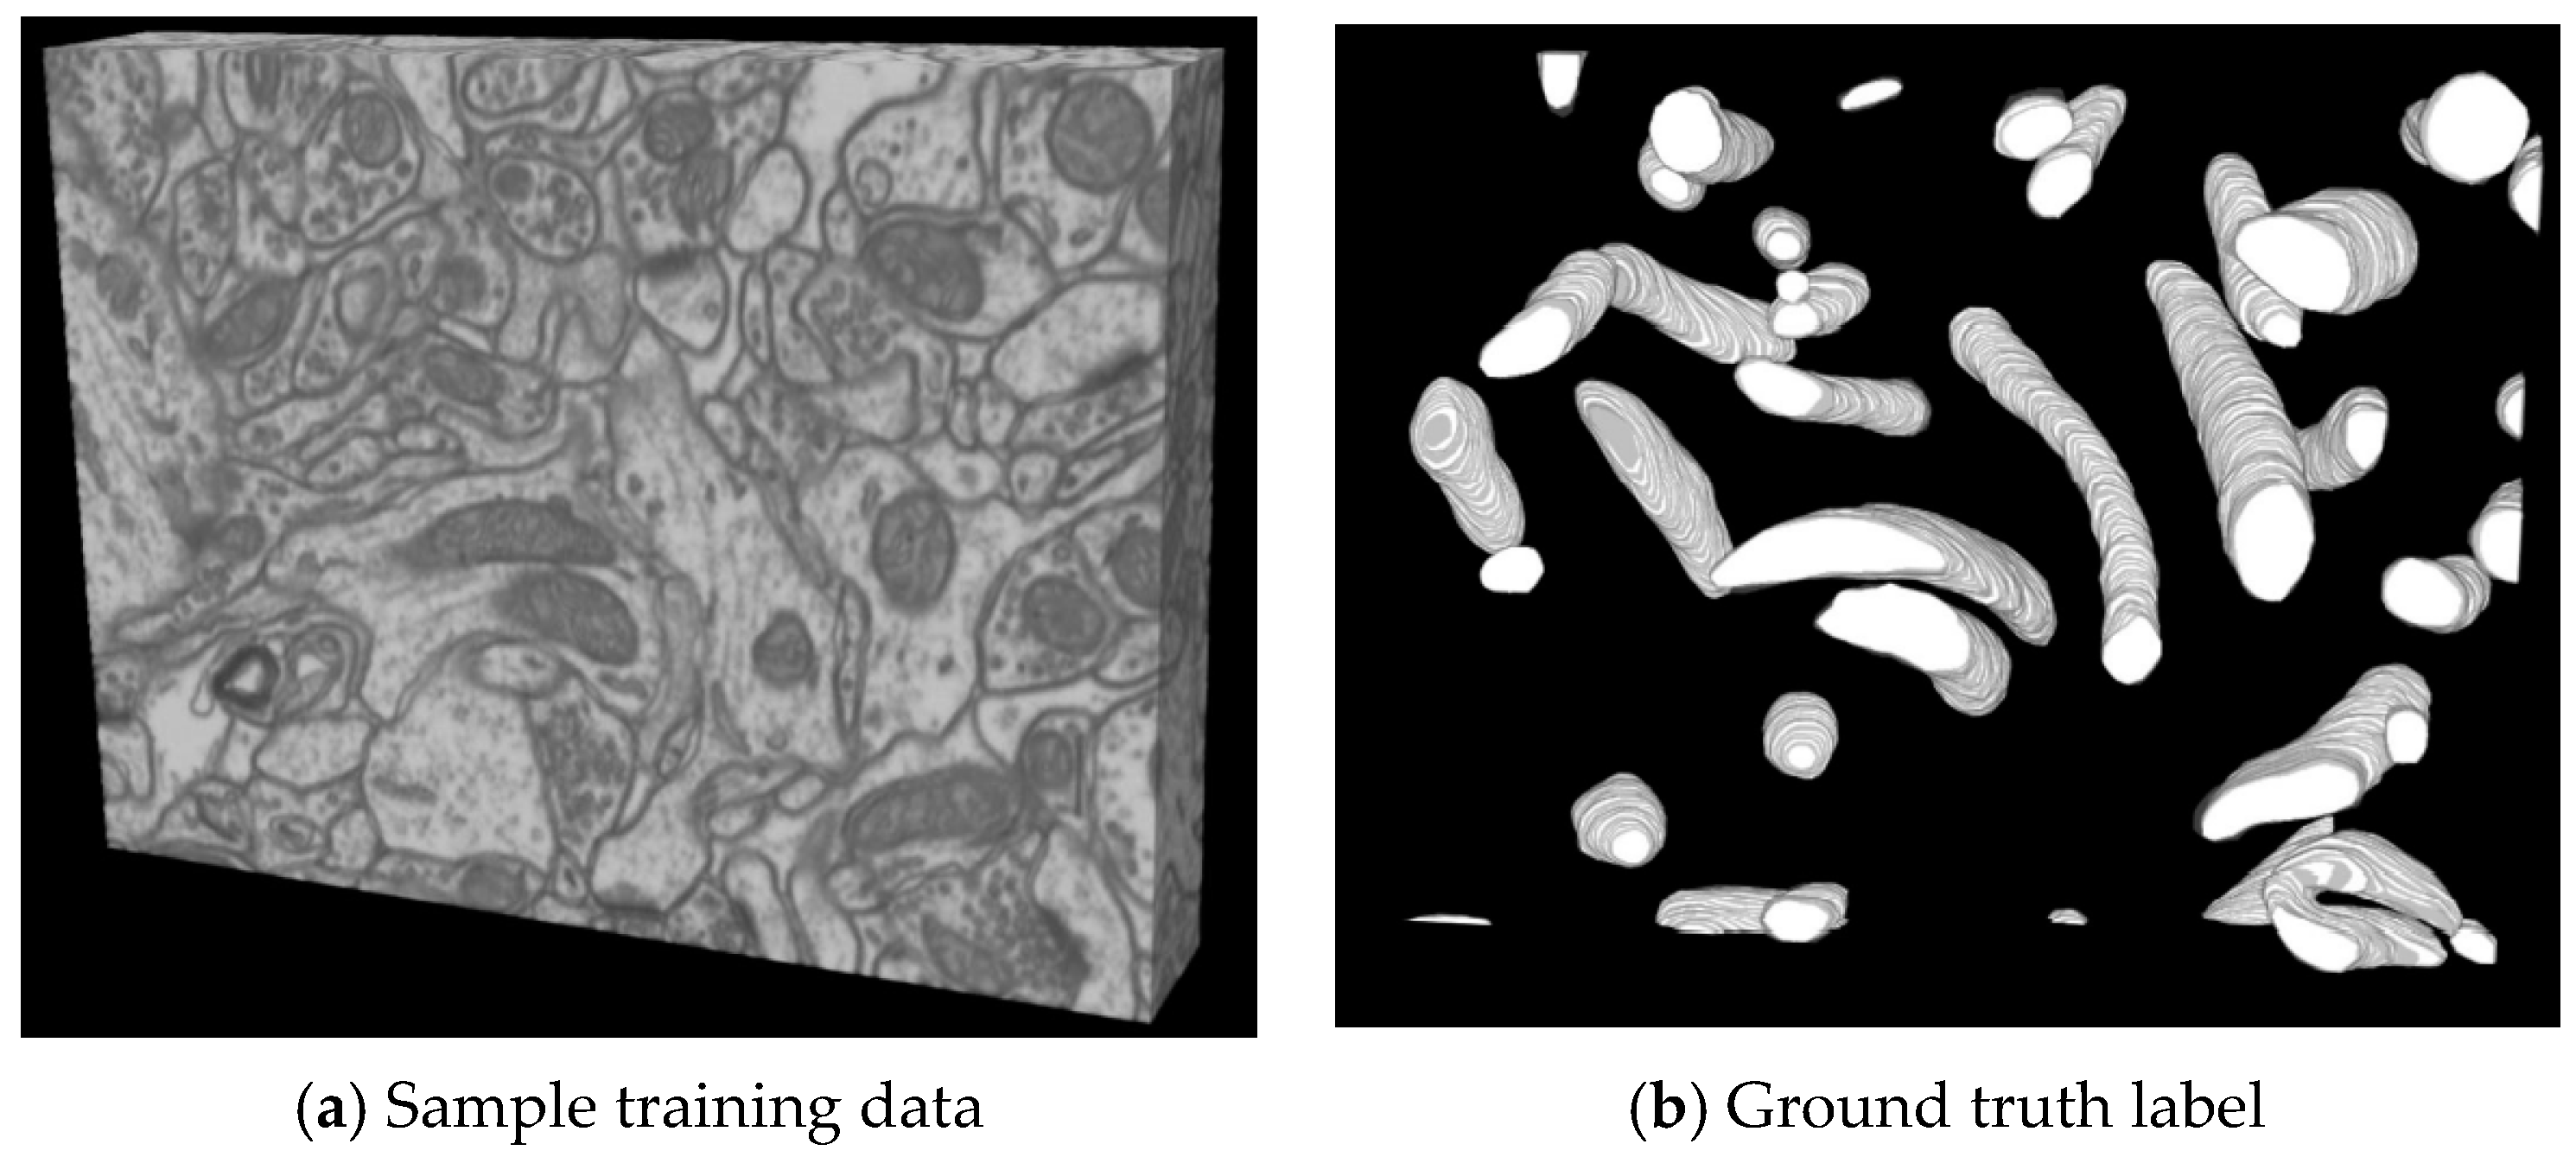
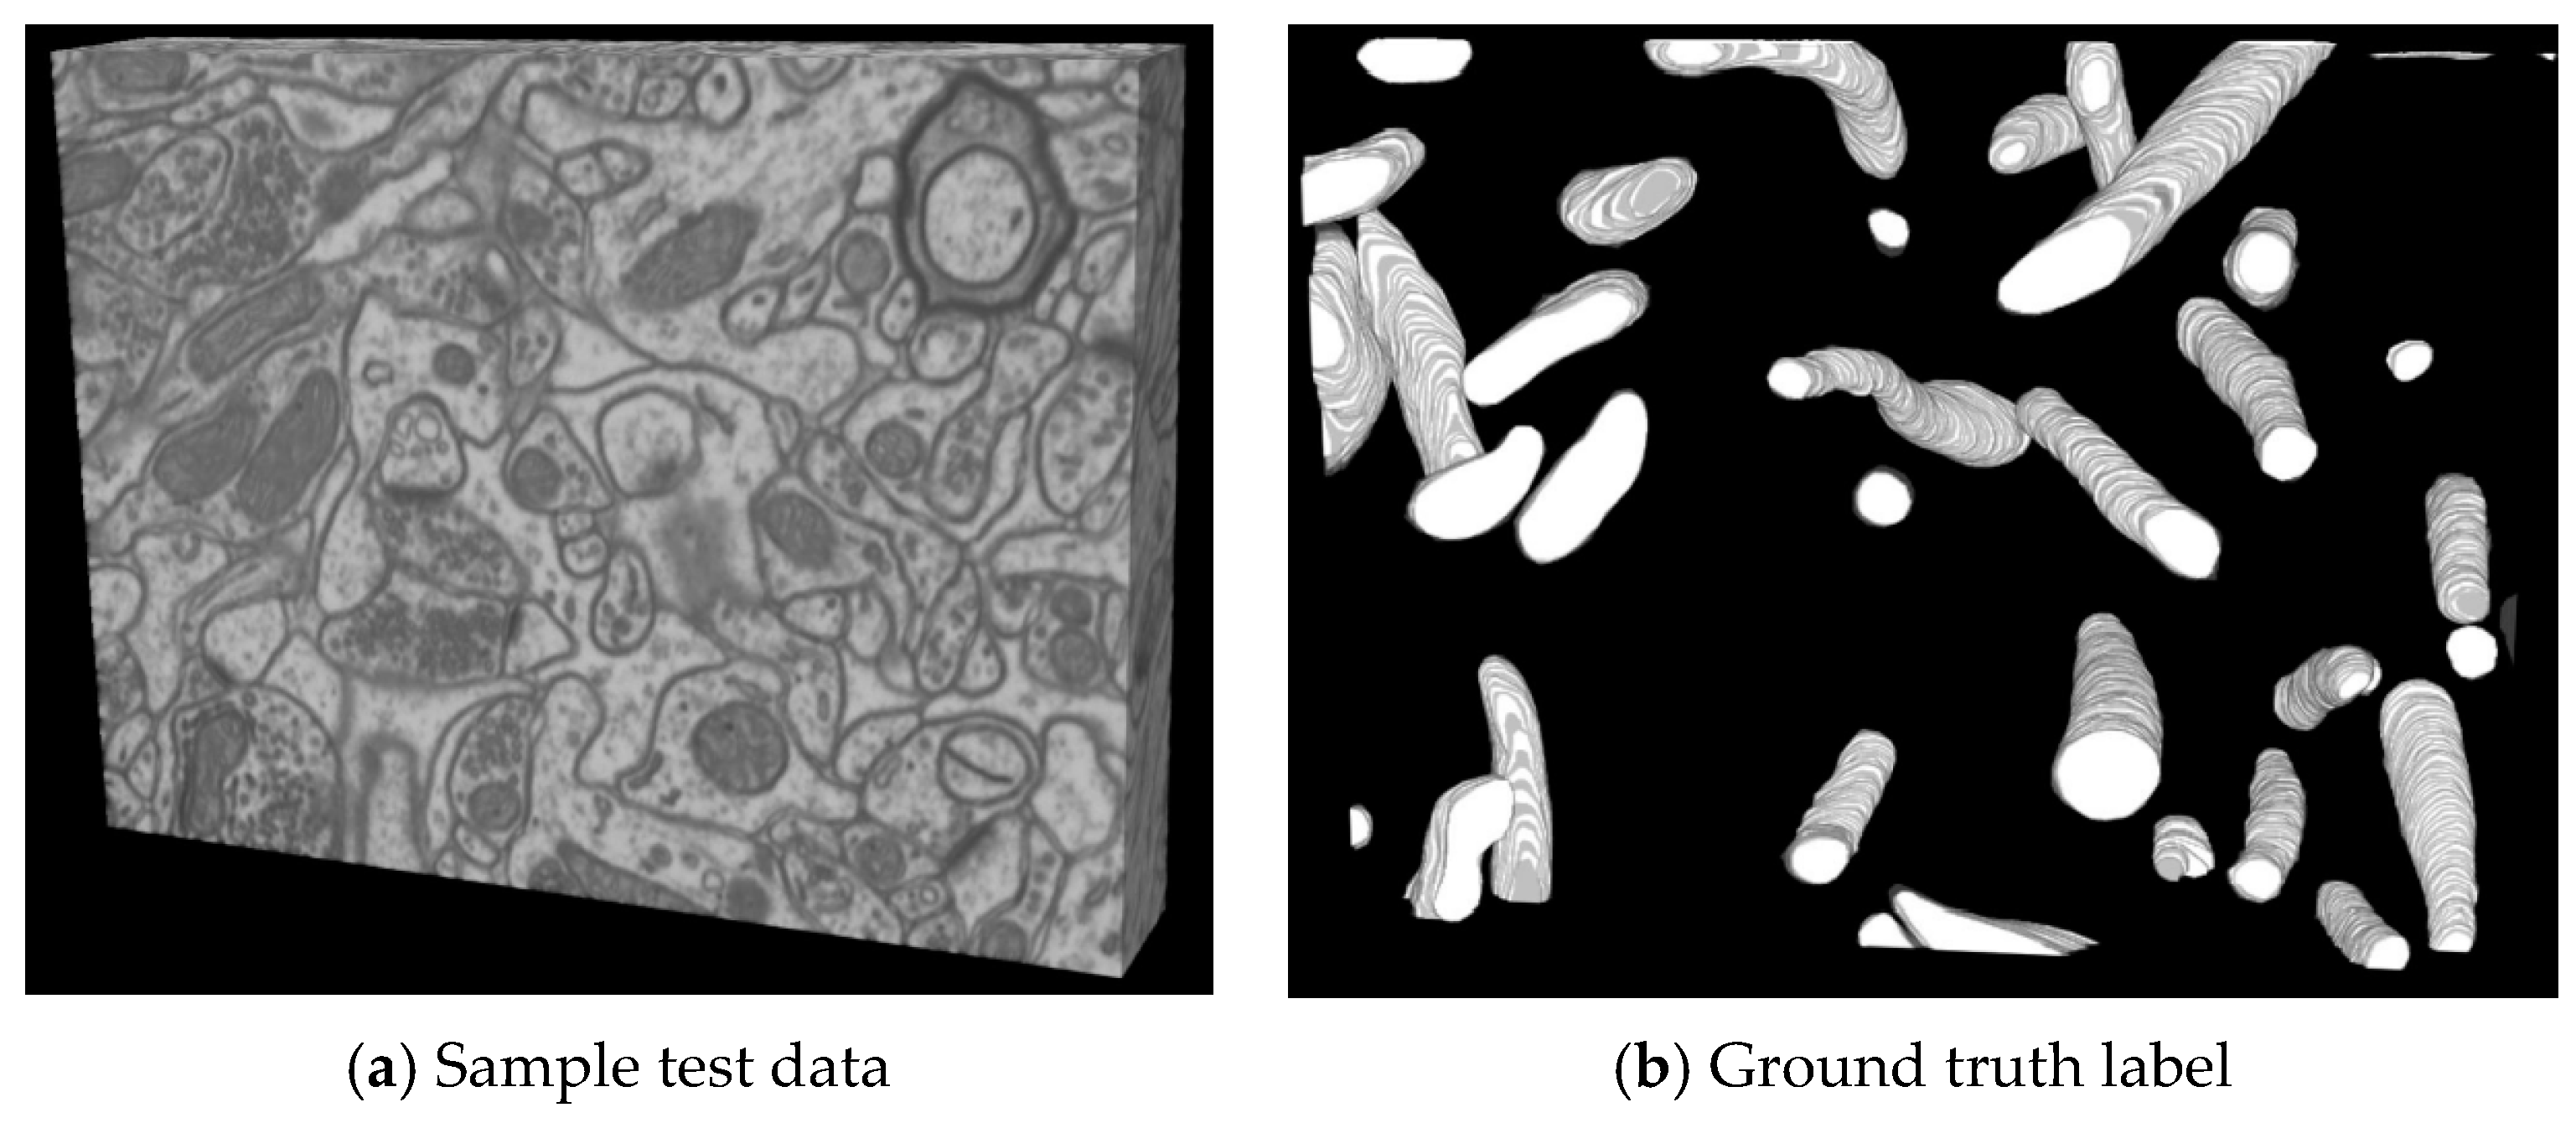
Figure 2 and
Figure 3 show the sample images with their corresponding label from the training and test sets, respectively.
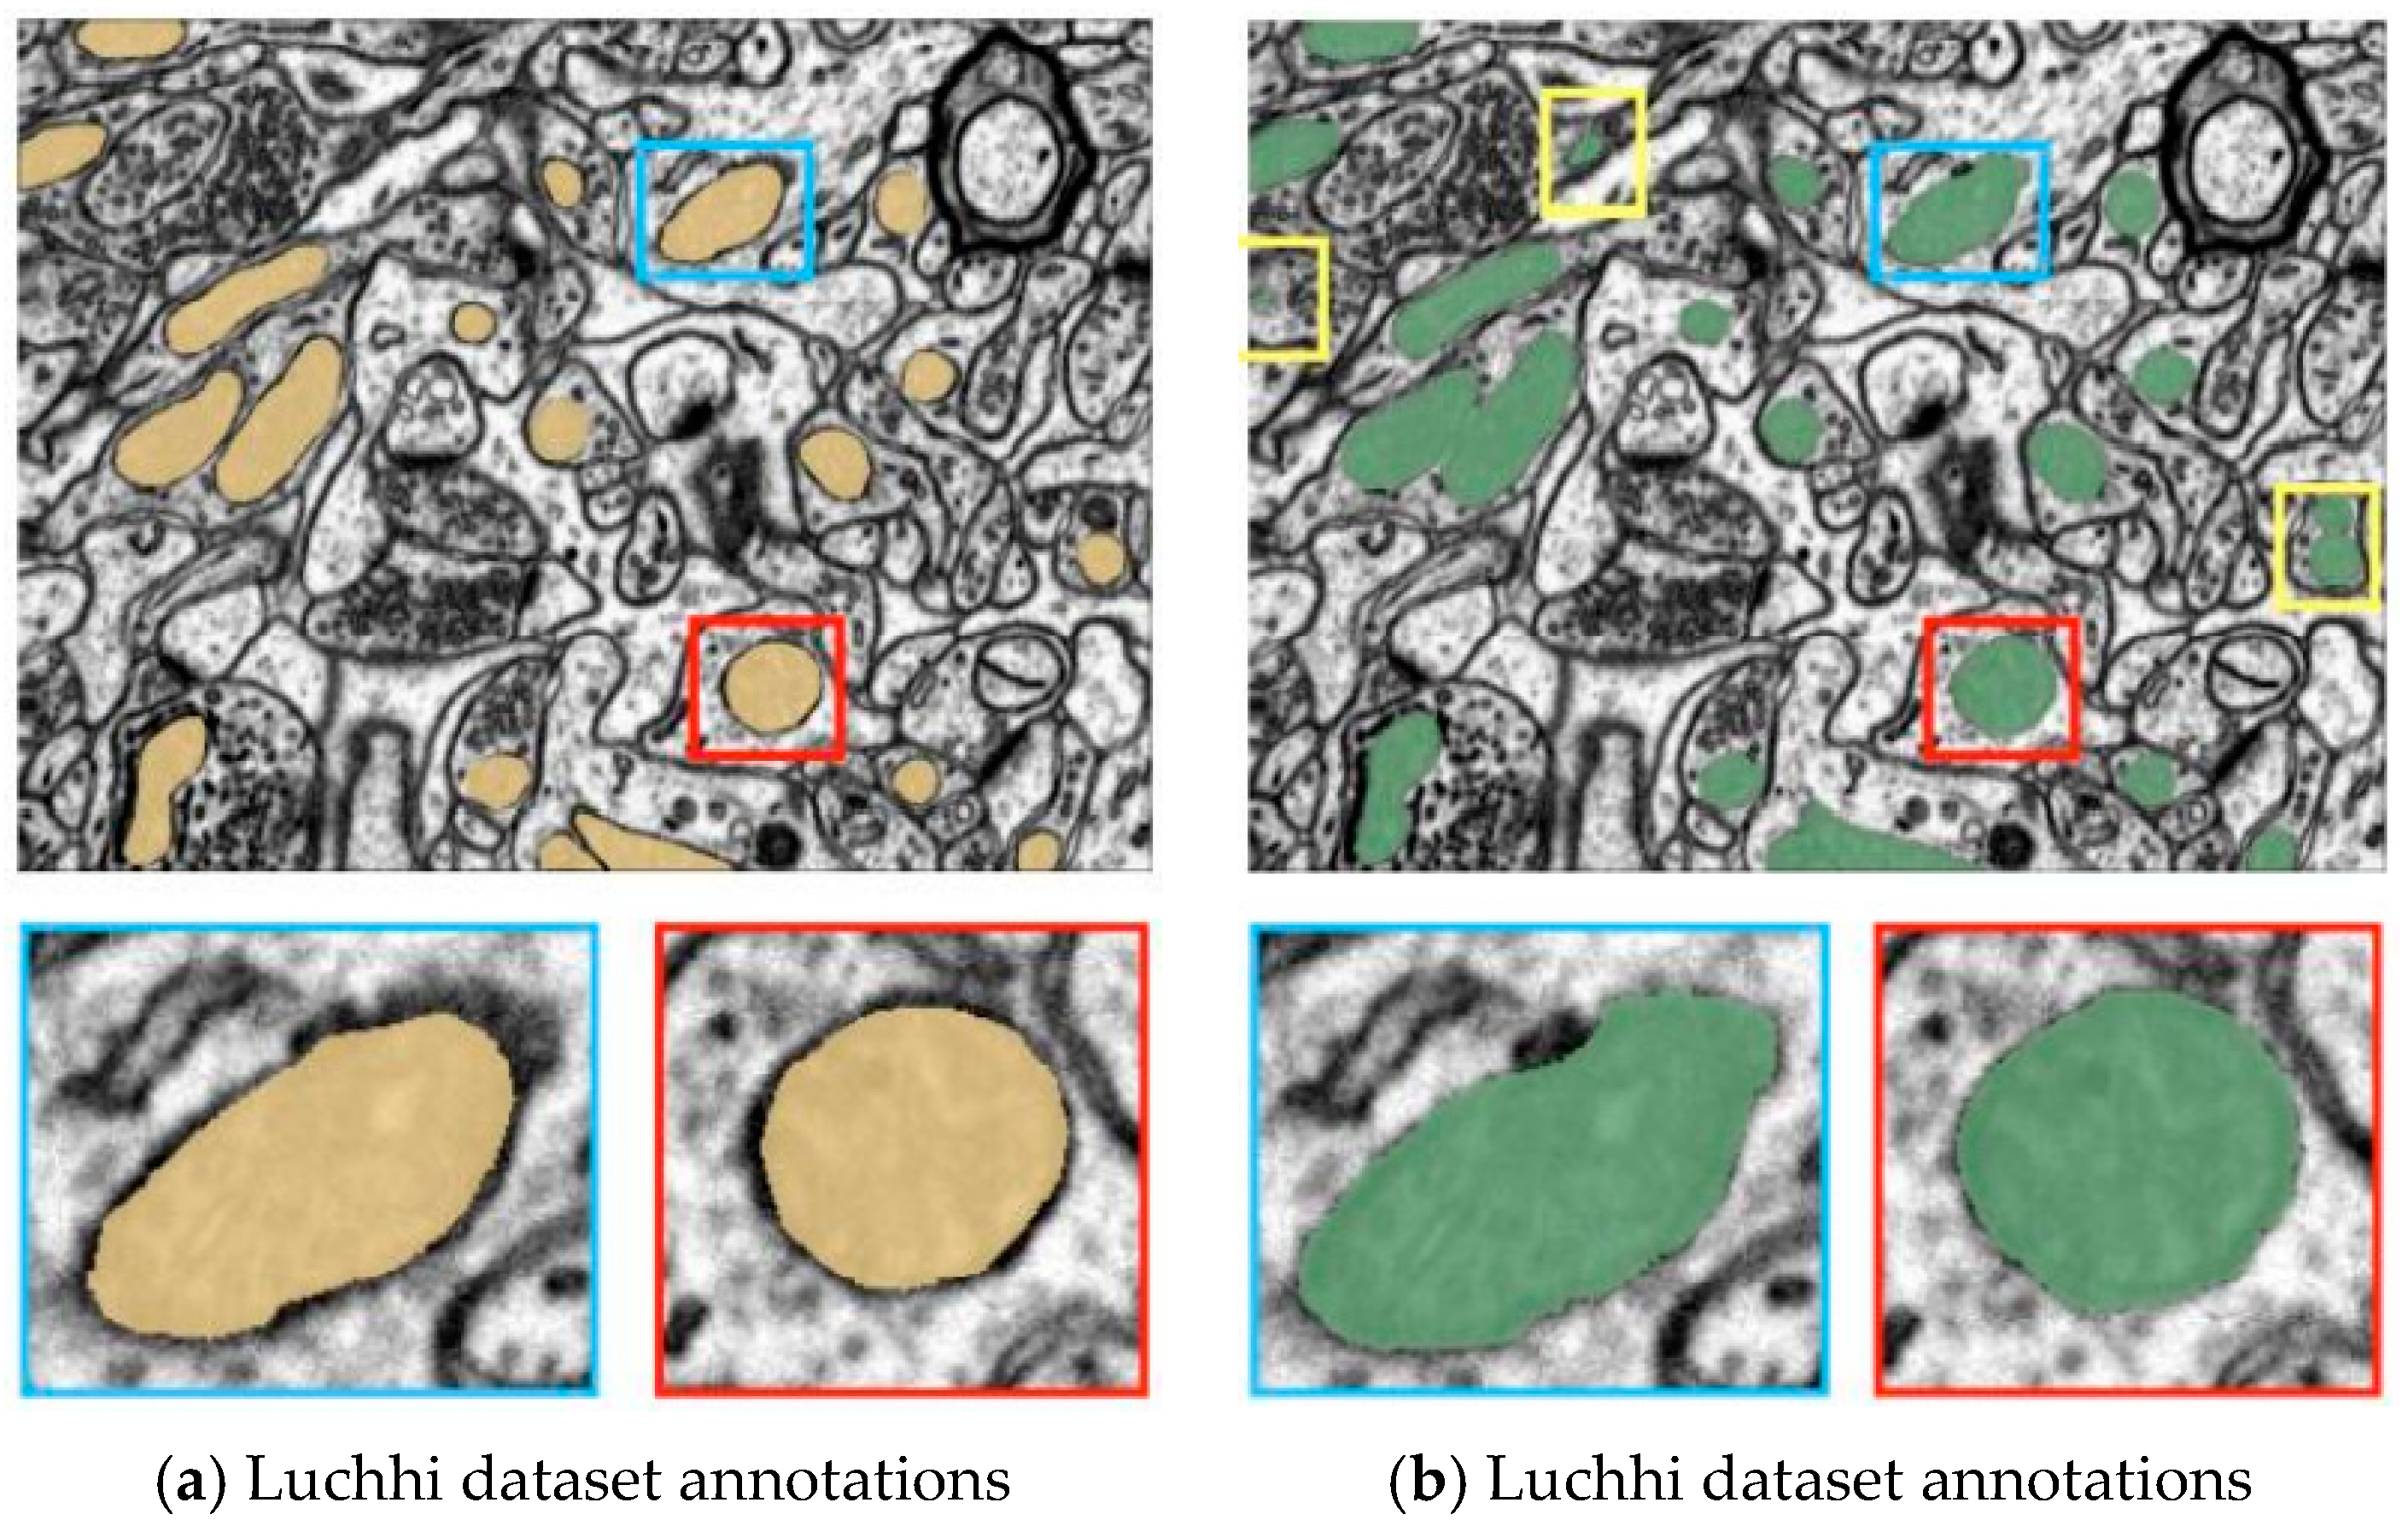
Figure 4a,b show the actual labels of the 2D image of the same slice in the original Luchhi dataset and the Luchhi++ dataset. Detailed work has already been carried out by [
23] to understand the critical differences between these datasets.
The yellow range in
Figure 4a is the real label given in [
15], and the green part in
Figure 4b is the real label after the recalibration. The red and blue boxes represent the same mitochondria. In
Figure 4b, the yellow boxes indicate the newly identified mitochondria, which do not present in the previous versions.
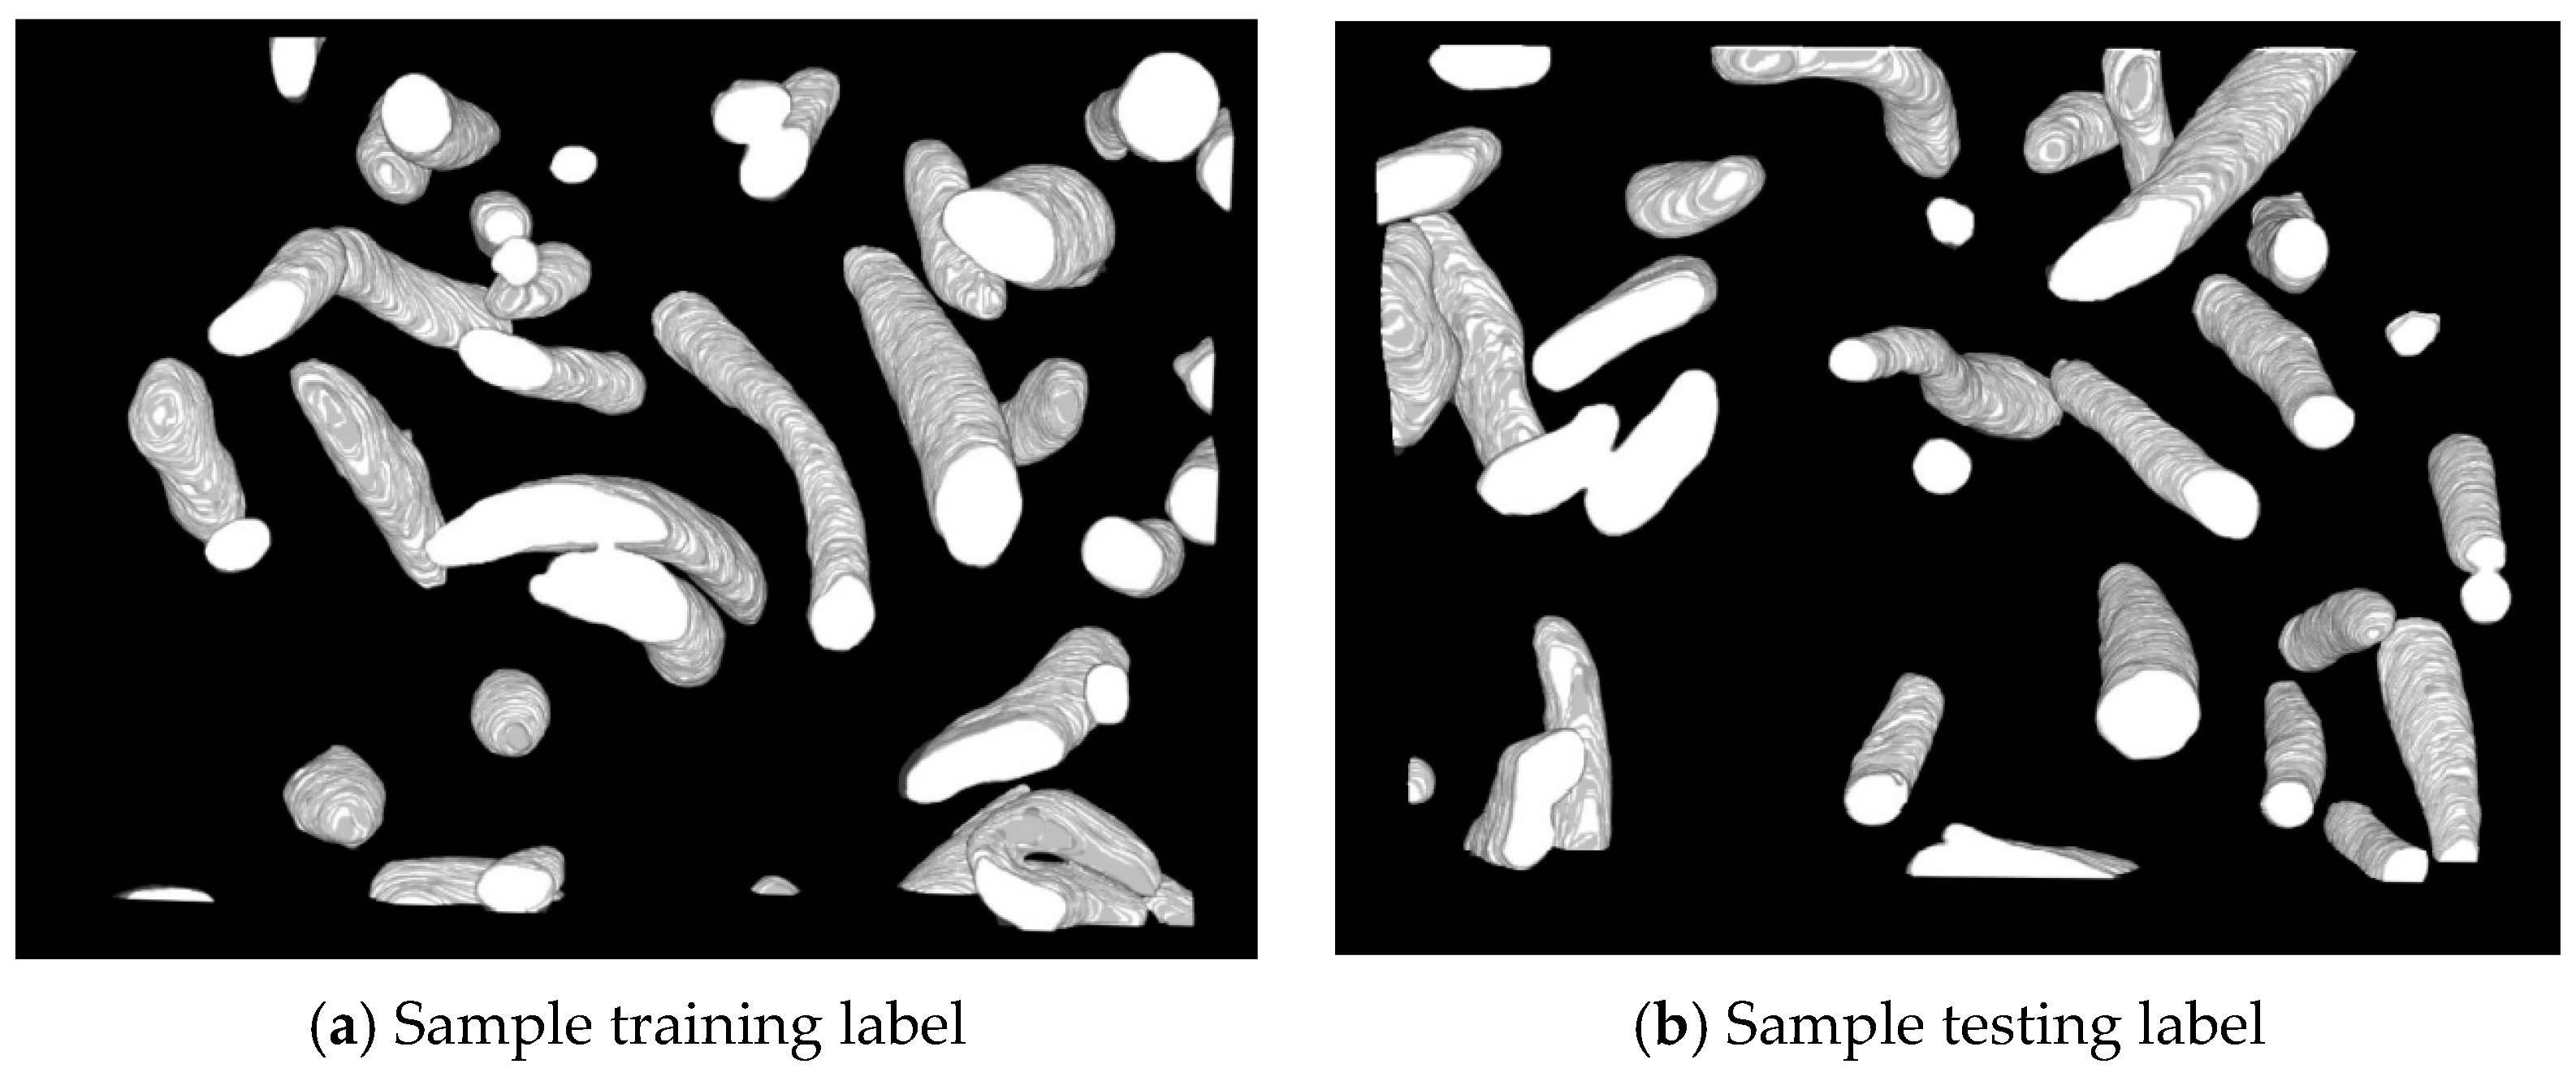
Figure 5a,b recalibrated labels from the training and test set, in which white pixels correspond to old labels and gray pixels indicate the newly added changes.
The limitations of the top-down and bottom-up approaches are shown below with sample results.
3.2. Limitations of 2D Top-down and 3D Bottom-up Approaches
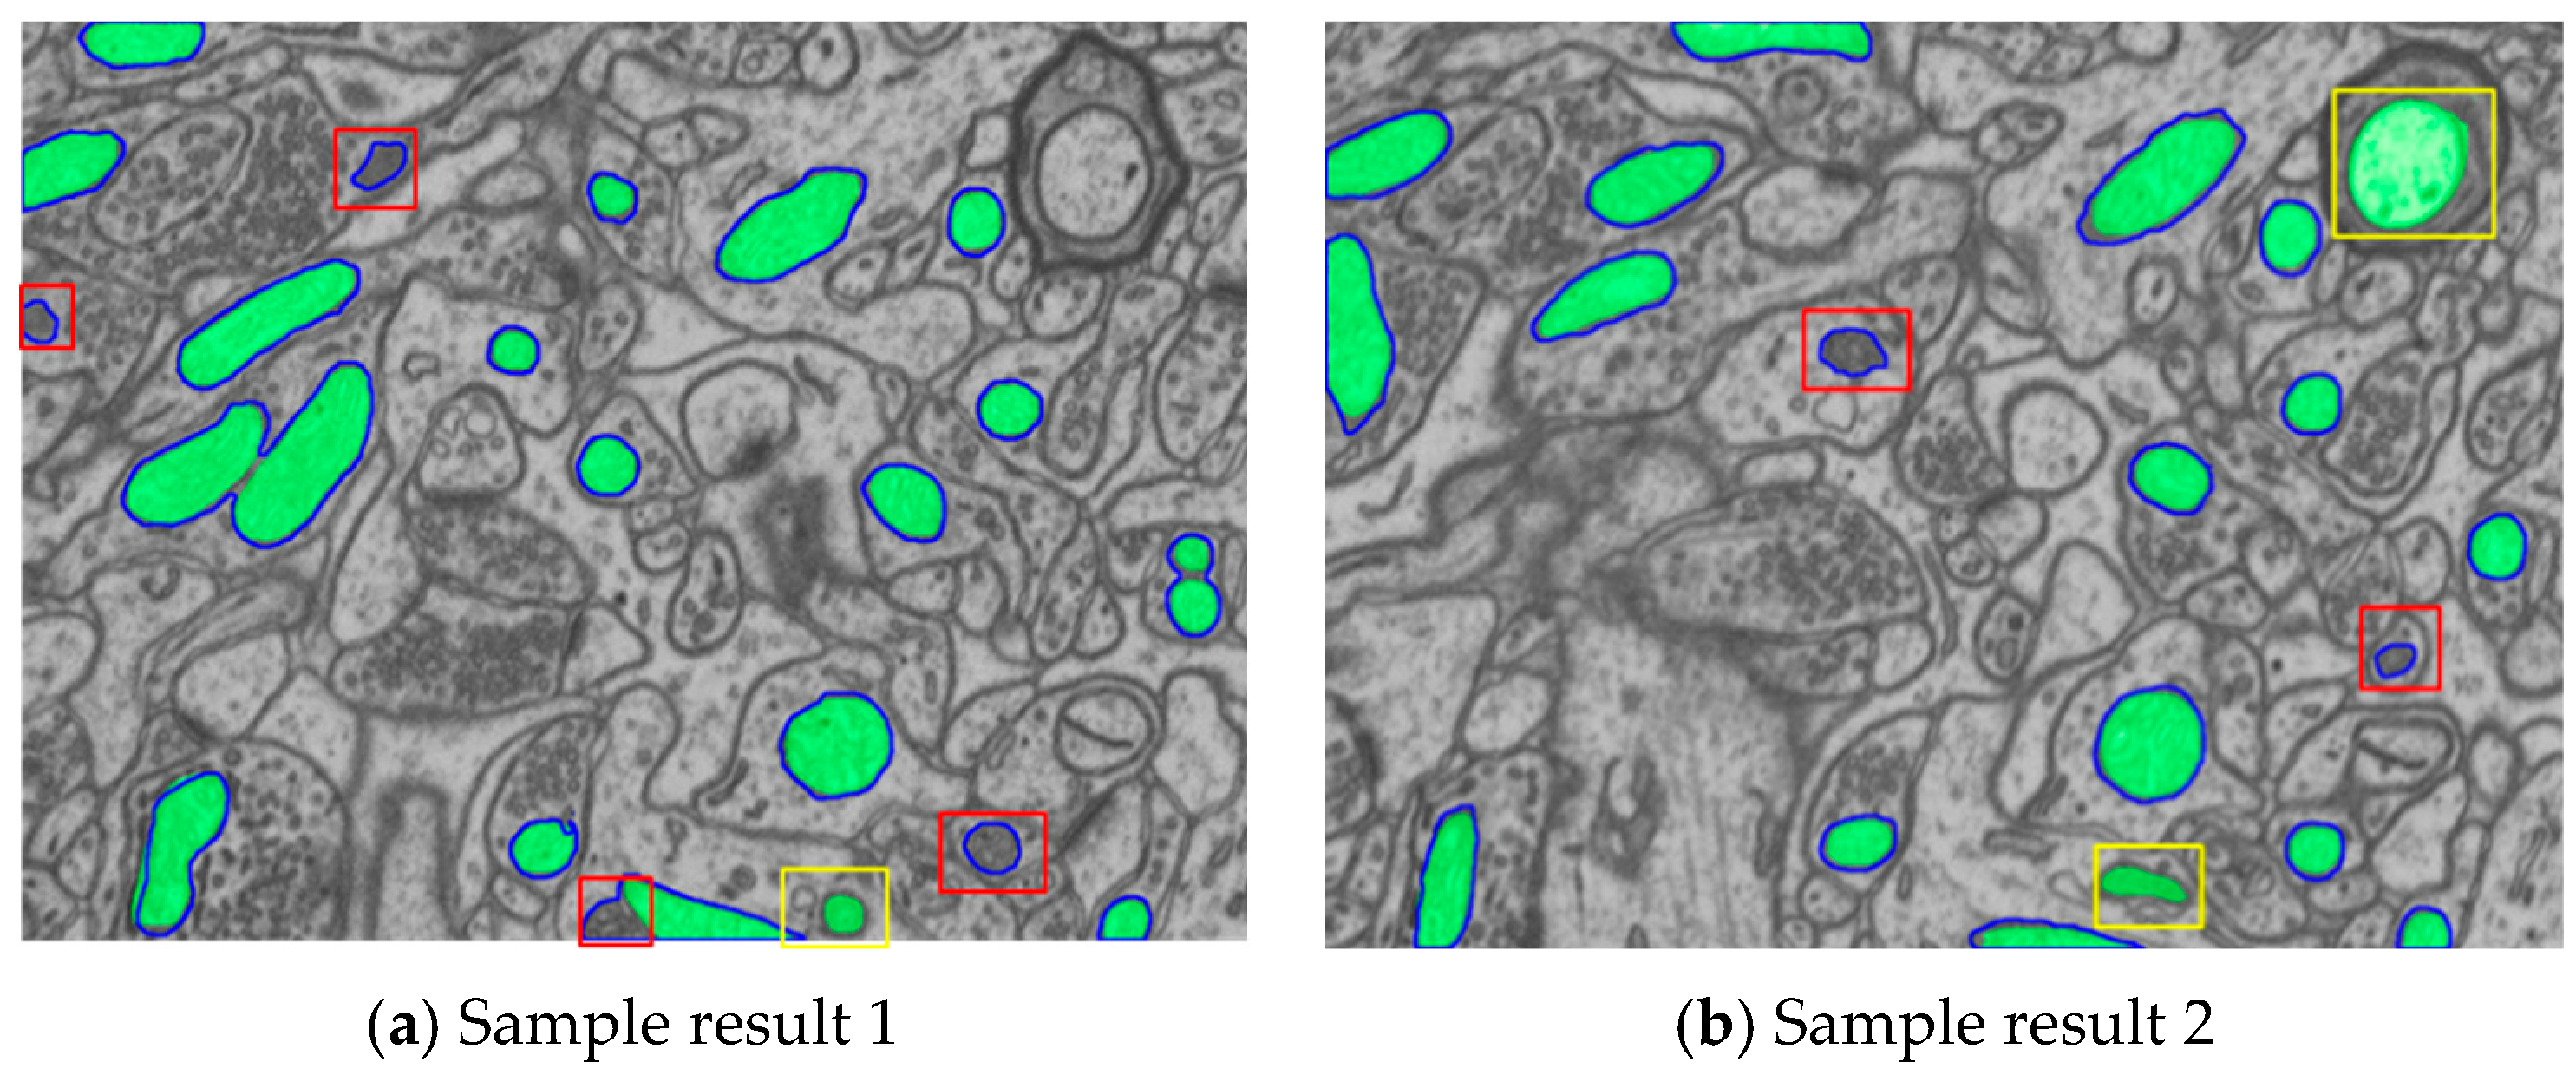
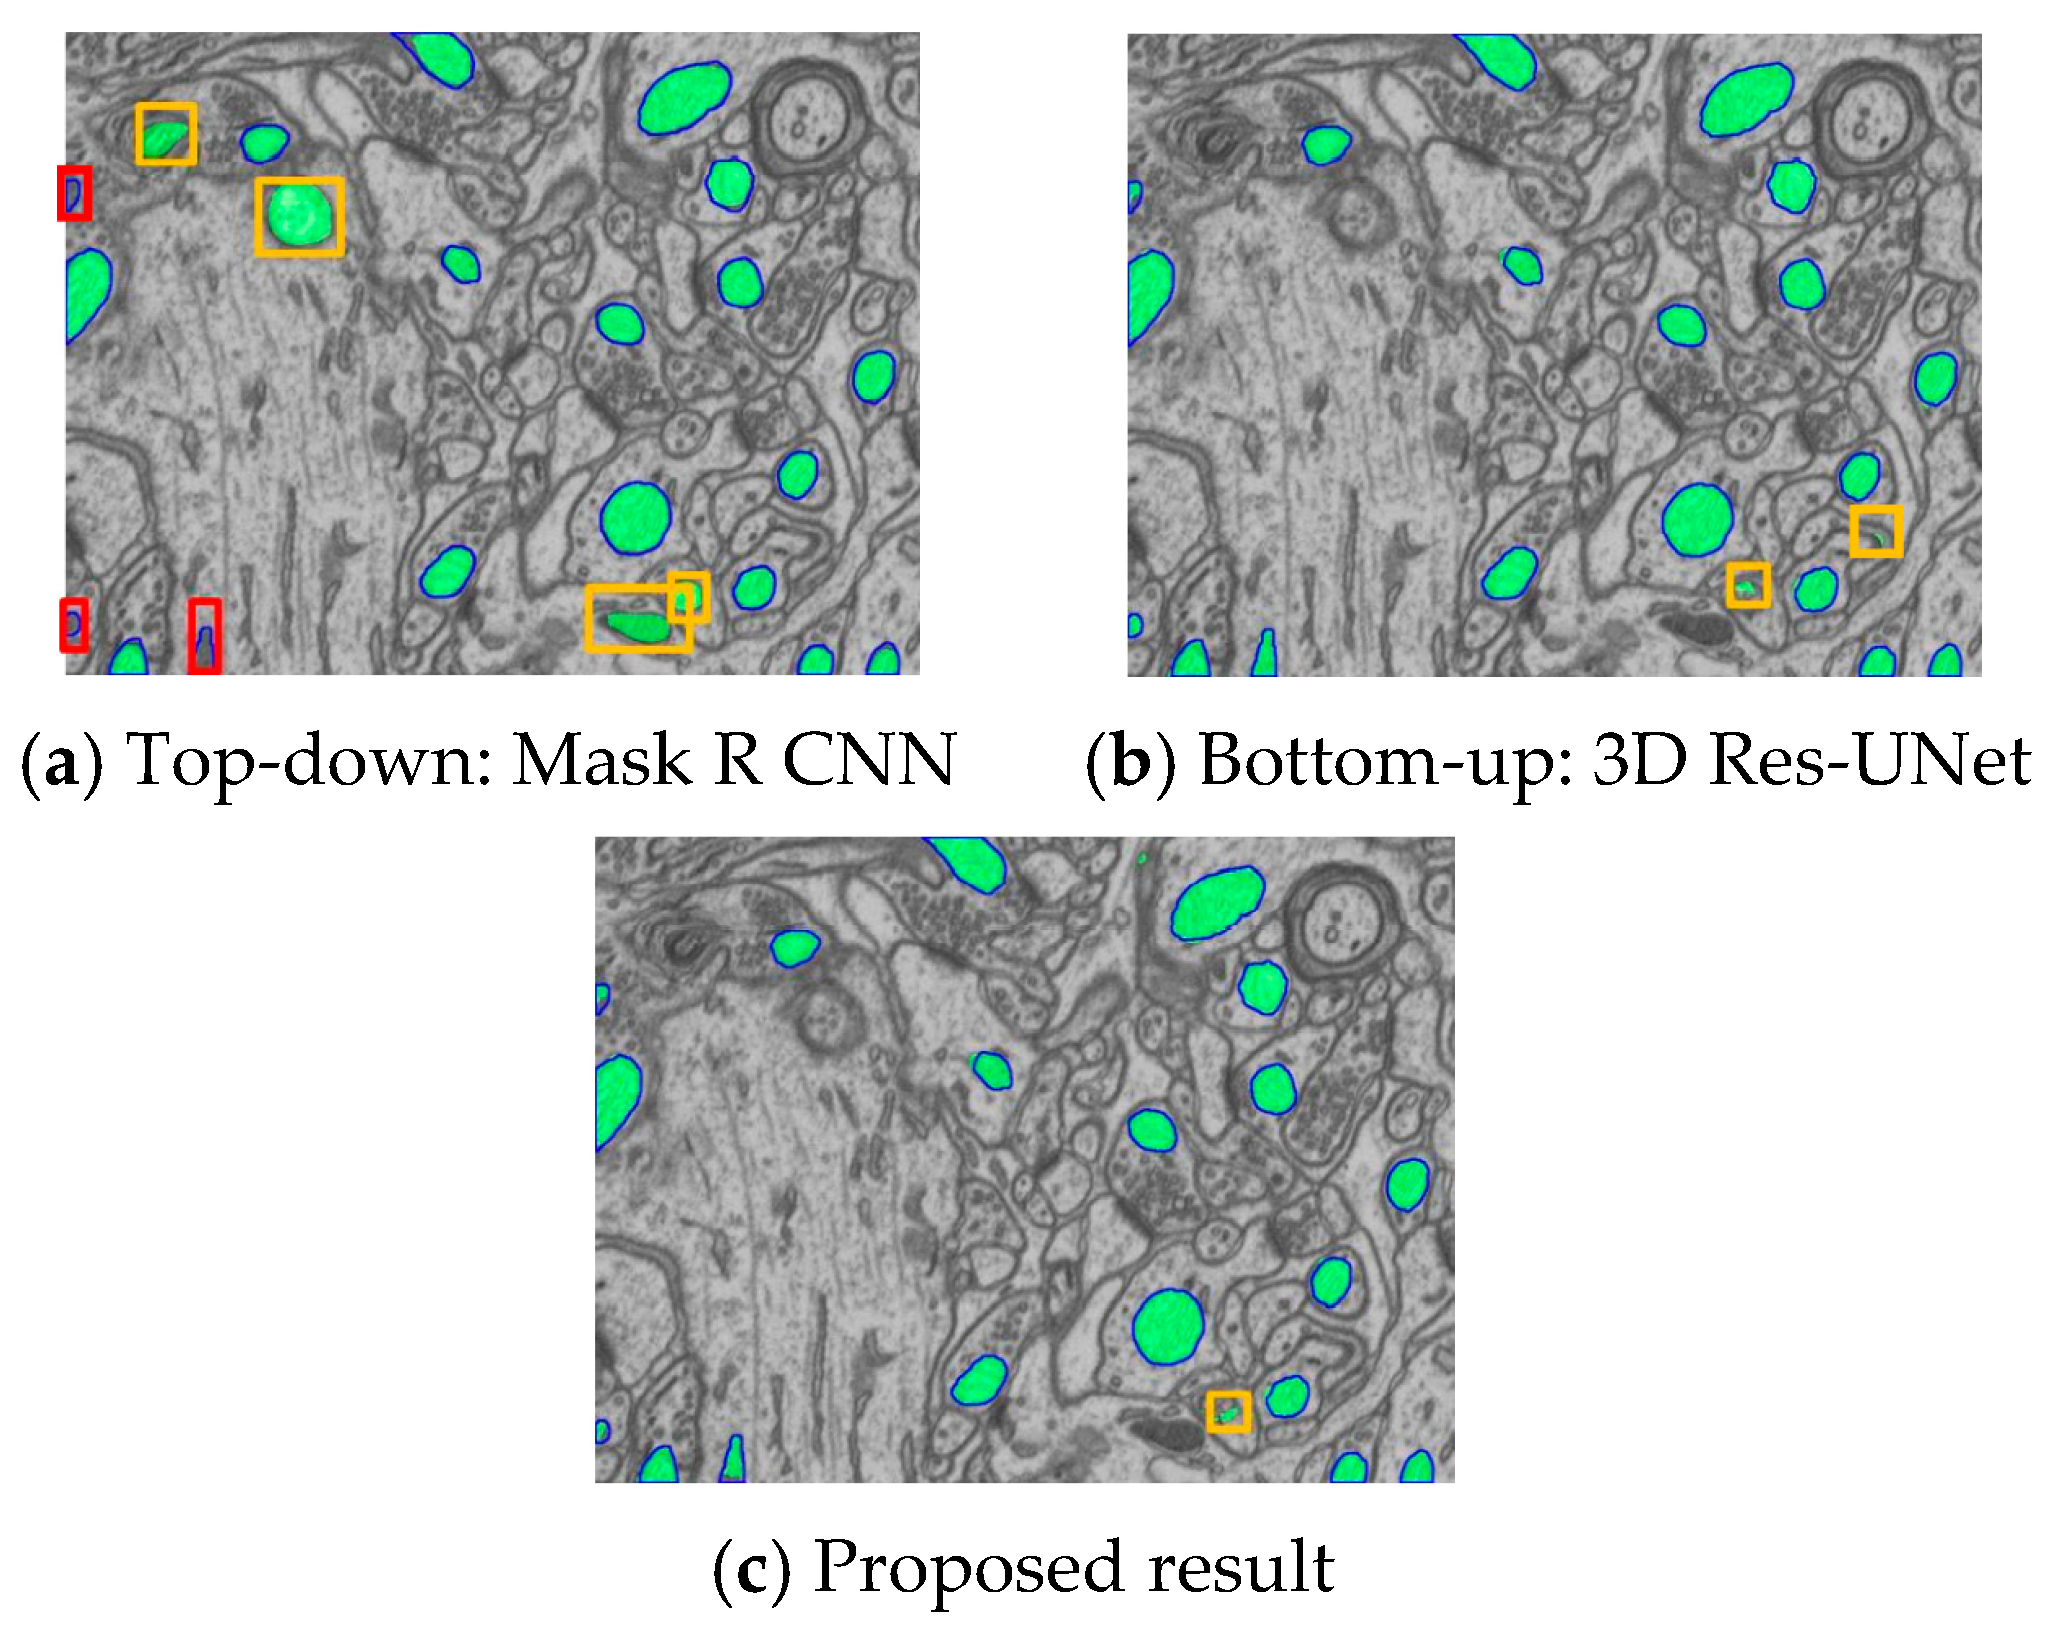
The experimentation results from the top-down and bottom-up approaches are shown to provide performance drawbacks. From a few results shown in
Figure 6, it can be seen that many detected mitochondrial areas are false positives due to failures in the objects’ localization, in particular, the small mitochondria regions. These make the top-down approach unsuited for detecting fine-grain mitochondrial portions, which are critical for diagnosis.
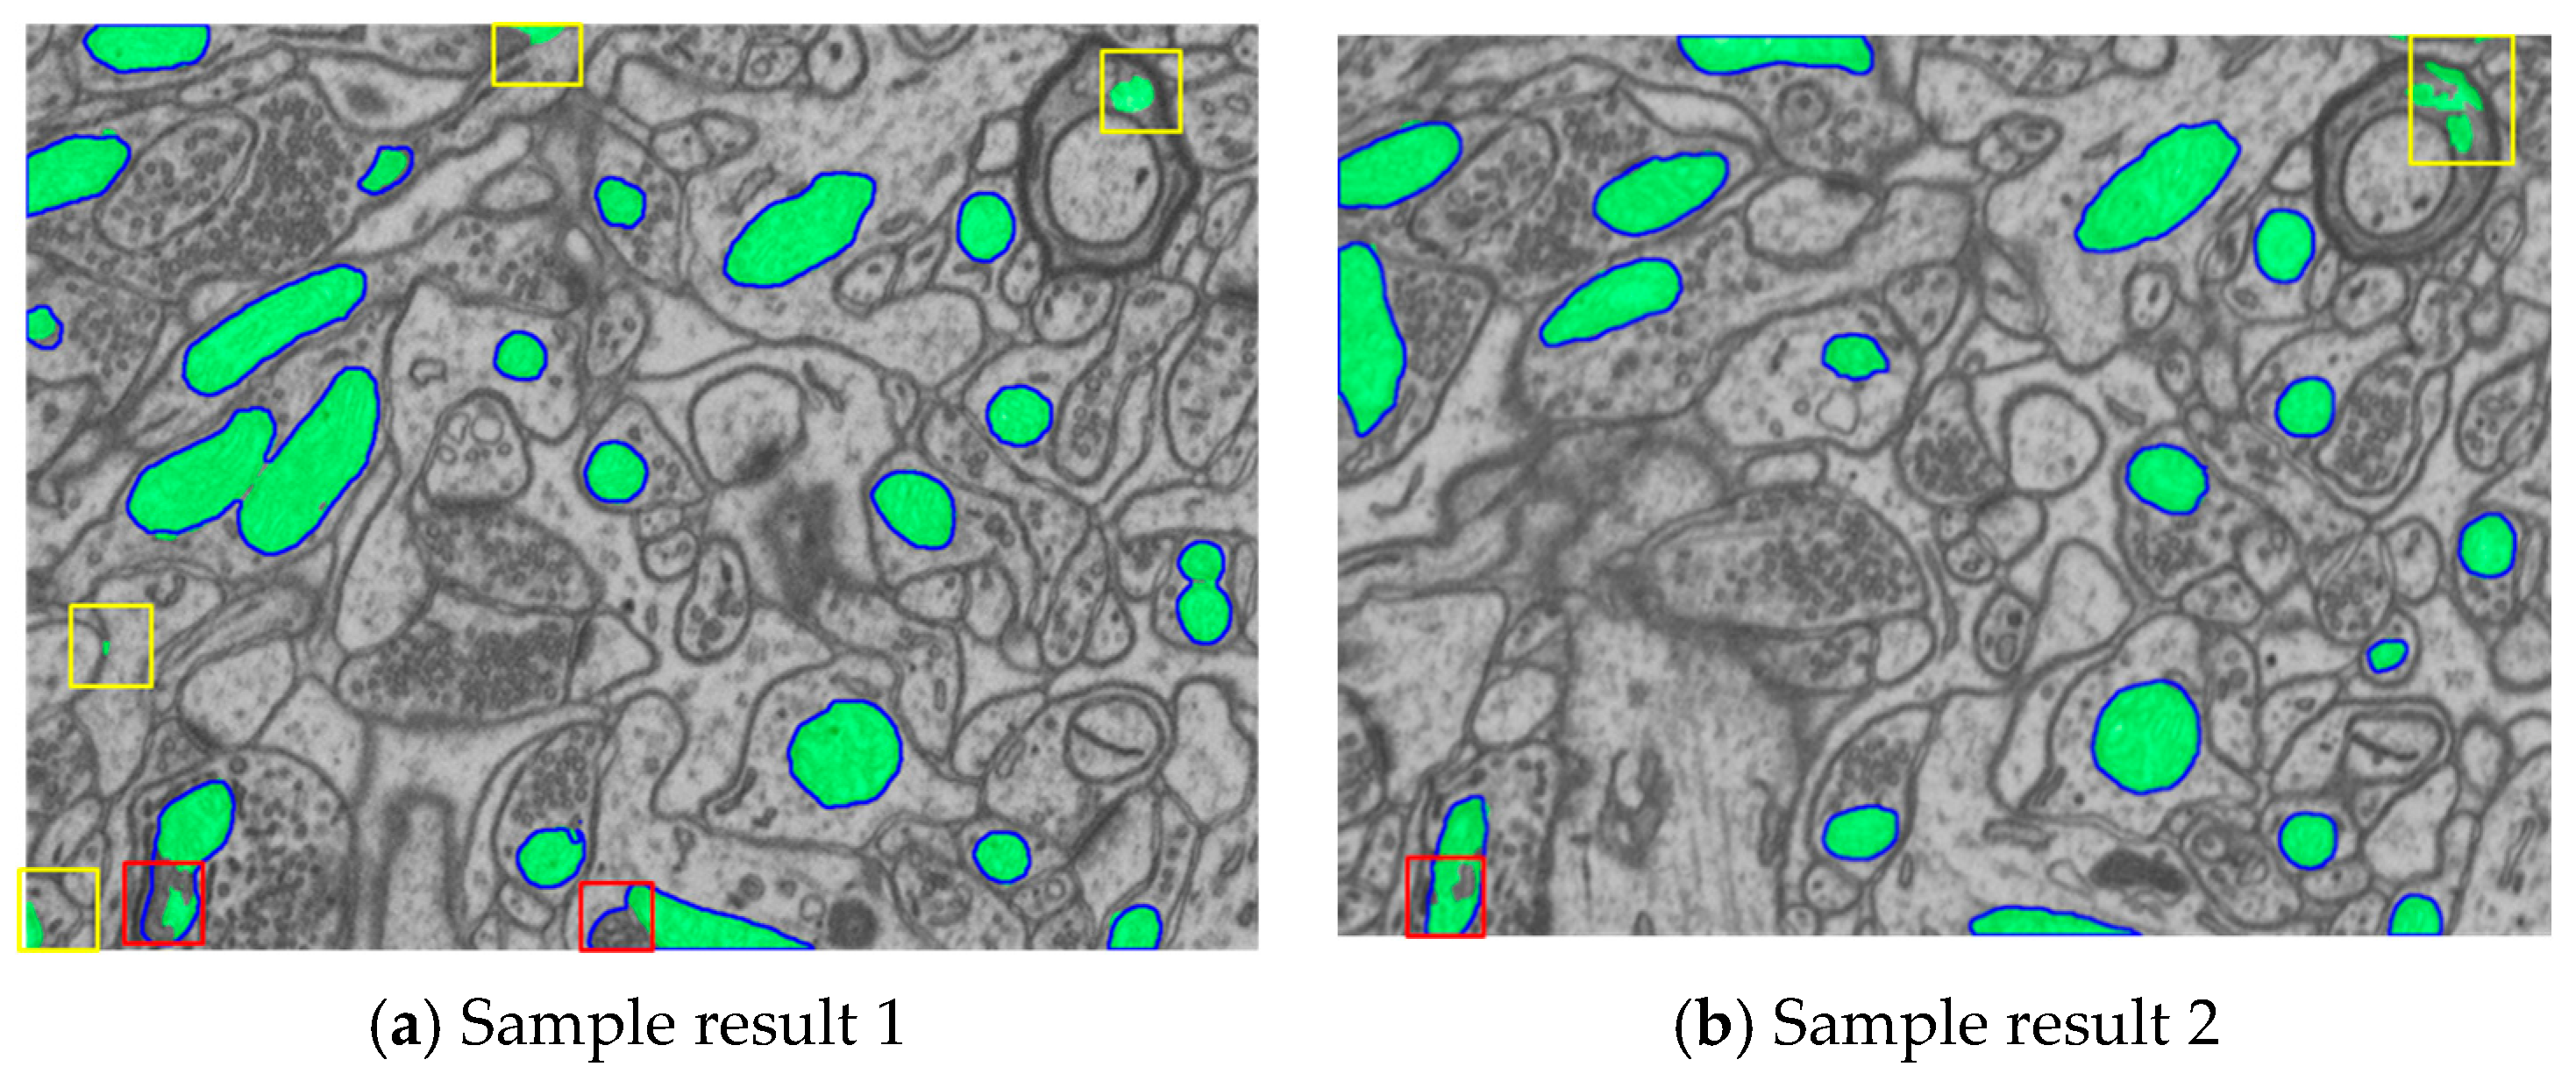
Similar problems are also reported in the 3D bottom-up approach, as in
Figure 7. However, the failure cases are far fewer than those of the top-down approach. The proposed technique aims to improve the detection issues of both methods.
3.3. Proposed Strategies
Three essential strategies are proposed to improve the overall performance, and the best option is selected based on the results.
Figure 8 shows the proposed three-stage model. The overall model comprises three stages: The first stage comprises the Mask R-CNN network, which is based on the ResNet101 backbone, and the standard kernel of 3 × 3 is used; the second stage comprises the 3D Res-UNet architecture, and a combined training mechanism using two approaches is provided in the third stage. All of these stages are independently trained and evaluated using a single-model configuration. From the results, it is found that the third stage has false positives and false negatives, similar to the second stage. This is mainly because the results of the Mask R-CNN model in the first stage on the testing dataset are worse than the results of the second stage 3D Res-UNet. In the third stage model, the channel 2 data from Mask R-CNN resulted in many failures.
The strategy used in the second approach is shown in
Figure 9. The proposed 3D Res-UNet model obtains the prediction results of the Mask R-CNN cutting model and is arranged in channel 2. However, only the edge information is utilized during the training. As the 3D information is not utilized in this training, the result still has issues identifying small mitochondria objects.
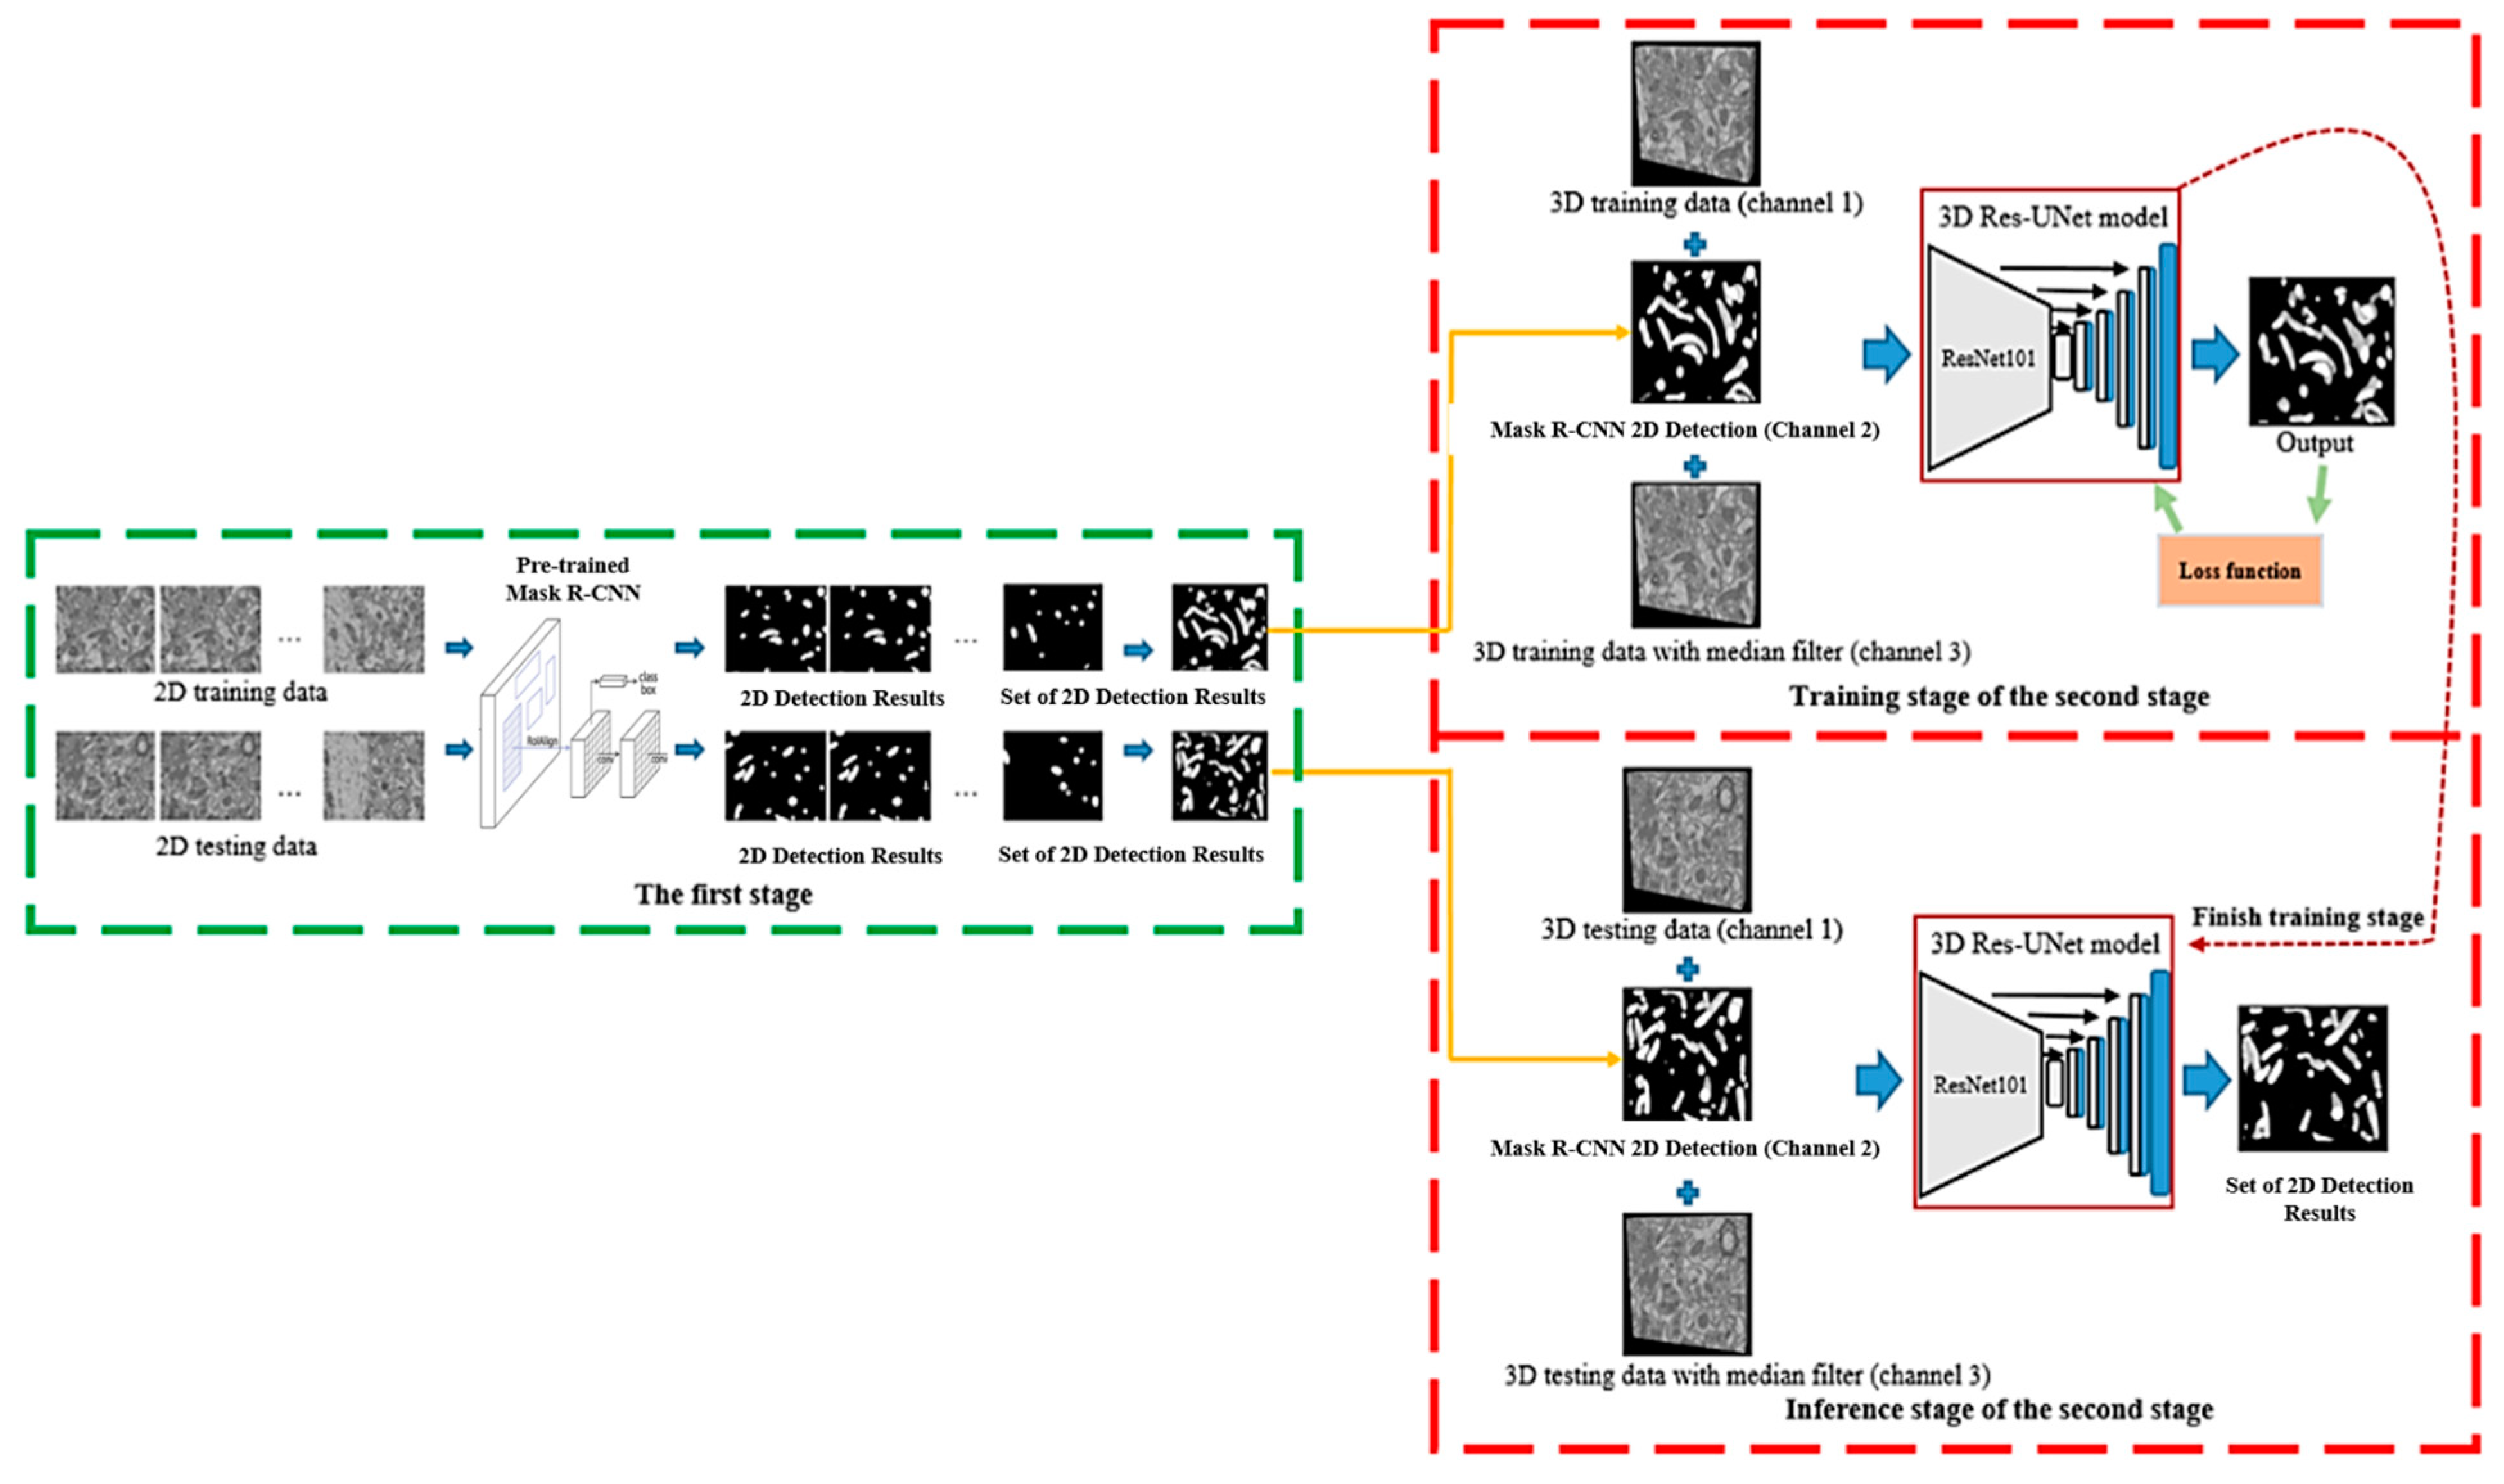
Based on the two outcomes, a final model is proposed, as in
Figure 10, in which the two-stage cascaded CNN object detection is proposed. The first stage has two phases, in which a simple object detection model is used initially to obtain the bounding boxes along the mitochondria regions. In addition, the approximated 3D results of the bounding boxes are obtained using the rectangular warps from the labeled data. The second stage uses 3D Res-UNet for training, as shown in
Figure 10. The final architecture comprises a two-stage series object detection model combined with the 3D Res-UNet architecture. The median filters preserve the edge regions and remove any unwanted transients.
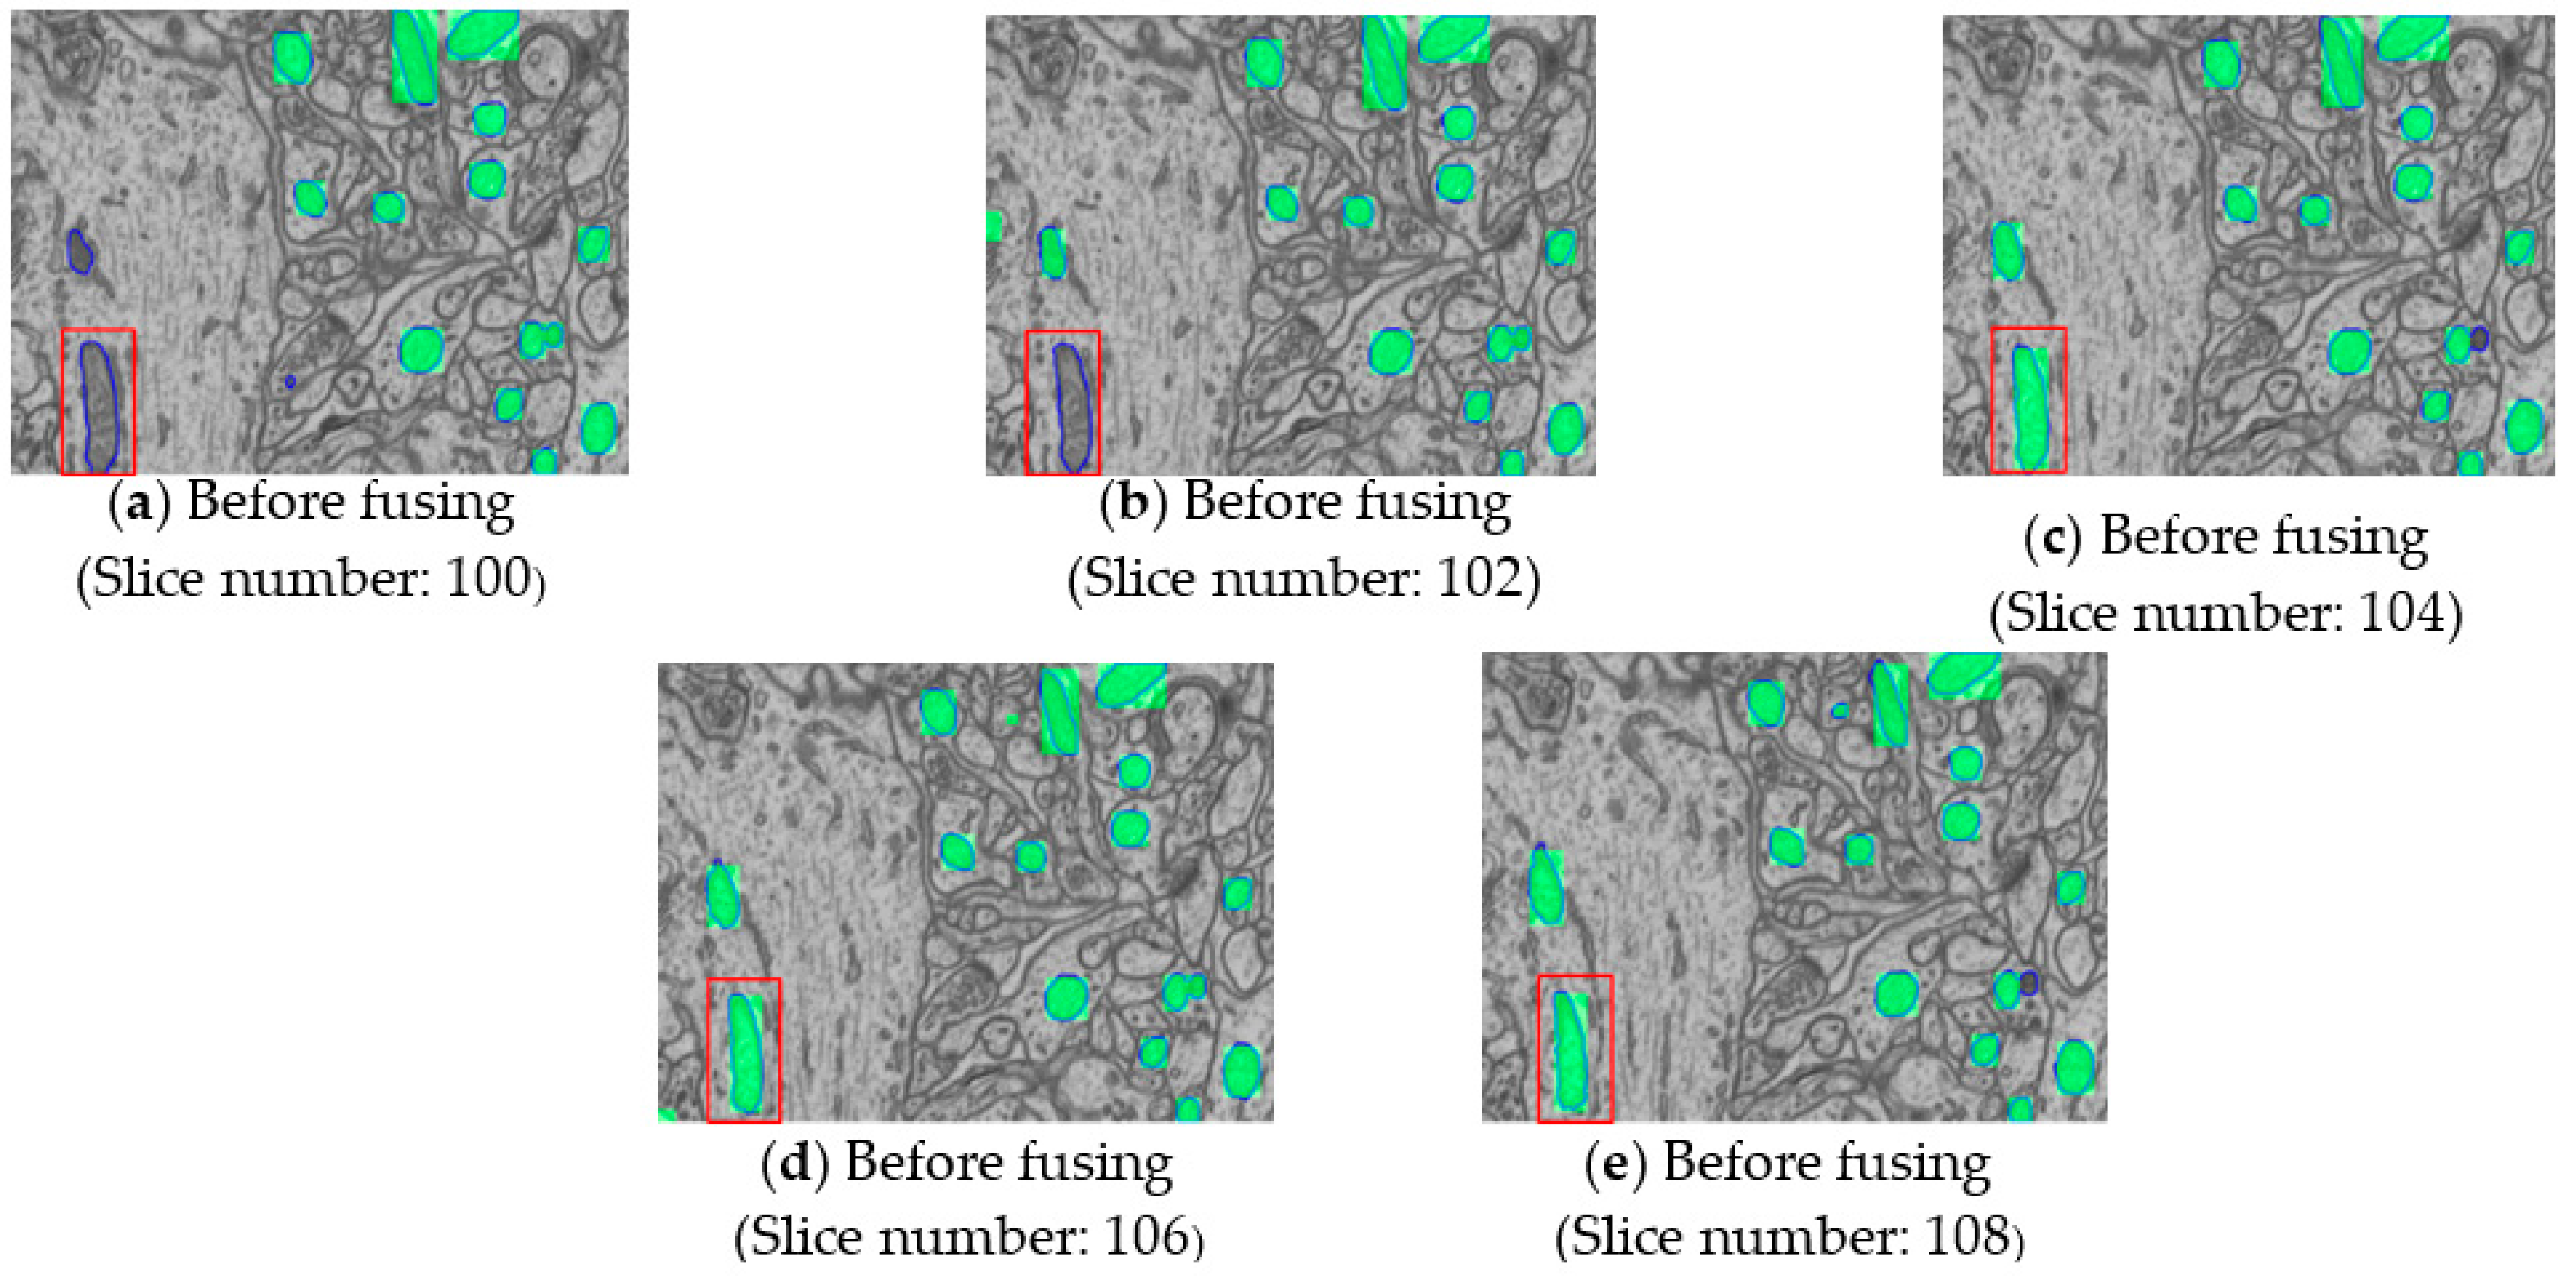
In the first two approaches, a 2D object detector is trained to predict the results, and the method lacks the depth of information of the front and rear slices. The multi-stage training is used for training, and the binary cross entropy is used as a loss function to optimize the model. Some slices may have missed detection, as shown in
Figure 11a–e. The red boxes in the Figure represent the mitochondria. For example,
Figure 11a represents the 100th slice, and
Figure 11b represents the 102nd slice. The red boxes in the two figures show false negatives that are missed. But in
Figure 11c–e, the same mitochondria are detected correctly.
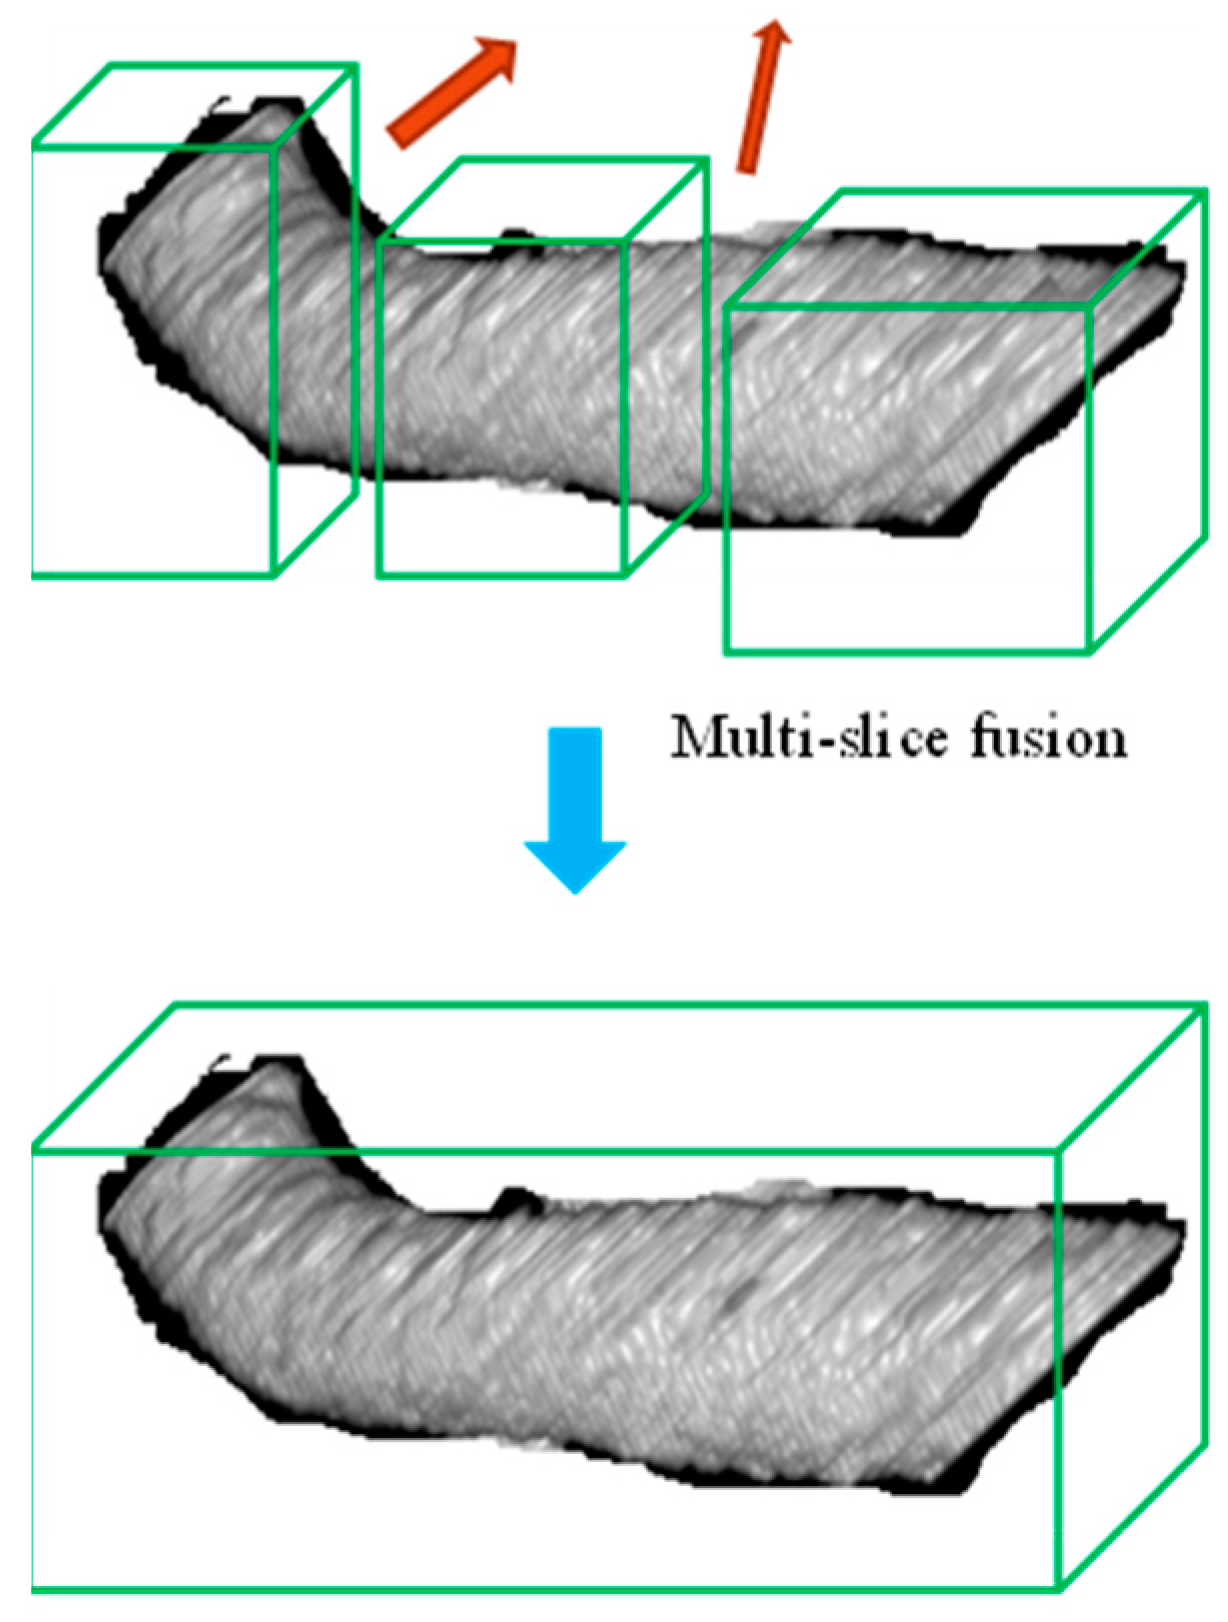
The brown arrow in
Figure 12 represents the missed detection. Because the mitochondria have no specific shape rules, some slices are likely to be missed under the 2D detection method, and subsequent slices are detected again. Hence, a new method, termed multi-slice, is incorporated to identify and retrieve the missing detections.
The improved results using the fusion technique are provided in
Figure 13, and it achieves better detection performance.
4. Experimental Results and Discussion
This section covers the training strategies, evaluation indices, and detailed comparison studies. The illustrative results comparing the top-down, bottom-up, and proposed method is also provided for additional validation. The critical advantage of the proposed method and its limitations are also provided.
4.1. Training Specifications
As standard practice, all input images of size 1024 × 768 are resized to 1280 × 1024 before image augmentation. Around 330 image slices are equally divided and used for the training and validation, and the first stage object detector can be of any object detection model, e.g., YOLOv5 [
28], YOLO-R [
29].
In the second stage, many data augmentation techniques, such as image rotation by 90 and 270 degrees, and image transposing, are introduced to increase the richness of the data. Due to memory limitations, it is not feasible to directly use the actual resolution 1024 × 768 as input to the deep model. Hence, the images are divided into small cubes of size 256 × 256 × 32 and fed into our 3D Res-UNet model for training. When segmenting a large 3D image into a smaller 3D image, each small cube overlaps 50% in width and 75% in height and depth. In addition, the Test-Time Augmentation (TTA) method is used in the second phase of the test.
In addition, we have adopted a similar configuration in [
30,
31]. The network is trained with a batch of size 4, and with a learning rate of 0.01 for 100 epochs.
4.2. Evaluation Indices
The prediction scores obtained through different test sets are averaged to obtain the final evaluation index.
Equations (1)–(5) are the evaluation metrics used for segmentation performance estimation. The indices used are accuracy, dice coefficient, foreground intersection over union (FG_IoU), background intersection over union (BG_IoU), and the mean intersection over union (m_IoU).
4.3. Comparison Studies
The initial methods, such as [
28,
29,
30], are based on the 2D Res-UNet, Mask R-CNN, and 3D Res-UNet, respectively, and achieved a maximum accuracy of 0.994, which is close to our proposed technique. However, the
FG_IoU scores of the previous methods are low, as they are missing many foreground mitochondria objects in the test images. The subsequent approaches [
10,
23,
31] are mainly based on the 3D model approach, which has better accuracy and IoU scores than those of the previous model. From the results, it can be inferred that, though the mean score and accuracy are improved, the
FG_IoU score is not significantly improved and far inferior to the proposed method. This is because the one-stage object detection models introduce many false positives, which affect the training of the 3D Res-UNet module.
Compared to all existing methods, as shown in
Table 1, the proposed method has achieved improved accuracy and all intersection scores. The improvements are achieved through two-stage object detection and the multi-fusion module and significantly improved the
FG_IoU score.
4.4. Illustrative Results
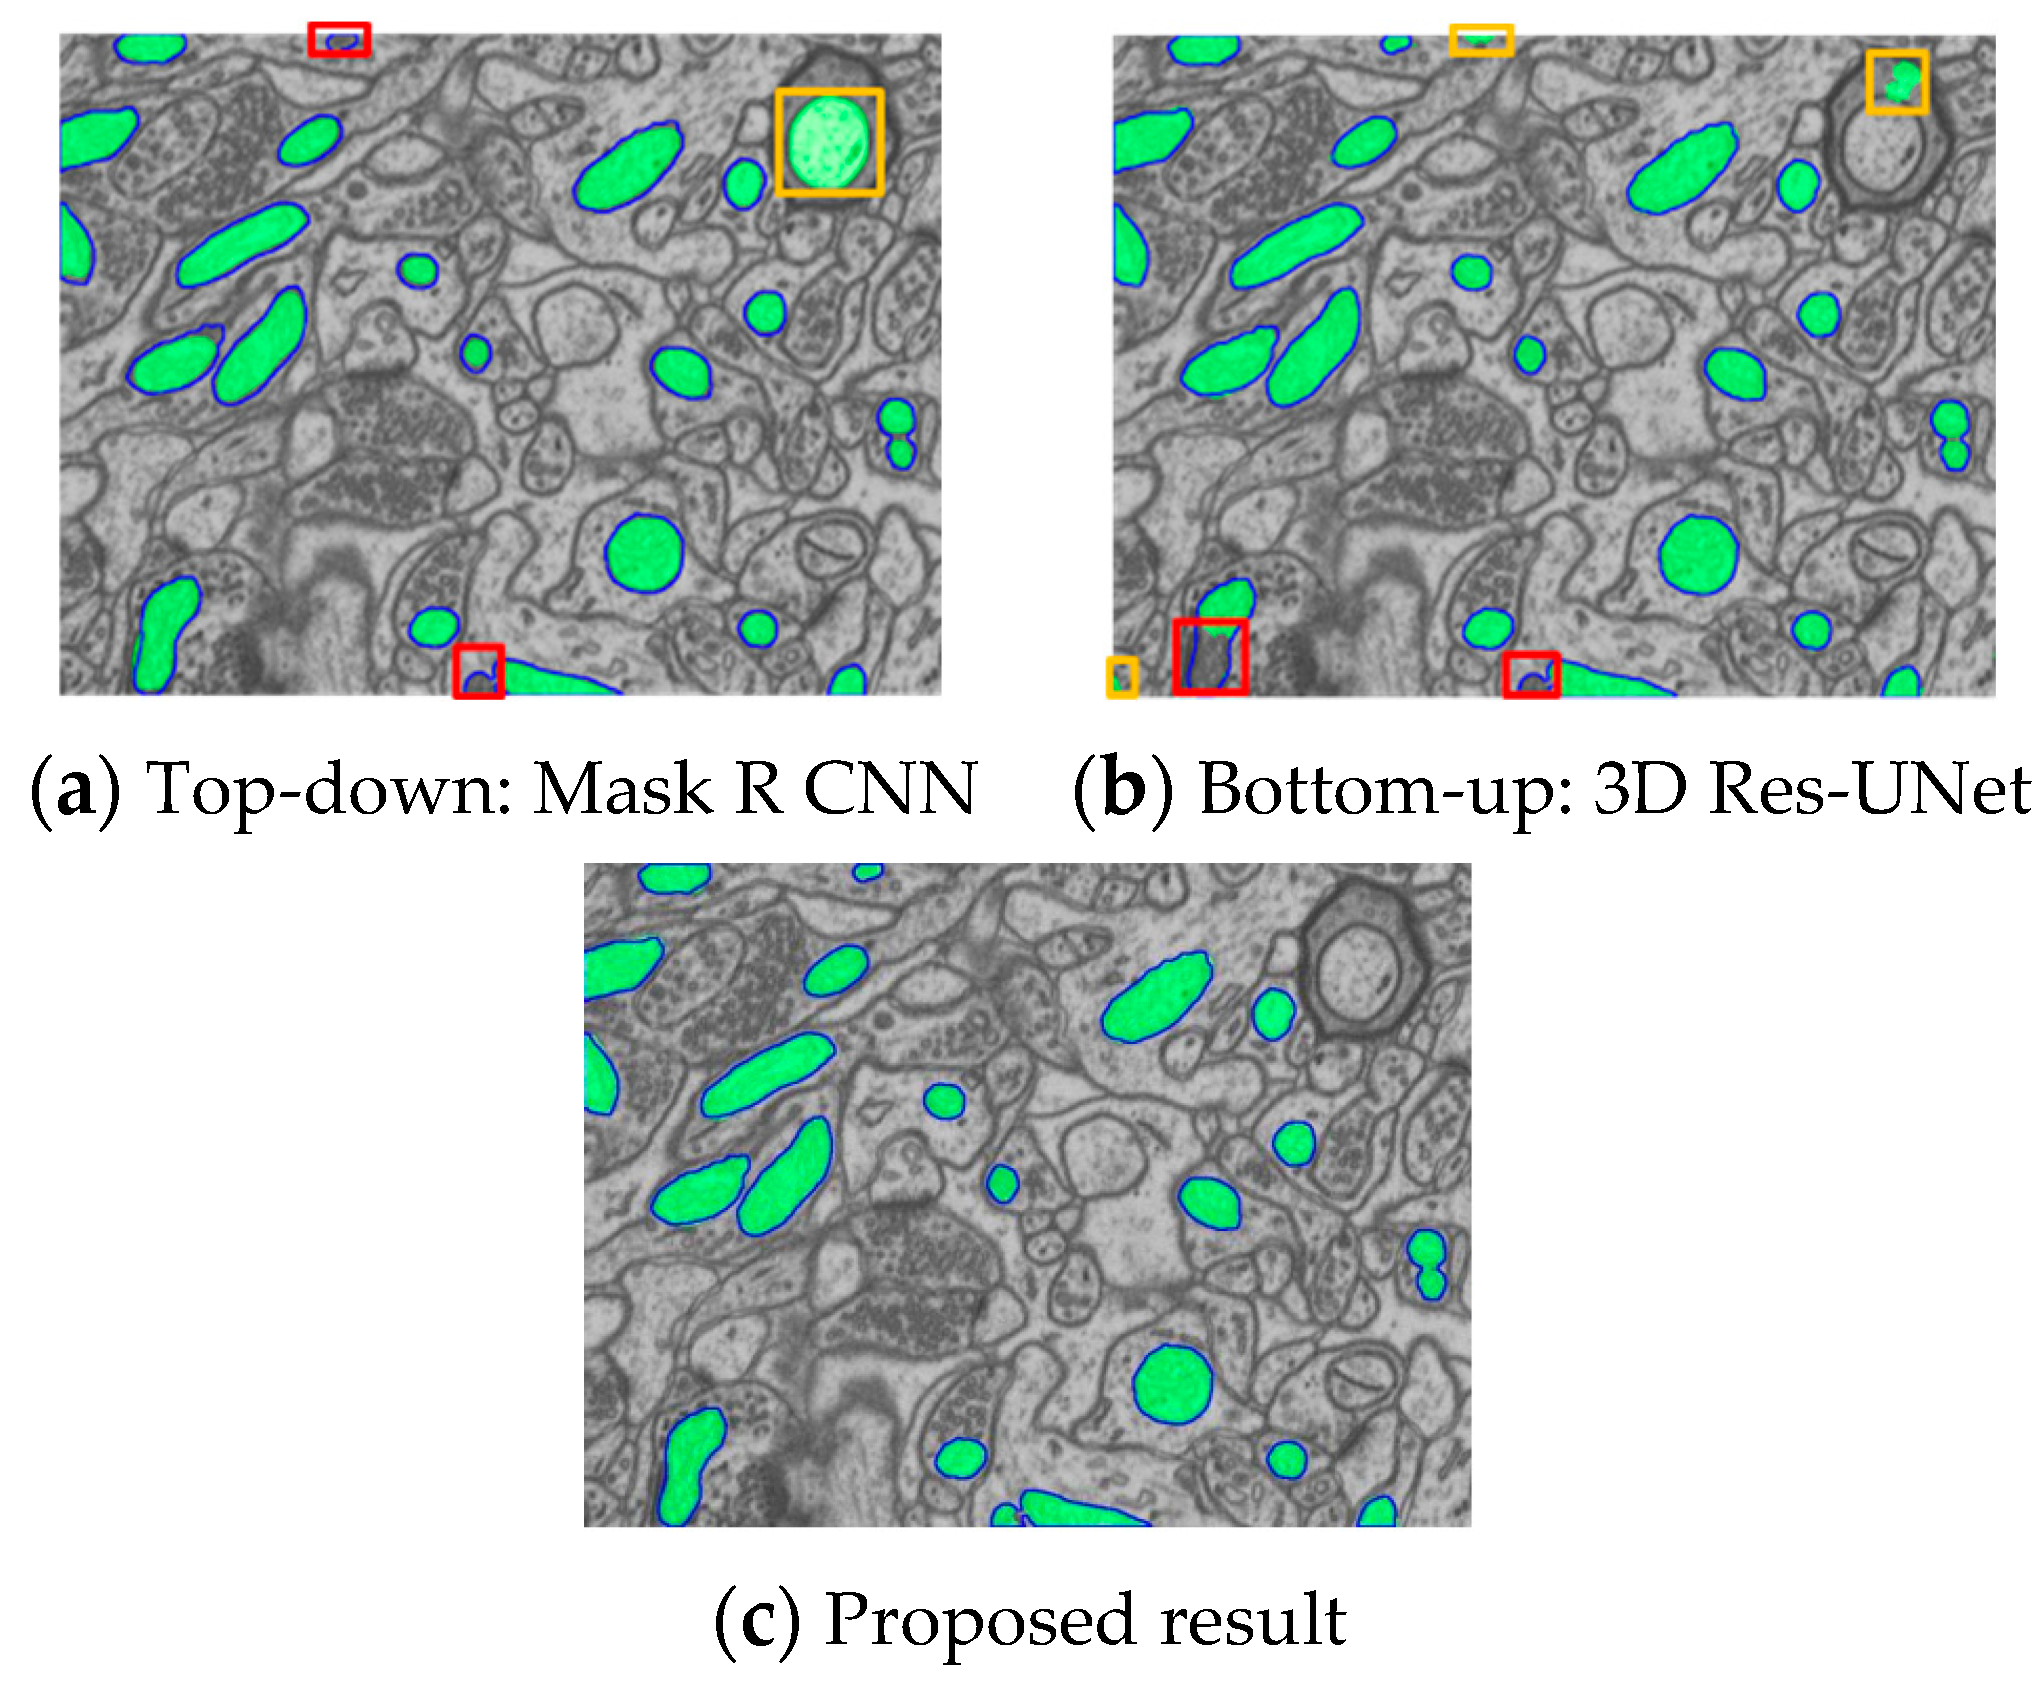
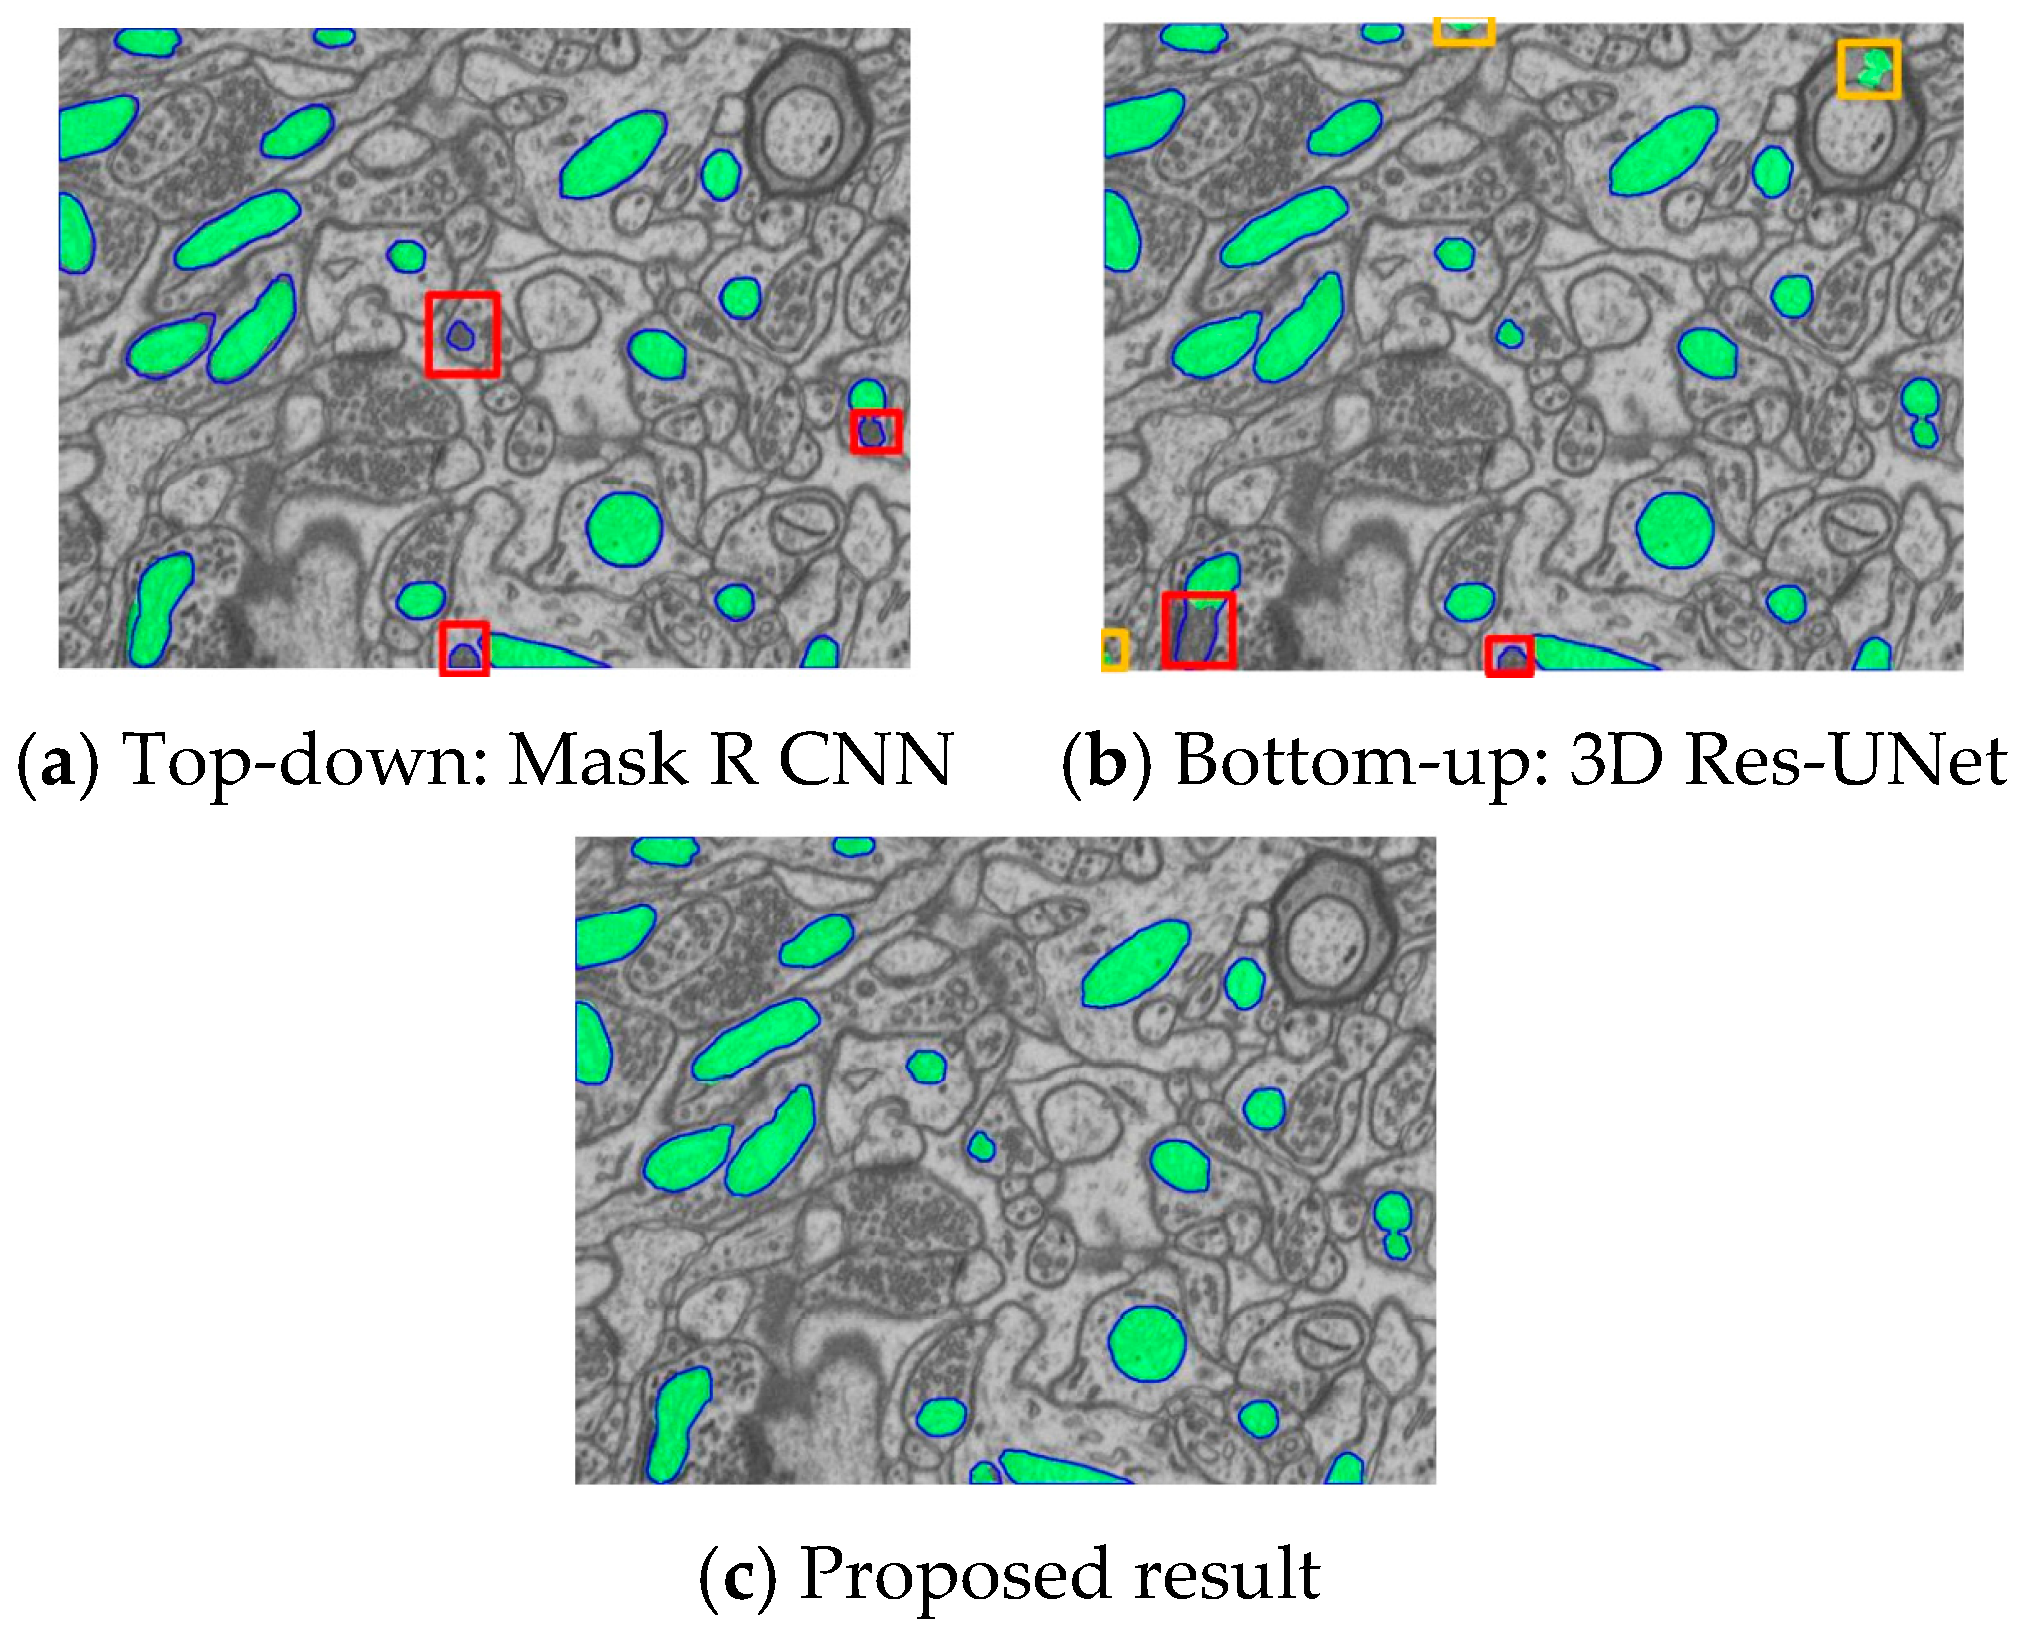
This section compares the top-down Mask R-CNN and the bottom-up 3D Res-UNet model for the randomly selected slices 10, 12, and 59. In all illustrations, the green color represents the model predictions, and the blue color contours represent the mitochondria ground truth. The red and yellow boxes represent the false negative (FN) and false positive (FP), respectively.
Figure 14 and
Figure 15 show that the existing methods have several issues, which are indicated in the red and yellow boxes. The majority of the false positives are of small-size patches, which may be due to the failures in the object detectors in identifying the fine-grain mitochondria objects. In the proposed technique, most false positive results are eliminated due to the two-stage strategy. The false negative cases are mainly due to the 3D Res-UNet training failures. In this approach, data augmentation strategies are integrated to improve feature learning.
Figure 14c and
Figure 15c show that our results eliminate false negatives. Minor failure cases of the proposed approach are shown in
Figure 16.
Figure 16c shows that the proposed method has some minor failures in the false positive detection of mitochondria objects. This is mainly due to the limitation of the object detector. It can also be seen that the proposed method has very few failures compared to the existing methods.
5. Conclusions
This work proposes a new architecture to present superior 3D mitochondria EM segmentation detection compared to the state-of-the-art methods. Initially, the top-down 2D and bottom-up 3D approaches are implemented, and the comprehensive result analysis is performed under limitations. As most of the works involve object detectors at the first stage, performance issues in detecting tiny mitochondria objects are found. In addition, with the integration of 3D datasets, many false positive cases still affect the mean IoU score among the existing models. Specifically, it is found that many existing state-of-the-art models have low foreground IoU, making it not feasible to carry out automated diagnosis. The proposed work addresses all the issues in the existing frameworks and has achieved superior foreground IoU detection and accuracy through the new two-stage object detection module. Moreover, a new multi-fusion model is also proposed to enhance the mean detection score and set a new benchmark in the Luchhi++ dataset. The proposed method can produce accurate and mean IoU of 99.5% and 96.5%, respectively, which is substantially higher than the existing solutions and can be very useful for clinical diagnosis.
Author Contributions
Conceptualization, J.-M.G.; methodology, J.-H.L.; software, J.-H.L.; validation, W.-W.H.; formal analysis, S.S.; investigation, J.-M.G.; resources, S.S.; data curation, J.-H.L.; writing—original draft preparation, S.S.; writing—review and editing, W.-W.H.; visualization, W.-W.H.; supervision, J.-M.G. All authors have read and agreed to the published version of the manuscript.
Funding
This research received no external funding.
Data Availability Statement
Not applicable.
Conflicts of Interest
The authors declare no conflict of interest.
References
- Mumcuoglu, E.; Hassanpour, R.; Tasel, S.; Perkins, G.; Martone, M.; Gurcan, M. Computerized detection and segmentation of mitochondria on electron microscope images. J. Microsc. 2012, 246, 248–265. [Google Scholar] [CrossRef] [PubMed]
- Campello, S.; Scorrano, L. Mitochondrial shape changes: Orchestrating cell pathophysiology. EMBO Rep. 2010, 11, 678–684. [Google Scholar] [CrossRef] [PubMed]
- De Moura, M.B.; Dos Santos, L.S.; Van Houten, B. Mitochondrial dysfunction in neurodegenerative diseases and cancer. Environ. Mol. Mutagen. 2010, 51, 391–405. [Google Scholar] [CrossRef] [PubMed]
- Fulda, S.; Galluzzi, L.; Kroemer, G. Targeting mitochondria for cancer therapy. Nat. Rev. Drug Discov. 2010, 9, 447–464. [Google Scholar] [CrossRef]
- Kroemer, G. Mitochondria in cancer. Oncogene 2006, 25, 4630–4632. [Google Scholar] [CrossRef]
- Lee, D.; Lee, K.-H.; Ho, W.-K.; Lee, S.-H. Target cell-specific involvement of presynaptic mitochondria in post-tetanic potentiation at hippocampal mossy fiber synapses. J. Neurosci. 2017, 27, 13603–13613. [Google Scholar] [CrossRef]
- Kasahara, T.; Takata, A.; Kato, T.M.; Kubota-Sakashita, M.; Sawada, T.; Kakita, A.; Mizukami, H.; Kaneda, D.; Ozawa, K. Depression-like episodes in mice harboring mtDNA deletions in paraventricular thalamus. Mol. Psychiatry 2016, 21, 39–48. [Google Scholar] [CrossRef]
- Zeviani, M.; Di Donato, S. Mitochondrial disorders. Brain 2004, 127, 2153–2172. [Google Scholar] [CrossRef]
- Poole, C.; Thomas, R.E.; Andrews, L.A.; McBride, H.M.; Whitworth, A.J.; Pallanck, L.J. The PINK1/Parkin pathway regulates mitochondrial morphology. Proc. Natl. Acad. Sci. USA 2008, 105, 1638–1643. [Google Scholar] [CrossRef]
- Franco-Barranco, D.; Muñoz-Barrutia, A.; Arganda-Carreras, I. Stable deep neural network architectures for mitochondria segmentation on electron microscopy volumes. arXiv 2021, arXiv:2104.03577. [Google Scholar] [CrossRef]
- Baena, V.; Conrad, R.; Friday, P.; Fitzgerald, E.; Kim, T.; Bernbaum, J.; Berensmann, H.; Harned, A.; Nagashima, K.; Narayan, K. FIB-SEM as a Volume Electron Microscopy Approach to Study Cellular Architectures in SARS-CoV-2 and Other Viral Infections: A Practical Primer for a Virologist. Viruses 2021, 13, 611. [Google Scholar] [CrossRef] [PubMed]
- Seyedhosseini, M.; Ellisman, M.H.; Tasdizen, T. Segmentation of Mitochondria in Electron Microscopy Images using Algebraic Curves. In Proceedings of the 10th International Symposium on Biomedical Imaging, San Francisco, CA, USA, 7–11 April 2013; pp. 860–863. [Google Scholar]
- Kumar, R.; Vázquez-Reina, A.; Pfister, H. Radon-Like Features and Their Application to Connectomics. In Proceedings of the IEEE Computer Society Conference on Computer Vision and Pattern Recognition-Workshops, San Francisco, CA, USA, 13–18 June 2010; pp. 186–193. [Google Scholar]
- Lucchi, A.; Li, Y.; Fua, P. Learning for Structured Prediction using Approximate Subgradient Descent with Working Sets. In Proceedings of the IEEE Conference on Computer Vision and Pattern Recognition, Portland, OR, USA, 23–28 June 2013; pp. 1987–1994. [Google Scholar]
- Lucchi, A.; Smith, K.; Achanta, R.; Knott, G.; Fua, P. Supervoxel-Based Segmentation of Mitochondria in EM Image Stacks With Learned Shape Features. IEEE Trans. Med. Imaging 2012, 2, 471486. [Google Scholar] [CrossRef] [PubMed]
- Peng, J.; Yuan, Z. Mitochondria segmentation from em images via hierarchical structured contextual forest. IEEE J. Biomed. Health Inform. 2019, 24, 2251–2259. [Google Scholar] [CrossRef] [PubMed]
- Xiao, C.; Chen, X.; Li, W.; Li, L.; Wang, L.; Xie, Q.; Han, H. Automatic mitochondria segmentation for EM data using a 3D supervised convolutional network. Front. Neuroanat. 2018, 12, 92. [Google Scholar] [CrossRef]
- Ciresan, A.; Giusti, L.; Gambardella, L.; Schmidhuber, J. Deepneural networks segment neuronal membranes in electron microscopy images. Adv. Neural Inf. Process. Syst. 2012, 25, 2843–2851. [Google Scholar]
- Zeng, T.; Wu, B.; Ji, S. DeepEM3D: Approaching human-level performance on 3D anisotropic EM image segmentation. Bioinformatics 2017, 33, 2555–2562. [Google Scholar] [CrossRef]
- Wei, D.; Lin, Z.; Franco-Barranco, D.; Wendt, N.; Liu, X.; Yin, W.; Huang, X.; Gupta, A.; Jang, W.-D.; Wang, X.; et al. Mitoem dataset: Large-scale 3d mitochondria instance segmentation from em images. In Proceedings of the International Conference on Medical Image Computing and Computer Assisted Intervention, Lima, Peru, 4–8 October 2020; pp. 66–76. [Google Scholar]
- Liu, J.; Li, W.; Xiao, C.; Hong, B.; Xie, Q.; Han, H. Automatic detection and segmentation of mitochondria from SEM images using deep neural network. In Proceedings of the Annual International Conference of the IEEE Engineering in Medicine and Biology Society (EMBC), Honolulu, HI, USA, 17–21 July 2018; pp. 628–631. [Google Scholar]
- Liu, J.; Li, L.; Yang, Y.; Hong, B.; Chen, X.; Xie, Q.; Han, H. Automatic reconstruction of mitochondria and endoplasmic reticulum in electron microscopy volumes by deep learning. Front. Neurosci. 2020, 14, 599. [Google Scholar] [CrossRef]
- Casser, V.; Kang, K.; Pfister, H.; Haehn, D. Fast mitochondria detection for connectomics. Med. Imaging Deep. Learn. 2020, 121, 111–120. [Google Scholar]
- Luc, P.; Couprie, C.; Chintala, S.; Verbeek, J. Semantic segmentation using adversarial networks. arXiv 2016, arXiv:1611.08408. [Google Scholar]
- Hatamizadeh, A.; Tang, Y.; Nath, V.; Yang, D.; Myronenko, A.; Landman, B.; Roth, H.R.; Xu, R. Unetr: Transformers for 3D Medical Image Segmentation. In Proceedings of the IEEE/CVF Winter Conference on Applications of Computer Vision, Waikoloa, HI, USA, 4–8 January 2022; pp. 574–584. [Google Scholar]
- Cheng, H.C.; Varshney, A. Volume Segmentation Using Convolutional Neural Networks with Limited Training Data. In Proceedings of the IEEE International Conference on Image Processing (ICIP), Beijing, China, 17–20 September 2017; pp. 590–594. [Google Scholar]
- Mekuč, M.Z.; Bohak, C.; Hudoklin, S.; Kim, B.H.; Romih, R.; Kim, M.Y.; Marolt, M. Automatic segmentation of mitochondria and endolysosomes in volumetric electron microscopy data. Comput. Biol. Med. 2020, 119, 103693. [Google Scholar] [CrossRef]
- Glenn, J. Ultralytics/YOLOv5—GitHub, 2020. Available online: https://github.com/ultralytics/yolov5 (accessed on 15 January 2023).
- Wang, C.Y.; Yeh, I.H.; Liao, H.Y.M. You Only Learn One Representation: Unified Network for Multiple Tasks. arXiv 2021, arXiv:2105.04206. [Google Scholar]
- He, K.; Gkioxari, G.; Dollár, P.; Girshick, R. Mask R-cnn. In Proceedings of the IEEE International Conference on Computer Vision, Venice, Italy, 22–29 October 2017; pp. 2961–2969. [Google Scholar]
- Solovyev, R.; Kalinin, A.A.; Gabruseva, T. 3D Convolutional Neural Networks for Stalled Brain Capillary Detection. arXiv 2021, arXiv:2104.01687. [Google Scholar] [CrossRef]
- Xiao, X.; Lian, S.; Luo, Z.; Li, S. Weighted res-unet for high-quality retina vessel segmentation. In Proceedings of the 2018 9th international conference on information technology in medicine and education, Hangzhou, China, 19–21 October 2018; pp. 327–331. [Google Scholar]
| Disclaimer/Publisher’s Note: The statements, opinions and data contained in all publications are solely those of the individual author(s) and contributor(s) and not of MDPI and/or the editor(s). MDPI and/or the editor(s) disclaim responsibility for any injury to people or property resulting from any ideas, methods, instructions or products referred to in the content. |
© 2023 by the authors. Licensee MDPI, Basel, Switzerland. This article is an open access article distributed under the terms and conditions of the Creative Commons Attribution (CC BY) license (https://creativecommons.org/licenses/by/4.0/).


