1. Introduction
Undeclared work is a serious and complex problem that strongly impacts society and the economy. It is defined as paid activities that are lawful, as regards their nature, but are not declared to the public authorities to avoid tax and social security contribution payments and to bypass specific legal standards per labour law [
1,
2]. Consequently, undeclared work severely undermines the well-being of workers, who are usually paid below the minimum wages and may work under unsafe conditions; of the lawful businesses by introducing unfair competitiveness in the labour market; and of the state through significant losses in tax revenues and insurance contributions. This illegal employment pattern has several causes and features and displays considerable heterogeneity since it can be located in various work environments and business sectors, involving a labour force of different profiles and backgrounds [
3]. In addition, it is inherently hidden, making its detection by the inspection authorities even more complicated, requiring more sophisticated approaches [
4].
In particular, labour inspectorates are tasked to deal with this illegal phenomenon in the labour market, yet they often face practical issues, lacking the appropriate tools and resources to plan and coordinate effective deterrence and preventative measures. They usually perform random checks or ground their inspection scheduling in filed complaints or risk analysis tools that use red flag indicators, manually configured based on labour inspection expertise [
5]. Yet, these high-risk indicators may contain a lot of bias and finally exclude specific groups of businesses from being inspected, or may trigger repetitive and redundant onsite inspections [
6]. Hence, a shift towards innovative data-driven solutions is indispensable, even more so when large volumes of related data are available and may be appropriately processed and analysed [
7]. Notably, data mining and machine learning applications can generate models trained on past inspection data, offering predictions on future checks and understandable knowledge regarding the most prevailing patterns of undeclared work and other labour law infringements. In addition, machine learning systems are convenient to use and maintain; they contain less prejudice and more justice [
8], and can explain how predictions are made, raising the user’s confidence in following them [
9].
Undeclared work is comprehensively studied in the social and economic sciences, e.g., [
2,
10]; multiple surveys are conducted by the EC [
1,
11,
12], targeting to expose its prevalence, nature, and specificities; and different organisations identify it as one of their major priorities for policy measures, such as the European Labour Authority (ELA) [
13,
14] and the European Platform Tackling Undeclared Work [
15], the International Labour Organization (ILO) [
3,
4], and the Organization for Economic Cooperation and Development (OECD) [
16]. Although the adverse effects and impact of informal employment on society and the economy are vastly recognised, not much research was published until recently related to applying data mining and machine learning techniques in its prediction and understanding [
17]. This fact triggered our first research in the field [
18], employing Association Rule Mining (ARM) [
19] and a dataset of 2.5 K actual past inspections performed by the Hellenic Labour Inspectorate (HLI) in a specific area and period. The dataset instances were labelled per the inspection findings, taking values among four main categories of discoveries, one of which, undeclared work, had our primary interest. That research revealed the considerable advantages of using innovative data-driven techniques to produce understandable outcomes, exposing specific correlations of company and employment features with inspection outcomes that existed in the dataset but were previously unknown to the labour inspection experts of the authority. The study also identified the prospects of applying machine learning in undeclared work prediction and motivated further exploration by adopting interpretable classification modelling.
Thus, in [
20], we applied Associative Classification (AC), which refers to supervised machine learning using ARM, generating classification models comprised of a set of interpretable class association rules (CARs), of the simple form of if-then rules, that meet the user-configurable support and confidence thresholds. Particularly, the Classification Based on Associations (CBA) [
21] algorithm was used, which produces effective and maintainable classifiers, with a dataset of 18.5 K records of actual inspection outcomes coming from the inspections conducted by the Hellenic Labour Inspectorate in Attica in 2018–2019. In this initial application of an explainable classification method in this domain, the three main categories of violations (undeclared work, underdeclared work, and other infringements) were united in one, the infringement class (INFR); thus, the dataset was transformed into a binary (INFR/NO_INFR), and a relatively balanced one. The study was analysed per the CRISP-DM methodology [
22], and the produced model accomplished an overall accuracy of over 65%, while also extracting interesting knowledge related to patterns of labour law compliance and noncompliance.
Yet, having all the violation types merged into one, the above study did not provide focused knowledge on the feature patterns associated specifically with undeclared work, nor any classification model distinguishing between the infringement categories. This deficiency prompted us for extended research [
23], using two types of datasets: the same binary as above and the corresponding four-class dataset preserving the initial four-categories labelling based on the inspection findings. The application also embedded two different AC algorithms, CBA and CBA2 [
24]; consequently, four distinct classifiers were generated and assessed per their prediction performance and knowledge provision. CBA2 is an enhanced version of CBA that deals with the class imbalance problem by splitting the user-defined minimum support value to the different classes according to their distribution in the dataset, hence allowing CAR generation for the minority classes, while also preventing redundant CAR generation for the majority class. This detailed application study followed the data mining project analysis phases per the CRISP-DM methodology in the business environment of a public authority responsible for facing undeclared work, the Hellenic Labour Inspectorate. It concluded by identifying different preferable models, one for maximum prediction yields, trained by the binary dataset, and one for providing focused insights per type of violation, trained by the four-class dataset.
This research also unveiled that the models generated using the dataset of four classes, one of which is undeclared work with a ratio of 4%, missed identifying those rare instances of unregistered employment adequately. The causes of this low performance in undeclared work prediction are identified in class imbalance and class overlap phenomena existing in the data space with a non-neglecting ratio.
Class imbalance is a usual problem in machine learning when actual data are used for training, where often the instances of one class, the majority class, predominate the instances of the other classes (minority classes), thus impeding the learning process and introducing a predictive tendency for the majority class [
25,
26]. In the application domain of undeclared work prediction, datasets of past inspection visits naturally display a considerable imbalance concerning undeclared work [
20,
23], since this unlawful phenomenon is multifaceted and not easily detected in onsite checks, and due to the authorities’ limited resources, only a small percentage of businesses is inspected [
4]. However, in machine learning applications, when the class of interest is the minority class, such as in fraud detection systems [
27], intrusion detection [
28], and undeclared work detection [
23], predictive models favouring the majority class may bring adverse outcomes.
In addition, the prediction performance may further worsen if there are a considerable number of class overlaps in the dataset, i.e., data instances with the same or similar features but belonging to different classes, issuing the so-called class overlap problem [
29]. In this application domain, using datasets with details of past inspections, class overlaps are expected to exist in the dataspace, since several actual checks with similar features may often conclude with different findings. When class imbalance and class overlap coexist in the dataspace and no actions are taken to deal with them, the produced predictive models prove poor performance [
23,
30,
31].
Our latest research [
32] focused on addressing these issues by following approaches at the data level [
26] before building the classifiers. We used the same data of actual past inspections as in [
20,
23]; still, the dataset was here differently structured, with each tuple corresponding to an inspection case, and not to an inspection discovery, ending up containing, finally, 16.7 K inspection instances (an inspection may conclude with several findings). We applied three different data engineering techniques, in isolation and combination, generating several classifiers assessed in predicting undeclared work. We used again the CBA algorithm [
21], that we also applied in [
20,
23], to enable the comparison of the produced prediction performance results with the previous studies and the identification of the impact of the suggested approaches on the models’ predictability. This study proved that applying data engineering methods to solve the class imbalance and class overlap problems highly enhanced the efficiency of the classification models, raising the ratio of undeclared work prediction (recall) to more than 70% and still preserving the overall accuracy at 70%. In addition, with less imbalanced datasets of undeclared and underdeclared work, the models managed to predict more than 75% of the cases with violations.
The current research paper constitutes an extensive study of the latest one [
32], further examining the challenges of class imbalance and class overlap in the application domain of undeclared work prediction by focusing and operating on the data and modelling levels.
We suggest and apply four different engineering techniques on the data level, starting with the complete initial dataset. By setting the target group of violations, we employ data reduction to create a separate binary final dataset per targeted group of infringements. In this way, we transform an imbalanced multi-class dataset into several binary datasets on the grounds of the decision-makers’ targets, thus enhancing the models’ predictability and eliminating the overlaps among the violation classes. Following this, we implement class overlap removal (COR) in the binary final datasets to deal with overlaps between the opposing classes, in isolation or combination with a data balancing method, random oversampling (ROS), or random undersampling (RUS) to handle the disparity between the class of violations and that of no infringements.
On the modelling level, we implement three AC algorithms, the CBA and CBA2, as used in [
23] for results comparison, and the Classification based on Predictive Association Rules (CPAR) [
33], an AC method that was not exploited before in this domain. CPAR utilises a greedy algorithm to generate rules directly from the training dataset instead of generating large candidate rules from frequent itemsets, as in the other two AC methods [
34]. It is implemented here to assess its outcomes and sensitivity in class imbalance and class overlaps in this domain.
Multiple classifiers are built by combining the different modelling and data engineering techniques, tested, and evaluated for their predictability in this domain. In addition, this research study sheds light on the interpretability aspect of the produced results at both the global and local levels [
9,
35,
36], as well as the adaptability of the suggested approaches in the business environment of an enforcement authority in charge of facing undeclared work.
The present study proves highly significant in multiple ways, mainly because (i) it demonstrates the application of one more AC method (CPAR) not used before in this application domain, (ii) it completes the research of our previous studies by illustrating through experimentation with actual data all combinations of the suggested data engineering and modelling techniques, thus enabling comparison and discussion of the results, and (iii) it also examines in detail the interpretability and adaptability aspects of the recommended approaches, which are highly significant when adopting machine learning techniques in a public institution environment.
2. Materials and Methods
2.1. Problem Description
As discussed, the application domain of the current study is the labour inspectorate, and the objective is to predict undeclared and underdeclared work using machine learning methods aiming to achieve high predictability, interpretability, and adaptability in the business environment of the enforcement authority. While undeclared work refers to work completely unrecorded and concealed from the state, underdeclared work concerns partially recorded labour, usually taking two forms; with fewer recorded working hours than actually performed and/or with less reported wages than in reality paid. This research focuses on addressing these two most severe types of infringement under labour relations law and uses data coming from the Hellenic Labour Inspectorate (HLI), yet the suggested approaches may well be applied to other kinds of violations, exploiting data from other enforcement authorities, such as the social security institutions or tax authorities.
The HLI is organised in 125 local offices countrywide and its central offices in the capital. It employs around 700 labour inspectors assigned with several duties, including onsite inspection visits, labour disputes mediation, advising employers and employees on applying labour law provisions, and investigation of work accidents. One of its primary tasks is to deal with undeclared and underdeclared work around the country, whose labour market consists of about 340 K companies and 2.1 M employees, significantly increasing in the summer months and displaying a large diversity in the different districts. Around 35 K inspection visits are dedicated to protecting employees’ rights against these two illegal practices, and the selection is usually random or relies on filed complaints.
The inspectorate owns a risk assessment tool, which is a subsystem of its integrated information system, for inspection targeting and monthly planning, yet it is not often used for two main reasons; first, based on red flag indicators user-specified, it needs manual configuration and continuous update, which can be performed only at the central offices and by labour inspection and risk analysis experts; this task requires devoted and experienced analysts being in often contact with the local labour inspectors countrywide to achieve proper feedback collection and efficient tool configuration, which is not always feasible. Secondly, and as a result of the first deficiency, local labour inspectors are uncertain and distrustful in following a tool’s suggestions when being mostly excluded by its configuration process and unaware of its specific features leading to its outcomes.
The inspection authority also owns the ERGANI information system, where all companies are obliged by law and on due dates to declare all their employment data and any changes made before these are applied. Labour inspectors have access to its data, which they may examine before, during, or after an inspection visit. However, investigations are made case by case, and no automated mechanism is available to identify and offer hints on high-risk businesses for targeted inspections.
Concluding the above, and given the availability of adequate and relevant data resources, applying innovative data analysis and machine learning methods for efficient inspection planning and meaningful knowledge provision rises as the optimum solution for achieving increased overall productivity and successful allocation of the inspectorate’s resources.
2.2. Data Sources and Preprocessing
The present research study uses the data collected and appropriately integrated after a thorough investigation into the business needs and available data sources of the HLI, going through the business understanding and data understanding phases per the CRISP-DM methodology, extensively explained in [
23] and summarised here for completeness.
As previously discussed, the HLI offers, through the ERGANI, digital services to employers to obligatorily use for all kinds of employment declarations, such as commencements and terminations of labour contracts, working day and hour schedules, annual leaves, overtime, etc. The labour inspectors investigate these declared employment data during or after an onsite inspection and, based on their findings, may ascertain labour law violations, such as undeclared or underdeclared work. Thus, since 2013, when this information system was established, it has gathered large volumes of valuable data on registered employment in the labour market countrywide.
Meanwhile, through its integrated information system (IIS), the HLI digitalised all its internal functioning, including registering and monitoring the inspection cases at the inspections subsystem. Hence, since 2018, when it was formally applied, all labour inspectors are mandated to record all their inspection details in the system and monitor their cases until they are finalised. In addition, one of the HLI internal processes is handling the complaints received through different channels; these are all recorded into the IIS and forwarded to the appropriate local labour inspection department for further examination and inspection planning.
Integrating inspection data with other details made known to the inspectorate before the inspections are performed, such as company characteristics and registered employment data coming from ERGANI, may well form a dataset, which, when labelled per the inspection discoveries and analysed with machine learning techniques, may provide predictions for future inspections and extract patterns linked with specific violations.
Following this approach and after the appropriate data cleaning and anonymisation, i.e., omission of records with no data at crucial features and exclusion of all features related to the identification of inspection cases, companies, or branches—such as case ID, tax number, name, address, etc.—we concluded with a dataset of 25 features. Subsequently, and in close cooperation with domain experts, we proceeded to a meticulous feature selection and feature construction based on their importance and relevance to the findings of an inspection, ending up with the set of 12 features illustrated in
Table 1. For those taking numerical values, their range was discretised. For those taking values from a large set of categories, these were aggregated in fewer groups, ending at the categorical values per feature, as shown in the table. The last column illustrates the ratio of the number of records in the whole dataset with this categorical value at the specific feature. These steps relate to data preprocessing, a crucial stage in the data mining process, and require specialised knowledge in the application domain to lead to meaningful machine learning outcomes and avoid overfitting.
Data preprocessing also includes data selection as per the objective of the application. Taking into account the diversity in the labour market affected by several locality and seasonality factors countrywide, as well as the hidden and multi-faceted nature of undeclared work, the dataset to be used for classification training should not include all the performed inspections by the HLI throughout the years because it would lead to generating models offering predictions based on the most dominating patterns of violations, thus still keeping the undeclared work concealed.
Under this given, for the purposes of experimenting with machine learning in this domain, the initial dataset is constructed to include the labour inspections performed in Attica in 2018–2019, counting in a total of 16,718 cases, hence studying undeclared work prediction in this district and period. Data from 2020 and thereafter were excluded from the dataset because employment was severely affected by the COVID-19 pandemic crisis, yet it is a factor falling outside the research of this study.
Consequently, each tuple in the initial dataset of
Table 1 corresponds to an inspection case performed in Attica in 2018–2019, with its features including the time zone and day and its trigger to be either a complaint or monthly plan. The inspected business’ characteristics comprise its legal form, economic sector, and the region of Attica where it is established. Additionally, the employment details of the inspected workplace include the size based on the number of employees, the type of employment as per the average weekly working hours, the payment level as per the monthly average wage, and the frequency of working schedule changes calculated averagely per employee and based on the declared changes in ERGANI in the last semester before the inspection visit. The past compliance of the inspected workplace is a constructed feature to indicate if and at what level prior inspections later affected the reviewed business’ level of labour law compliance. It is calculated as the ratio of past violations, if any, to the total past inspections, if any. Last, the outcome of the inspection case is registered, which can be with no infringements, or it can take values among undeclared work, underdeclared work, other infringements, or a combination of them, i.e., it is defined by one of the eight distinct categories of inspection findings as described in
Table 1.
Hence, by completing all the data collection, integration, and preprocessing steps, which include data selection, cleaning and anonymisation, feature selection and construction, and data discretisation and aggregation, we conclude with the dataset of
Table 1, which is well-structured and contains a considerable number of inspection cases for models to learn from, yet it cannot be used as-is for classification training.
Indeed, if we take the findings feature as the class, since this is the characteristic that we wish to predict, and we use this dataset to train classification models, the produced classifiers would be of poor prediction performance for several reasons. First, it contains many (eight) class values, i.e., the categorical values of the findings feature; second, most of these values are severely underrepresented; third, it conceals multiple overlaps among the different classes. As also seen in [
23], these three primary dataset deficiencies impede the machine learning process and generate poor classifiers; hence, we focus on addressing them by applying the techniques described in the following paragraphs.
2.3. Target Setting and Data Reduction
The first method applied to deal with the initial dataset complexity and handle uneven class distributions and class overlapping relates to data reduction reasoning, i.e., eliminating data irrelevant to the machine learning goal. To be reminded that the aim, in this application domain, is to effectively predict undeclared work and other labour law violations and then plan onsite inspections. Thus, all the violation types may be considered interesting for prediction by the authority. However, since the training of only one classification model with a dataset containing all infringement categories with irregular dispersion and overlaps proves inefficient, several different smaller and simpler datasets can be generated per type of violation that the inspectorate aims to address; hence, subsequently, simpler and more effective classifiers can be constructed.
Thus, by proceeding with target setting and data reduction, we practically reduce the data space and select that part that is relevant, each time, to the target of the inspections to be performed. In other words, for each different violation or group of violations the inspectorate wishes to target using deterrence or preventative measures, a separate final dataset is constructed to contain only those past inspection cases that discovered at least one of the target violations and be labelled as positives (P), and those past cases that found the inspected company compliant with the labour law provisions and be labelled as negatives (N). Following this approach, we aim at building a distinct classifier, using each of these final datasets, to identify the riskiest businesses for these violations.
In the present study, we are interested in undeclared and underdeclared work prediction, and for the purposes of testing and evaluation, we create three different final datasets: one for undeclared work, one for purely underdeclared work, and one to target both of these violations. Thus, we isolate from the initial dataset the inspection cases that discovered, among others, undeclared work to form the UDW group, those that discovered underdeclared work to build the UNDER_DW group, and those that revealed at least one of the two to create the UDW-or-UNDER_DW group; the cases that found no violations are gathered to the NO_INFR group. All data-instance groups and their ratios per feature value are illustrated in
Table 2, where multiple preliminary understandings can be derived.
By uniting each of the first three violation groups of
Table 2, whose instances are labelled positive, with the fourth group of cases with no violations, whose records are labelled negative, three final datasets are built; the UDW dataset with 9989 records, the UNDER_DW dataset with 14,873 records, and the UDW-or-UNDER_DW dataset with 15,321 records.
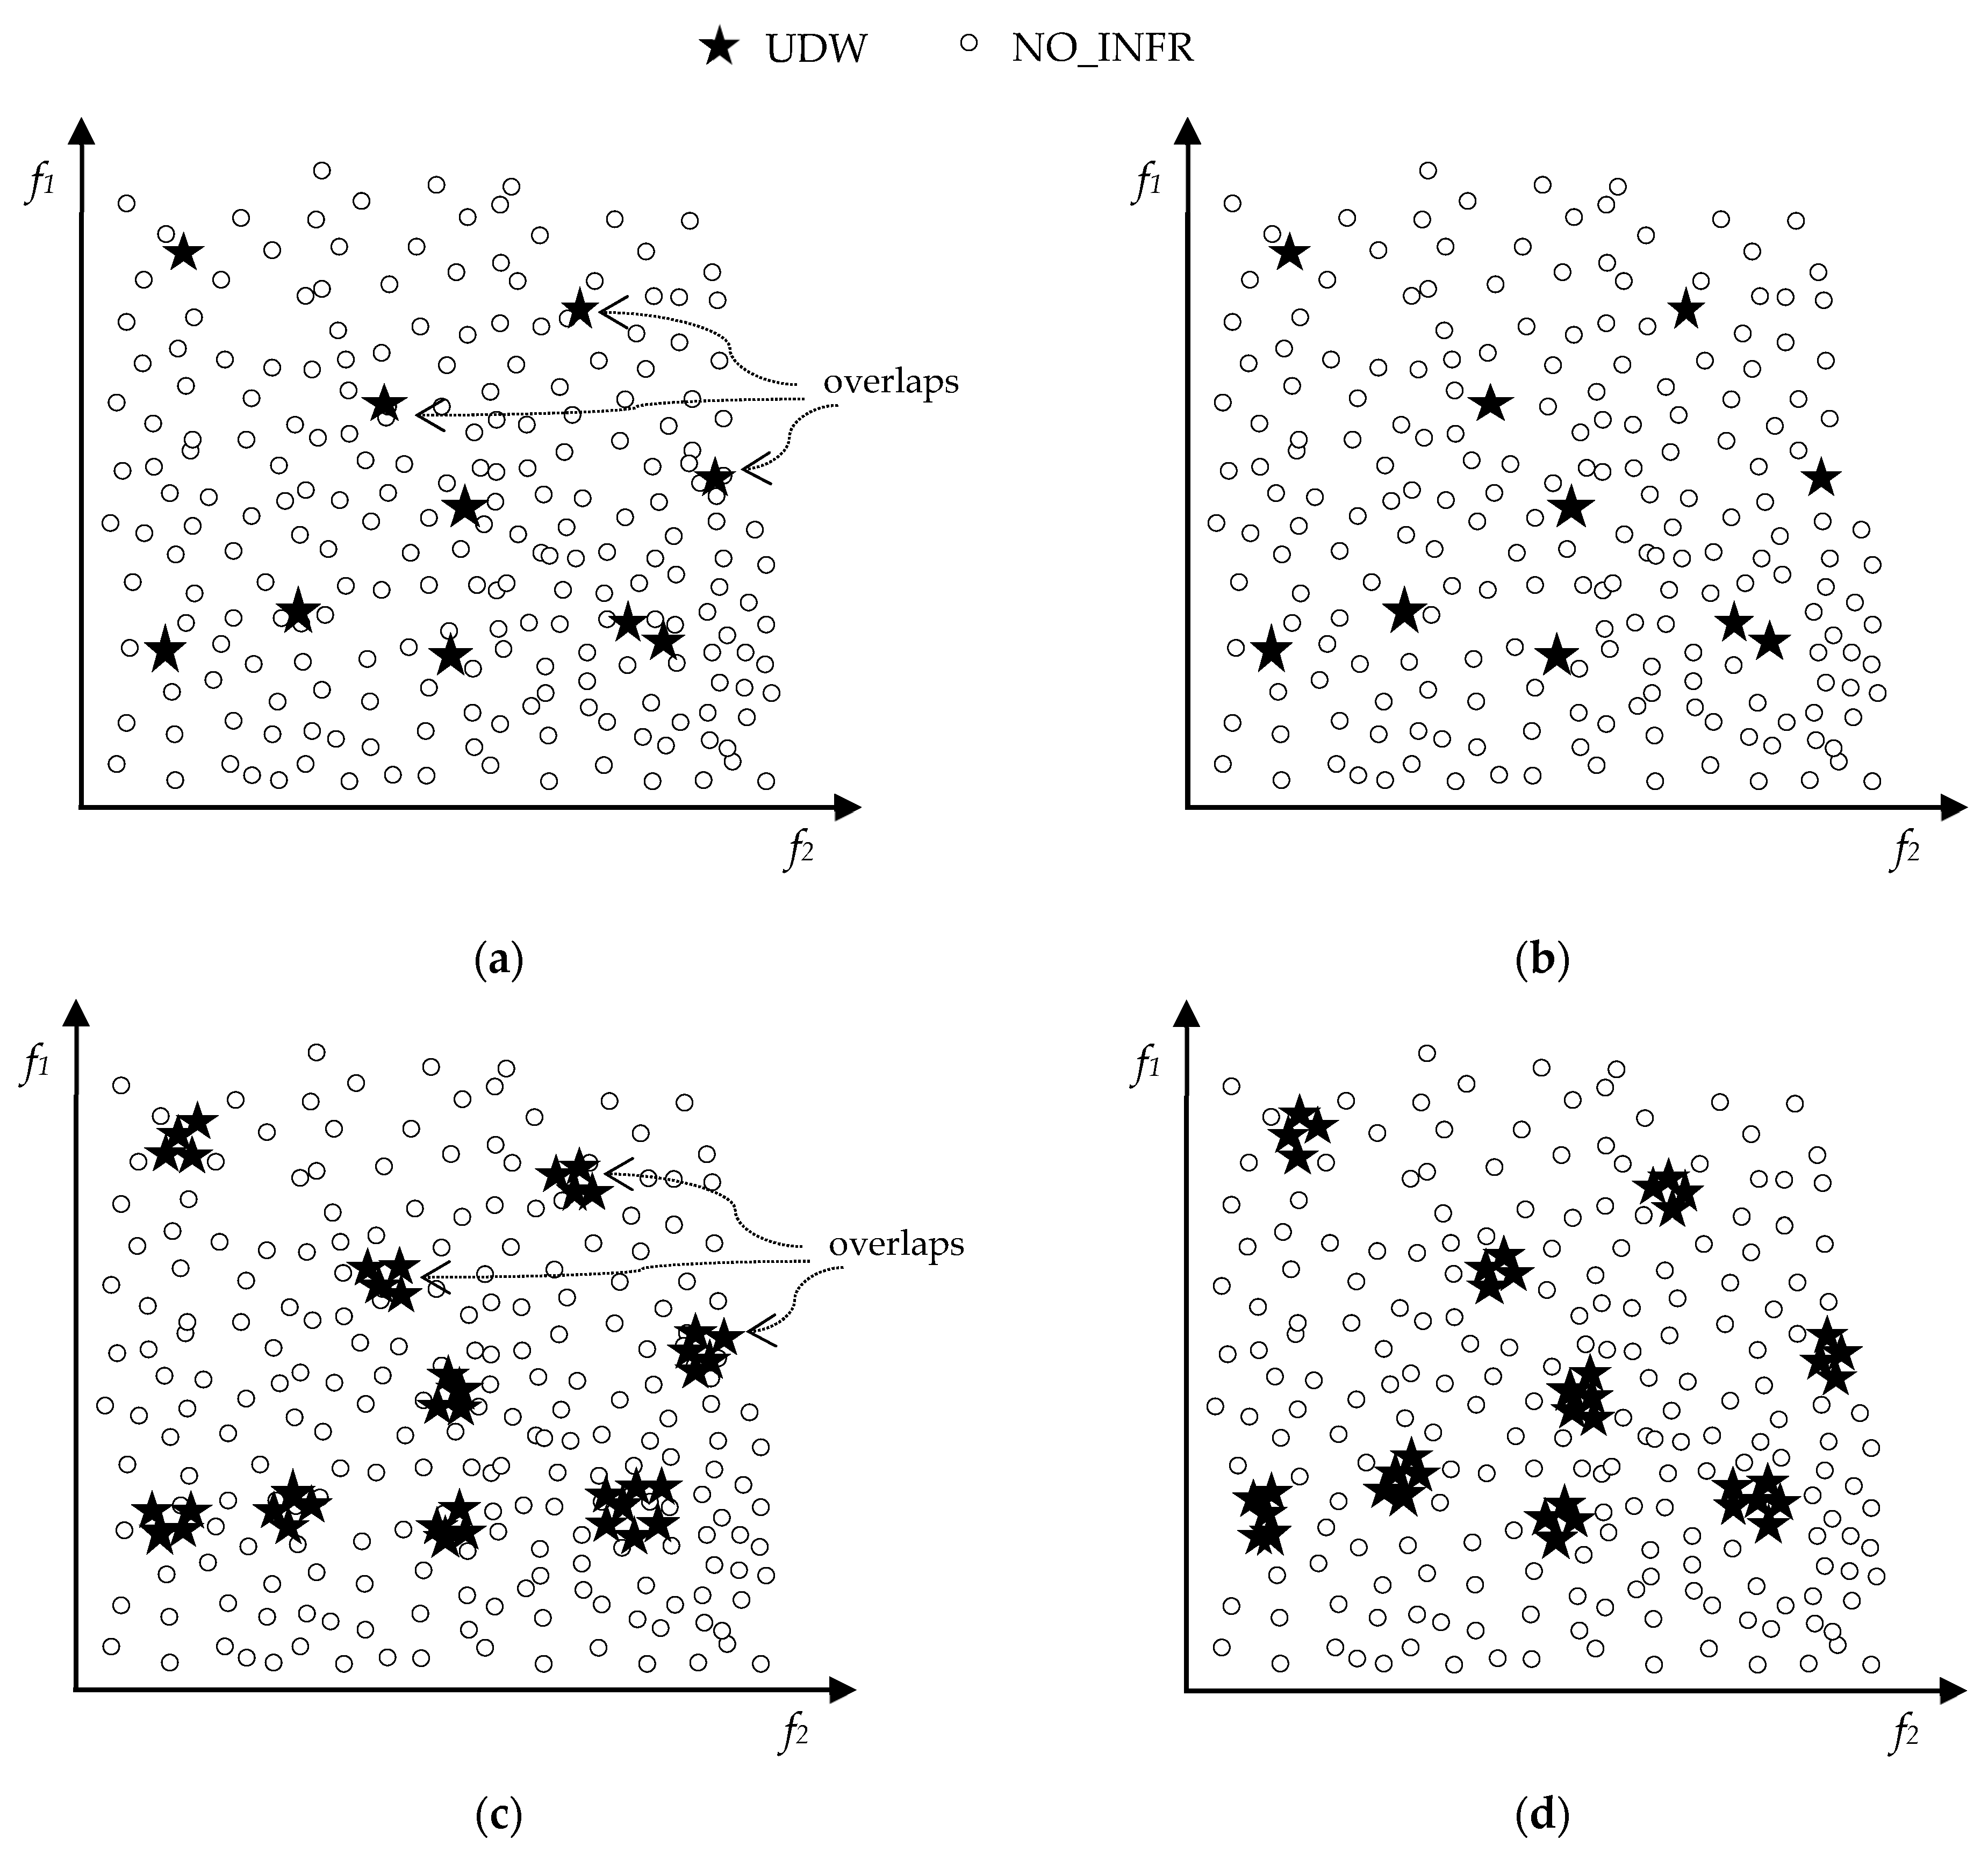
Figure 1a illustrates the class distribution of the initial dataset in the dataspace, where it is perceived that learning can be severely hindered by the obstacles we previously discussed.
Figure 1b–d display the class distributions of the above final datasets.
As also observed in the figures, by applying targeting and data reduction, multi-class datasets are transformed into several binary ones on the basis of the infringements to be targeted, also achieving exclude overlaps among the different violation types. Yet, class overlap and imbalance issues still exist in the produced binary datasets.
Table 3 presents the rate of class imbalance and class overlap in the final datasets. The UDW dataset displays a considerable imbalance as regards undeclared work (5.29%), whereas, in all datasets, the overlap ratio, i.e., the percentage of negatives falling on positives, is non-neglectable, reaching more than 25%. To address these two machine learning obstacles and assist the generation of efficient classifiers, the following two data sampling approaches are proposed, which are applied in isolation and in combination in this study to evaluate their results in increasing prediction performance. Data sampling should be implemented only in the training part of the data, which is used to produce the classification models, whereas the testing instances should remain unchanged to avoid the data leakage phenomenon and extracting misleading and too optimistic prediction results.
2.4. Overlaps Handling
In application domains where the cost of misclassifying positives (minority class instances) is significantly higher than the cost of misclassifying negatives (majority class instances), class overlap existence in the dataset may result in models with low efficiency. Even more so in imbalanced datasets, where several negatives may fall over the rare positives in the dataspace, the classifiers trained with this dataset will probably have difficulty predicting future positive cases correctly.
In such situations, we need to create well-recognised class clusters in the training dataspace that can lead to generating explicit CARs and robust models with improved predictability. Thus, to foster the prediction of instances we especially wish to identify (the positives), we remove from the training data the less interesting cases (the negatives) that fall over them; i.e., when the testing and training samples are defined, and before the classifier is built, the class overlap removal (COR) function examines the training sample, and if it identifies two data instances as having the same value at all the features but belonging to opposing classes, it deletes from the training dataset the one labelled as negative. Even when several negative data instances have the same characteristics with one positive in the training sample, they are all removed, leaving only the positive case existing in that particular area of the dataspace, hence assisting the classification model recognising this area as positive.
Following this approach, the training data class distribution of the imbalanced UDW dataset displayed in
Figure 2a is transformed into that of
Figure 2b. Negatives that overlap positives are eliminated, and the learning process may now be more effective with respect to predicting undeclared work.
2.5. Data Balancing
Handling overlaps between negatives and positives may be combined with a data balancing technique to deal with the class imbalance issue. As observed in
Figure 2b, the few positives are now clearly ‘seen’ in the dataspace, yet the negative class is highly dominant and may affect the classification training and the generation of an effective model. Hence, balancing the training data shall increase the produced classifiers’ predictability of the positives.
In this research study, we employ two simple methods to obtain balanced training data, random oversampling (ROS) and random undersampling (RUS) with replacement. ROS suggests adding to the training data copies of randomly selected data instances from the minority class, while RUS refers to deleting from the training data randomly chosen majority class records. Both approaches aim at adjusting the training data class distribution to a user-defined balance and assist the machine learning process. They are implemented here to achieve an equal distribution of positive and negative training data samples for testing and assessment purposes.
Figure 2c,e illustrate the class distribution in the data space when ROS and RUS are applied correspondingly. If COR is also employed, which should be implemented before ROS or RUS, the dispersion of the classes in the training data is represented in
Figure 2d,f accordingly.
2.6. Modelling
As discussed, in the present research, we engage associative classification to build the classification models. AC was initially selected for application in this domain for two main reasons; first, several studies [
33,
37,
38] evidenced that AC models achieve increased predictive accuracy than other interpretable machine learning methods, such as rule induction [
39,
40] and decision trees [
41,
42]. Indeed, AC can reveal further hidden knowledge often missed by other classification techniques due to its practices in extracting associations between feature values and classes. Secondly, interpretability is, as explained, of principle significance in this domain. AC generates models consisting of simple, of the type if-then, rules that are conveniently understandable and manually updated, if need be, by the domain users [
37].
AC algorithms operate in three main phases; rule discovery, rule sorting and pruning to generate the classifier, and testing set prediction to evaluate its effectiveness [
37]. Several algorithms exploit different methodologies at each step to improve their predictability. This research study tests and assesses the application of the CBA [
21], CBA2 [
24], and CPAR [
33] algorithms in the domain of undeclared work prediction, with their parameters setting to follow the authors’ recommendations.
CBA was used in [
20,
23,
32] and CBA2 in [
23]; hence, they were also applied here for results comparison and to enable distinguishing the prediction improvement brought by the suggested approaches. CBA was one of the first research studies that utilised ARM [
19] for classification purposes, employing the Apriori algorithm for rule generation. Rule sorting is based on confidence, support, and the length of the rules’ antecedent. Rule pruning uses the database coverage method that also includes a default class at the end of the classifier. Last, class prediction in CBA is based on one rule, the highest sorted rule that matches the test case body [
37]. CBA2 is an enhanced version of CBA, as regards the class imbalance problem, differentiating only at the learning phase where the user-defined minimum support threshold is distributed to the different classes according to their frequency in the input dataset. CPAR, however, follows completely different techniques at all AC stages. In rule generation, it utilises an improved adaptation of the FOIL [
40] algorithm, a greedy approach that generates rules directly from the training set [
33,
34]. In addition, it uses the Laplace accuracy measure for rule evaluation and pruning, as well as for class assignment to the test cases during prediction. CPAR generates much smaller classifiers than other AC algorithms [
33]; yet, it proves, through various experimentations [
33,
37], that it is highly competitive concerning predictive accuracy compared to, e.g., CBA, hence its involvement in the present study. Using these three distinct AC algorithms in combination with the six types of training data class distributions, as illustrated in
Figure 2, we produce eighteen different classification models per each final dataset (
Figure 1b–d) and evaluate their prediction performance. Thus, in total, fifty-four models are created and assessed, as presented in the next section.
2.7. Performance Evaluation Metrics
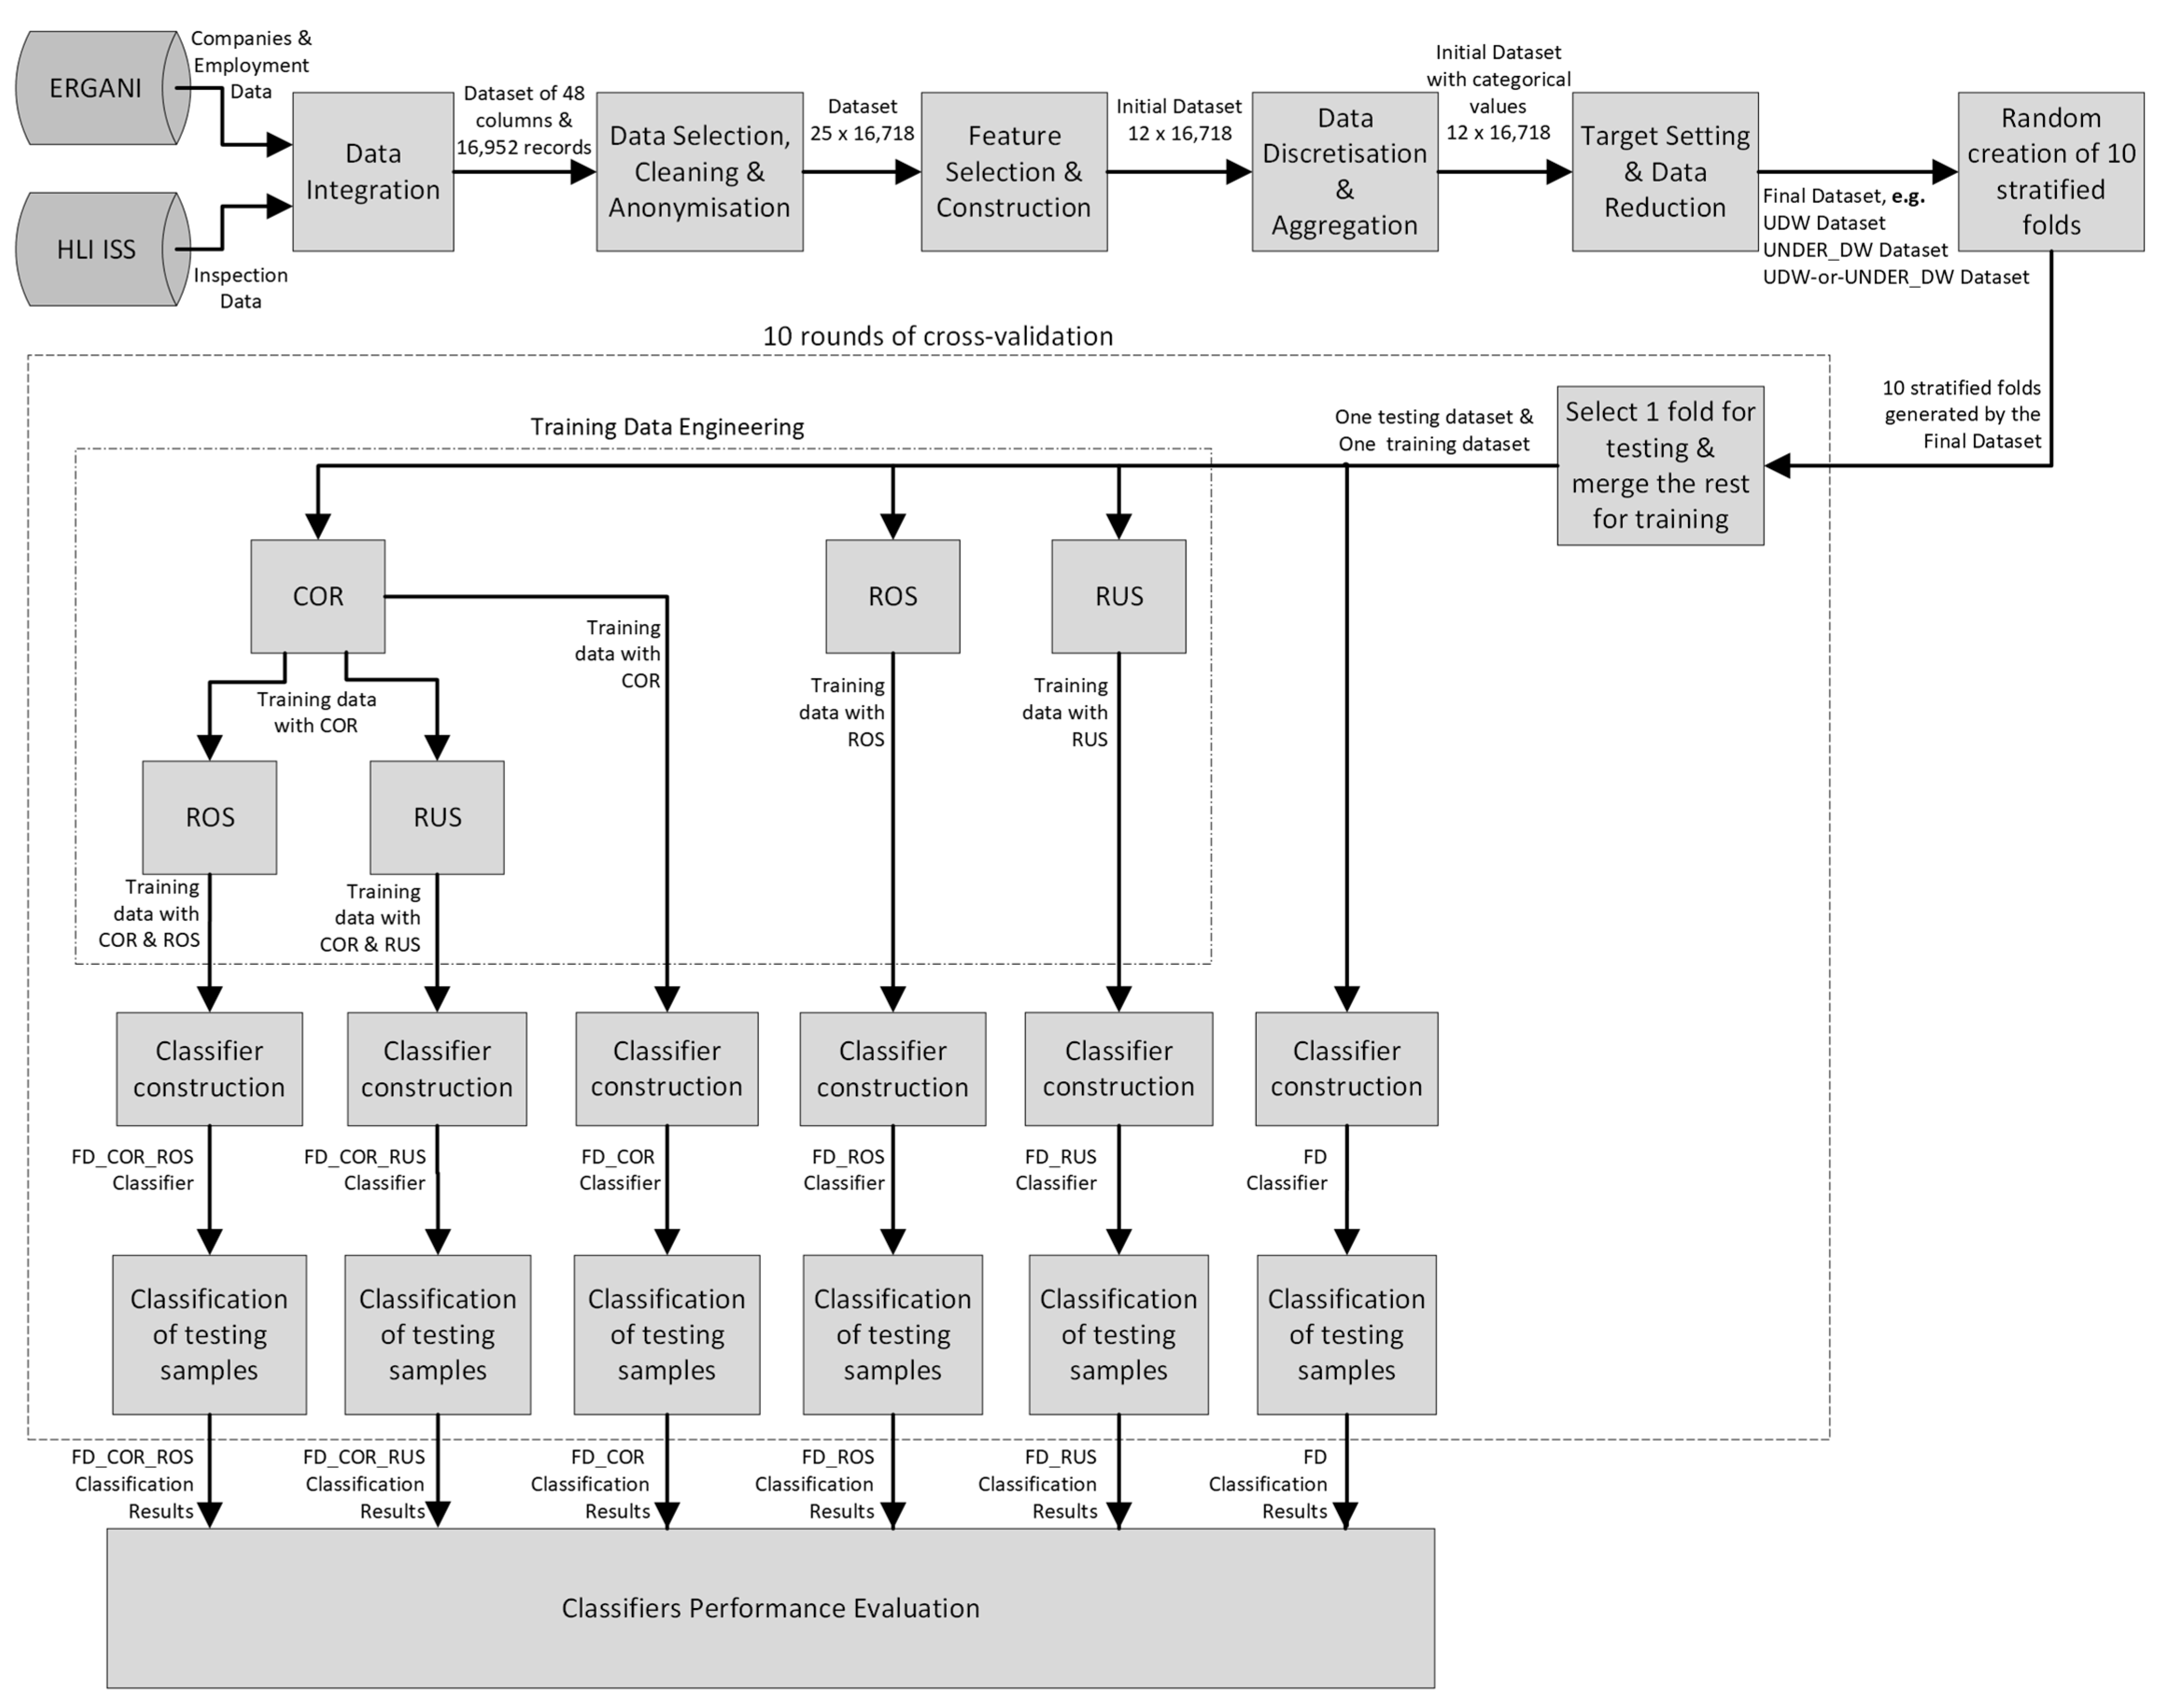
To train and test each of the classifiers, the stratified 10-fold cross-validation method is followed, which divides the input data into ten stratified folds, with each fold maintaining the class distribution of the input dataset, and uses the nine folds for training and the tenth fold for testing. As explained, the data sampling techniques, COR, ROS, and RUS, are applied only in the training part of the data, i.e., the nine folds, keeping the testing fold unaffected.
The process iterates along the ten folds, employing each time a different fold for testing, i.e., another 10% of the data sample is classified by the model trained by the remaining 90% of the sample; thus, in the end, classification results are collected for all the instances of the input dataset and depicted in the confusion matrix of
Table 4. True positives (TP) represent the positives (inspection cases with violations) correctly predicted by the model, while false negatives (FN) refer to their misclassifications. Similarly, true negatives (TN) are the negatives (inspections with no infringements) correctly identified by the classifier, whereas false positives (FP) correspond to their misidentifications. In addition, there can be cases of data instances remaining unclassified when the applied AC algorithm does not include a default class in its classifiers, such as CPAR. Hence, we denote UNP and UNN the unclassified positives and negatives accordingly.
The confusion matrix values may be used to calculate various performance evaluation metrics, enabling the comparison between the produced classifiers and, also, with the results of the previous studies [
23,
32].
In the research area of classification problems and techniques, numerous and diverse assessment metrics are proposed [
43], of which, the most used and easily perceived are employed here.
First, accuracy (
Acc) (1) refers to the total prediction accuracy of the model, considering both the prediction correctness of positives and negatives, and is calculated as the ratio of correct classifications to the total instances.
Yet, when highly imbalanced datasets are involved, accuracy can be misleading when it may still offer very high yields, while the minority class remains hidden. Thus, two other metrics are considered, focusing on the minority class; precision (
p) (2), which is the ratio of positives correctly classified to all predicted positives and indicates the model’s exactness,
and recall (
r) (3), which is calculated as the ratio of positives rightly predicted to all actual positives, revealing the model’s completeness,
Precision and recall are complementary parameters; thus, we also utilise the weighted harmonic mean of these,
Fβ-score (
Fβ) (4), where
β is defined by the user indicating the weight (importance) of recall in comparison to precision, in the domain of application.
Last, specificity (
s) (5) refers to the prediction of negatives and is calculated as the ratio of correctly identified negatives to all actual negatives, i.e.,
Last, before we proceed with the performance assessment calculations, the β factor of the Fβ-score must be defined for the current application domain. With respect to this, one needs to consider the cost of misclassifications for the inspectorate of positives and negatives.
False negatives correspond to inspection cases revealing violations, but the model fails to predict them as such; on the contrary, it classifies the cases as “labour law compliant”, i.e., with no infringements. In such events, the inspectorate does not proceed to perform onsite inspections, but it allocates its resources toward checking other, predicted as riskier, businesses. Hence, it fails to detect these violations, leading to several negative consequences, such as, among others, significant losses in state revenues.
On the other hand, false positives refer to negative cases that are wrongly predicted as positives, thus triggering unnecessary onsite inspections, which, cost-wise, may be seen as human and financial resources of the inspectorate being wasted inefficiently. Thus, false negatives, in comparison to false positives, are a lot costlier for the state and society, leading to the pursuit of higher recall yields than precision.
Thus, based on the severity of each targeted group of violations, we define β to be five for undeclared work (UDW), three for underdeclared work (UNDER_DW), and four when targeting both (UDW-or-UNDER_DW).
Concluding with the methodology,
Figure 3 illustrates all the steps followed in this study, starting with data collection and ending with the performance evaluation of the models.
3. Results
3.1. Classification Results
As described in
Figure 3, six classifiers are produced correspondingly to the six different training data class distribution approaches using the same final dataset and AC algorithm, as summarised in
Table 5. The first is the final dataset, produced from the initial dataset after the target setting. The rest are combinations of the data engineering methods COR, ROS, and RUS, as described in the previous section.
For each of the three final datasets, UDW, UNDER_DW, and UDW-or-UNDER_DW, by combining the three AC algorithms of
Section 2.6, i.e., CBA, CBA2, and CPAR, with the six different training sample class distributions of
Table 5, eighteen models are produced using LAC [
44], an associative classification java library. Their classification results are gathered and presented in the confusion matrixes illustrated in
Table 6,
Table 7 and
Table 8 correspondingly.
Several preliminary conclusions may be derived by examining the results in
Table 6,
Table 7 and
Table 8, identifying the most effective combinations of algorithms and training data sampling methods in increasing the true positives. However, for a thorough evaluation analysis, the performance evaluation metrics given in
Section 2.7 are calculated and presented in the following subsection, while, at the same time, various application domain aspects are considered.
3.2. Performance Evaluation Results
Table 9,
Table 10 and
Table 11 illustrate the prediction performance measurements of all the models coming from the different combinations of the three AC algorithms and six data engineering methods using the three final datasets. They are calculated using the values in
Table 6,
Table 7 and
Table 8 correspondingly.
In
Table 9,
Table 10 and
Table 11, the highest values per performance evaluation metric are identified in bold, where one can realise that accuracy, precision, and sensitivity favour different models than recall and F-score. For instance, when targeting undeclared work (
Table 9), the classifier generated by CBA2 with no engineering in training data (FD) achieves the highest accuracy, reaching 94.78%, precision at 58.97%, and sensitivity at 99.83%. However, it identifies only 4.36% of the cases with undeclared work (recall) and proves completely inefficient. Thus, for the reasons we explained previously, we mainly focus on the recall and F-score metrics to identify the most effective models per final dataset.
For undeclared work prediction (
Table 9), the model produced by CBA and trained with RUS proves to be the most successful, identifying more than 70% (
r) of the undeclared work cases while still attaining an overall accuracy and sensitivity near 70%. This is considered a significantly improved performance by the domain experts because, in practice, if this classifier were used for planning inspections against undeclared work, it would trigger only 32.48% of the total inspection cases (
TP +
FP) to reveal 70.45% of the existing undeclared work, raising the inspection yields (
p) from the current ratio of 5.29% to 11.46%. Additionally, compared with the results of undeclared work prediction (
r) by the CBA and CBA2 models trained with the four-class dataset in [
23] being near 0% and 7.5%, respectively, the outcomes of the suggested approach to deal with class imbalance prove substantially improved.
Meanwhile, we should not neglect the performance of the CPAR algorithm in comparison with the other two when no data engineering is applied (FD) for undeclared work detection. Indeed, even in such a highly imbalanced dataspace (UDW) with more than 25% overlaps, this algorithm proves to perform well, identifying more than 41% (r) of the undeclared work cases while activating only 13.35% of the total inspections, thus tripling their gains to more than 16% (p). Conversely, CBA and CBA2 face difficulties with the class imbalance and display a disappointing prediction performance until this issue is solved, whereas eliminating the class overlap does not seem to improve the performance.
When less imbalanced datasets are involved (
Table 10 and
Table 11) and no sampling methods are applied to handle class imbalance and class overlap (FD), CPAR again demonstrates a considerably improved performance compared to CBA and CBA2 in terms of predicting the cases with violations, succeeding to identify around 47% of them while keeping the precision to decent levels: at 53% for underdeclared work (
Table 10) and 56.7% when both infringements are targeted (
Table 11). CBA and CBA2 models, in these cases, trigger a small number of inspections whose accuracy, though, is very high, up to more than 67%, with the CBA2 model offering slightly increased yields compared to CBA. However, these models do not manage to identify a competent number of existing violations, discovering only around one-third of them. This deficiency originates, as verified, from the class overlap issue, which, when handled (as in FD_COR models), boosts the recall ratio to more than 76%, while maintaining the overall accuracy on average to 59–60%.
More specifically, when focusing on underdeclared work (UNDER_DW final dataset) or both undeclared and underdeclared work (UDW-or-UNDER_DW final dataset), the application of CBA using training data with no overlaps (FD_COR) produces the classifiers that identify most of the actual cases with violations, accomplishing a recall of 76.37% and 80.05%, accordingly. In this case, the success ratio (precision) rises from the present 36.39% (
Table 3) to 45.97% (
Table 10) for underdeclared work and from 38.25% (
Table 3) to 46.81% (
Table 11) for both violations. In the meantime, it is demonstrated that applying oversampling and undersampling techniques (ROS and RUS) does not enhance the models’ prediction performance. Last, comparing these performance results for detecting underdeclared work with the outcomes of the CBA and CBA2 algorithms trained with the four-class dataset in [
23] achieving a recall of 34.64% and 39.98%, respectively, one can recognise the substantive improvements of the proposed methods even when less rare (than undeclared work) violations are targeted.
Concluding, when highly imbalanced datasets are involved, such as the UDW with the minority class reaching only 5.29%, even if class overlaps coexist in the dataspace, it is the imbalance issue that mainly affects the CBA and CBA2 classifiers performance. Once RUS is applied, these models reach maximum recall.
On the other hand, as regards the other two less imbalanced datasets, it is the class overlap that impedes the CBA and CBA2 learning process, which is remarkably improved when the negatives falling on positives are eliminated from the training data. If balancing techniques are applied in such datasets, no further enhancements are observed.
Contrarywise, CPAR operates differently from CBA and CBA2 at all associative classification stages, hence its disparate behaviour per final dataset and data engineering method. As discussed, CPAR is not so sensitive to class imbalance and class overlap. It performs satisfactorily well, even with significantly uneven class distributions and/or a considerable ratio of overlaps. Yet, to maximise its prediction efficiency, it needs the application of both COR and RUS for the UDW dataset, whereas only COR is necessary for the other two final datasets. Compared to CBA and CBA2, though, when the appropriate data engineering methods are employed, CPAR is less successful in predicting violations.
3.3. Models Explainability
As initially discussed, being able to understand and interpret the outputs of a machine learning model is of major significance in the present application domain because, first, it will enhance the labour inspectors’ knowledge about the most predominant attributes highly connected with each type of violation and, secondly, it will build their trust in the model’s suggestions for onsite inspections.
In the current study, we integrate approaches to support the models’ explainability on two levels. In data preprocessing, through cooperation with labour inspection experts, we create a set of domain-identifiable qualitative features taking values easily perceivable to the labour inspectors. Additionally, in modelling, we use associative classification algorithms, creating white-box models consisting of class association rules (CARs) of the if-then form that provide understandable results for experts in the domain. These approaches foster the interpretability of the produced classifiers at both the global and local levels. Global interpretations refer to a model’s extractions explaining the general relationships it learned, such as the patterns associated with a predicted response. On the other hand, local interpretations focus on explaining specific predictions given by a model, such as the attributes and interactions that drove the particular prediction [
36].
Table 12 summarises all the classification models produced by the three final datasets and the combinations of the three AC algorithms with the six class distributions of
Table 5. The last column displays the average number of CARs contained in the models, calculated by the ten classifiers generated for each model during the 10-fold cross-validation method. CPAR is observed to create significantly smaller classifiers than the other two algorithms, with CBA2 models being, on average, ten times bigger. Additionally, differences are noticed between the models of the same dataset and algorithm but of different class distributions.
The AC classifiers use their CARs to predict an unseen data instance following their algorithm classification method. The rule, or rules, used for determining the class of a data instance also reveals the reasoning for this classification, i.e., the local explanations. Global explanations can be extracted by examining the high-order ranked rules of a classifier and summarising their attribute correlations most often seen.
Rule ranking is a pre-processing phase in AC mining that sorts the generated rules based on specific criteria, which can be different per AC algorithm, and is later used in prediction [
37]. CBA and CBA2 rank their classification rules based on their confidence, support, and antecedent length (shortest). In contrast, CPAR ranks its rules on the grounds of their expected accuracy, i.e., the probability that a test case satisfying the rule’s body belongs to its class [
33]. Thus, in any case, the highest-ordered CARs of a classifier have the strongest prediction power, revealing the most dominant attribute correlations with each class.
Aiming to exhibit and explain the interpretability aspect of the classifiers generated in this research study, we select one from each final dataset and different AC algorithm that accomplishes high recall yields and, in the following tables, we present the first high-ranked classification rules, thereby disclosing the most prevailing feature patterns of compliance and non-compliance as regards the violation they are targeting.
In particular,
Table 13 illustrates the feature interactions associated with undeclared work and those with compliance, as identified by the UDW-CBA-FD_RUS classifier (No. 5,
Table 12), which is built from the UDW dataset, using the CBA algorithm and applying RUS to training data to address the class imbalance. As per the recall and F
5 metric (
Table 9), this is the most efficient classifier in undeclared work prediction revealing more than 70% of the actual cases. As previously explained, an inspection case from the testing set is classified as risky or non-risky (YES/NO) based on a prediction mechanism using the generated CARs; thus, one or more of these rules contributes to defining the most suitable class for the given test case body. This rule practically offers also the local interpretation for the given prediction. For instance, the second rule of
Table 13 explains that if a complaint is filed for a company of the HORECA business sector making rare changes in the employees’ working schedule and using low employment, then an onsite inspection shall most probably reveal undeclared work. On the other hand, the first rule says that if a scheduled audit is performed in a large-sized company in the sales sector with full-time employees, it will most likely find the employer labour law compliant.
Global interpretations may be derived for risky and non-risky businesses by examining the components of each group of rules predicting these two classes. In
Table 13, the most dominant features are identified in bold, revealing that if at least three of these coexist, then there is a strong indication of undeclared work: filed complaint, performing an evening or night inspection, to a company of the HORECA sector, established in central Athens, using low employment, paying low wages, and making rare changes in the working schedule.
Non-risky businesses are recognised when combining three or more characteristics: scheduled inspection, to a sales business, of legal form corporation, of large or very large size, with full-time employees, making medium or often or very often changes in the working schedule.
Table 14 presents the ten top-ranked rules linked with underdeclared work and the corresponding ten high-ordered rules associated with compliance, generated by the UNDER_DW-CBA2-FD_COR classifier (No. 26,
Table 12), which is built from the UNDER_DW dataset, using the CBA2 algorithm and COR implementation in training data. As per
Table 10, this model is among the most successful ones in identifying underdeclared work. Here, from the extracted global interpretations, one may notice differences in the dominating features associated with this type of violation compared with those of undeclared work. For instance, underdeclared work is significantly revealed through scheduled inspections, whereas, as regards undeclared work prediction, this attribute was mainly linked with compliant businesses, as per the UDW classifier (
Table 13). Additionally, underdeclared work is discovered primarily in companies that were never inspected before (NO_PAST_INSP). In contrast, businesses that were checked and found compliant with labour law (NO_PAST_INFR) will probably be found compliant again. These characteristics, though, did not appear in the rules of undeclared work prediction.
These differences in the global interpretations extracted as regards the detecting, on the one, undeclared work and, on the other, underdeclared work, clearly show the effectiveness of the approach to create different final datasets per targeted violation. Not only did the prediction performance improve significantly, as previously explained, but the derived knowledge is now more precise for each targeted violation, as seen here.
Last,
Table 15 illustrates the mined knowledge when targeting both undeclared and underdeclared work, coming from the first high-ranked rules for both classes of the UDW-or-UNDER_DW-CPAR-FD_COR classification model (No. 50,
Table 12), generated by the UDW-or-UNDER_DW dataset, employing the CPAR method and applying COR in training data. According to the recall metric of
Table 11, among the CPAR classifiers generated by this dataset, this model achieves the highest performance, reaching to more than 70%. In this set of rules, one may notice that the dominating feature patterns have different compositions, comprising combinations of characteristics prevailing in the previous two groups of global interpretations.
4. Discussion
In this research study, we discuss the impact of undeclared work on society and the economy and the problems the enforcement authorities face in addressing it. We investigate the business needs and available data sources of a labour inspectorate, a public institution responsible for dealing with this employers’ illegal practice, and put forward the necessity for applying innovative machine learning methods towards improving its effectiveness in this direction. We use a large block of actual past inspection data and focus on the class imbalance and class overlap issues that naturally exist in such domain datasets, obstructing the machine learning process.
To overcome these issues, we propose and apply combinations of data engineering techniques. Initially, we use data reduction based on the decision makers’ selections of the target group of violations. With the aim of testing, evaluation, and demonstration, we create three different final datasets per the inspectorate’s priorities for deterring infringements; one solely for undeclared work, one for underdeclared work, and one for both of these severe violations. Then we implement the class overlap removal (COR) method, which deletes from the training data the negatives that fall on positives, either isolated or in combination with random oversampling (ROS) or random undersampling (RUS) that handle class imbalance in the datasets. Hence, we create six diverse training data class distributions per final dataset, which are then compounded with three different AC algorithms, the CBA, CBA2, and CPAR, to build multiple classifiers, which are subsequently evaluated in detecting the targeted violations.
Based on considerations regarding the costs of positive and negative misclassifications for the inspectorate, we focus on the recall assessment metric to identify the most effective classifier per targeted violation. We conclude that for undeclared work prediction involving highly imbalanced datasets, using CBA and applying random undersampling suffices to boost the recall from 6% to more than 70% while maintaining accuracy to 70%. When only underdeclared work or both violations are targeted, and less imbalanced datasets are related, removing the class overlapping achieves the highest recall at 76–80% with the same algorithm. CPAR is also introduced in this study, displaying less sensitivity in class imbalance and class overlap in this application domain, achieving good results in all final datasets, even without data engineering applications to training sets.
Overall, this machine learning application illustrates the outputs of fifty-four classification models derived by the combinations of the AC algorithms, the final datasets, and the data engineering techniques, enabling the comprehension of the strengths and weaknesses of each approach and the identification of the most suitable model per the needs and resources of the enforcement authority. Indeed, there is no best model for all required tasks of inspection planning and targeting violations; on the contrary, several considerations must always be taken into account, such as the available time and number of inspections that can be performed to achieve a specific goal.
For instance, the models that attain increased recall fall short on precision and specificity, i.e., they would trigger several inspections that would finally conclude with no violations (false positives). These models are appropriate when the inspectorate wishes to detect most of the actual fraudulent businesses, e.g., in a specific area and period and can allocate adequate resources to perform several onsite visits; such are the cases when the HLI runs an action plan targeting undeclared and underdeclared work in tourist places, and a group of inspectors visits an area for this purpose.
On the other hand, on occasions when limited resources and time are available and high inspection yields are sought, the experts should choose a model with increased precision that initiate few onsite visits yet their success rate is high, such as the CBA2-FD for targeting underdeclared work, reaching violation prediction success at 70% and specificity at 92%.
The present research paper is of significant value in this application domain, not only because of the detailed demonstration of the classifiers’ prediction performance and methods for improvement, as previously discussed, but also due to presenting knowledge extraction, which is valuable to the domain users.
In particular, we follow different approaches to enhance the interpretability of the outcomes; we use qualitative features that take comprehensible (by the domain users) values; we employ associative classification algorithms that produce simple and understandable rules of the if-then form; also, we create different final datasets per targeted group of violations to build classifiers devoted to these violations and derive focused knowledge related to them.
Thereby, the domain users’ benefit in enhanced knowledge is two-fold. First, they obtain understandable explanations (local interpretations) for each inspection case or business classified as risky or non-risky as per a particular classifier, e.g., a UDW classifier. Hence, they can perceive the reasoning and estimate the fairness of a model’s suggestion and be involved in the decision-making process of inspection planning; thus, their trust and acceptance in the models’ outputs are increased. Secondly, they gain insights into the predominant trends and attribute patterns associated with the targeted violations. Indeed, in this application, we showed that the global interpretations derived by the classifiers targeting undeclared work display some differences from those of underdeclared work, proving that the proposed approaches can unveil attribute associations with each type of infringement that would remain hidden otherwise.
5. Conclusions
In the previous section, we summarised the outcomes related to the predictability and interpretability aspects of the classification models produced through the methodology we introduced in this study, and we concluded with the substantial improvements they offer both in the area of inspection planning and also in the domain knowledge provision. However, an even more crucial aspect one needs to examine when integrating such innovative machine learning techniques into the routine processes of a public enforcement authority, such as the labour inspectorate, is the adaptability and the level of user acceptance. Several innovative systems introduced into public institutions ended up being of very limited use or abandoned mainly due to several adaptation complications in their working environment or poor user acceptance.
The proposed methods in the current study can be easily adapted in the working environment of an enforcement authority accountable to address undeclared work and other severe labour law violations.
Figure 4 illustrates a machine learning system with the characteristics we described so far being integrated into the business cycle of a labour inspectorate, e.g., the HLI. It may be configured to periodically draw and incorporate data from databases containing past inspections and other relevant information, such as employment and company characteristics, and create or update datasets per the users’ needs or the authority’s targets, as we presented for the HLI. Through a simple user interface, the managers can make selections on the data areas and attributes to be included in the datasets, thus building distinct classifiers per targeted violation, business sector, region, etc. Following this, they can test and evaluate the models while including, if necessary, techniques to face class imbalance and class overlap, and finally select the most appropriate classifiers on each occasion while considering the available resources and other inspection planning details.
No particular ICT or machine learning knowledge shall be necessary for the users to build different models per their needs in such a configurable system. The labour inspection managers are, thus, encouraged to actively engage in goal setting and inspection scheduling while exploiting the benefits of an innovative machine learning tool. Additionally, once the most successful classifiers are identified per the authority’s goals and managers’ needs and put to productive use, no manual feedback collection is necessary from the local labour inspectors regarding their findings to update the models. This task can be a system process scheduled to run periodically, automatically updating the classification models by integrating the new inspection data or other related details inserted into the databases, as depicted in
Figure 4.
Concluding, an inspection recommendation system integrating interpretable machine learning techniques and the proposed approaches for class imbalance and class overlap may well adapt to the business environment of a labour inspectorate and be effortlessly accepted by the domain users, offering multiple benefits and solving all the deficiencies arising from a risk analysis tool manually configurable based on users’ perceptions and experiences.
Our future research shall focus on designing an advanced integrated recommendation system that is flexible and adaptable to a labour inspectorate’s changing goals and needs, needing to apply targeted preventative and deterrence measures to address severe labour law violations. Explorations on other machine learning techniques concentrating on achieving improved prediction performance and explainability of outputs at local and global levels shall also be included. Last, efforts shall be made to incorporate a scheduling module for targeted inspections per specific violations, areas, or business sectors, yet also considering other characteristics, such as the probability score of each classification and the cost of each suggested inspection based on local resources and attributes.


